
Abstract
Emerging mobility technologies, like ride-hailing, are underrepresented in travel behavior surveys. Consequently, travel demand modelers have often resorted to simplistic solo-traveler assumptions or relied on aggregate trip size factors within activity- and agent-based models. To address this gap and help modelers understand ride-hail party size, this study analyzed data collected from a 2021 to 2022 household travel survey in the greater Twin Cities (Minneapolis–St. Paul, MN) region. Ride-hail trips were paired with person-, household-, and trip-level attributes to provide context for both single-party and multiparty ride-hailing. Binary logistic regression models indicated that shared micromobility users, households with more children, renters in large multifamily buildings, and individuals with at most a high school education were significantly more likely to use ride-hailing for group travel than for solo trips. A hurdle regression for party size count revealed that lower-income households, while less likely to use ride-hailing, were more likely to opt for group travel and form larger parties than other income cohorts. These findings offer insights into who takes ride-hailing for group travel, enabling policy makers to devise strategies targeting solo, unshared ride-hailing without negatively affecting large groups.
Keywords
Ride-hailing services like Uber and Lyft offer convenient door-to-door mobility services that can greatly increase accessibility for many, especially those with few transportation alternatives. In addition to accessibility benefits, extant literature asserts that ride-hailing can reduce parking demand and eventually car ownership and, by extension, mode shifts to shared or active transportation modes ( 1 – 3 ). On the other hand, these services can increase congestion in dense urban centers and draw travelers away from public transit and active transportation modes ( 1 , 3–5). Pooling is seen as a potential solution to reduce ride-hailing’s externalities by reducing total vehicle-miles traveled ( 6 ). In addition, ride-hailing companies can use pooling to better match demand and supply, allowing travelers to save money and drivers to serve more passengers ( 7 ). However, pooling faces challenges such as driver dissatisfaction ( 8 ) and low adoption rates ( 9 ). Most pooled trips involve only two passengers ( 10 , 11 ), suggesting marginal benefits.
The COVID-19 pandemic disrupted all ride-hailing services, leading several ride-hailing companies to adjust or eliminate pooled services ( 7 ). UberX Share, formerly known as UberPool, limits shared rides to two co-riders, and whereas Lyft reintroduced Shared rides in 2022 (with the same party size rules), the company discontinued Shared services in 2023. It remains uncertain whether Uber’s changes will lead to higher sharing rates (and thus systemwide pooling benefits), raising questions about whether researchers and policy makers should focus on “group” ride-hailing instead of “pooled” ride-hailing. Understanding why people share rides or travel in groups is key to crafting policies that disincentivize solo ride-hailing without affecting pooled or group travel.
Unfortunately, gaining insights into the characteristics of ride-hail users has been challenging, as mobility companies either do not collect this information or are reluctant to share passenger information owing to privacy concerns or regulatory constraints. This is especially true if companies are compelled to release masked person-trip records. As a result, several ride-hailing analyses have relied on large, publicly available ride-hailing datasets, drawing inferences from zonal-level socioeconomic and built environment determinants at the trip’s origin and destination or using only trip characteristics like in-vehicle travel time and fare ( 12 – 22 ). A handful of studies recruited a small sample of ride-hail passengers at known pick-up and drop-off hotspots ( 2 , 23 ) or by direct recruitment during a ride-hail trip ( 4 , 24 , 25 ). Researchers have also analyzed regional ( 26 , 27 ) and national household travel survey data ( 28 , 29 ) to characterize ride-hailing adoption and frequency. Others have used web-based surveys to collect stated preference ( 10 ), revealed preference ( 27 , 30–32), or joint revealed preference–stated preference data on ride-hailing use ( 9 , 33–35).
Research has largely focused on the pooling versus nonpooled distinction, and the nonpooled option has sometimes been confused or erroneously categorized as a solo trip. Alonso-González et al. write that “on-demand requests can be categorized as individual or pooled, depending on whether the user is willing to share her ride with other passengers for a cheaper fare” ( 10 ). Morris et al. write that “aggregate drivers are considerably less satisfied with providing shared trips compared to solo trips with services such as UberX and Lyft Classic” ( 8 ). The purpose of these quotes is not to criticize any one author but to inform transportation academic research of this distinction and to motivate research to study the underexplored area of group ride-hailing and not just pooled ride-hailing.
This study leverages a recent household travel survey in the greater Twin Cities (Minneapolis–St. Paul, MN) region, linking ride-hailing trip data with individual and household information. It aims to (1) distinguish the characteristics of ride-hail passengers opting for solo versus group trips, and (2) assess the determinants influencing ride-hail party size. By modeling who is most likely to use ride-hailing for group trips, this research provides valuable insights for mobility providers, policy makers, and researchers to promote more efficient “public” transportation. It additionally clarifies the concept of ride-hail trip party, aiding travel demand modelers in refining their estimates of ride-hailing average vehicle occupancies.
Literature Review
This section summarizes key socioeconomic-, mobility-, land-use-, and trip determinants affecting ride-hailing demand for standard and pooled services, forming the basis for testing their significance in this study’s regression models. Readers interested in comprehensive review articles on ride-hailing determinants and their effects on the transportation system can consult Si et al. ( 36 ) and Tirachini ( 3 ), respectively.
Key Socioeconomic Factors
Ride-hail users generally have higher incomes than nonusers and often use this mode to complement their existing transportation options ( 18 , 19 , 26 , 37 ). Higher-income neighborhoods generally exhibit higher demand for ride-hail trips ( 13 , 18 ) but lower proportions of pooled trips ( 13 , 15 , 38 ). However, studies observed that the income effect depends on the day of the week in Austin, TX ( 19 ) and Chicago, IL ( 21 ). Wealthier areas were associated with higher ride-hail trip demand on weekdays but not during weekends.
Lower-income households are more likely to choose pooled services as a cost-saving measure when taking this travel mode ( 9 ). Furthermore, socially disadvantaged neighborhoods are associated with higher demand for pooled ride-hailing and lower demand for other ride-hailing services ( 20 ). However, low- to middle-income households with children are less likely to use ride-hailing services relative to wealthier families with or without children, suggesting a nuanced income–family effect on demand for new mobility options ( 26 ). In addition, households with elderly adults and households with children and elderly adults, both suggestive of caregiving responsibilities, had lower adoption and use than other household types ( 29 ).
College-educated individuals are more likely than other travelers to use ride-hailing ( 2 , 25–27, 32 , 35 ), although findings on education’s impact on pooling vary. Whereas Kang et al. found that highly educated passengers were more likely to select ride-pooling ( 33 ), others identified a higher proportion of non-college-educated passengers in pooled trips than with standard trips ( 25 ). Further, Dean and Kockelman found that pick-up zones where the residents were highly educated had a smaller proportion of shared trips ( 13 ).
In general, standard ride-hailing services ( 2 , 21 , 27 , 32 , 35 , 38 , 39 ) and pooled ride-hailing ( 13 , 33 , 37 , 38 ) attract younger passengers. Self-identified White passengers are more likely to frequently use ride-hailing, relative to other races ( 40 ), but non-Hispanic White individuals are less likely to share the ride ( 25 ), perhaps because of a higher disutility of sharing rides because of privacy concerns ( 37 ). Areas with higher non-White populations have a higher rate of requesting pooled rides ( 13 , 20 ), similar to person-level data studies ( 25 , 33 ). Larger household sizes, the presence of children, and the presence of elderly individuals in a household tend to reduce the likelihood of using ride-hailing services ( 29 ). Pick-up census tracts with larger average household sizes are associated with higher proportions of pooled trips ( 13 ) and a lower overall demand for ride-hail ( 39 ).
Key Mobility Factors
Experience with shared modes is associated with the use of ride-sharing. Members of carshare and bikeshare services, as well as regular public transit users, are more likely to opt for ride-hail trips than the general public ( 29 ) and take pooling for non-home-based trips ( 25 ). Moreover, households with limited or no access to personal vehicles ( 18 , 25 , 27 ) and those substituting walking, bicycling, or public transit with pooled ride-hailing also favor this mode ( 25 ). Lower-income households also tend to substitute transit for ride-hailing when the costs are comparable ( 24 ). This substitute trend intensifies when service quality declines, transit options are scarce or unavailable, or when the total trip costs less than $20 (in 2017 dollars) ( 24 ).
On average, ride-hail users reside in urban areas ( 18 , 26 , 32 ), characterized by lower vehicle ownership and greater availability of alternative transportation options ( 24 ). For instance, a sample of Greater Boston area ride-hail users reported memberships in bikeshare (3%) and carshare (11%) programs, ownership of personal bikes (23%), possession of weekly or monthly public transit passes (23%), and private vehicle ownership (45%) ( 24 ). California residents who use public transit weekly were also more likely to use ride-hailing weekly compared with less frequent transit users ( 9 ), a trend consistent with findings from the 2017 U.S. National Household Travel Survey ( 29 ). Aggregate area-level analyses reinforce these individual-level associations, indicating higher ride-hail demand in census tracts with a greater percentage of workers carpooling or using public transit for commuting ( 18 ). Although ride-hailing demand is associated with urban areas where public transit is available ( 20 ), the type of transit vehicle and station density exert a significant and varied impact on demand. For instance, census tracts with three or more rail stations generate significantly fewer ride-hail trips compared with tracts with zero or one station ( 18 ).
Individuals frequently using various transportation-related apps on their smartphones for mode, destination, and route choices are more likely to use ride-hail services than the general population ( 27 ). Although the relationship between ride-hailing and public transit (e.g., substitutive, complementary, and/or supplementary) remains a topic of debate ( 41 ), some evidence suggests that ride-hailing may reduce vehicle ownership ( 30 , 42 ) and average annual mileage ( 32 ). However, high rates of deadheading (i.e., the distance a vehicle travels between revenue-generating trips without a passenger in the vehicle) and low average vehicle occupancy counteract any benefits, resulting in increased net vehicle-miles traveled and energy consumption ( 4 , 5 ).
Land-Use Factors
On average, ride-hail demand tends to be higher in census tracts characterized by several factors. These include higher population and employment density ( 18 , 38 , 39 ), greater land-use diversity ( 18 , 21 ), a higher number of apartments ( 21 ), and a scarcity of parking spots ( 18 ). Areas with a higher concentration of retail employment, bars, and restaurants—attractions that often result in out-of-home trips—are associated with increased demand for ride-hailing services (18–20, 22 ). Parks, serving as venues for recreational activities, tend to attract more ride-hailing trips on weekends compared with weekdays ( 19 ). Research additionally indicates that areas with greater road network density and more complete sidewalks, even after adjusting for factors like population density and transit accessibility, exhibit higher demand for ride-hailing ( 39 ). Geographically weighted Poisson regression analyses have further revealed nuanced spatial patterns, with sidewalk completeness exerting a stronger positive influence on demand in urban centers, whereas road network density plays a significant role in suburban areas ( 39 ). Finally, research by Malik et al. suggests that the aversion to ride-pooling in suburban areas, compared with urban areas, loses significance when individuals’ attitudes are considered (e.g., pro-urban, tech-savvy, car dependency, pro-multitasking) ( 40 ). Their work suggests that prior studies may have misidentified the impact of land-use features on pooling adoption.
Key Trip Factors
Pooled ride-hailing trips are most common on weekday afternoons and weekends. However, the proportion of pooled trips is lower on weekends owing to a steep increase in standard ride-hailing service demand ( 13 , 15 , 25 , 39 ). Young individuals are also more likely than other age groups to use ride-hailing at night to avoid driving while impaired ( 37 ).
Successfully pooled trips can increase in-vehicle travel times for riders ( 43 ). In stated preference surveys, when respondents were told to assume their activities had strict start times, respondents were significantly more likely to select direct solo rides over pooled trips ( 9 ). Further, respondents have a greater disutility when sharing rides with strangers because of an increase in their in-vehicle travel time ( 10 ). If travelers experience high variability in detour delays, they are less likely to choose pooled ride-hailing in subsequent trips ( 11 ). However, pooled rides may be more favorable to alternative modes, such as public transit, when transfers are required involving long wait times or walking stages ( 43 ). Most ride-hail trips are just a few miles in length ( 13 ) and since trip length positively influences total trip cost, the ratio of sharing increases with trip distance ( 13 , 15 ). Higher fares, after accounting for trip distance and duration cost components, reduce the proportion of riders taking a pooled ride, which may hurt lower-income passengers the most ( 13 ).
Also, ride-hail trips are associated with temperate days with little precipitation ( 18 ). Among lower-income individuals, who may not have access to a car, bad weather becomes a motivating factor in taking this mode ( 25 ).
More frequent ride-hail users (i.e., three or more trips per week) are more likely to use ride-hailing for essential trips ( 9 ), as are students and those with lower vehicle availability ( 37 ). Although vehicle ownership is, on average, associated with a lower propensity for taking pooled rides ( 18 , 25 , 27 ), Boston ride-hail travelers coming from households with more vehicles have higher odds of choosing pooled services for out-of-home trips ( 25 ). Studies employing psychosocial factors found that whereas privacy sensitivity was the strongest deterrent for pooling, travelers hold a smaller disutility toward strangers when commuting with ride-hailing than when traveling for a leisure activity ( 34 ).
Party Size
To the best of the author’s knowledge, only two studies have explored “party size” of nonpooled ride-hail trips. Tirachini and del Río conducted intercept surveys of 1,529 adults in the Santiago, Chile metro area in late 2017 ( 23 ). They asked respondents to recall how many people usually travel with them when using ride-hailing. According to their research study, 40% of trips involved a single passenger, 35% had two, 17% had three, and 7% had four or more passengers. Using generalized ordinal logistic regression, they found that leisure trips had a statistically significant positive effect on total party size per ride-hailing trip. They additionally noted that individuals from higher-income households were less likely to travel with companions compared with those from lower-income brackets.
In another study, Lavieri and Bhat conducted a web-based survey of commuters (n = 1,607) in the Dallas–Fort Worth Metroplex in late 2017 ( 37 ). Respondents provided details about their last ride-hailing trip, including party size. However, the model did not differentiate between riders traveling with acquaintances or strangers (i.e., group ride versus pooled ride, as defined in this paper), nor did it distinguish whether individuals traveling alone did so having chosen a private vehicle or were not matched with a stranger when requesting a pooled trip. Using a generalized heterogeneous data model, they identified several variables positively influencing the likelihood of traveling with a companion: middle-aged individuals, part-time employees, individuals from middle-income households ($50,000 to 99,999), and those traveling for recreational activities. Conversely, factors associated with a higher likelihood of traveling alone during their last trip included non-Hispanic White individuals, graduate-level degree holders, individuals living alone, using ride-hailing for errands or work trips, and traveling during the morning hours (6:00 to 10:59 a.m.).
Despite sampling respondents from different regions, both studies found a positive association between group (or pooled) ride-hailing and leisure or recreational trips. The studies asked respondents to recall their typical or last ride-hail trip, which may have introduced sampling and recollection bias. Moreover, the second study’s lack of differentiation between pooled and group trips complicates isolating the factors affecting party size in group ride-hailing trips.
Gap and Contributions
Although existing literature provides valuable insights into who uses ride-hailing services and their mode substitution behaviors, there is a notable knowledge gap about the influence of ride-hail party size. Policy makers (e.g., California’s Clean Miles Standard [ 44 ], City of Chicago’s ride-hailing congestion fees [ 45 ]) and researchers ( 3 ) emphasize the necessity of increasing ride-hailing vehicle occupancy rates for long-term sustainability. However, recent industry shifts have reduced pooling options. This study therefore makes two significant contributions: first, it identifies the demographics of individuals using ride-hailing for solo versus group travel, aiding targeted policy interventions to reduce solo trips without adversely affecting group travelers. Second, it provides an equation for estimating ride-hail party size, a crucial tool for refining vehicle occupancies in activity- and agent-based models, which traditionally assume solo travel for taxi or ride-hail trips. This research enhances the accuracy of various performance indicators for travel demand modelers.
Data and Methods
Case Study Context
The Metropolitan Council serves as the metropolitan planning organization (MPO) for the seven-county Twin Cities (Minneapolis–St. Paul, MN) area, along with the nine neighboring ring counties in Minnesota, and three border counties in Wisconsin. The Travel Behavior Inventory (TBI) household survey is a biennial program characterized by a 12-month data collection process, involving a randomized sample size of 7,500 households. Smartphone users participating in the survey used RSG’s smartphone app, RMove™, to provide a comprehensive 7-day travel diary. For those who were unable or unwilling to use the app, an alternative option was available, allowing them to complete a 1-day travel diary using the study’s website or a toll-free hotline ( 46 ). The 2021 to 2022 TBI, conducted from May 22, 2021, to February 5, 2022, yielded a total of 8,212 complete surveys, with 7,336 originating from randomly selected residential addresses and 877 supplementary responses from community-based organizations. Although ride-hail companies, like Uber, accept ride requests without a smartphone app by dialing a toll-free number, any analysis of ride-hail trips should consider the potential exclusion of individuals lacking a smartphone or reliable cellular service.
Ride-Hailing Trip Data
The dataset includes 845 ride-hail trips, detailing service type (regular [UberX, UberXL, Lyft, LyftXL], premium [UberBlack, Lyft Lux], pooled [UberPool, Lyft Shared]), total trip cost (inclusive of tip, rounded to the nearest dollar), number of people in the trip, who paid for the trip (self, employer, split/shared, fully paid by someone else), number of household and nonhousehold members on the trip, origin and destination counties, imputed duration, distance, start/end time, day of the week, origin and destination activity categories, and person IDs. The public dataset masks the exact origin and destination locations (aggregated at the census block group level for the MPO) by furnishing the locations at the county level, which does not allow modelers to map origin or destination locations to commonly used attributes like population or job density. Person-level attributes include gender, age, disability status, race/ethnicity, educational attainment or student status, employment status, school or work locations, as well as shared mobility use and frequency. Household-level attributes include the number of adults and children, count of vehicles and bicycles, personal micromobility devices, annual income, residence type, ownership status, and residence county. The trips are categorized into solo and group, allowing for exploratory analysis of significant differences in socioeconomic features, mobility options, and trip characteristics. Of the 845 ride-hail trips, 473 (56%) were single-party (“solo”) rides, whereas 372 (44%) were multiparty trips.
Modeling Party Size
Given that ride-hailing services set limits on party size per requested vehicle, the choice between solo and group travel is a key decision—a choice made before selecting this mode. Therefore, it was reasonable to initially estimate a binary logistic regression model to predict whether a trip will be taken individually or as part of a group. Further, this could allow researchers and policy makers to appreciate the determinants of group ride-hailing. This model used the complete sample and considered a range of person- and household-level socioeconomic features, mobility options, and trip characteristics to determine whether the trip is solo or group. As travel demand models often feature distinct mode-choice models based on trip purpose, three additional models were estimated: home-based trips to other activity locations, home-based trips to home, and non-home-based trips.
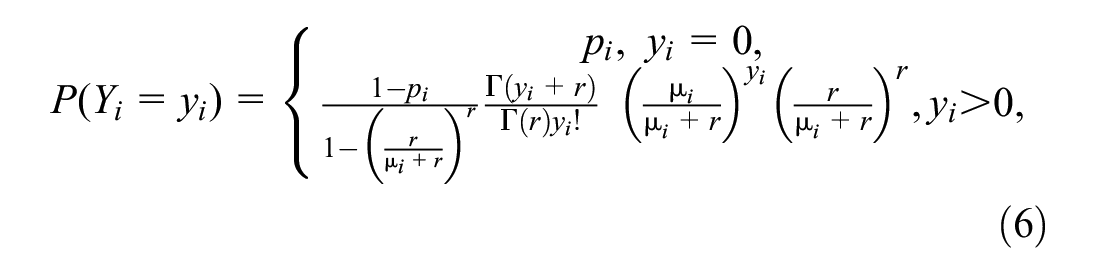
Next, a model was estimated for ride-hailing party size. Party size could be estimated from one occupant up to five occupants (because of dataset truncation), or by considering a hurdle count model to leverage differences between solo and group travel found in the binary logistic regression model. The hurdle model is a two-component mixture model: a binary logistic regression model for determining whether the observation is zero (i.e., solo ride) or not (i.e., a group ride), and a truncated count of occupants beyond the individual requesting the ride (i.e., the account holder). Hurdle models are used in similar transportation contexts with several zero-count responses, such as frequency of using ride-hailing conditional on ride-hailing experience ( 28 ), count of home-based walk trips ( 47 ), and willingness to share rides in a shared autonomous vehicle ( 48 ).
Let

where


where

where the first component is the binary logistic probability equation,

where
where
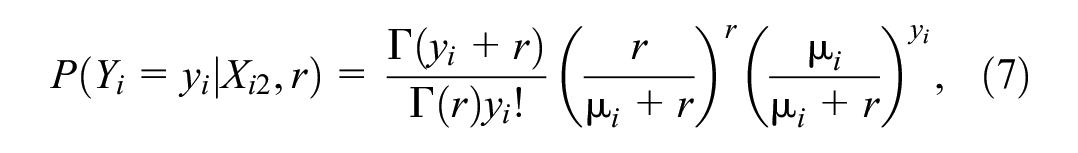
where
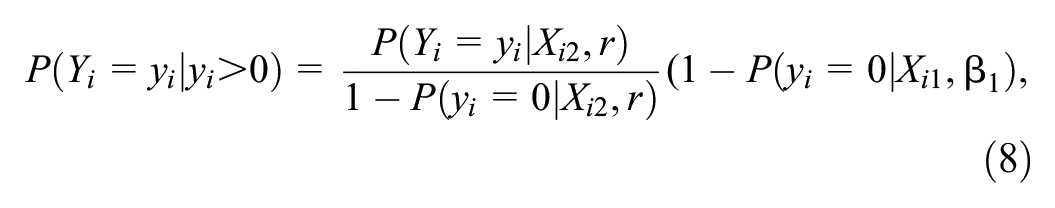
because the sum of probabilities must equal 1. The NB model relaxes the assumption in the Poisson model that the (conditional) variance equals the (conditional) mean. If
A count model of additional occupants was also estimated. The log-likelihood and Akaike information criterion values of the standalone count model and the hurdle model were used to determine whether the hurdle model increased model fit relative to the basic count model. Since the count model estimated the number of additional nonrequesting travelers and the dataset included 56% solo trips, a zero-inflated count model was also considered. Zero-inflated count models include “sampling zeros,” which represent those who do ride in groups but did not do so during the study period ( 49 ). In contrast, hurdle models assume that all zero data are “structural.” In other words, the solo travelers are observed taking zero group trips over the study period because they do not take group trips ( 52 ). Owing to the short data collection period and sample size, the author believed it was best to model ride-hail vehicle occupancy based on observed data with the assumption of structural zeros. The exploratory analysis also shows that those using ride-hail more frequently often traveled alone, suggesting that riders observed taking zero group trips were more likely solo travelers.
Results
Exploratory Analysis
Of the 845 ride-hail trips, 473 (56%) were single-party (“solo”) rides, whereas 372 (44%) were multiparty trips. The average vehicle occupancy of all trip types was 1.71 passengers. This value is slightly conservative since the survey capped data at “5 travelers or more” but is still slightly higher than the national average vehicle occupancy of 1.67 for all vehicle types and times ( 53 ). At face value, this dataset suggests that ride-hailing trips, excluding deadheading trips, may be a more efficient travel mode. There were 289 different households and 350 travelers (as measured by the account holder requesting the ride) in this dataset. The median number of trips taken by a traveler was 2 (average was 2.4).
Table 1 shows distinctions among the sampled ride-hail based on party size (as a binary), considering socioeconomic features, mobility options, and trip characteristics. Overall, ride-hail travelers were predominately female, under 35 years of age, college-educated, non-Hispanic White, employed, renters, in childless households, and had annual incomes under $50,000. Solo ride-hail trips were more likely to be taken by adults aged 55 to 64, individuals from one-person, childless, and zero-vehicle households, residents of multifamily buildings of up to 50 units, renters, and those with monthly housing costs below $1,000. In contrast, travelers in the highest income and housing cost categories were more likely to have used this mode for group travel, with the opposite trend observed for those in the lowest income and housing cost groups. Residents of detached single-family homes and homeowners were also more likely to take group trips.
Descriptive Statistics for Ride-Hail Trips by Single- and Multiparty Trip
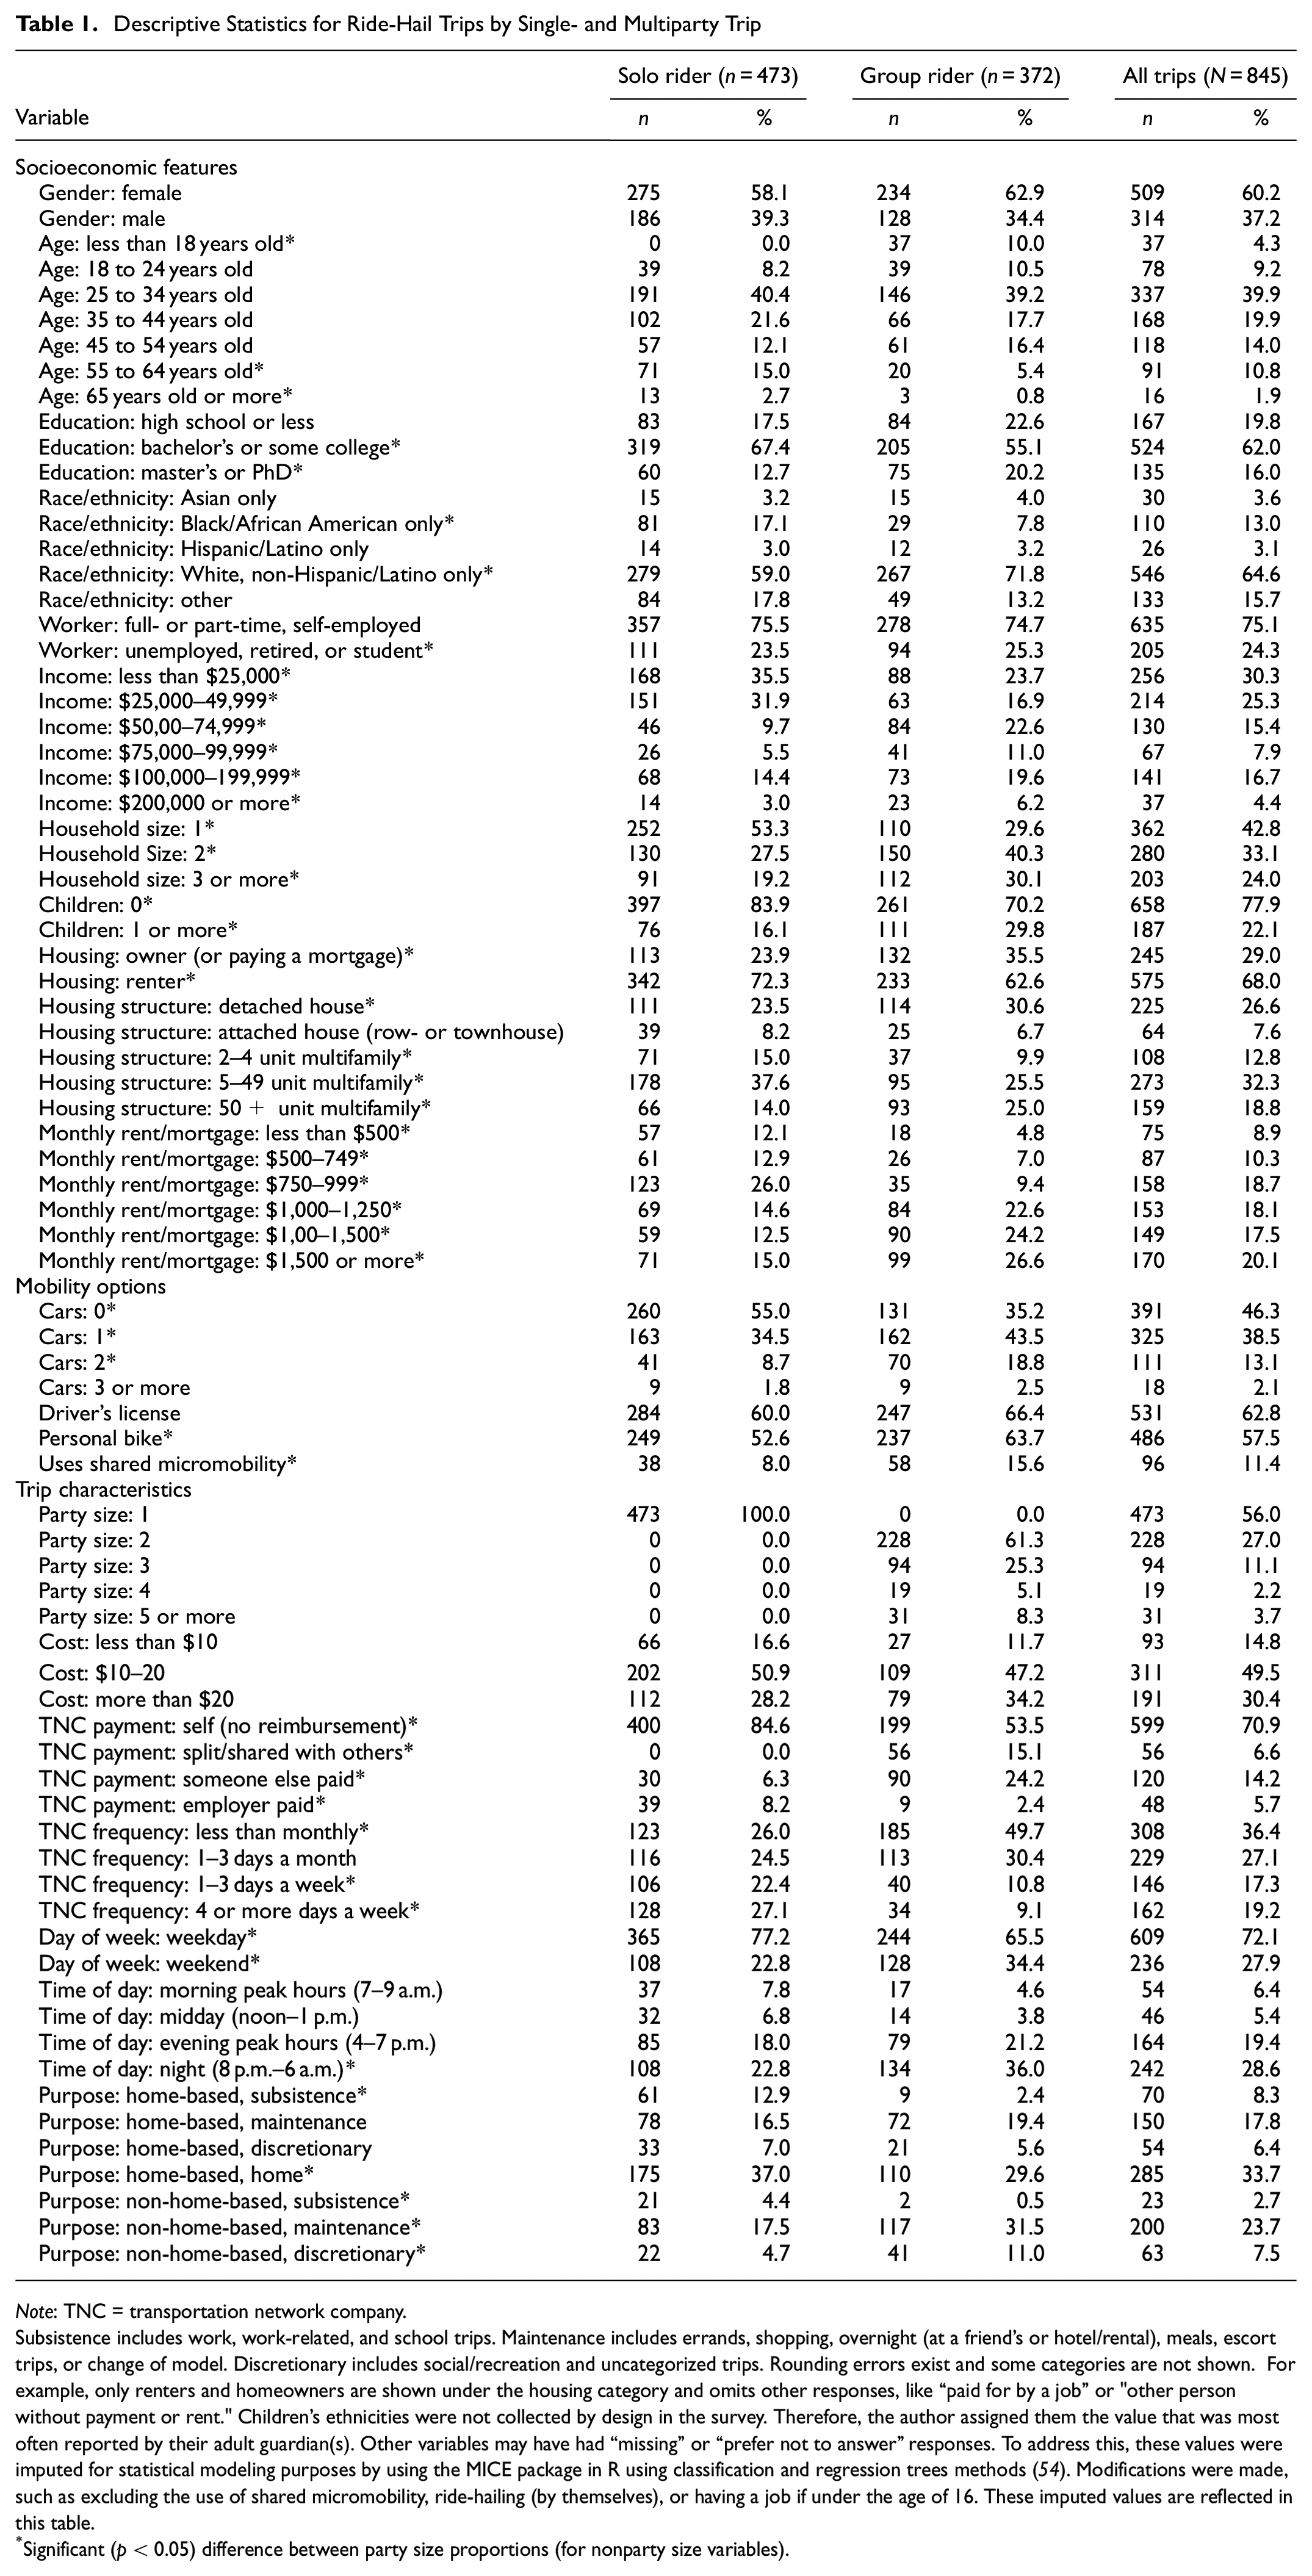
Note: TNC = transportation network company.
Subsistence includes work, work-related, and school trips. Maintenance includes errands, shopping, overnight (at a friend’s or hotel/rental), meals, escort trips, or change of model. Discretionary includes social/recreation and uncategorized trips. Rounding errors exist and some categories are not shown. For example, only renters and homeowners are shown under the housing category and omits other responses, like “paid for by a job” or "other person without payment or rent." Children’s ethnicities were not collected by design in the survey. Therefore, the author assigned them the value that was most often reported by their adult guardian(s). Other variables may have had “missing” or “prefer not to answer” responses. To address this, these values were imputed for statistical modeling purposes by using the MICE package in R using classification and regression trees methods ( 54 ). Modifications were made, such as excluding the use of shared micromobility, ride-hailing (by themselves), or having a job if under the age of 16. These imputed values are reflected in this table.
Significant (p < 0.05) difference between party size proportions (for nonparty size variables).
Significant differences (p < 0.05) were observed between person-level and household-level variables and the proportion of traveling companions from the same household in group trips. Among group trips involving children or seniors (under 18 or 65 and older), 62.5% were exclusively with companions from the same household, compared with 34.3% for group trips of adults aged 18 to 64. Wealthier households had a higher tendency to travel exclusively with household members during group ride-hailing trips (Figure 1). Specifically, 56.1% of group trips by travelers in detached houses and 47.7% by those in owner-occupied homes consisted solely of household members. In contrast, 37.4% of group trips recorded were made by household-only groups, highlighting ride-hailing’s value of door-to-door mobility for these groups. This statistically significant difference extended to renters (32.6%) and childless households (30.3%), but these travelers were less likely to take group rides with only household members.
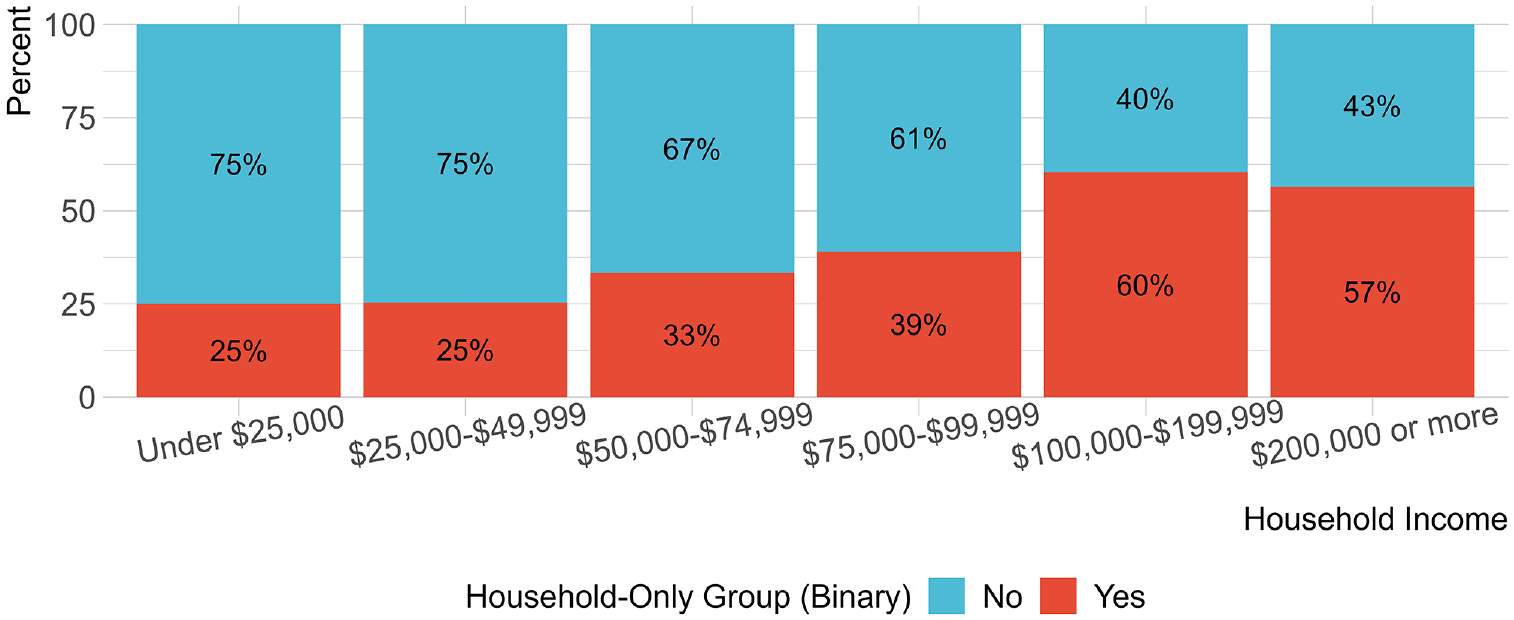
Percent of household-only group trips by household income level.
Approximately 85% of ride-hail travelers lived in zero- or one-vehicle households, with a higher prevalence of zero-vehicle households, and most owned a personal bicycle (57.5%). Notably, those who took group trips tended to own a personal bicycle or to have used shared micromobility options like mopeds, scooters, or bicycles.
Among the 372 multiparty ride-hail trips, most involved two people (61.3%), followed by trips with three passengers (25.3%). Nearly half of these multiparty trips involved mainly household members. Intrahousehold trips made up 37.4% of all multiparty trips, whereas evenly split household and nonhousehold groups accounted for 32.8%. Figure 2 shows the distribution of ride-hail trips by the presence of household members in the traveling party, with parties ordered by total size (from left to right). As party size increased, it became less common to find groups composed entirely of household members. For example, groups composed solely of household members declined from 50% in party sizes of two (blue region) to 18.1% in party sizes of three (green region).
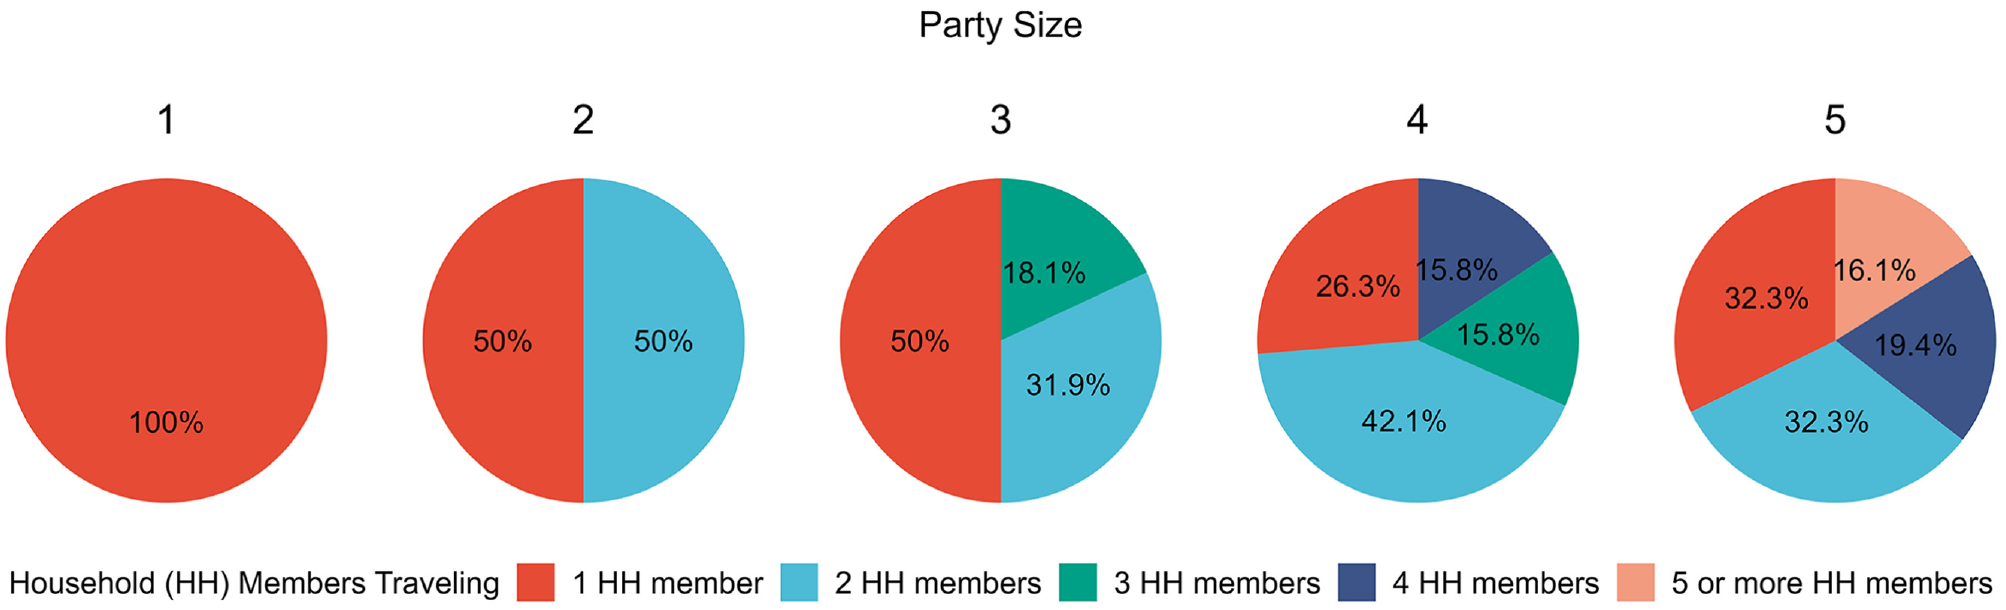
Representation of household members in a group by party size.
Most trips fells within the $10 to $20 total cost range, with a slightly higher proportion of group trips exceeding $20. Notably, 53.5% of respondents taking group trips reported paying for the fare themselves, indicating the presence of exclusively household groups. In cases in which someone else covered the fare, travelers were more inclined to take solo trips.
Frequent ride-hail travelers were more likely to travel alone, whereas less frequent travelers tended to travel in groups. Trips on weekends, during nighttime hours, and on weekend nights were more likely to involve groups.
Home-based work or school trips, as well as trips with home as the destination, were more likely to be solo trips. Conversely, non-home-based nonwork/school trips were more likely to involve groups. Lavieri and Bhat similarly found that individuals traveling for recreational activities were more likely to travel with a companion, whereas those using ride-hailing for errands or work trips were more likely to travel alone ( 37 ).
Binary Logistic Regression
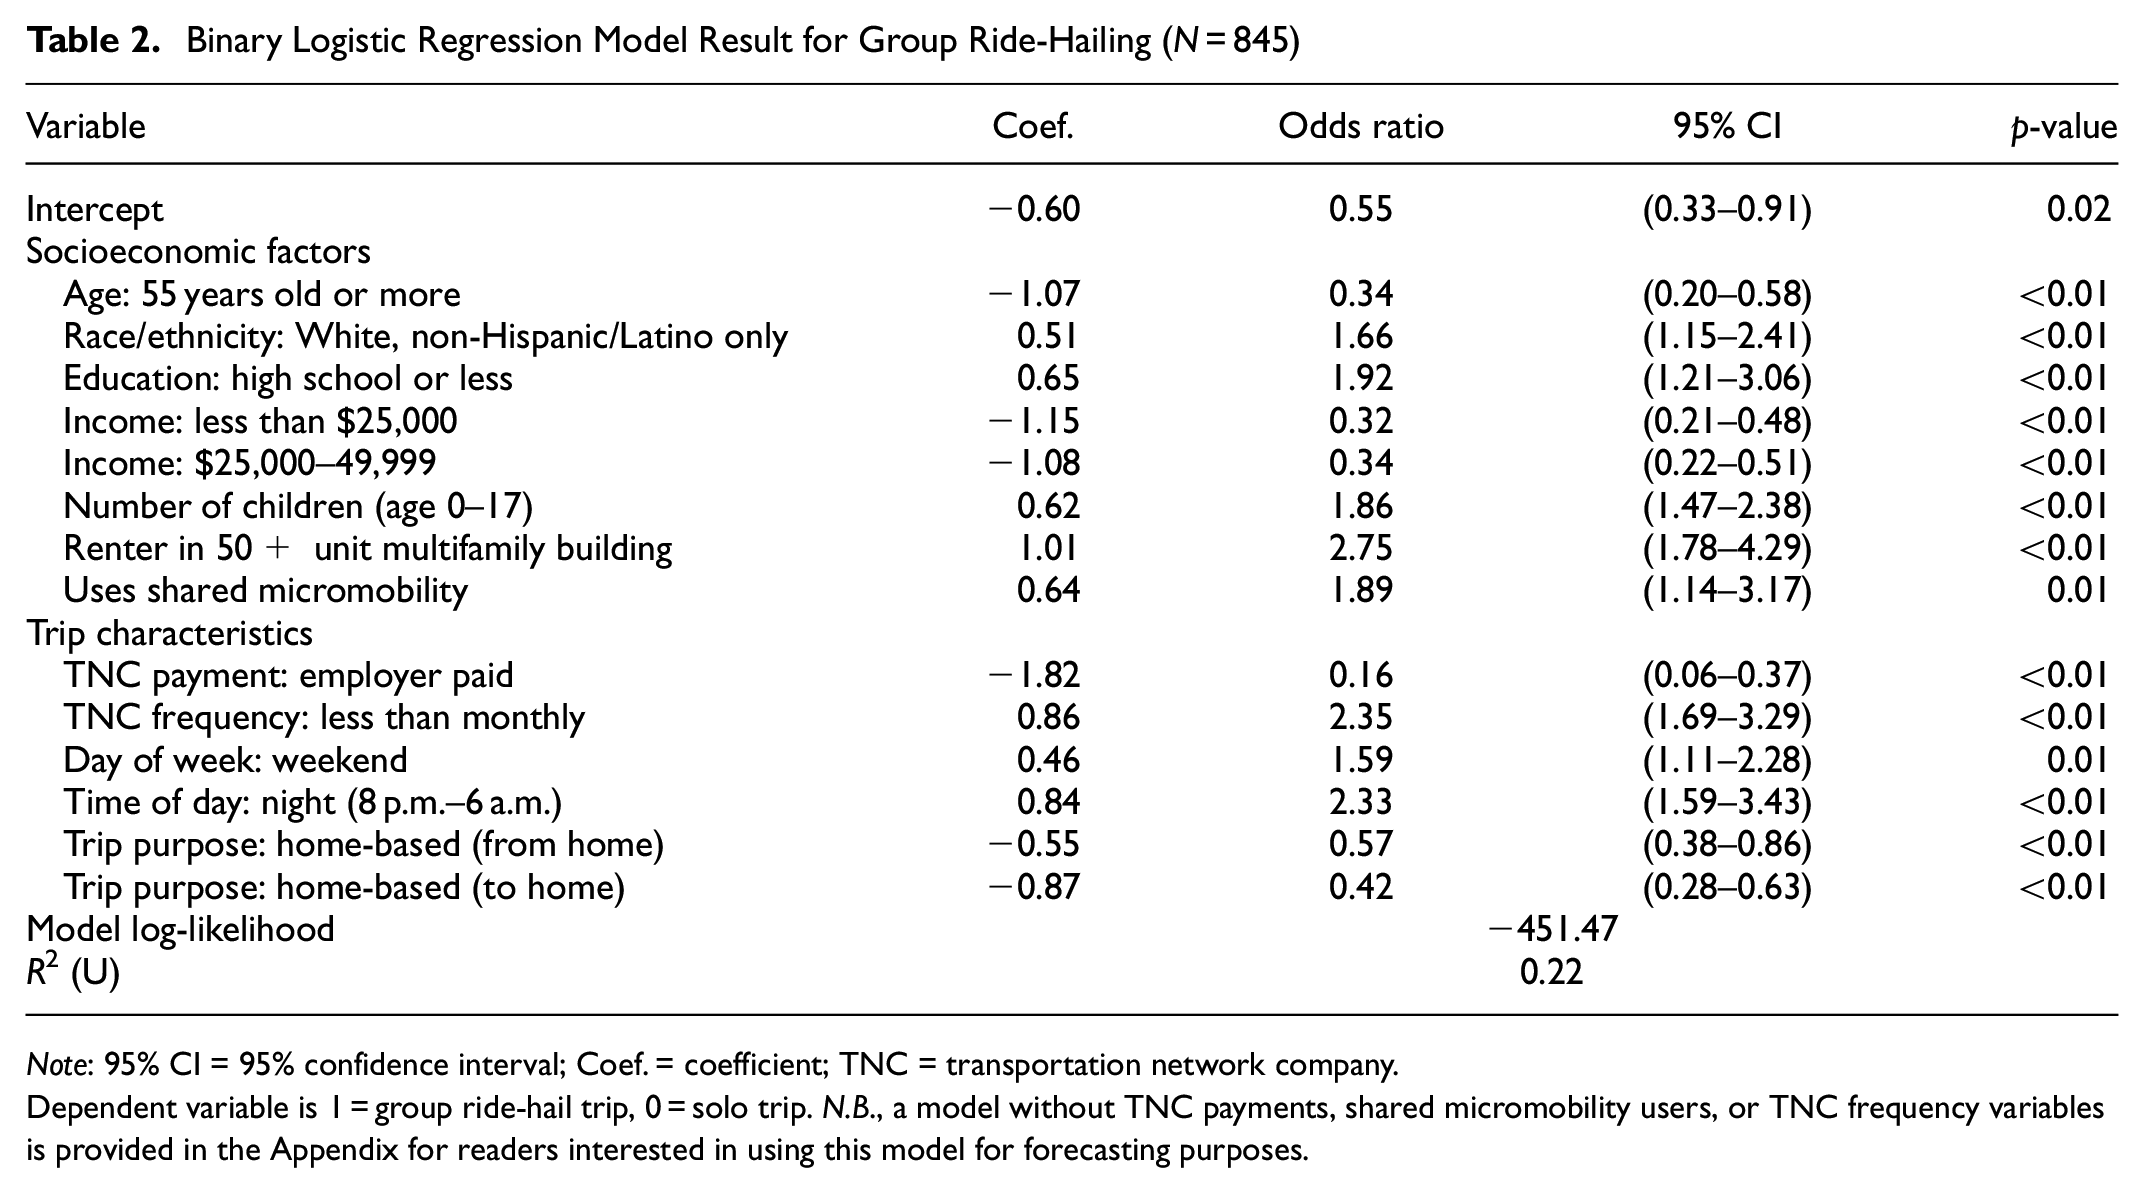
Table 2 displays the estimation results and odds ratios for the binary logistic regression model of group ride-hailing, in which the dependent variable equals 1 for group trips and zero for solo travelers. An odds ratio greater than 1 indicates higher odds of a group ride for every one-unit increase in the independent variable.
Binary Logistic Regression Model Result for Group Ride-Hailing (N = 845)
Note: 95% CI = 95% confidence interval; Coef. = coefficient; TNC = transportation network company.
Dependent variable is 1 = group ride-hail trip, 0 = solo trip. N.B., a model without TNC payments, shared micromobility users, or TNC frequency variables is provided in the Appendix for readers interested in using this model for forecasting purposes.
Households with more children, renters in large multifamily buildings (with 50 or more units), non-Hispanic White individuals, and individuals with at most a high school degree (all other socioeconomic features held constant) were more inclined to use ride-hailing for group travel than solo travel. In contrast, adults aged 55 or older and households earning less than $50,000 annually were more likely to report solo ride-hailing trips. Uber’s 2023 policy change removed age restrictions, allowing families to create accounts for teenagers. Before this change, unaccompanied minors were not permitted on their platform, which may explain the association between group ride-hailing and the number of children in a household. Renters in large multifamily buildings had 2.75 times higher odds of taking a group ride than traveling alone, whereas low-income households (less than $25,000) had a 68% lower likelihood of group rides.
Trip-related predictors showed that individuals taking trips on weekends or at night were more likely to travel in a group (odds ratios of 1.59 and 2.33, respectively). If fares were covered by an employer, individuals were more likely to travel alone (84%). Individuals who used ride-hailing platforms less than monthly were more likely to take group trips (odds ratio of 2.35). Those who used shared micromobility had a higher likelihood of using ride-hailing in a group. Furthermore, trips from or to home (compared with non-home-based trips) were more likely to be solo trips (43% and 58%, respectively).
Binary Logistic Regression Differentiated by Trip Purpose
Mode choice often varies by trip purpose. This section presents the results of complementary binary logistic regression models partitioned by trip purpose, instead of including it as an explanatory variable, as in Table 2’s binary logistic regression model of group ride-hailing. The direction of the independent-variable coefficients in the trip-purpose-specific models (Table 3) aligned with those in the full-trip-sample model. Although some of the variables that were previously statistically in significant in the full model were omitted from the complementary models, there were nonetheless a few noteworthy differences.
Binary Logistic Regression Model Result for Group Ride-Hailing by Trip Purpose
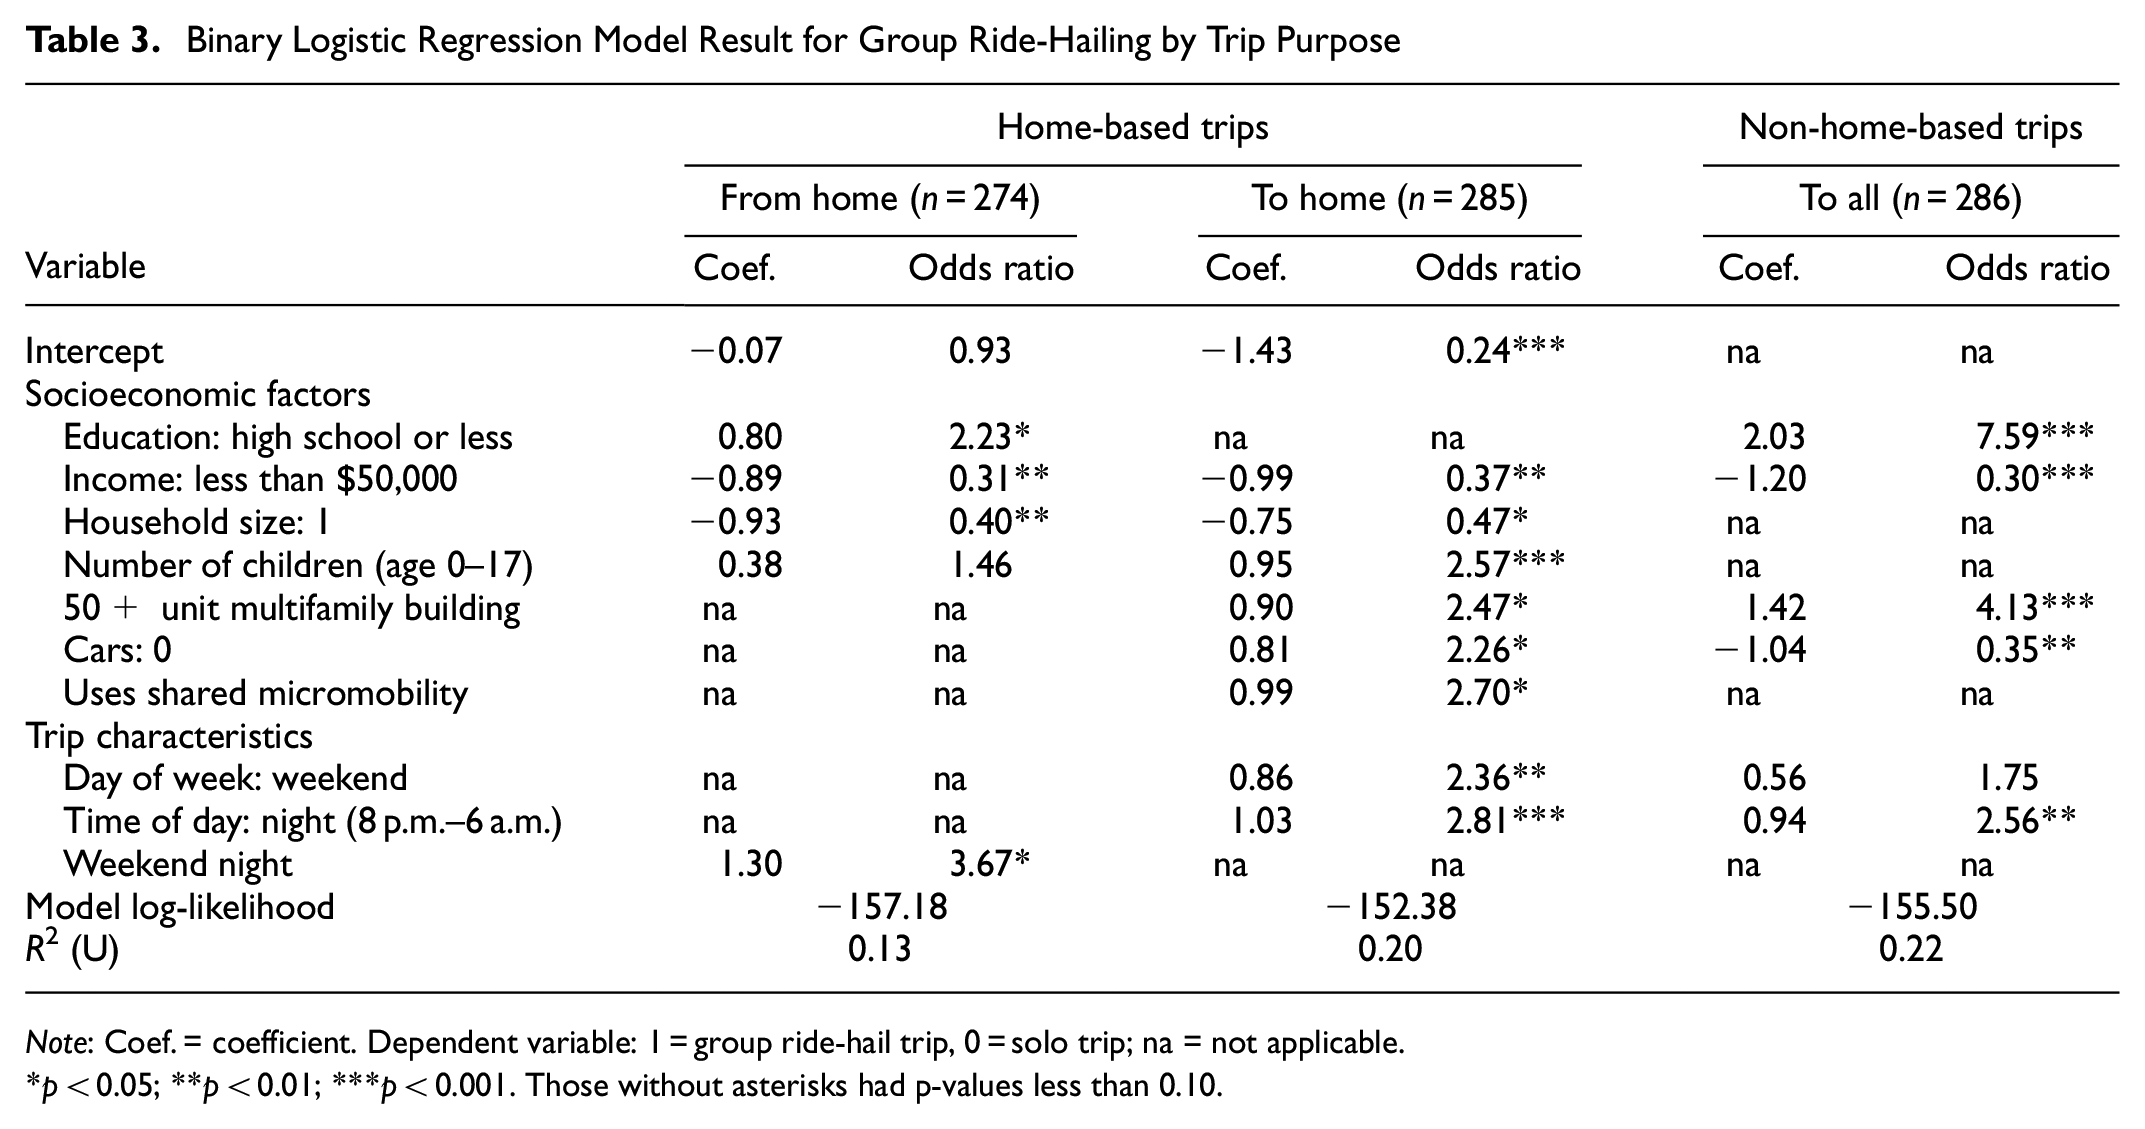
Note: Coef. = coefficient. Dependent variable: 1 = group ride-hail trip, 0 = solo trip; na = not applicable.
p < 0.05; **p < 0.01; ***p < 0.001. Those without asterisks had p-values less than 0.10.
In the non-home-based trip model and home-based return trips, some previously nonsignificant variables became statistically significant. Zero-vehicle households were associated with a 65% lower odds of group trips for non-home-based trip purposes, but an odds ratio of 2.26 for return-to-home trips. In addition, individuals using any form of shared micromobility (e.g., scooter, moped, bicycle) had higher odds of taking group rides for return-to-home trips, potentially serving as a proxy for residential location given the typical deployment of shared micromobility devices in urban areas.
For nighttime trips originating from home, the odds it would be a group trip were nearly four times higher than for solo trips. Similarly, weekend or night ride-hail trips that concluded at the individual’s home had over two times higher odds of being group trips. Several studies indicate that ride-hailing services are often used for social outings during weekends and evenings ( 55 , 56 ), which may explain the increased odds of group travel during these times.
Count Model of Party Size in Groups
The party size count was adjusted downward by 1 to estimate the number of travelers beyond the individual requesting a ride-hail vehicle. Three models were estimated: the Poisson and NB count model and the hurdle model (once the assumption of the Poisson model had been tested). A statistical test with the null hypothesis of equidispersion in the Poisson model returned a statistically significant p-value of the z-statistic (p-value <0.001), providing evidence that overdispersion may have been present in the data. A likelihood ratio test with the null hypothesis that the Poisson model, as the restrictive model for an NB, was true, was rejected (p-value = 0.03). Consequently, Table 4 presents the results for the NB hurdle count portion. Although the hurdle and count components could include the same variables, Table 4 presents the count model component with a smaller set of statistically significant variables found through likelihood ratio testing. The zero component of the hurdle model was the same as Table 2’s binary logistic regression model. The fitted zero component of the hurdle model estimated 473 trips, identical to the observed solo trips, whereas the count component estimated 367 trips (versus 372 observed group trips). Were one to use only an NB count model, the estimated number of solo trips would be 458. These results indicated that the NB hurdle model provided a better fit for estimating the count of travelers beyond the requesting rider. In other words, ride-hail trip occupancy was better estimated by first distinguishing solo and group rides and then estimating occupancy beyond the account holder.
Regression Model Results for the Count of Travelers Besides the Requesting Rider
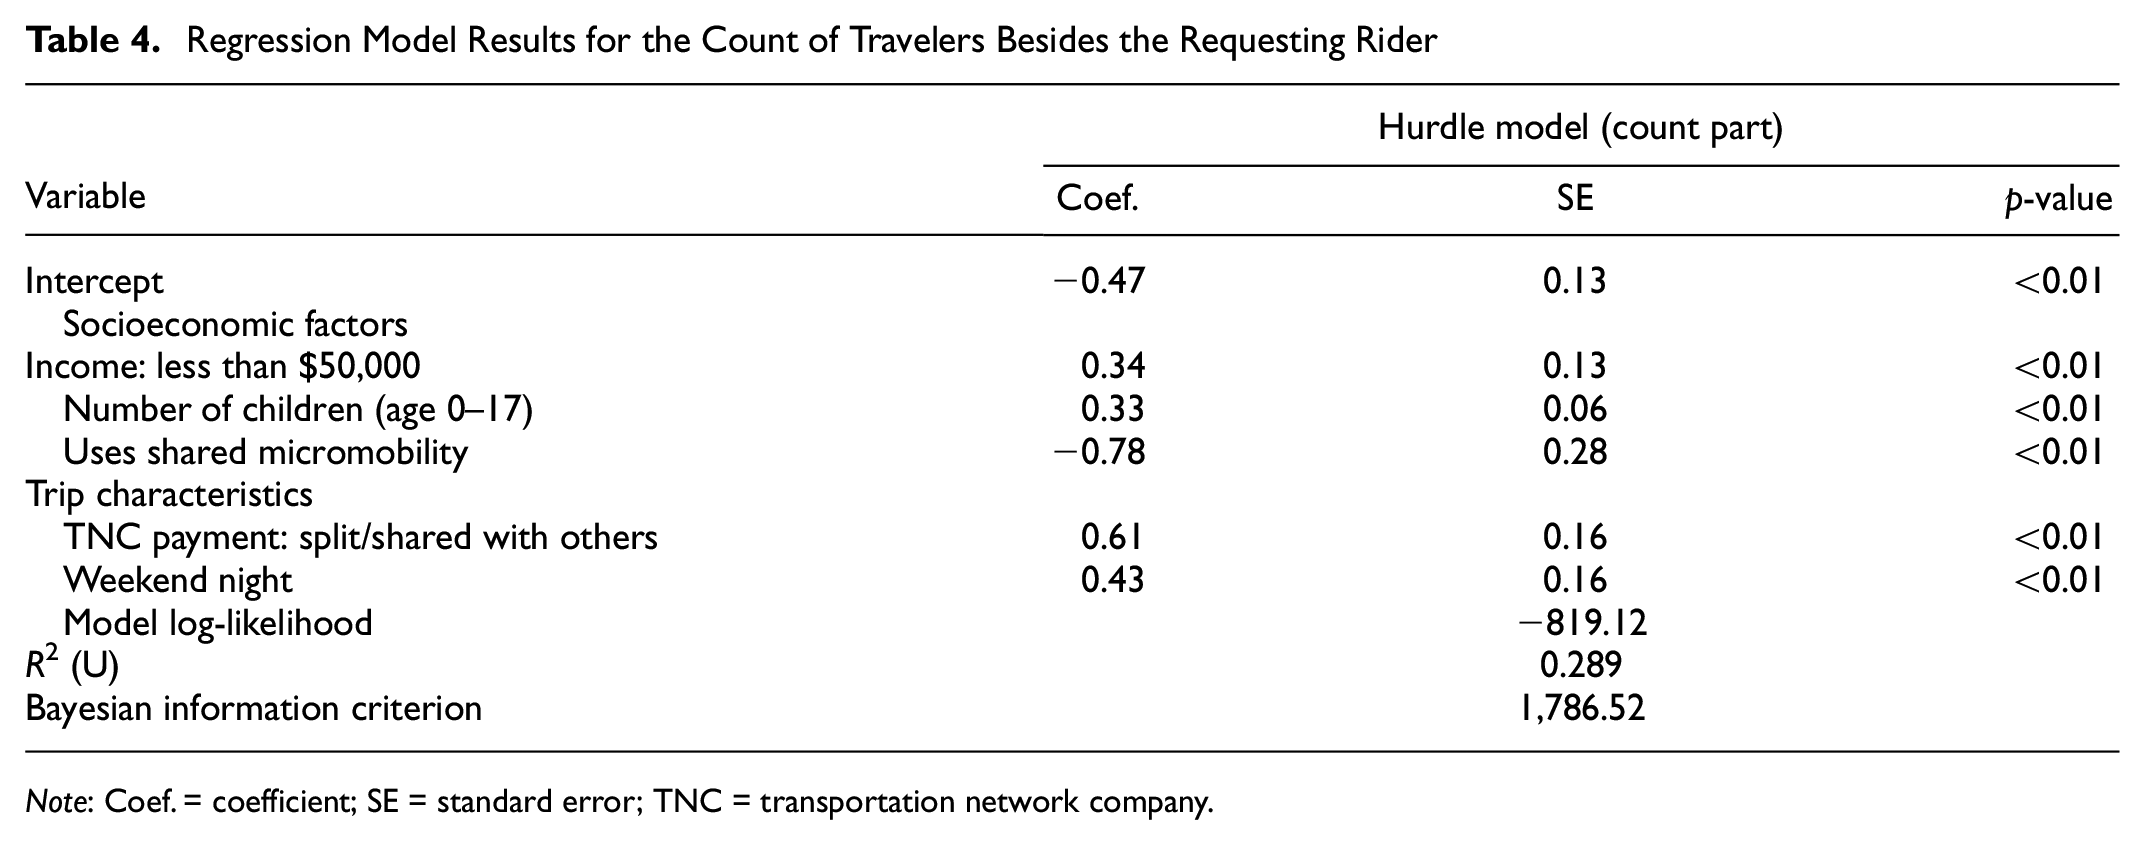
Note: Coef. = coefficient; SE = standard error; TNC = transportation network company.
The impact of income on party size was nuanced: in the binary logistic regression model (Table 2), the coefficients for the indicator variable “annual household income less than $25,000” and “annual household income between $25,000 and $49,999” were negative. However, in the hurdle model, the coefficient for the combined variable “annual household income less than $50,000” was positive. The zero component of the hurdle model indicated that lower-income households were less likely to opt for group rides; however, if they did choose ride-hailing for group travel, they tended to have a larger party size compared with wealthier households. Existing research has indicated a positive correlation between ride-pooling (i.e., shared rides with strangers) and socioeconomic disadvantage indicators, whereas a negative correlation exists between disadvantaged factors and nonshared ride-hail services ( 13 , 20 ). Lower-income individuals are less likely to take nonshared ride-hailing services compared with their wealthier counterparts ( 9 ). However, if lower-income individuals do book a ride-hail trip, they are far more likely to do so as a very large group. Note, the author does not claim a cause-and-effect relationship here between income and party size (or the direction thereof). It was unsurprising that there was a positive coefficient for splitting the cost of a ride with others for the quasi-party size count model.
In the binary logistic regression models, users of shared micromobility had higher odds of group ride-hailing for return-to-home trips. However, the hurdle count component showed a negative coefficient for this factor, suggesting that once an individual is willing to take a group trip, they tend to travel in smaller groups. Although the survey did not ask respondents about mode substitution with ride-hailing, it is plausible that shared micromobility users could switch from large group ride-hailing to “herd scooting/cycling” to avoid cramped vehicles. This is particularly relevant since vendors like Lime allow riders to unlock multiple devices on the same host account.
Discussion
The survey data collected span travel data from 2021 to 2022, potentially reflecting the impacts of the COVID-19 pandemic on travel behavior. Fan et al. conducted a travel survey in the same region, comparing 2021 data with prepandemic data from 2016 to 2017 ( 57 ). They observed a 13.3% increase in days where residents did not leave their homes, and a decrease in work-related travel: 20% fewer work and nonhome activity trip chains. These findings suggest that our results may not fully represent postpandemic behavior, which is an important limitation to consider.
Estimating party size poses a challenge, given that the upper limit of data is constrained by vehicle seating capacity. Whereas Uber and Lyft XL services limit groups to six passengers, alternative providers like Fetii accommodate larger groups, offering rides in vans capable of carrying up to 15 people. Consequently, the nonhurdle NB count model may produce nonsensical predictions, necessitating adjustments for accurate forecasting. Although the count model effectively addressed the prevalence of zeros (56%) for travelers beyond the requesting rider through a hurdle component, estimating other passenger counts (e.g., one, two, three, four or more) might suffer from misspecification. However, the diminishing proportion of large groups in the observed and predicted data provided confidence in the estimated coefficients.
Conclusion
This study analyzed ride-hail data from the 2021 to 2022 household travel survey in the greater Twin Cities region to uncover the characteristics of passengers who use ride-hailing for solo versus group travel. Overall, more respondents reported taking ride-hail trips by themselves rather than with a group. When individuals did travel in groups, it was often with other household members. Passengers renting apartments in large multifamily complexes and households with more children were significantly more inclined to opt for group trips over solo rides. Group trips were also more likely to have occur during weekends and at night. Interestingly, less frequent ride-hail users were more likely to use this mode for group rides, which raises concerns about the potential for increased low-occupancy trips in the future with greater on-demand mobility options for the inverse relationship (i.e., more frequent ride-hail users are less likely to use ride-hailing for group rides), a hypothesis that merits further examination.
Zero-vehicle households exhibited interesting patterns. They were less likely to use ride-hailing for group travel on non-home-based trips. However, they were more likely to use ride-hailing for group travel on the return trips home. This suggests that individuals leading car-free or car-lite lifestyles may rely on other nonhousehold members’ vehicles when traveling in groups outside the home. When traveling solo, they may opt for alternative modes or individual ride-hailing, indicating a potential market for pooled ride-hailing services. Shared micromobility users had higher odds of ride-hailing in a group. However, shared micromobility users who took ride-hailing for group travel were more likely to travel in smaller groups. Future research should explore how travelers perceive shared micromobility as an adequate substitute for group ride-hailing.
This study corroborates previous research findings that ride-hailing passengers tend to be younger and wealthier. Households with annual incomes below $50,000 were less likely to use ride-hailing for group travel. However, the two-stage modeling approach revealed nuances in ride-hail trips that might otherwise have been overlooked. The NB hurdle model’s count component indicated that once low-income passengers decided to book a trip, they tended to travel in larger groups. Large groups may incur extra costs for a larger vehicle, but these expenses can be split across more riders.
Understanding the determinants of solo and group ride-hailing is crucial for mobility providers to adjust their pricing strategies to attract groups while ensuring an adequate supply to serve these passengers. This knowledge may also be of interest to travel demand modelers and policy makers concerned with estimating the average vehicle occupancies of ride-hail vehicles, a critical metric for emissions per passenger mile and other key performance indicators, or those imposing congestion fees on transportation network companies (see City of Chicago’s ride-hailing congestion fees). Researchers studying dynamic ride-sharing of on-demand vehicles may find value in adapting these models to create baseline estimates of available seats per vehicle (see the Appendix for more details).
Although publicly available ride-hail datasets provide some person-trip-level characteristics, they often lack passenger socioeconomic attributes and mobility choices. This unique dataset, the first of its kind to be publicly released, allows for a comprehensive understanding of who takes solo and group trips on ride-hailing platforms. Although the sample size (N = 845) may be small and represents trips that were taken by a smaller group of unique travelers (n = 350, as measured by the account holder requesting the ride), it was sufficient for estimating the regression models in this study. Although there are concerns that the trips taken may not be representative of all ride-hailing trips, it is not uncommon for MPOs to rely on household travel surveys (like the one used in this study) and other trip datasets when developing models to forecast demand. The richness of this dataset can be attributed to two factors: (1) the increasing use of ride-hailing services, and (2) the shift to a 7-day travel diary using a smartphone app for data collection. Although it is unlikely that ride-hailing companies would collect and disclose individual and household-level passengers attributes, they could play a role in providing such data.
In conclusion, this study provides valuable insights into the factors influencing solo and group ride-hailing behavior. As on-demand mobility continues to evolve, understanding these patterns will be crucial for developing sustainable and efficient urban transportation systems.
Supplemental Material
sj-docx-1-trr-10.1177_03611981241277754 – Supplemental material for Understanding Party Size in Ride-Hailing: Solo Versus Group Travel
Supplemental material, sj-docx-1-trr-10.1177_03611981241277754 for Understanding Party Size in Ride-Hailing: Solo Versus Group Travel by Matthew D. Dean in Transportation Research Record
Footnotes
Acknowledgements
Author Contributions
The author confirms sole responsibility for the following: study conception and design, data collection, analysis and interpretation of results, and manuscript preparation.
Declaration of Conflicting Interests
The author declared no potential conflicts of interest with respect to the research, authorship, and/or publication of this article.
Funding
The author(s) disclosed receipt of the following financial support for the research, authorship, and/or publication of this article: Provided by the University of California, Irvine through a start-up research grant for new faculty. Funding for publishing this article open access was provided by the University of California Libraries under a transformative open access agreement with the publisher.
Declaration of Generative AI and AI-Assisted Technologies in the Writing Process
During the preparation of this work the author used ChatGPT-3.5 to make line editing changes only after a final draft was created (which saves both time and money in the editing process). After using this tool, the author reviewed and edited the content, line by line, as needed, and takes full responsibility for the content of the publication. The author used the following input text (in addition to the paper): “Can you review this proposed paper and make line editing changes? I’m specifically looking to fix grammatical errors, make the text concise, add better transitions to make the text flow better, and improve the structure of the paper.”
Supplemental Material
Supplemental material for this article is available online.
References
Supplementary Material
Please find the following supplemental material available below.
For Open Access articles published under a Creative Commons License, all supplemental material carries the same license as the article it is associated with.
For non-Open Access articles published, all supplemental material carries a non-exclusive license, and permission requests for re-use of supplemental material or any part of supplemental material shall be sent directly to the copyright owner as specified in the copyright notice associated with the article.