
Abstract
The freight railroad industry has experienced many changes and technological advancements over the past 25 years, influencing operating strategies and traffic patterns. To help identify the major trends in railroad shipping patterns and how heavier carloads have evolved in the process, this quantitative study of North American freight railroad transportation investigates the trend of adopting heavier carloads over the years 1996 to 2019 with consideration of the impact of interchange operations, train types, and specific commodities. A literature review of previous studies related to the adoption of 286,000-pound gross railcar loads revealed research gaps currently exist and inspired this particular analytical research. Specific research questions and hypotheses based on railroad industry trends were investigated by detailed statistical analysis of carload waybill sample data. Results quantify how the railroads have shifted from 263k-pound cars to 286k-pound cars, and how the rate of adoption varies across different combinations of train type, involvement of interchange, and commodity shipped. For certain commodities such as chemical products, there appears to be potential for additional conversion of traffic to heavier axle loads, with corresponding increases in efficiency and energy and emissions benefits. However, for commodities such as coal and field crops using certain train operating types, the adoption of heavier railcars has plateaued, suggesting that substantial investments are required to convert remaining traffic, or alternative strategies, such as longer trains, are required to achieve further economies. Future work is required to further investigate the specific patterns observed within other commodity types, including the role of shortline interchange in limiting adoption of heavier railcars, and to extend the analysis to intermodal shipments.
To remain competitive with other transportation modes and leverage their unique economies of scale, North American freight railroads have undergone substantial changes in operating strategies and technologies over the past 25 years, including Class I railroad mergers, adoption of long train operating strategies ( 1 , 2 ), implementation of principles of Precision Scheduled Railroading ( 3 ), a transition to heavier axle loads and higher capacity railcars ( 4 , 5 ), and development of more efficient locomotives, alternating current traction, and distributed power ( 6 – 8 ). Although some of these operational changes have occurred rapidly, other technologies that directly involve capital-intensive railroad assets such as track, bridges, locomotives, and railcars have been implemented gradually over time.
The shift from 263,000 to 286,000-pound gross railcar load (286k GRL) railcars is one example of a gradual technological change. Heavy-axle load research in the late 1980s concluded that the operational benefits of 286k GRL would outweigh the associated engineering costs, and railroads began to introduce 286k GRL in limited interchange service via specific agreements ( 4 ). In 1995, the Class I railroads adopted a new design specification for 286k GRL railcars for interchange service, and by 1999, at least limited operation of 286k GRL was allowed on all of the Class I railroads. New 286k GRL design standards were adopted in 2003 and 2004, providing a strong incentive for railroads to ship interchange carloads at the higher gross rail load. Before 2011, one lingering regulatory hurdle dictated that, except under special permits, tank cars carrying hazardous material could not exceed 263k GRL load ( 9 ).
Although increasing the freight payload carried by each railcar has immediate economic benefits through increases in tons per train length, increased load-to-tare weight ratio, improved fuel efficiency, and gains in mainline capacity, safe and efficient operation of these railcars requires appropriate investments in track and bridge infrastructure and maintenance. These upgrades require time and resources to implement, and thus railroads necessarily prioritized certain corridors and freight services for initial conversion from 263k GRL to 286k GRL. On some Class I freight corridors with low traffic density, the required upgrades were not economically justified, and railcars are still restricted to 263k GRL. Some shortline operators require the assistance of federal grant programs such as the Consolidated Rail Infrastructure and Safety Improvements grants to finance the capital required for ongoing infrastructure upgrades to handle 286k GRL railcars. Challenges to 286k GRL adoption are not just found in track infrastructure and bridges; in some types of commodity service, legacy fleets of 263k GRL railcars with remaining service life delayed adoption of 286k GRL until the fleet required replacement. For all these reasons, the transition from 263k to 286k GRL continues to this day.
This paper aims to document this ongoing transition from 263k to 286k GRL in detail while benchmarking the current freight GRL distribution as a function of interchange, train type, and commodity shipped. The analysis presented in this paper serves to update and be more comprehensive than past studies that benchmarked 286k GRL adoption. The timing of this study is appropriate given that it is now 30 years since many railroads began to implement 286k GRL, and 25 years of waybill sample data documenting the GRL of individual shipments are now available online. Further, an examination of the distribution of railcar GRL is timely and critical given the current focus on sustainability and decarbonization of railway and freight transportation. U.S. railroads increasingly ship heavier axle loads and carload tonnage to achieve tremendous advantages in efficiency over highway transportation that make them the preferred mode for quickly transporting large volumes of freight over long distances. However, in the near future, emerging technologies in the areas of automation and alternative energy for both highway trucks and rail may further change the economics, efficiency, and environmental impacts of shipping freight by either mode. To understand how these changes may influence future shifts in freight between the rail and highway mode, detailed data analysis is needed to better understand how much freight moves at 286k GRL, and what opportunities remain for further increases in efficiency and reduction in emissions by either shifting remaining freight from 263k to 286k GRL, or from the highway mode to freight rail transportation.
To meet this need, this study will use the U.S. Surface Transportation Board (STB) Carload Waybill Sample Data ( 10 ) to investigate and visualize freight rail carload tonnage trends based on reported shipment parameters, and analyze the influence of interchange operations (collaborative shipments handled by multiple railroads), commodity types, and train type. These results will inform future research into expectations of adopting heavier tonnage cars with the advancement of technology, and the energy and emissions implications of further adoption of 286k GRL and modal shift from highway or other modes to rail.
The remainder of this paper is organized as follows: the next section describes previous research into the adoption of 286k GRL railcars; section three describes the experimental methodology used to prepare the waybill data for analysis, and describes the data processing using Python coding; the fourth section presents results and makes comparisons between different commodities, trains types and interchange conditions; and the fifth and final section summarizes the conclusions, limitations and opportunities for future work.
Literature Review
Few publications have visited this specific topic of documenting the shift from 263,000-pound railcars to 286,000-pound railcars and the role of interchange operations throughout the evolution of railroad carload shipments in the last 30 years. In the most closely related study, Martland introduced a timeline of 286k GRL implementation for different commodities with individual railroad company data covering the years 1990 to 2012 ( 4 ). The analysis used railroad data to calculate the average shipment size for different commodities and, based on the position of this value between expected 263k and 286k GRL shipment sizes, estimated the proportion of traffic moving at each GRL level. Martland reported that, as of 2012, nearly all coal traffic and 30%–40% of general freight moved at 286k GRL. Martland also provided analytical results for benefits and additional costs resulting from heavier axle load operations. Compared with the work presented in this study, Martland did not investigate GRL trends for different train types or the role of interchange, and inferred the average GRL for different commodities instead of developing the full distribution of GRL from waybill data.
In the other closely related study, Prater and O’Neil explored the shift toward 286k GRL railcars for agricultural products (grains) from 1994 to 2011 using STB waybill data ( 5 ). Their study noted that only 2.4% of grain moved at 286k GRL in 1994, but this fraction had risen to 68.6% in 2011, with the share of 286k GRL shipments of grain first exceeding that of 263k GRL shipments in 2007 (as measured by both tons and carloads). Although their study mentioned the challenges faced by shortlines in handling 286k GRL grain shipments in interchange, they did not specifically examine the difference in GRL between non-interchange and interchange grain shipments. Finally, the Prater and O’Neil study noted that the portion of shortline route-miles capable of handling 286k GRL shipments increased from 39% in 2002 to 57% in 2010.
Besides updating their results to include the continued adoption of 286k GRL over the past decade, this study extends the commodity-specific analyses of Martland ( 4 ) and Prater and O’Neil ( 5 ) by: (1) examining the influence of train type and interchange in addition to commodity type, and (2) examining the entire distribution of railcar GRL, and not just the proportion or percent of tons and carloads moving at each GRL level.
Other papers that share a methodological approach with this work include a study by Dick et al. of recent trends in Class I railroad train lengths and weights by train types ( 2 ). The authors went in depth to analyze train length and train weight using the 1996 through 2018 waybill sample datasets. The authors utilized three different train groups to categorize the data into subgroups as defined by R-1 Annual Report Financial Data, another dataset published by STB ( 11 ). Unit trains are defined as specialized scheduled shuttle-type service dedicated to certain origin and destinations. The train types defined by the STB ( 11 ) and methods of Dick et al. ( 2 ) provide guidelines used to determine train types for this study.
A final related work is Laurits R. Christensen Associates, Inc.’s report for STB ( 12 ) dedicated to investigating the costs and benefits of US freight rail transportation and to analyzing the competitiveness of freight rail compared with other transportation modes. The report recorded key characteristics for railroad performance such as ton-miles shipped over the years and average fixed and variable cost for operations. The report also included volume and cost trends for different commodities such as farm products and coal. Although quantities of equipment were documented, the shift from 263,000-pound to 286,000-pound railcars was unclear and not researched specifically. The report included a section for implications for proposed policy changes, in which the authors introduced reciprocal switching as a means to supplement interchange service. STB is currently considering rules that may introduce the concept of reciprocal switching to provide customers with more competitive access to the freight railroad network via interchange ( 13 ). If a customer directly served by one railroad is located within a certain distance of an interchange point with a competing railroad, reciprocal switching would require the first railroad to allow the customer to be switched and served by the competing railroad through the interchange. By potentially increasing the number of railcars transferred between rail operators at interchange points, reciprocal switching may also increase the coordination required to further implement 286,000-pound railcars on routings that involve multiple carriers. To help inform these possible implications, the work presented in this study specifically examines the GRL trends for interchange shipments given that the waybill sample dataset has specific fields indicating if a shipment went through interchange. As a novel contribution, the role of interchange operations will be further investigated by data analysis and visualizations in this study.
Research Questions
The literature review indicates a need to update and expand previous work documenting the adoption of 286k GRL railcars. This study aims to extend the previous trends of carload tonnage shifting from 263k to 286k GRL for overall freight shipments and shipments of specific commodity types, including chemical shipments that have not been previously documented separately in the literature. The lack of analysis on the role of interchange operations and train type on 286k GRL adoption also prompts the authors to investigate the impact of these two factors on the distribution of US freight rail GRL.
Specifically, this paper addresses the following research questions for non-intermodal freight rail shipments during the period from 1996 to 2019:
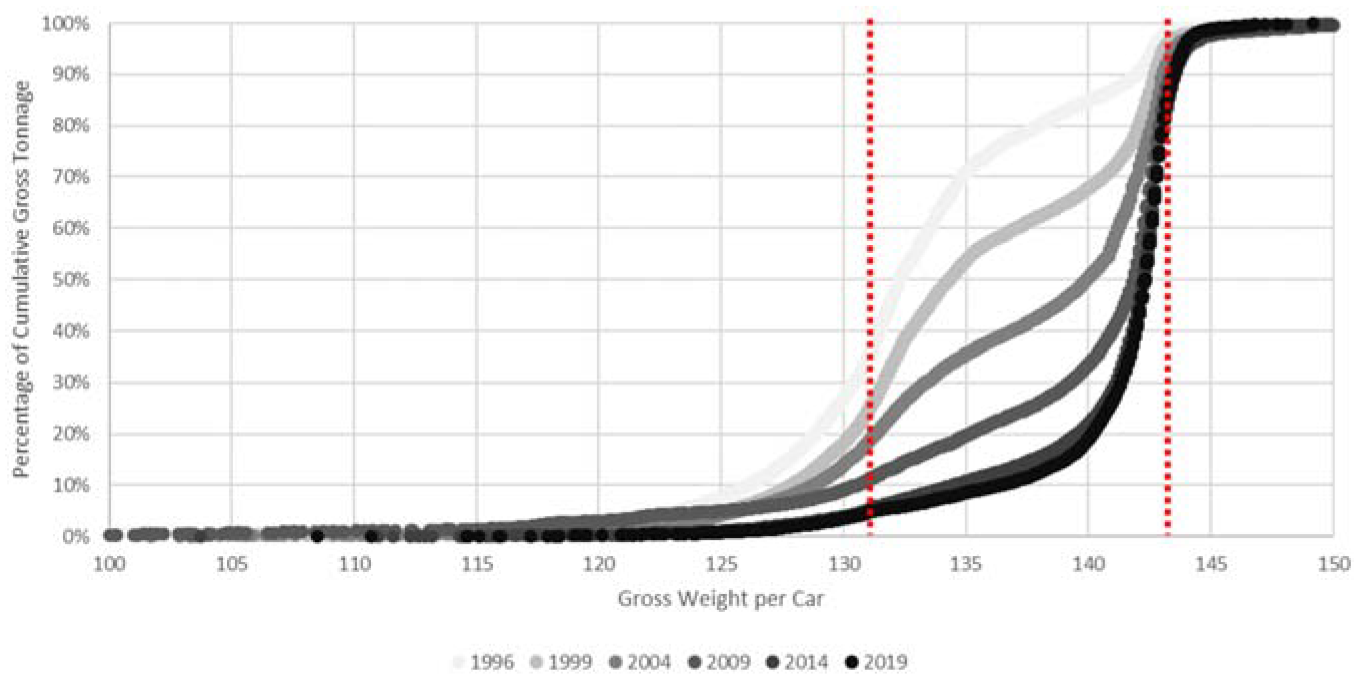
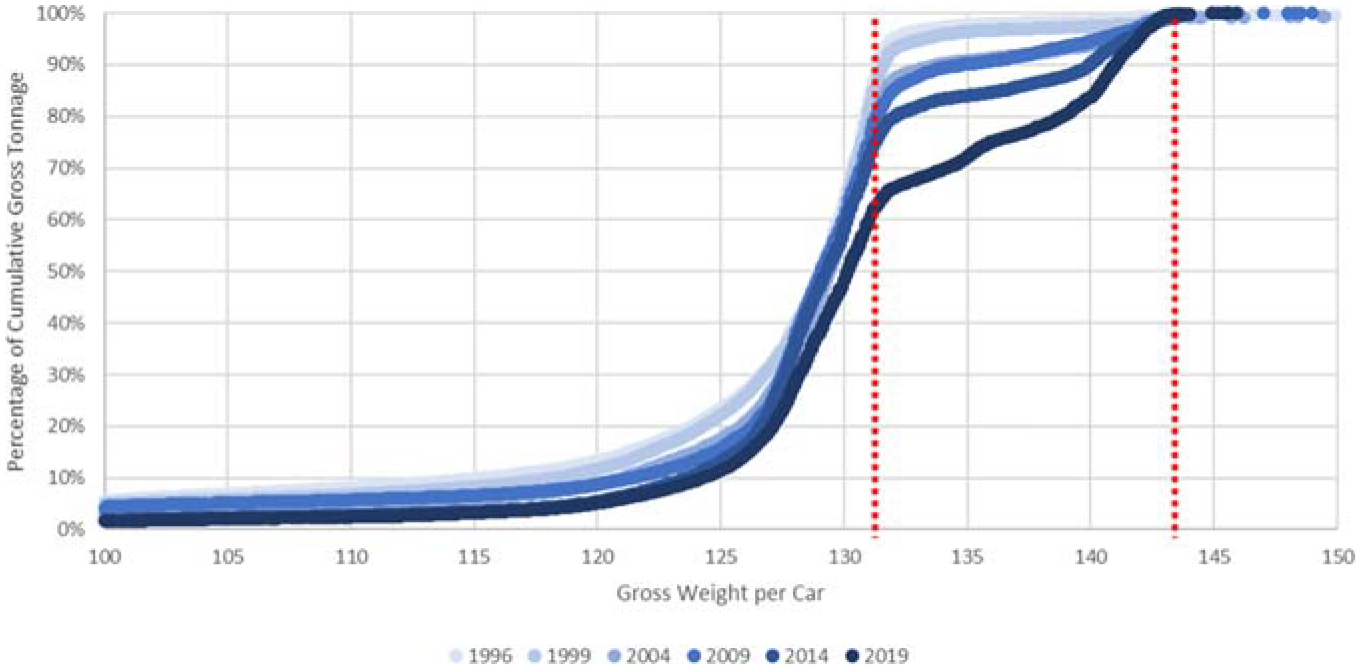
How has the carload gross tonnage distribution changed over the years since the earliest readily available STB waybill sample data from 1996?
What are the trends for the adoption of 286,000-pound railcars for different commodity types?
What is the role of interchange operation and its impact on the GRL trends over the years?
Do unit trains and manifest trains exhibit different GRL distributions over time?
The authors set a few hypotheses to answer the research questions before conducting the data analysis, as listed below:
Based on previous research, it is expected that the gross tonnage per car has gradually increased since 1996, with lower tonnage cars contributing less traffic because of the introduction and adoption of 286k GRL railcars. It is hypothesized that the rate of increase will have declined in recent years as many types of traffic are nearly fully converted to 286k GRL, and the remaining 263k GRL traffic faces more substantial infrastructure and operational barriers to conversion.
As suggested by the previous research, it is expected that different commodity types will exhibit different tonnage distributions and different rates of adopting the 286,000-pound railcars. The reasons for these differences may, in part, lie in the relative proportion of unit and manifest train shipments, and interchange and non-interchange shipments for each commodity.
As interchange shipments at the 286k GRL require two (or more) railroads to upgrade their infrastructure, it is hypothesized that non-interchange shipments may exhibit a more rapid and widespread adoption of 286K GRL railcars. However, a counter hypothesis is that interchange shipments are naturally more competitive, prompting railroads to quickly adopt 286k GRL for interchange shipments to be more efficient and competitive, whereas non-interchange shipments may involve captive shippers and provide less incentive to increase efficiency via 286k GRL.
It is hypothesized that unit trains will have higher tonnage per car and adoption of 286k GRL in general compared with shipments moving in manifest trains to take advantage of the economies of scale offered by higher gross rail loads. By keeping dedicated trainsets of railcars in captive service in fixed routings between a limited set of origins and destinations with no intermediate classification yard switching, unit trains may have more easily facilitated early adoption of 286k GRL when such railcars could only be interchanged by special agreement.
Methodology
This study uses the STB Carload Waybill Sample Data to find trends in the shift from 263,000-pound to 286,000-pound railcars, and to analyze the role of interchange operations by comparing different shipment operation methods. Commodity groups including Coal, Field Crops, Chemical Products, Intermodal, and other commodities were separated to perform in-depth analysis of the evolution of North American railroad shipment GRL for specific commodities. Data cleaning and reconstruction were conducted to better analyze the exact trends of the different shipment methods.
Introduction to the Dataset
The STB Carload Waybill Sample Data are readily and publicly available online for all years since 1996 ( 10 ). Each waybill in the sample data is a record of a single shipment involving one or more railcars. As the data value is only a sample, each waybill record in the sample is representative of multiple identical or similar waybills in the entire population of freight rail shipments. The “expansion factor” serves as a multiplier to restore the actual number of shipments from the sample by multiplying the expansion factor by the data values for each sample waybill. The exact expansion factor varies from 2 to 40 depending on the number of railcars shipped on the waybill. Exact expansion factors are provided in hundredths. The Carload Waybill Sample Data for Public Use consists of sixty-two columns of inputs including shipment revenue, carloads per shipment, type of commodity, tonnage, mileage, origin and destination, and basic routing information ( 14 ). The full confidential Carload Waybill Sample Dataset has 900 bytes of data in over 200 columns of inputs; however, the public version provides enough information to support the study and is readily available to researchers. Srivastava et al. studied the characteristics of the Carload Waybill Sample Dataset and acknowledged its value in providing insights to the railroad industry ( 15 ).
Each row in the public waybill sample dataset provides information about one unique waybill and includes the following columns that are valuable to this study:
Number of carloads
Number of TOFC/COFC units
Commodity code (STCC/non-HAZMAT)
Billed weight in tons
Estimated short line miles (rounded)
Interchange state #1
Tare weight of car
Exact expansion factor
Some of the columns need to be processed to avoid any confusion, and some unit conversions are also necessary. The number of carloads represents the number of railcars in the specific shipment. Number of TOFC/COFC units represents the number of intermodal containers or trailers in the shipment. This column is used to distinguish intermodal shipments and remove them from the study, as intermodal traffic is out of the current study scope. The five-digit standard commodity code (STCC) indicates what exact commodity the shipment involves, and each waybill can only have one commodity code. Billed weight in tons represents the total revenue tons the shipment carries. Estimated short line miles is the expected shipment distance in miles following the shortest plausible route through the rail network rounded up to the nearest 10 mi. The interchange state #1 column is used to determine if the shipment involves an interchange. The shipment is determined to involve interchange operation if the interchange state #1 is not empty. This approach is used instead of the “number of interchanges” column because this latter field tends to exhibit erroneous behavior inconsistent with the interchange state routing information. The tare weight of the car is provided in pounds and is the average value for each car in a multi-car shipment, which means correct data processing is required before analyzing and visualizing trends. The exact expansion factor is in xxx.xx format, and indicates how much weighting the shipment represents in the whole dataset and is calculated by Equation 1:

Data Cleaning
To avoid erroneous results, waybill data cleaning was used to remove samples with erroneous inputs such as zero miles shipped, or zero tons shipped. In the 2019 waybill database, 10,561 out of 676,258 samples have zero mileage, zero tonnage, or both, a 1.6% error rate. Because the focus of this study is on the GRL of conventional four-axle railcars, all intermodal shipments are removed. As intermodal waybills document the shipment weights of individual containers and trailers that are often shipped in multiple on specialized articulated or drawbar-connected multi-unit railcars that do not conform to typical four-axle GRL levels, the presence of intermodal shipments would substantially skew the results. In the 2019 waybill database, 28.66% of the sample, or 193,819 waybills, were labeled as intermodal shipments and removed from further analysis.
As GRL is critical to this study, an outlier-checking procedure is needed. For this study, an outlier boundary is set that any shipment with gross carload tonnage over 200 tons will be treated as an outlier. As a result, 428 out of 471,878 filtered samples have a gross load outside of the acceptable range, corresponding to a 0.091% outlier percentage.
To avoid analyzing and presenting GRL distributions for each year that the waybill data are readily available in electronic format, this study examines six datasets at five-year intervals (including 1996 and 2019). The five-year interval is sufficient to investigate overall trends without emitting crucial data points while observing patterns from a higher level rather than dealing with large-scale data for every year. The final year included in the study was selected to be 2019 for various reasons. Because of the COVID-19 pandemic and its substantial impact on certain U.S. rail traffic segments in 2020, the dataset for 2020 is viewed as not being representative even from the cumulative percentage point of view. Although COVID impacts are less of a concern for the 2021 data, the sampling rate and methodology was updated by the STB for the 2021 public Carload Waybill Sample Dataset, potentially skewing the comparisons with earlier years. Finally, at the time this research was conducted, the 2022 waybill data had not yet been released by the STB. These considerations led to the decision to use 2019 as the last year and investigating the 1996, 1999, 2004, 2009, 2014, and 2019 datasets to observe the development of GRL patterns over time.
Commodity Type Separation
As this research studies GRL trends in overall non-intermodal traffic and in commodity-specific traffic, the waybill data must be separated into different commodities based on the Commodity Code (STCC / non-HAZMAT) column originally included in the STB waybill sample dataset. Based on the detailed commodity list in the STB waybill reference guide ( 14 ), the research team identified the STCC for coal, field crops (subset of farm or agricultural products), chemicals, and other commodities (all non-intermodal shipments not included in the previous categories) for this specific study (Table 1).
Commodity Code Reference Table for Selected Commodities
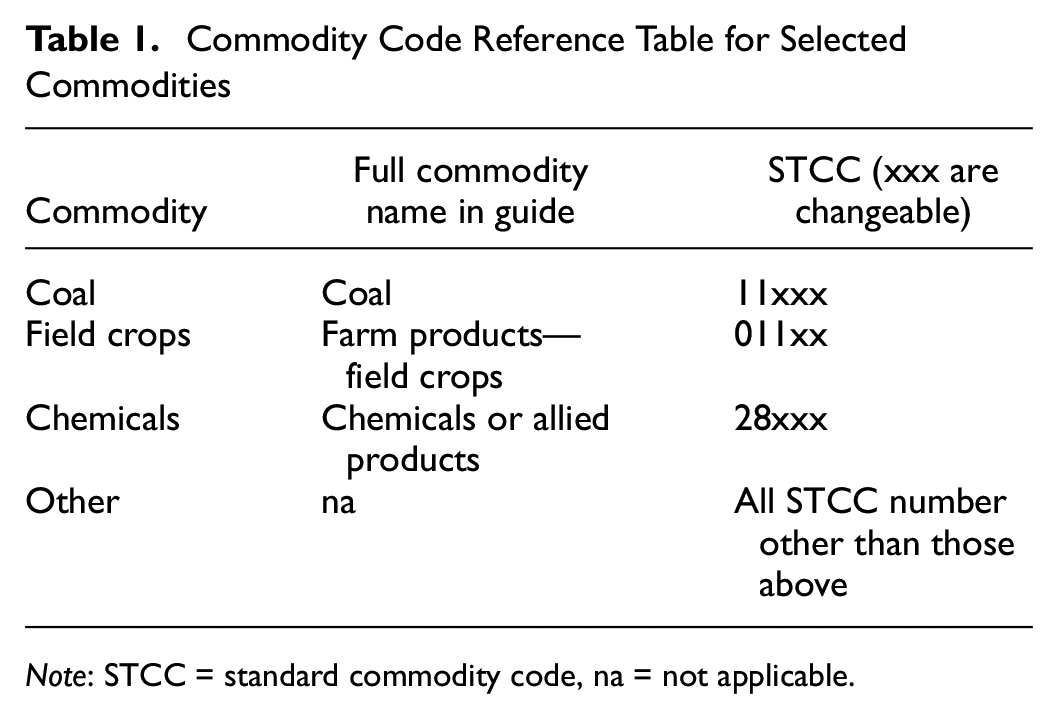
Note: STCC = standard commodity code, na = not applicable.
Data Processing
Data processing to standardize units and formats is required to conduct accurate data analysis and visualization. The weight per car field is created to calculate the billed weight per car for multi-car shipments, as shown in Equation 2. Gross carload weight per car can be calculated by adding the tare weight per car to the billed weight per car, as shown in Equation 3. An extra unit conversion is done by dividing the tare weight by 20 to achieve tons from the hundreds of pounds used in the waybill data.


Following the approach used by a previous study ( 2 ), classification of waybill records by train type is realized by examining the number of railcars shipped on a single waybill. Any shipment consisting of more than sixty railcars is classified as a unit train shipment, otherwise the shipment is classified as being transported by manifest trains. Combined with the interchange status mentioned previously, four different train operating types (unit train with interchange, unit train no interchange, manifest train with interchange, manifest train no interchange) are created to compare the results later in the study.
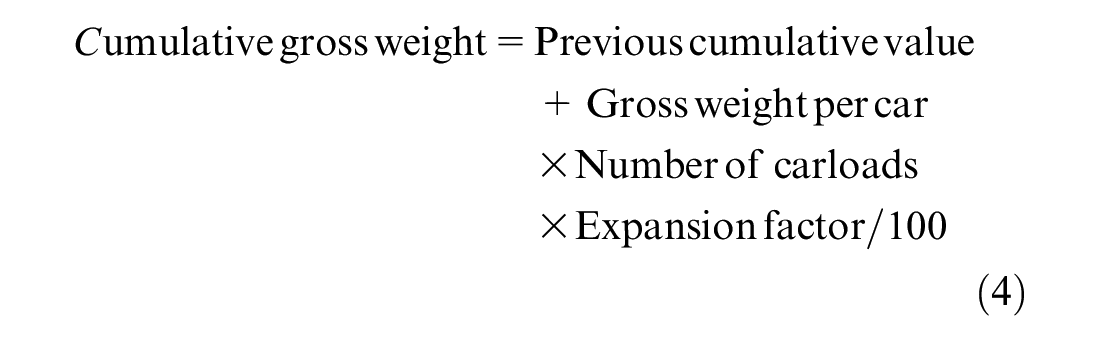
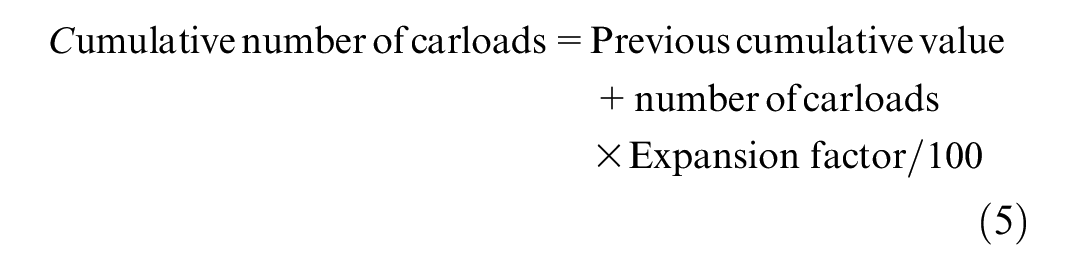
After dividing the dataset into the four train operating types, shipments are sorted from smallest gross tonnage per car or number of carloads shipped, depending on the research question being addressed. Sorted shipments are multiplied by their respective expansion factor to achieve realistic weighting and better represent the actual overall population of freight rail shipments. This process is conducted when calculating the cumulative tonnage or number of carloads using the coding in Equation 4 and Equation 5. The expansion factor must be divided by 100 for each waybill, as the expansion factor column is formatted to be five digits with the last two digits used as the tenths and hundredths places to the right-hand side of decimal point.
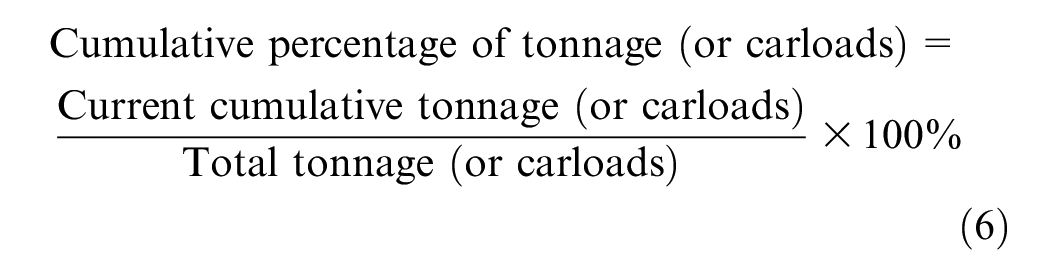
After all waybills are processed with the previous steps, a total sum value for number of carloads or gross tonnage is calculated for each train operating type and each year. A cumulative percentage is calculated for normalization and graphing using Equation 6.
For classification of 131.5-ton (263k GRL) railcars and 143-ton (286k GRL) railcars, a 134-ton boundary is set. Any carload with gross weight per railcar under 134 tons is classified as a 131.5-ton (263k GRL) car, while the rest are identified as 143-ton (286k GRL) railcars.
After all data processing is completed for the waybill sample datasets of 1996, 1999, 2004, 2009, 2014, and 2019, there are typically too many data points to plot a detailed cumulative GRL distribution as the size of each dataset is in the hundreds of thousands of data records every year. Thus, further data point filtering is needed to develop the cumulative distribution plots for all train types and commodities. The filtered and consolidated data points created by this process are able to be plotted but can still represent the original dataset without omitting important information. The pseudo code for the data point selecting process is included below:
For each row of processed waybill sample input:
If the gross tonnage per car is different from the previous input:
Select this specific row of waybill sample data as data point for graph plotting.
Interchange and Rebilling
As described earlier, to investigate hypotheses related to the relative adoption of 286k GRL for shipments involving multiple rail carriers, interchange shipments are identified as those with information provided in the first interchange state location field within the waybill data. A potential issue with this approach acknowledged by STB is the railroad practice of “rebilling” that can produce subtle nuances in the sample data ( 14 ). A traditional interchange shipment involving two carriers will have a single waybill specifying the entire routing and how the revenue collected by one railroad will be shared with the other. Freight Mandatory Rule 11 allows railroads to “rebill” shipments to receive quicker revenue settlements. Under this approach, the first railroad prepares a waybill specifying the routing and rate from origin to the interchange point. Once the railcar reaches interchange, it is rebilled with a new and separate waybill from the second railroad specifying the reminder of the route and rate. In this way one single carload shipment with interchange can effectively become two distinct non-interchange shipment waybills in the STB data.
The implications of rebilling are that the STB waybill data tend to underestimate the average length of rail shipments, can inflate the number of railcars “originated” and “terminated” at key interchange locations, and also may understate the number of interchange shipments by misrepresenting the actual interchange status of many waybills recorded in the sample dataset.
Realizing the rebilling may influence results comparing interchange and non-interchange shipments, this study went in depth to try identifying interchange shipments subject to the rebilling issue and not labeled in the data as interchange shipments. The proposed method is based on the concept that a rebilled shipment should generate two waybills, each with the same commodity code and shipment size/weight, and with one waybill originating at the exact destination of the other such that they form one continuous interchange shipment. A complete search algorithm was developed to find the potential hidden interchange traffic. The exact criteria used for searching such traffic follow these steps:
Find shipments that do not have the interchange labels attached to decrease the runtime for the search algorithm.
For each of the five-digit commodity codes, separate the dataset into smaller datasets, each with the same commodity code.
From each individual smaller dataset of waybills with the same commodity code, for each waybill sample, search if there exists another waybill in the smaller dataset with the same number of carloads, same billed weight, and has the same origin Business Economic Area (BEA) code as the selected waybill’s destination. If a match is found, the waybill is a potential interchange shipment.
After searching the 2019 dataset, the algorithm classified 8.87 million carloads as “potential interchange shipments” out of the 17.85 million carloads indicated as not being interchange shipments in the waybill data (1.45 million carloads were already specified as involving interchange in the data). This result suggests that the public waybill sample data do include a certain number of interchange carloads being reported redundantly from multiple railroad carriers such that the interchange trait is lost in the records. However, because of the nature of the sampling, waybills for a single rebilled shipment become untraceable by exact departure dates and times which could provide further evidence to support their classification as interchange shipments. Thus, it is impossible to fully determine if these potential interchange shipments indeed involve interchange operations, or if they are distinct shipments that coincidentally involve identical commodities and common shipment sizes/weights with a common origin/destination.
Based on this interchange rebilling analysis, this study decided to proceed with the reported interchange rate from the original STB waybill dataset to avoid misclassifying any non-interchange traffic as interchange operations. Thus, results presented for interchange traffic are definitive based on the STB data, but results for non-interchange traffic may contain some interchange traffic subject to rebilling.
Results
The results section of this study first presents the overall freight railroad GRL trends before dividing them into subgroups by train operating types and commodity.
All-commodity Traffic and GRL Trends
2019 Gross Tonnage Profiles for Different Train Types
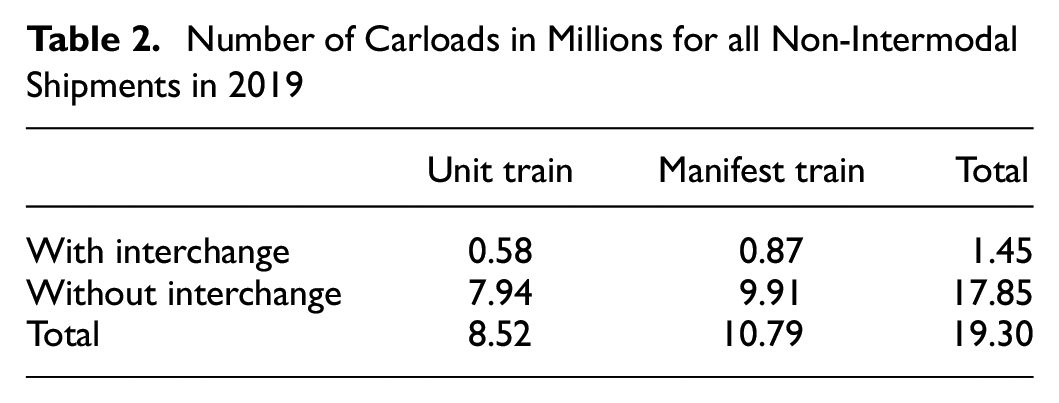
The research team first analyzed the overall traffic (Table 2) and GRL distribution (Figures 1 and 2) for all commodities across different train operating types for 2019 (Table 2). Considering all non-intermodal carload waybill sample data, 7.5% of all shipments definitively included interchange operations, whereas 44.1% of all shipments were completed in unit trains.
Number of Carloads in Millions for all Non-Intermodal Shipments in 2019
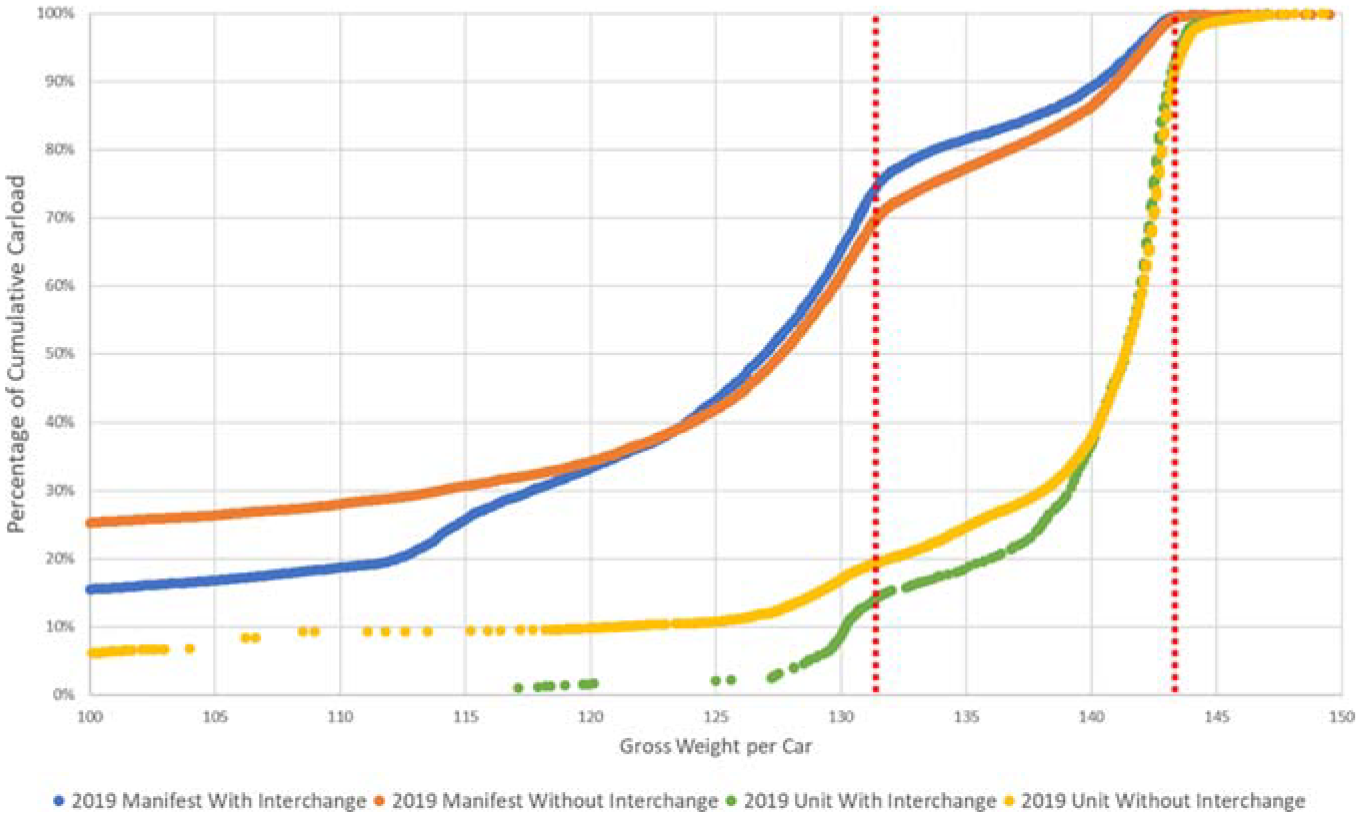
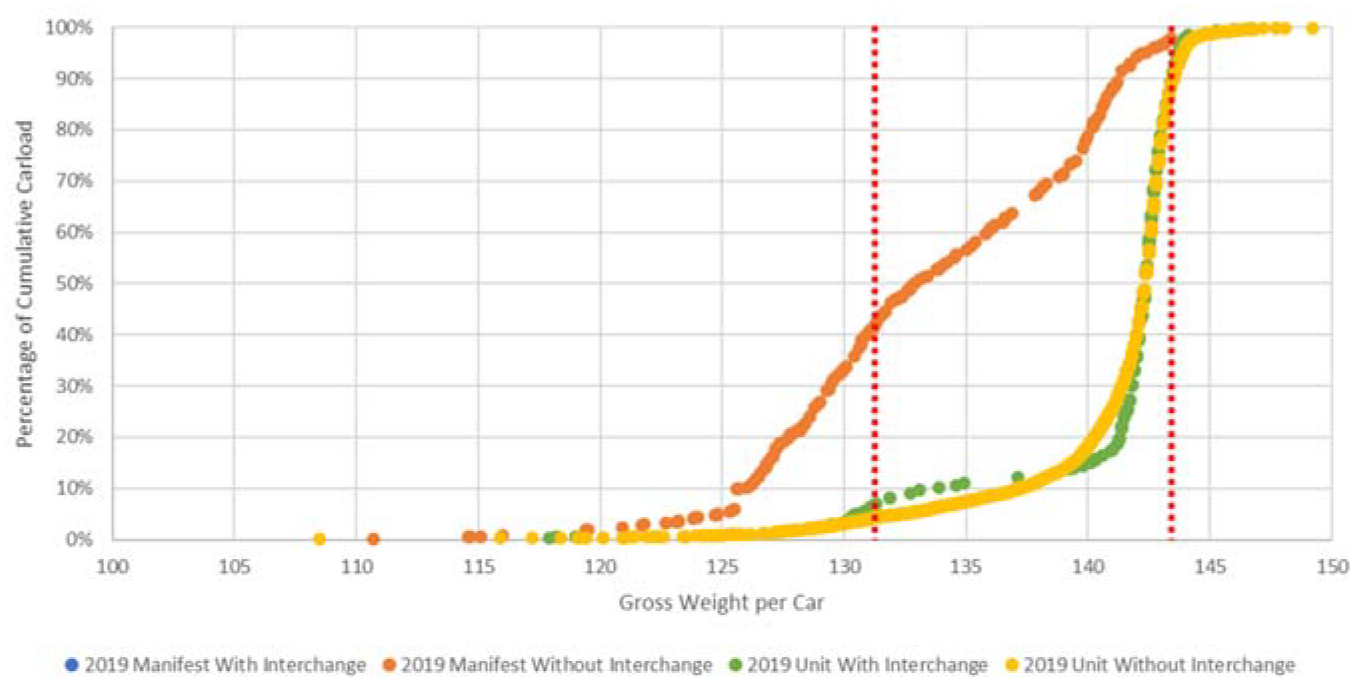
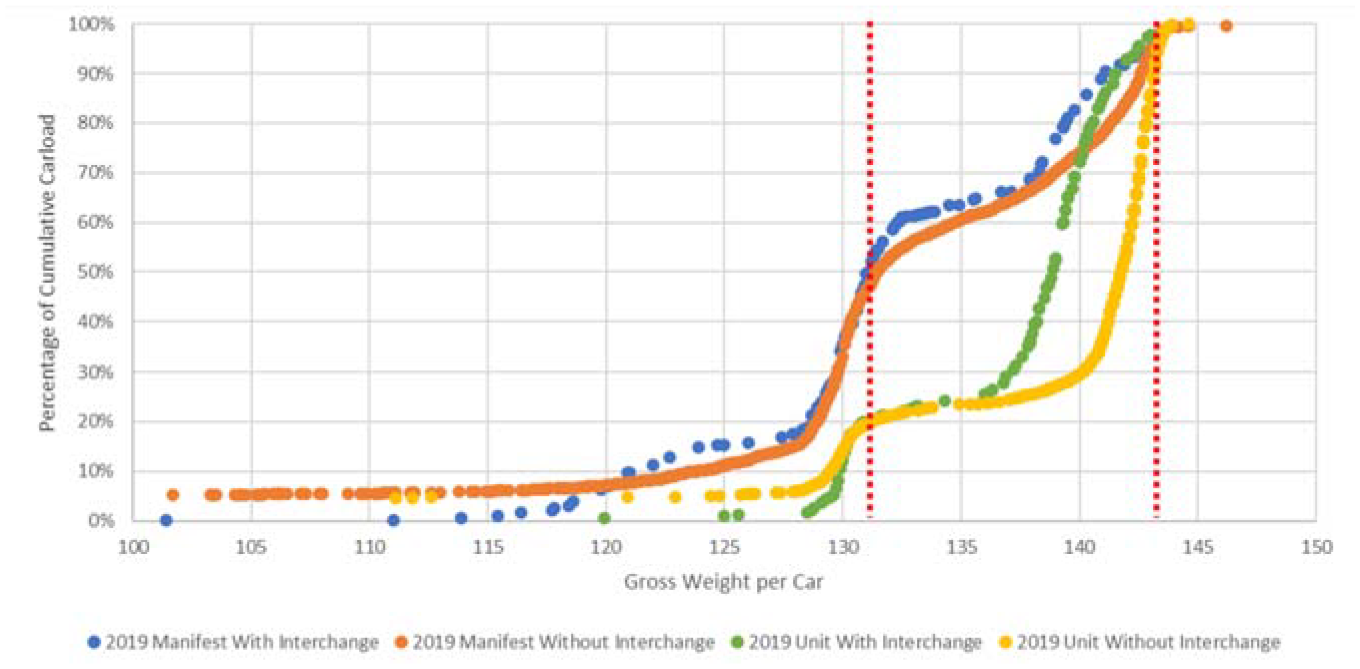
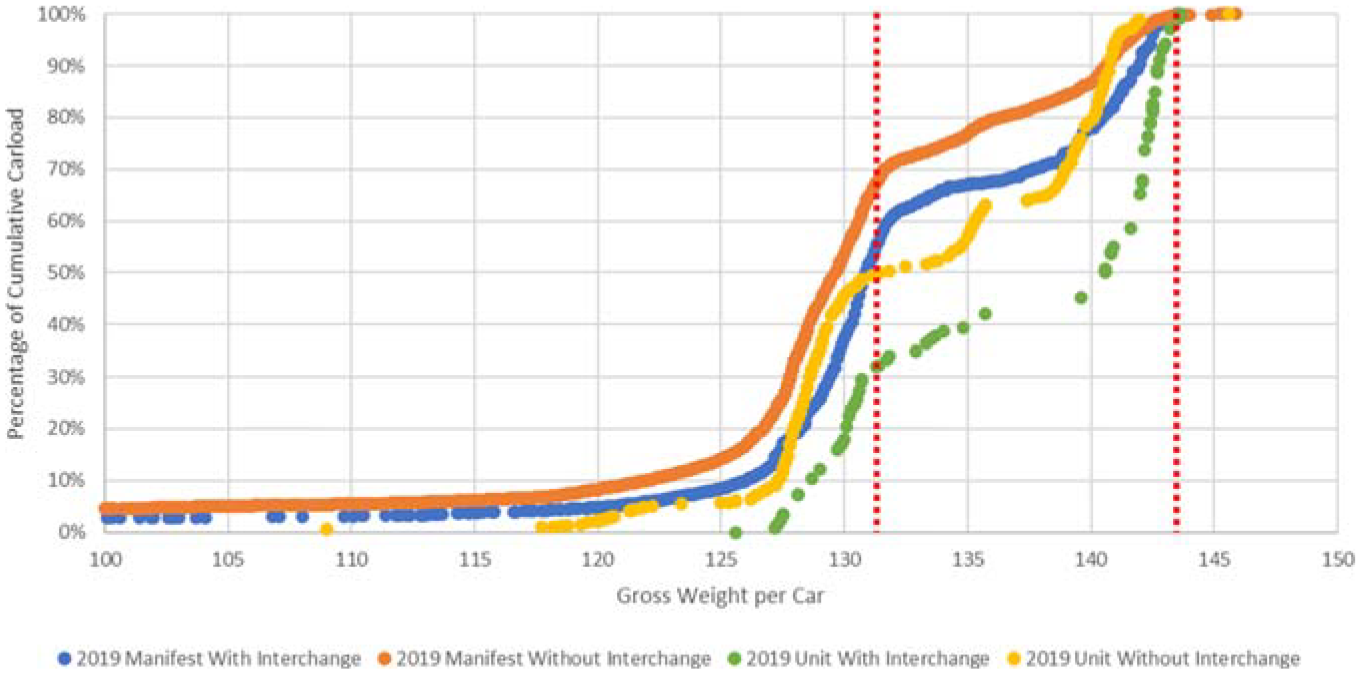
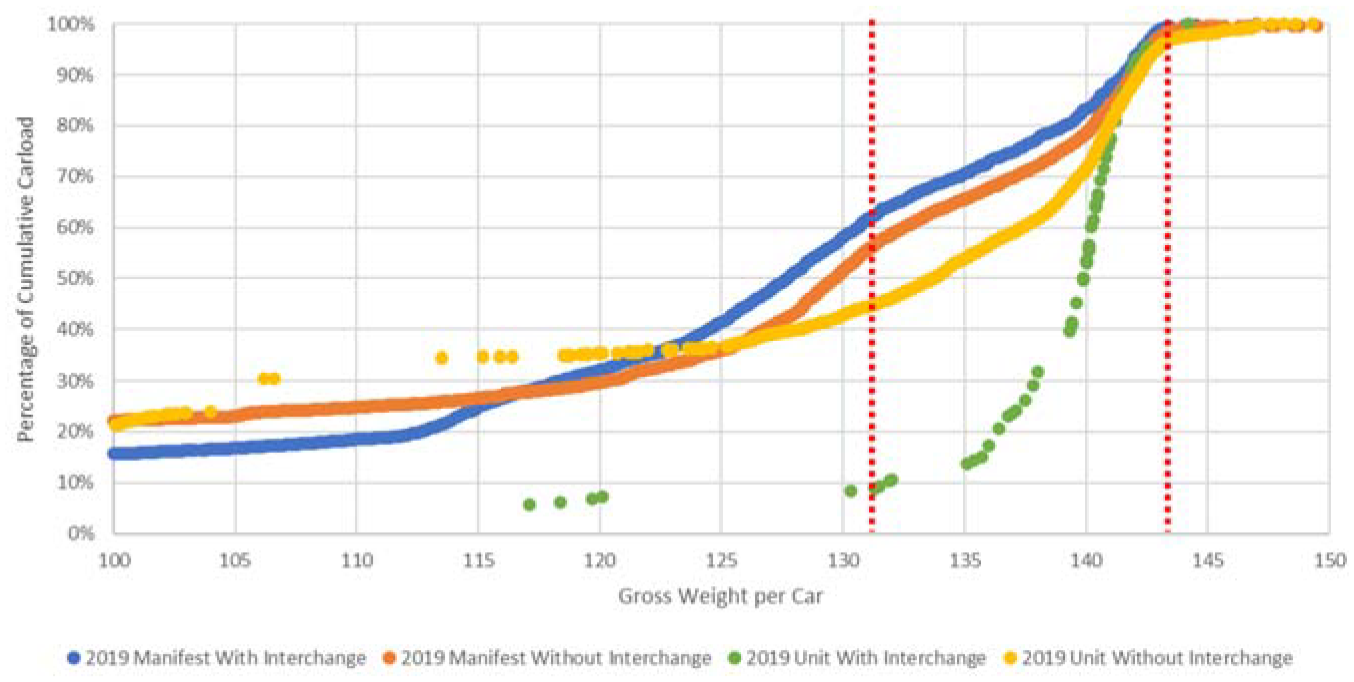
Cumulative distribution of carloads by gross railcar load for different train operating types (2019).
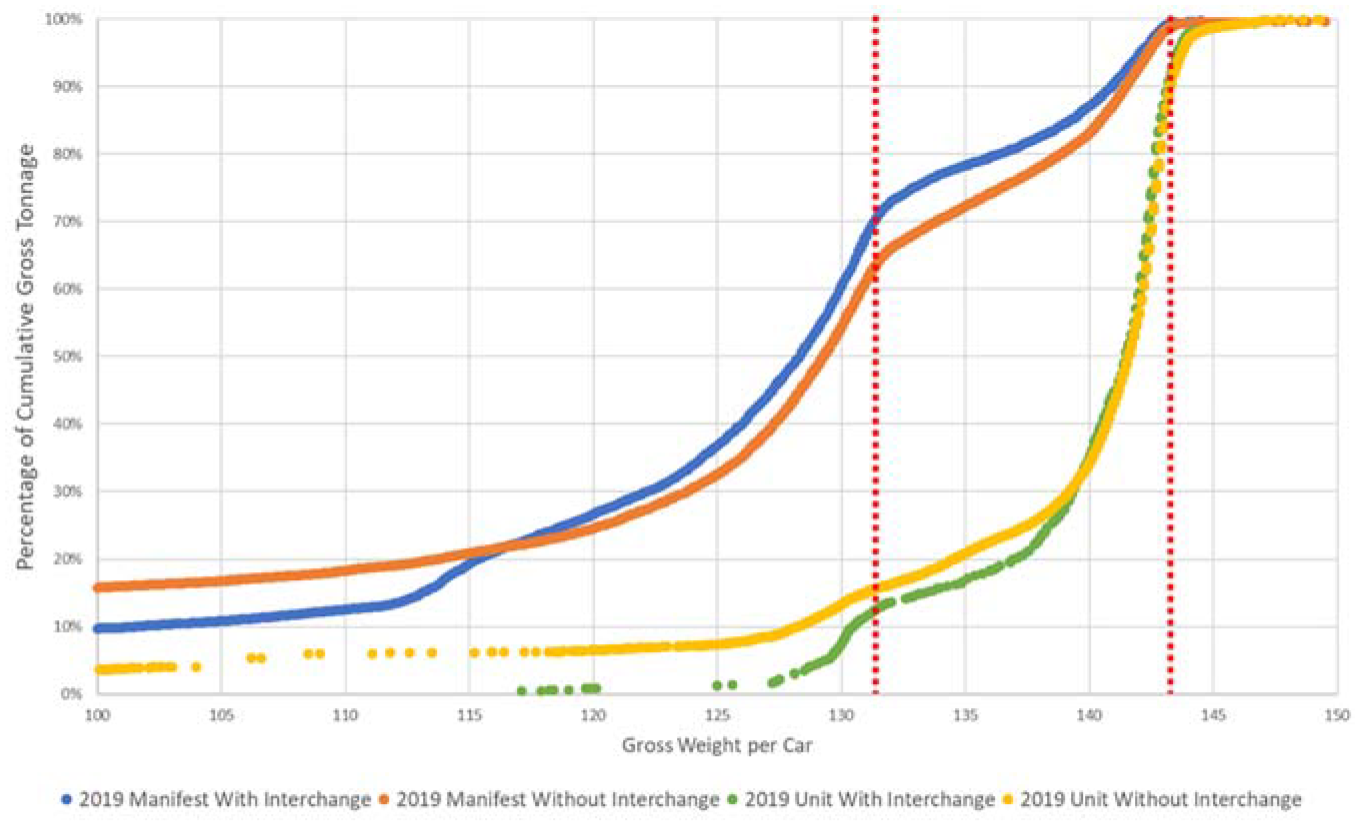
Cumulative distribution of tonnage by gross railcar load for different train operating types (2019).
In 2019, 70% of unit train shipments are observed to be 143-ton (286k GRL) railcars in relation to carloads (Figure 1), whereas manifest trains have a more diverse tonnage profile, with about 55% of carloads reaching the 131.5-ton (263k GRL) mark and 20% of carloads reaching 143-ton boundary. Given that each carload at higher GRL contributes more gross tons per shipment, the cumulative distribution of gross tonnage across railcar weights and train operating types (Figure 2) further emphasizes the contributions of the heavier railcars toward the total gross tons of traffic experienced by the track infrastructure within the national rail network. Over 80% of gross tonnage accumulated by unit trains is by railcars operating at 286k GRL and corresponding axle loads.
Interchange does not show much of a difference in the overall GRL distribution for 2019. The shipments with interchange operations seem to have fewer low and high-tonnage outliers on both ends of the curves, whereas shipments without interchanges are distributed throughout the horizontal axis.
Cross-year Total Traffic Comparison for Different Train Types
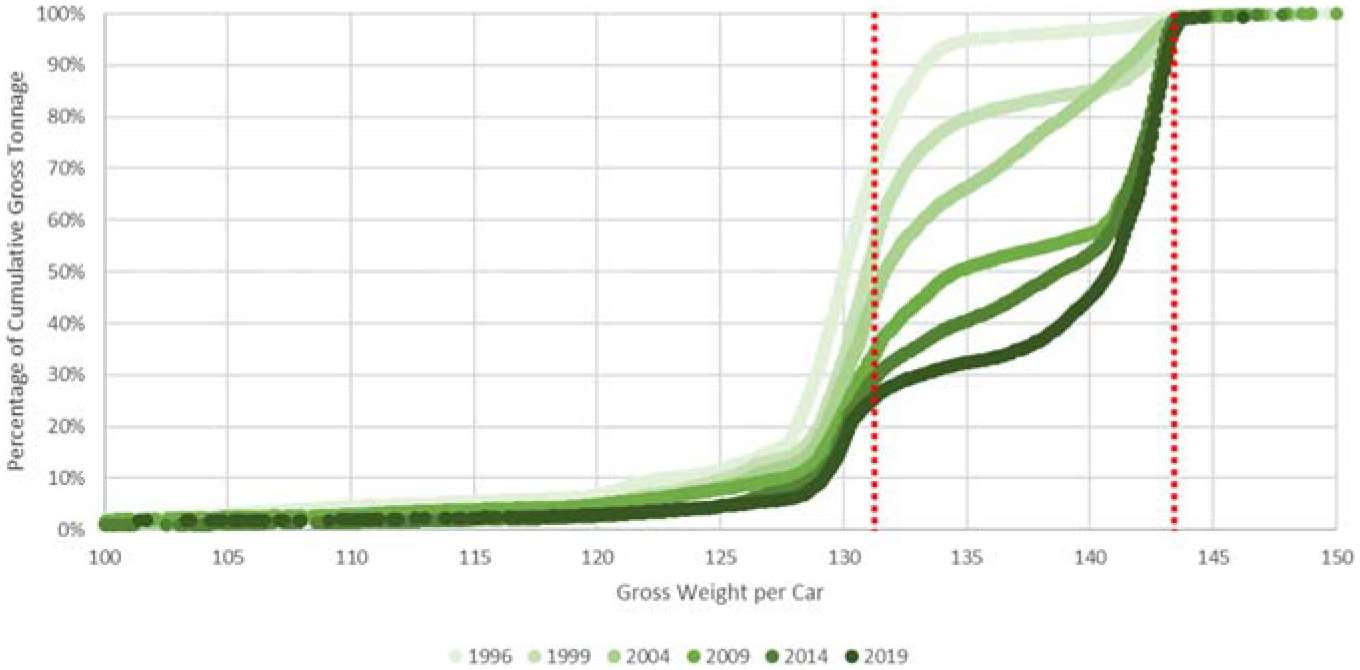
After observing the differences between different train operating types for 2019, separate studies for different train operating types were conducted to explore the GRL trends over time within each train type (Figures 3–6). In general, the railroads are steadily shifting from 131.5-ton-cars toward 143-ton-cars as the main freight carrier. The starkest transition over time is exhibited by unit trains without interchange (Figure 3), with the percentages of 131.5-ton-car and 143-ton-car essentially being transposed through the 24 years of evolution. In 1996, unit trains without interchange exhibited the largest proportion of tonnage moving in 286k GRL railcars (approximately 25%) compared with the other train operating types. The proportion of 286k GRL railcars in unit trains without interchange steadily increases over the next 13 years before the rate of adoption begins to slow over the last 10 years of the study period (2009 to 2019) and settling in the range of 75% 286k GRL by tonnage.
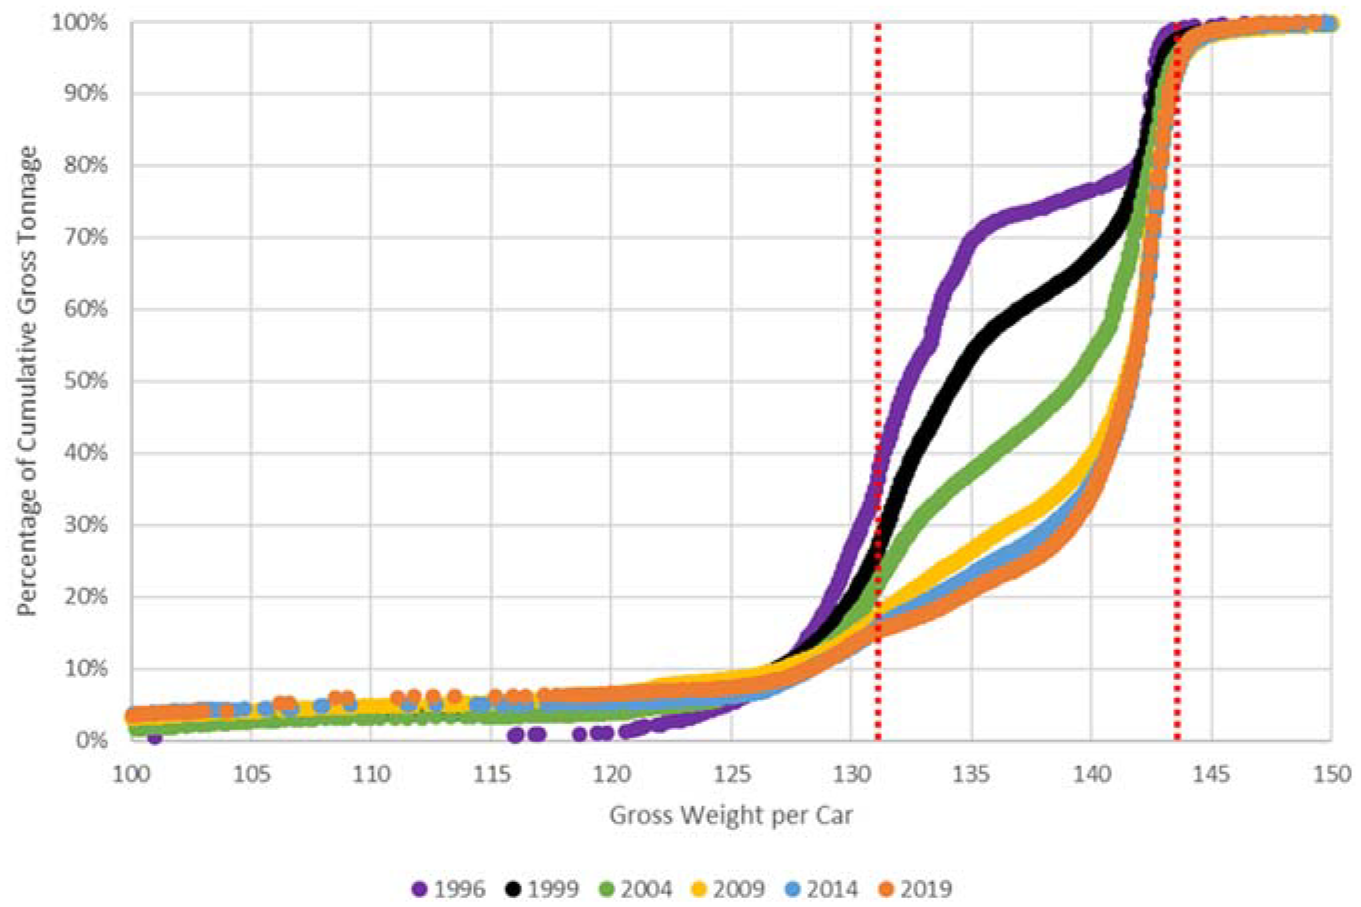
Cumulative tonnage distribution by gross railcar load—unit trains no interchange (1996–2019).
Cumulative tonnage distribution by gross railcar load—unit trains with interchange (1996–2019).
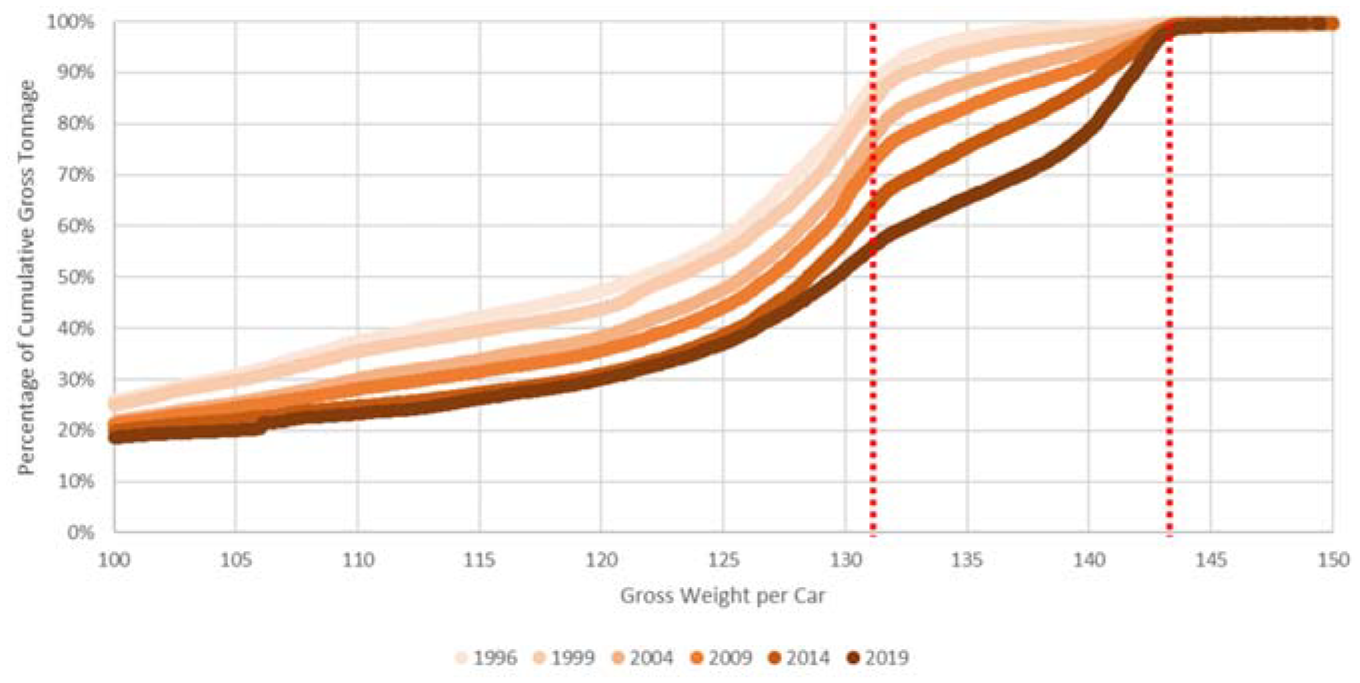
Cumulative tonnage distribution by gross railcar load—manifest trains no interchange (1996–2019).
Cumulative tonnage distribution by gross railcar load—manifest trains with interchange (1996–2019).
In comparison, the evolution of tonnage by GRL in unit trains with interchange exhibits a different trend (Figure 4). Despite not being approved for interchange until 1995, railroads were already moving around 25% of unit train interchange traffic in 286k GRL railcars in 1996. Presumably some of this traffic was already moving in interchange over fixed routes by special agreement between partner railroads before 1995. This is supported by the observation that the amount of 286K GRL unit train interchange traffic did not grow from 1996 and 2004 as railroads focused on their own single-carrier unit trains that likely provided greater returns while facing fewer coordination obstacles.
However, between 2004 and 2009, there is a sudden jump in the amount of unit train interchange traffic moving in heavier railcars, consistent with the period immediately after new 286k GRL railcar design standards for interchange were adopted by the railroads. It appears that the railroads quickly applied these new standard railcars to the easiest unit train interchange services to convert before the rate of adoption slowed to match that of non-interchange unit trains.
Manifest trains (Figures 5 and 6) exhibit a lower initial deployment and much slower shift to 286k GRL than unit trains. In 1996, less than 10% of manifest train tonnage without interchanges moves at 286k GRL (Figure 5) with even less manifest train interchange traffic moving in heavier railcars (Figure 6). For both types of manifest train traffic, there is little growth in 286k GRL traffic from 1996 to 2004 when the new railcar standards are adopted for interchange. However, during the same 2009 to 2019 period when the 286k GRL share of unit train tonnage exhibits a plateau, both manifest train interchange and non-interchange traffic start to experience faster rates of 286k railcar adoption. This trend may reflect a combination of the approval of hazardous materials transportation in 286K GRL tank cars in 2011 and the railroads shifting resources from developing their 286k GRL unit train capabilities to other commodities, railcar types, and routes in their networks. Still, the manifest train tonnage share of 143-ton-cars is still in the range of 25% to 30% for the year 2019, with adoption rates for interchange traffic lagging behind non-interchange traffic during all years except 2014 when they are nearly equal.
Commodity-Specific Trends
Separate studies on single commodities are conducted to illuminate trends that are hidden in the all-commodity study. In hope of discovering unique interactions between commodities and certain train operating types, GRL distributions are presented for each commodity type and different train operating types for the 2019 dataset. However, for each commodity, the cross-year study is conducted with all train types combined. This is done because individual commodities tend to be dominated by unit trains or manifest trains depending on the shipment nature of the commodity under investigation, and the interchange operations are somewhat limited within each selected commodity. Only the cumulative tonnage distributions by GRL are provided for each commodity to reduce the number of similar figures.
Coal Traffic and GRL Trends
Interchange operations only occurred in 5.7% of coal shipments (Table 3) compared with 7.5% of all shipments. The more significant finding is that 97.9% of coal shipments are transported by unit trains.
Number of Carloads in Millions for Coal Shipments in 2019
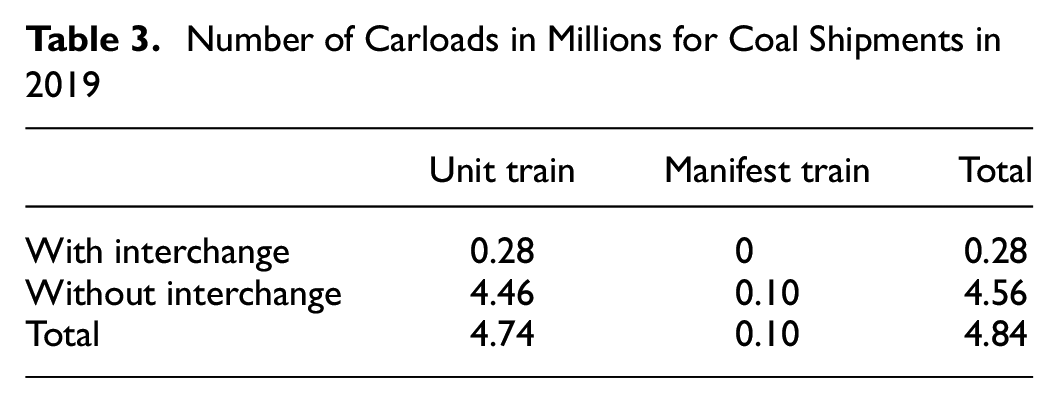
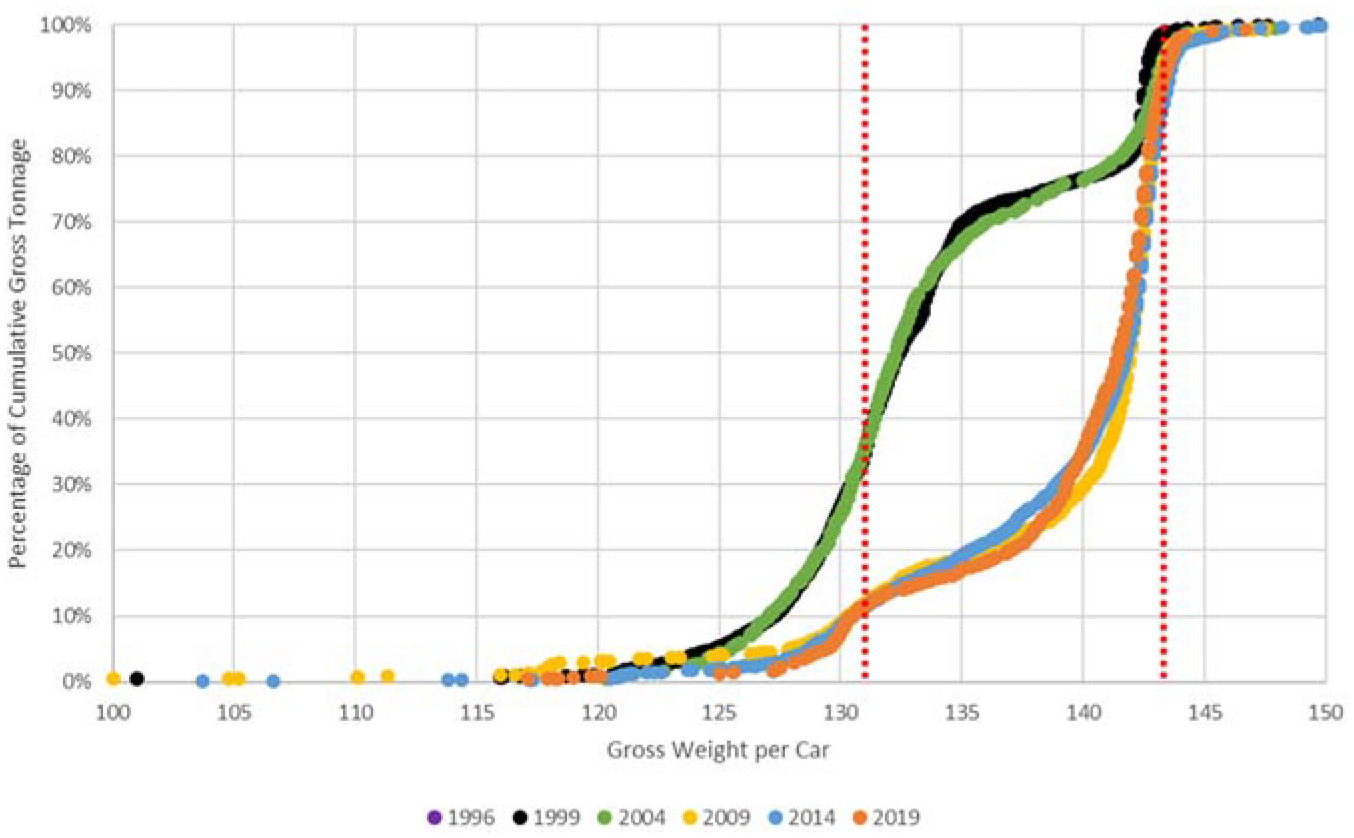
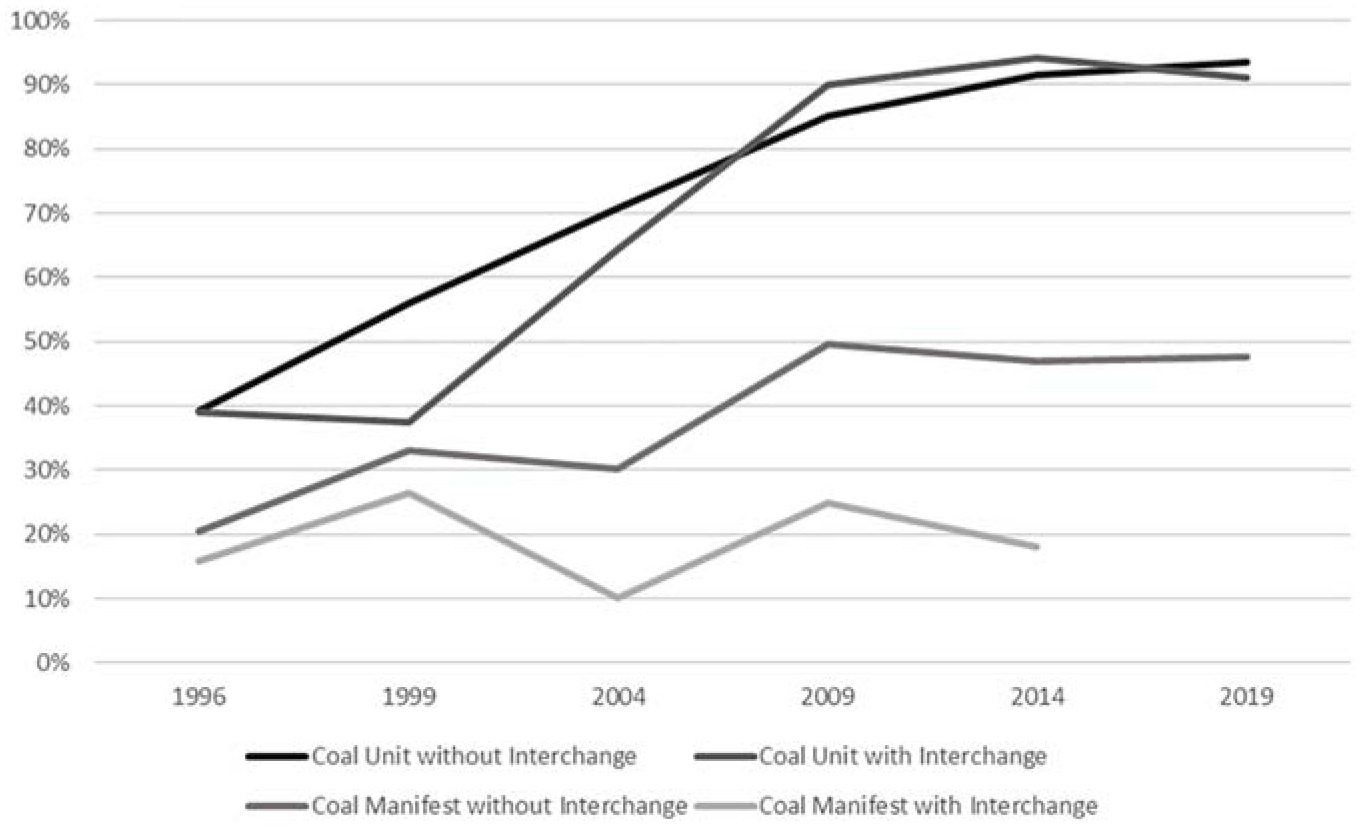
The cumulative distribution of coal shipment carloads by GRL for different train operating types in 2019 (Figure 7) indicates that unit trains are almost always utilizing the 143-ton (286k GRL) railcars, whereas manifest trains feature GRLs almost evenly distributed from 125 to 143 tons, showing distinct distributions compared with the all-commodity graphs. Plotting the cumulative distribution of coal shipment tonnage by GRL across years (Figure 8) reveals a consistent and clear trend, indicating the carload shift from 131.5-ton-cars to 143-ton-cars is decisive and relatively fast with little increase in GRL since 2014 when the majority of the railcars are already 143-ton-cars. Examining the 286k GRL adoption percentages for different train operating types over time (Figure 9) reinforces this trend. Because of their low volume, the manifest traffic trends for coal are not representative, but the unit trains show a steady and rapid adoption rate for 143-ton-cars with little gain in recent years, consistent with the findings of Martland ( 4 ) who suggested all coal had shifted by 2012. The role of interchange is not easy to interpret for coal traffic, partially because of the limitation of sample size, but is consistent with a lower adoption rate when interchange is involved and when coal travels more freely across the network in manifest trains as opposed to unit trains on fixed routes that are more readily and economically upgraded to handle dedicated volumes of 286k GRL traffic.
Cumulative distribution of coal shipment tonnage by gross railcar load for different train operating types (2019).
Cumulative coal shipment tonnage distribution by gross railcar load for all trains (1996–2019).
Adoption rate of 286k gross railcar load for coal shipments by train operating type (1996–2019).
Field Crops Traffic and GRL Trends
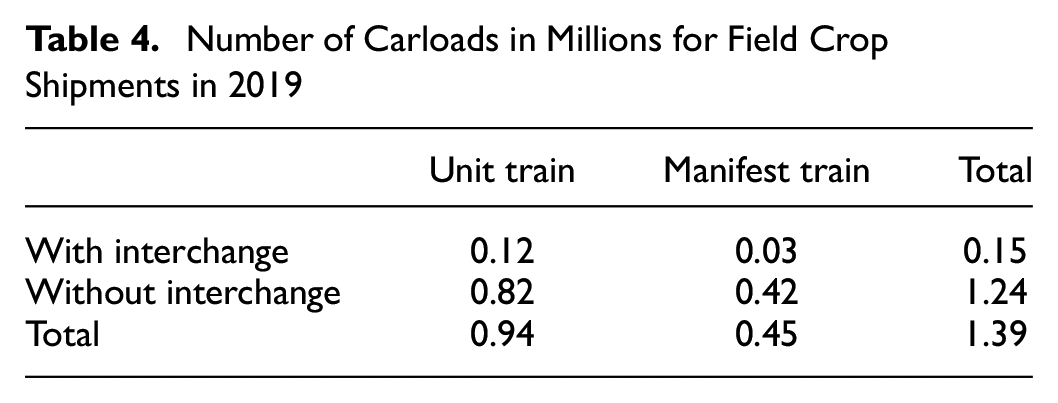
Interchange operations occurred in 10.6% of the field crop shipments (Table 4), a slightly higher percentage compared with the 7.5% interchange rate for all shipments. This result is consistent with the use of shortlines to provide interchange service on low-density lines serving agricultural areas. Unit trains transport 67.5% of field crops shipments compared with 44.1% for all commodities.
Number of Carloads in Millions for Field Crop Shipments in 2019
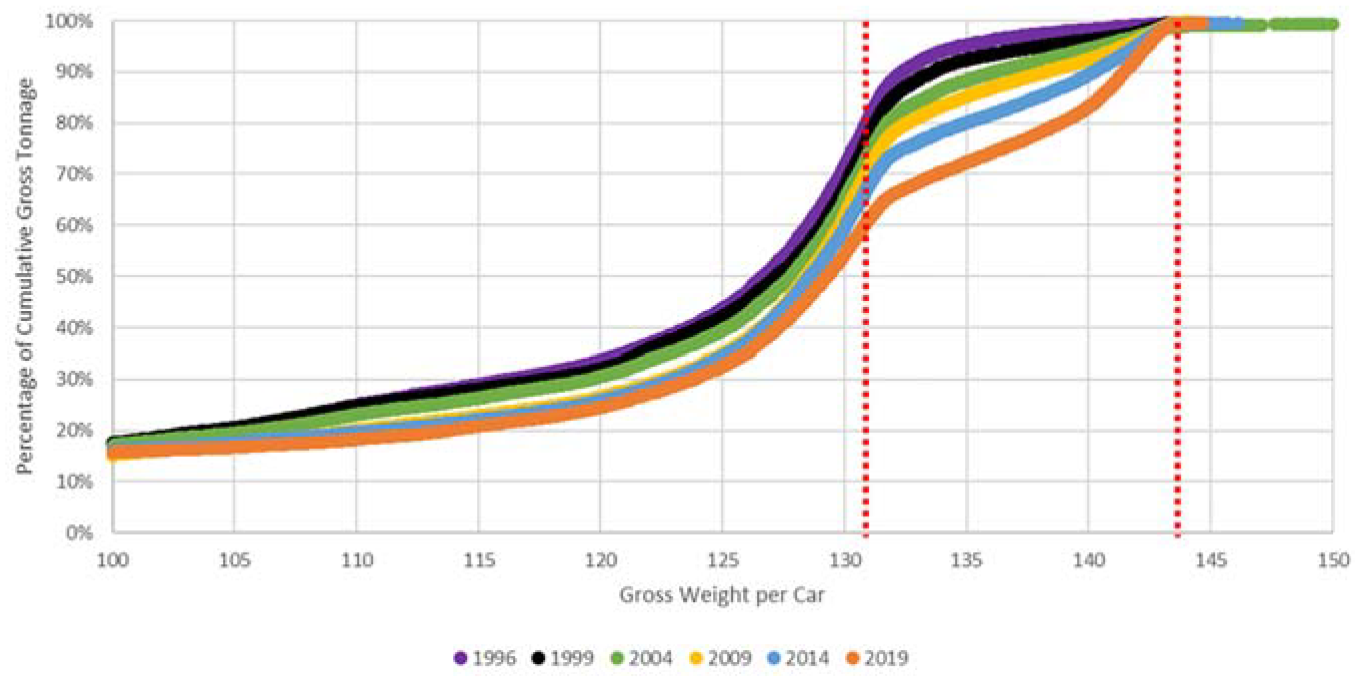
The cumulative distribution of field crop shipment carloads by GRL for different train operating types in 2019 (Figure 10) reveals significant differences between manifest trains and unit trains, whereas the effect of interchange operations is negligible. About 80% of all unit train shipments are 286k GRL, whereas the 286k GRL percentage in manifest trains is 35%. These percentages and overall curves are similar to the all-commodity graphs shown earlier in this study. Plotting the cumulative distribution of field crop shipment tonnage by GRL across years (Figure 11) reveals that few 143-ton railcars were used to ship field crops in 1996. However, over time, the 131.5-ton cars have been slowly and constantly replaced by 143-ton-cars, consistent with the earlier work of Prater and O’Neil ( 5 ).
Cumulative distribution of field crop shipment tonnage by gross railcar load for different train operating types (2019).
Cumulative field crop shipment tonnage distribution by gross railcar load for all trains (1996–2019).
Examining the 286k GRL adoption percentages for different train operating types over time (Figure 12) indicates differences for the train types. Unit trains without interchange exhibited the fastest adoption but seem to have reached a steady state plateau in 2009, whereas the share of 286k GRL field crop shipments with interchange and shipped in unit trains has nearly doubled since 2009. Manifest train shipments exhibit a near linear increase in 286k GRL railcar tonnage over the entire study period, but have still only reached 35%–40%. Considering that many of these manifest train (with and without interchange) and unit train interchange shipments may involve shortlines, this finding is consistent with continued efforts to upgrade low-density and shortline trackage to handle 286k GRL shipments. As the public waybill data do not include freight station-level origins and destinations or the specific railroads involved, it is difficult to further explore the definitive role of shortlines in 286k GRL adoption for field crop traffic via each of these train operating types.
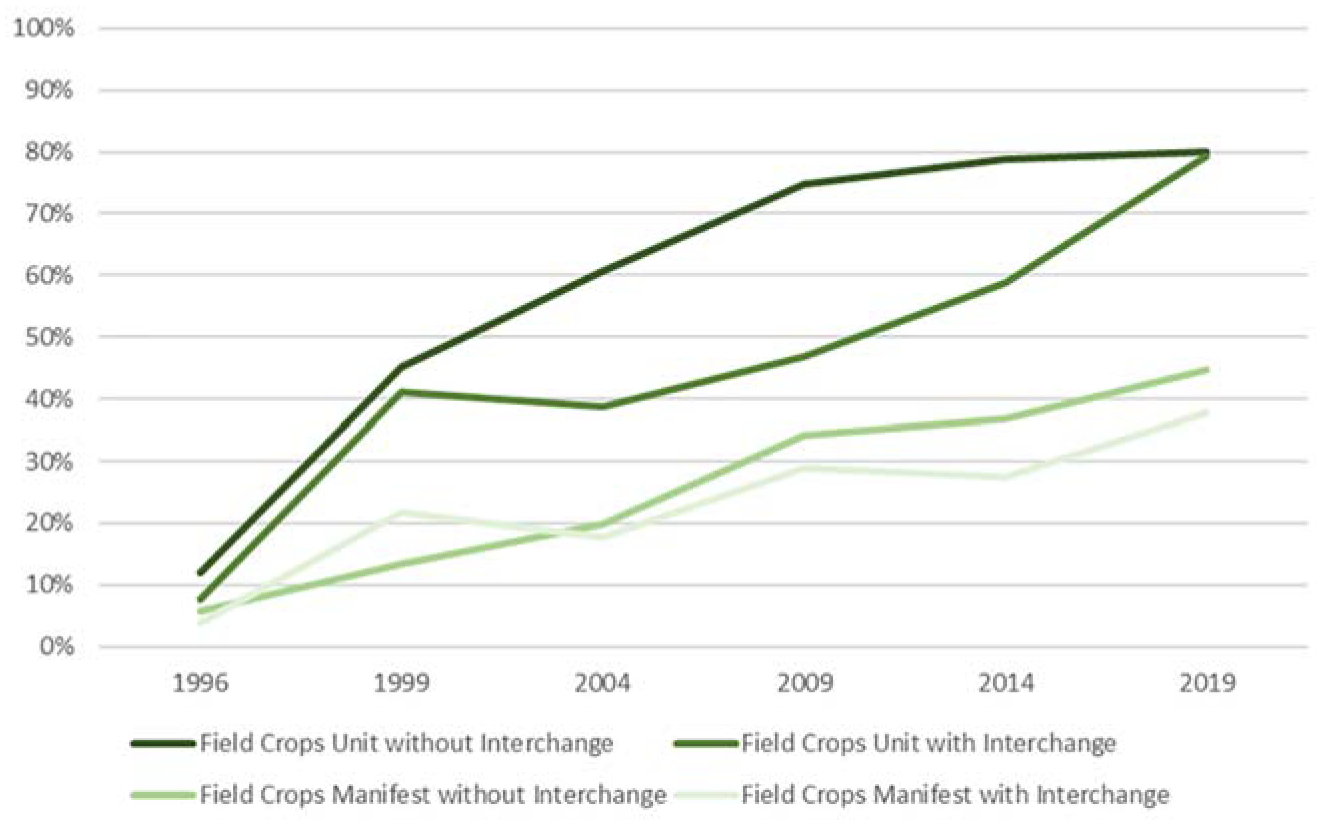
Adoption of 286k gross railcar load for field crop shipments by train operating type (1996–2019).
Chemical Traffic and GRL Trends
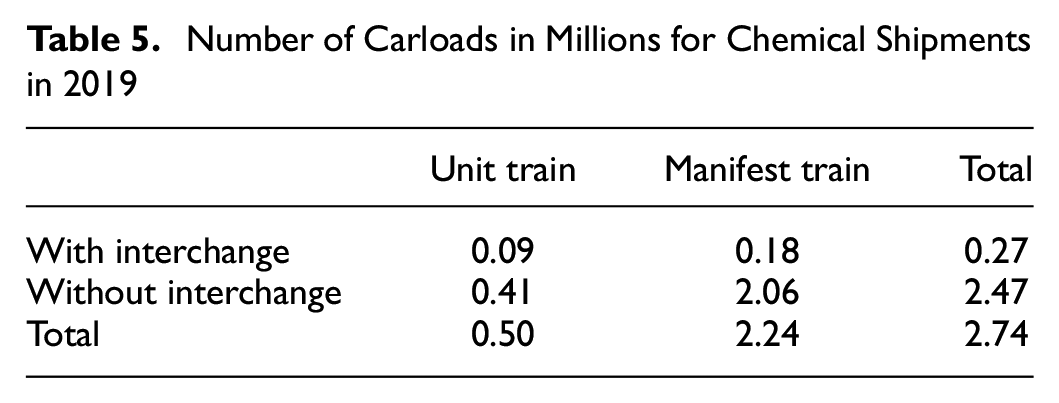
Interchange operations occur in 10.0% of chemical shipments (Table 5), a slightly higher percentage compared with all shipments. Manifest trains transport 90.0% of chemical shipments, compared with 55.9% for all commodities.
Number of Carloads in Millions for Chemical Shipments in 2019
The cumulative distribution of chemical shipment carloads by GRL for different train operating types in 2019 (Figure 13) indicates that there are less significant differences between unit trains and manifest trains compared with the other commodities, but chemical shipments in unit trains have slightly higher tonnage per car in general. Similar observations can be made for interchange operations, as the shipments involving interchange exhibit slightly higher tonnage per car compared with those without interchange operations for both train types. This trend in the role of interchange is exactly opposite that observed for coal and field crops during 2019, with chemical traffic being more likely to be transported in more efficient 286k GRL railcars when interchange is involved.
Cumulative distribution of chemical shipment tonnage by gross railcar load for different train operating types (2019).
As tank cars carrying hazardous materials were largely limited to 263k GRL before 2011 ( 9 ), the results were expected to show few chemical shipments over 131.5 tons before 2014. Plotting the cumulative distribution of chemical shipment tonnage by GRL across years (Figure 14) reveals little progress in shifting from 263k to 286k GRL throughout the earlier years. Growth from 2014 to 2019 is relatively rapid compared with previous years, potentially as a result of the removal of restrictions on 286k GRL hazmat shipments in 2011 and possibly indicating greater shifts to 286k GRL in the near future.
Cumulative chemical shipment tonnage distribution by gross railcar load for all trains (1996–2019).
Examining the 286k GRL adoption percentages for different train operating types over time (Figure 15) further confirms the observations from Figure 14 that all train types exhibit increasing adoption rates of 143-ton-cars, with strong increasing trends over the past 10 years. An exception to this trend is the rapid adoption of 286k GRL by chemical traffic in unit trains with interchange from 1999 to 2004. However, this train operating type would have involved a small amount of traffic and limited number of commodities during this period, with molten sulfur being a primary example ( 2 ).
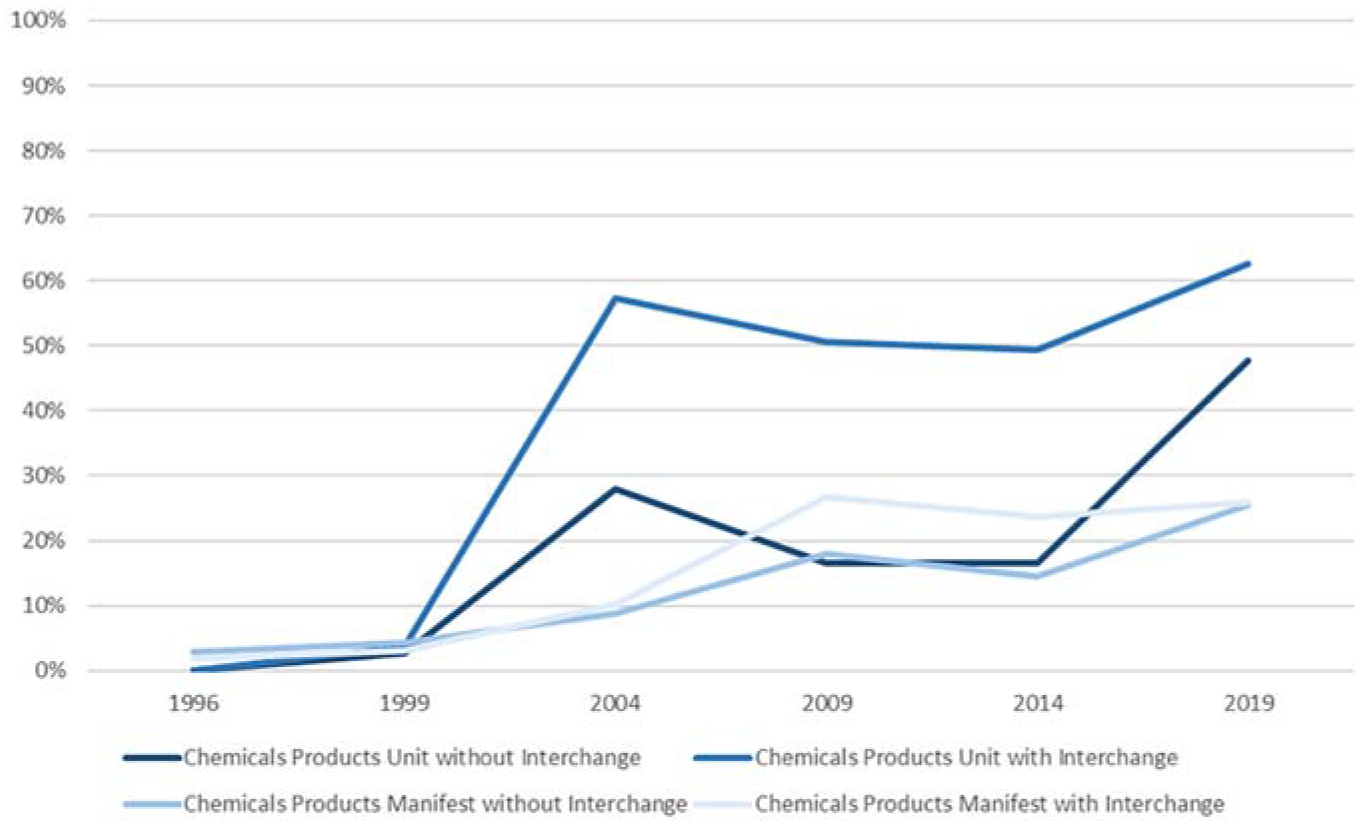
Adoption of 286k gross railcar load for chemical shipments by train operating type (1996–2019).
Other Commodity Traffic and GRL Trends
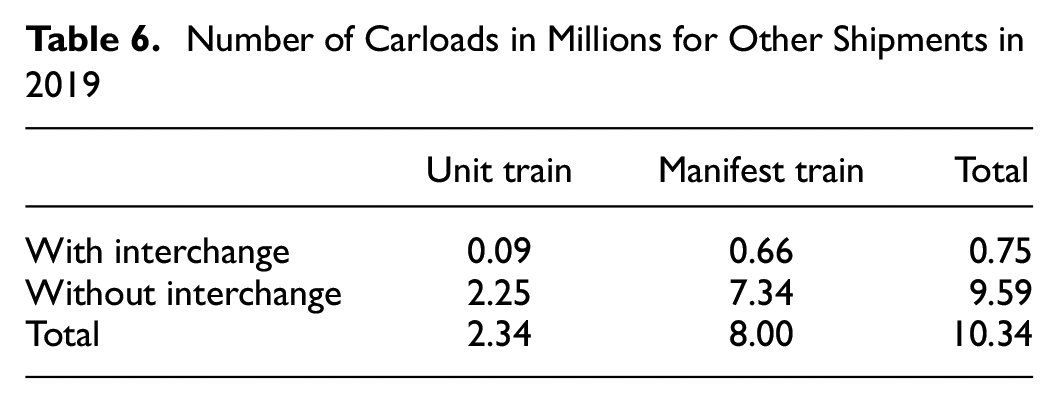
All other commodities excluding intermodal traffic are summarized in the Other Commodity category. Interchange operations occurred in 7.3% of the other non-intermodal shipments (Table 6), and manifest trains transport 77.4% of these other shipments, compared with 55.9% for all commodities, indicating these other commodities include many items that are rarely shipped in unit trains. Further research can be conducted if additional commodity types draw industry attention in the future.
Number of Carloads in Millions for Other Shipments in 2019
The cumulative distribution of other shipment carloads by GRL for different train operating types in 2019 (Figure 16) indicates that almost one-third of unit trains without interchange are shipping lower than 110 tons per car. The unit trains with interchange have a limited number of inputs; however, they are also very consistent at around 140 tons per car. There is not enough information and evidence to determine if the interchange operations have higher tonnages in general, but interchange has less of an impact on the dominant manifest train traffic.
Cumulative distribution of other shipment tonnage by gross railcar load for different train operating types (2019).
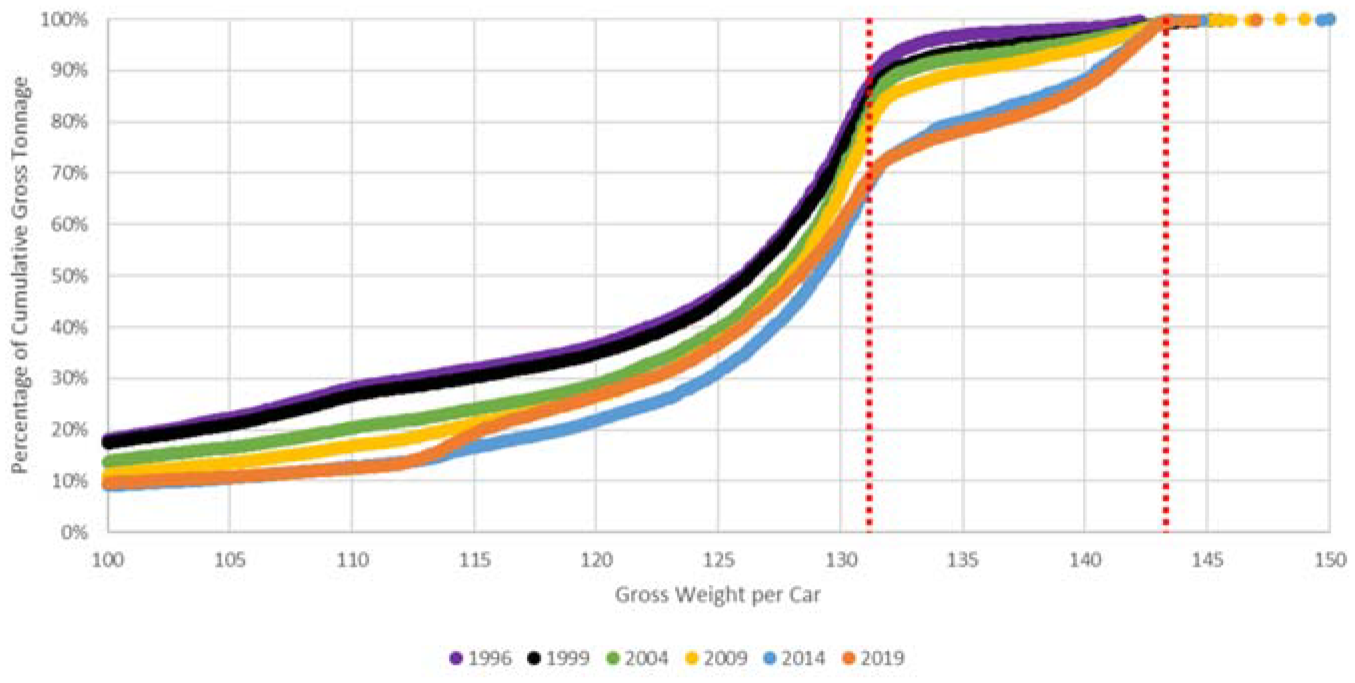
Plotting the cumulative distribution of other shipment tonnage by GRL across years (Figure 17) reveals a slow but steady trend of 131.5-ton-cars being replaced by 143-ton-cars, whereas the lower tonnage traffic is constant throughout the years. Further study is required to determine the nature of these lower tonnage cars and the exact commodities carried. Almost no traffic in this other category was moving at 286k GRL in 1996, and by 2019 the 286k GRL shipments had only grown to be approximately 30% of this other tonnage. Unlike chemicals that were subject to regulatory restrictions on hazmat shipments before 2011, the low adoption rate of other shipments must be related to other factors. Whereas coal and field crops involve bulk commodities that move in gondola, hopper and covered hopper cars that were among the first car types upgraded to 286k GRL, many of these “other” shipments may be naturally constrained in their overall shipment weight, such a finished motor vehicles or auto parts, or require plain boxcars or specialized railcar types that were not among the earliest to be converted to 286k GRL. The challenging economics of boxcar ownership may have substantially delayed the introduction of 286k GRL boxcars appropriate for important traffic sectors such as paper, plywood, and other forest products that fall into this other traffic category but do not lend themselves to unit trains because of diversity of origins and destinations served within each market.
Cumulative other shipment tonnage distribution by gross railcar load for all trains (1996–2019).
Examining the 286k GRL adoption percentages for different train operating types over time (Figure 18) indicates all types of traffic have increased their proportions of carloads shipped by 143-ton-cars. Unit trains with interchange exhibits the fastest increase but is an outlier as it only includes a limited number of shipments in total. The low, but slowly increasing, adoption rates of manifest train traffic again speak to the challenges of converting more general “loose carload” freight to 286k GRL because of a combination of the need to upgrade a more diverse set of network routes, often including lower-density lines than those used for bulk commodity unit train traffic, and a broader set of railcar types, some of which are fleets that experience lower utilization and slower turnover and renewal compared with bulk commodity cars in high-utilization dedicated unit train service on a limited set of fixed routings.
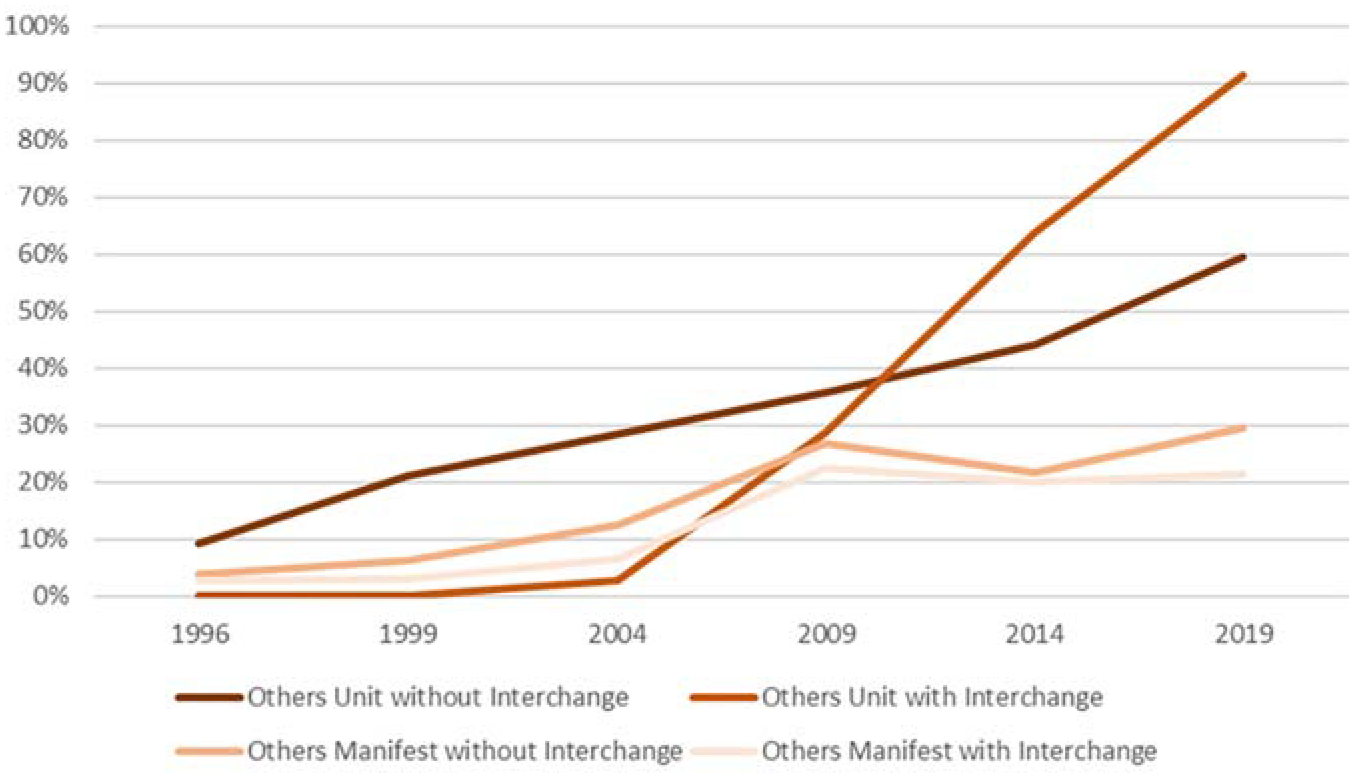
Adoption rate of 286k gross railcar load for other shipments by train operating type (1996–2019).
Conclusions and Future Work
Quantitative analysis of freight railroad statistics provided by the STB waybill sample data provides convincing proof that the railroads have been shifting carload gross tonnage from 263k GRL to 286k GRL since 1996. The all-commodity (excluding intermodal) shipments analysis confirmed the hypothesis that lower tonnage cars are contributing less in relation to total tonnage percentage, a declining pattern that is consistent from 1996 to 2019.
Separating traffic data by train operating type provides insights into its influence on the heavier car adoption process. Unit trains tend to ship heavier carloads and exhibit faster rates of adopting heavier 143-ton-cars than manifest train types. The analysis does not provide strong evidence that interchange operations influence the adoption of heavier carloads. Although slightly heavier carloads are observed for interchange with certain commodities, the pattern is not universal. However, the shipments involving interchange operations do have a more consistent tonnage profile, being more condensed toward certain tonnages compared with shipments without interchange that tend to have a wider and consistent distribution of GRL.
Commodity type is another major factor distinguishing the adoption of 286k GRL, and separating shipments by commodity types provides deeper insights into this behavior. Coal and field crops shipments have higher gross tonnages than chemical products and other commodities. The commodities with higher weight per car are also the ones that tend to have reached a steady state adoption rate, as converting additional freight shipments to 286k will require more substantial infrastructure investments, operational changes, or both. Commodities exhibiting lower weight per car also tend to have more rapidly increasing 286k GRL adoption rates. This information can help researchers and industry to predict future traffic trends and plan for future traffic shifts to 286k GRL when new technologies are implemented. This study can also aid the industry by providing an up-to-date quantitative foundation for assessing the benefits and disadvantages of further infrastructure and rolling stock investments required to facilitate shipping additional freight traffic at heavier 286k GRL. The efficiency gains possible through further shifts of freight traffic to 286k shipments and the compounding benefits resulting from additional modal shift from truck to rail should be weighed against other potential technologies for decarbonization of freight shipments and their associated costs and benefits.
Although this data analysis provides detailed and diverse information on the nature of U.S. freight rail shipment GRL over time, this analysis may not capture all of the evolving patterns because of the data sampling years and the limitation of public waybill sample data. Although analytical evidence suggests that railroads are not utilizing interchange operations for much traffic (as definitively reported in the waybill data), this study acknowledges that rebilling within the waybill data may be masking many interchange shipments. Further research with the full confidential STB waybill sample dataset (if made available) is required to more fully understand the magnitude of rebilling and potential for additional interchange shipments to alter trends observed for each train operating type across the various commodity groups studied. In addition, access to the full confidential STB waybill sample dataset with specific railroad reporting marks, origin/destination station locations, and interchange locations would allow for future investigation of the role of shortlines and their interchange patterns with Class I railroads on the adoption of 286k GRL railcars across different traffic and train operating types. The rebilling issue and inability to identify shortline traffic in the presented distributions are two key limitations of this analysis.
Further research can be conducted to discover trends from other commodities and to investigate unique shipping patterns such as lower tonnage cars. The intermodal shipments of containers and trailers excluded from this analysis also have their unique shipment weight and distance patterns and trends over time, which can be investigated and combined with this research to provide a more comprehensive understanding of the operations of U.S. freight railroads and associated goods movement.
Footnotes
Author Contributions
The authors confirm contribution to the paper as follows: study conception and design: Diwen Shi, Tyler Dick; data collection: Diwen Shi; analysis, and interpretation of results: Diwen Shi; draft manuscript preparation: Diwen Shi, Tyler Dick. All authors reviewed the results and approved the final version of the manuscript.
Declaration of Conflicting Interests
The author(s) declared no potential conflicts of interest with respect to the research, authorship, and/or publication of this article.
Funding
The author(s) disclosed receipt of the following financial support for the research, authorship, and/or publication of this article: This research was partially supported by Association of American Railroads (AAR) and the Department of Civil, Architectural and Environmental Engineering at the University of Texas at Austin.