
Abstract
On North American freight railways, railcars transported in manifest (carload) freight trains are required to stop and be resorted at multiple intermediate classification (marshalling) yards before reaching their destination. Yard dwell time comprises the majority of total railcar transit time, and railway yard congestion can further promote mainline train delay. However, most of the literature on railroad performance has focused on the mainline, and few of the previous yard studies specifically examined the yard performance impacts of vast volume fluctuation because of variable shipping demand. To further understand yard behavior under these conditions, this paper explores the influence of inbound traffic volume variability on classification yard performance and outbound train size using a novel AnyLogic simulation model. A series of simulation experiments quantify the interaction between inbound and outbound train size variability as measured by different yard performance metrics under different overall traffic volumes and blocking patterns. The results quantify the impact of volume variation on railway classification yard level of service, and suggest that forming longer blocks leads to shorter dwell times but larger sensitivity to volume variation compared to forming multiple short blocks. Comparison of arrival and departure train size distributions indicates that classification yards moderate volume fluctuations while causing departure delays. These results serve as a quantitative foundation for further study of yard performance recovery patterns following traffic volume surges and the resulting interactions between yards and mainlines in the railway network, and can inform railroad operating plan adjustments to better manage yard traffic and utilize existing resources.
According to the Surface Transportation Board (STB) R-1 reports ( 1 ), more than 6000 manifest (carload) freight trains arrive and depart from railway classification (marshalling) yards in the U.S.A. each day. The nature of manifest train freight shipment requires railcars arriving at a yard from multiple origins and bound for different destinations to be resorted and classified into trains departing for common intermediate destinations. The switching (shunting) and processing at these intermediate classification yards results in yard dwell time accounting for approximately 59% of total railcar transit time for carload shipments moving in manifest trains ( 2 ). As such, reducing yard dwell is an effective way to decrease total railcar transit times.
Managing and utilizing yard resources is a vital strategy to optimize railway classification yard operations. Although resources are more valuable and easier to manage in a stable environment ( 3 ), a railway yard functioning as a node connecting multiple mainlines is prone to variations across the rail network. As a result, actual traffic patterns at railway yards display daily, weekly, seasonal, and random fluctuations that require wise adjustments to operating strategies ( 4 ). Previous researchers concluded that over-saturated traffic patterns (causing railcar and operational congestion) and under-saturated traffic patterns (resulting in railcars dwelling to meet minimum train sizes) both act to increase yard dwell time and the possibility of train delays ( 5 ). Besides delayed train departures, an additional complication is that the railway yard performance itself will feedback and interact with the mainline to further influence the overall railway level of service ( 6 , 7 ). Therefore, exploring how traffic variability affects railway performance and capacity within the network scope is crucial for railroads to improve operating strategies and provide reliable fright transportation ( 8 ). Despite the necessity of matching both line-haul and terminal capacity to traffic demands, most attention has been given to mainline operation where considerable research and analysis have been conducted by both industry and academia. However, fewer studies have been made to fundamentally understand railway yard capacity and performance, and how these performance relationships are linked to mainline and overall network performance.
Objective and Research Questions
To further understand the interaction between railway yards and the mainline within the rail network, the research in this paper seeks to quantify the impact of inbound volume variability on classification yard performance and outbound train size. By comparing inbound and outbound train size as well as yard performance metrics, this research addresses the following questions.
Does a hump classification yard amplify or dampen train-to-train, day-to-day, and week-to-week volume variability?
How does inbound traffic throughput volume fluctuation affect yard performance with various block formation patterns?
It is hypothesized that variability in inbound traffic volume and train size will cause the size of blocks (groups of railcars with the same destination) formed in the classification yard bowl tracks to vary correspondingly. This variation in block size will increase the likelihood of “over-length” blocks that exceed the length of their assigned classification tracks and require the use of extra spare tracks in the bowl for temporary storage. Assembling blocks from both their assigned and spare storage tracks will increase the complexity of the pull-down operation that moves railcar blocks to the departure yard, affecting overall yard performance. Missed connections and delays in the train assembly process caused by congestion and large numbers of railcars in the yard may introduce and amplify variability in the outbound train departure pattern.
To investigate the stated hypotheses, this paper applies an original yard simulation model to conduct various experiments designed to quantify the influence of different types of inbound volume variability on classification yard performance. This research will serve as a foundation for further study on the pattern of yard performance recovery after surges in traffic volume and eventually to better understand yard and mainline interactions in the railway network. The work also provides a basis for railroad operational plan adjustments to better manage yard traffic and utilize existing yard resources.
Previous Research
There are two areas of previous research relevant to the topics of this paper: studies of railway classification yard inbound traffic variability and evaluation of hump classification yard performance and capacity via simulation.
Because of the flexible nature of North American freight railway operations where no fixed timetable is used and train sizes and departure times fluctuate according to freight shipping demand, past researchers have studied the impact of variability on classification yards and terminals. Martland et al. ( 9 ) studied the influence of the train arrival pattern on yard performance and capacity, and conducted a qualitative analysis of its impact on the train receiving, assembly, and departure processes required to make on-time train connections. Dong ( 10 ) also investigated the relationship between yard volume variability and maintaining train departure schedules, although his research mostly focused on the influence of inbound schedule variability on outbound volume. Malavasi et al. ( 11 ) studied the average transit time of an intermodal terminal subject to varied inbound volume distributions, which is comparable to a railway classification yard. Zhang et al. ( 12 ) conducted similar research on a container terminal to examine the influence of variability on terminal performance, operating efficiency, and sustainability. Minbashi et al. ( 13 – 15 ) developed a departure delay model for freight trains leaving classification yards in the structured European operating context. The statistical model relating train arrival volume to departure delay does not consider train size, block size, or other yard conditions, and does not explicitly model yard processes. Optimization is one approach to study and quantify the performance of different yard operating scenarios, and various techniques have been proposed to optimize different classification yard processes ( 16 – 21 ). Recent papers optimize yards in the structured European operating context ( 22 – 29 ) with shorter blocks and trains, and more frequent train departures, compared to North American classification yard operations with longer blocks and trains, and once-daily departures for each block. These differences make it difficult to apply these approaches to North American classification yards, particularly when examining the effect of volume variability inherent to North American freight operations. This study proposes to simulate yard processes in detail to better understand the mechanisms linking train arrival and departure variability at yards.
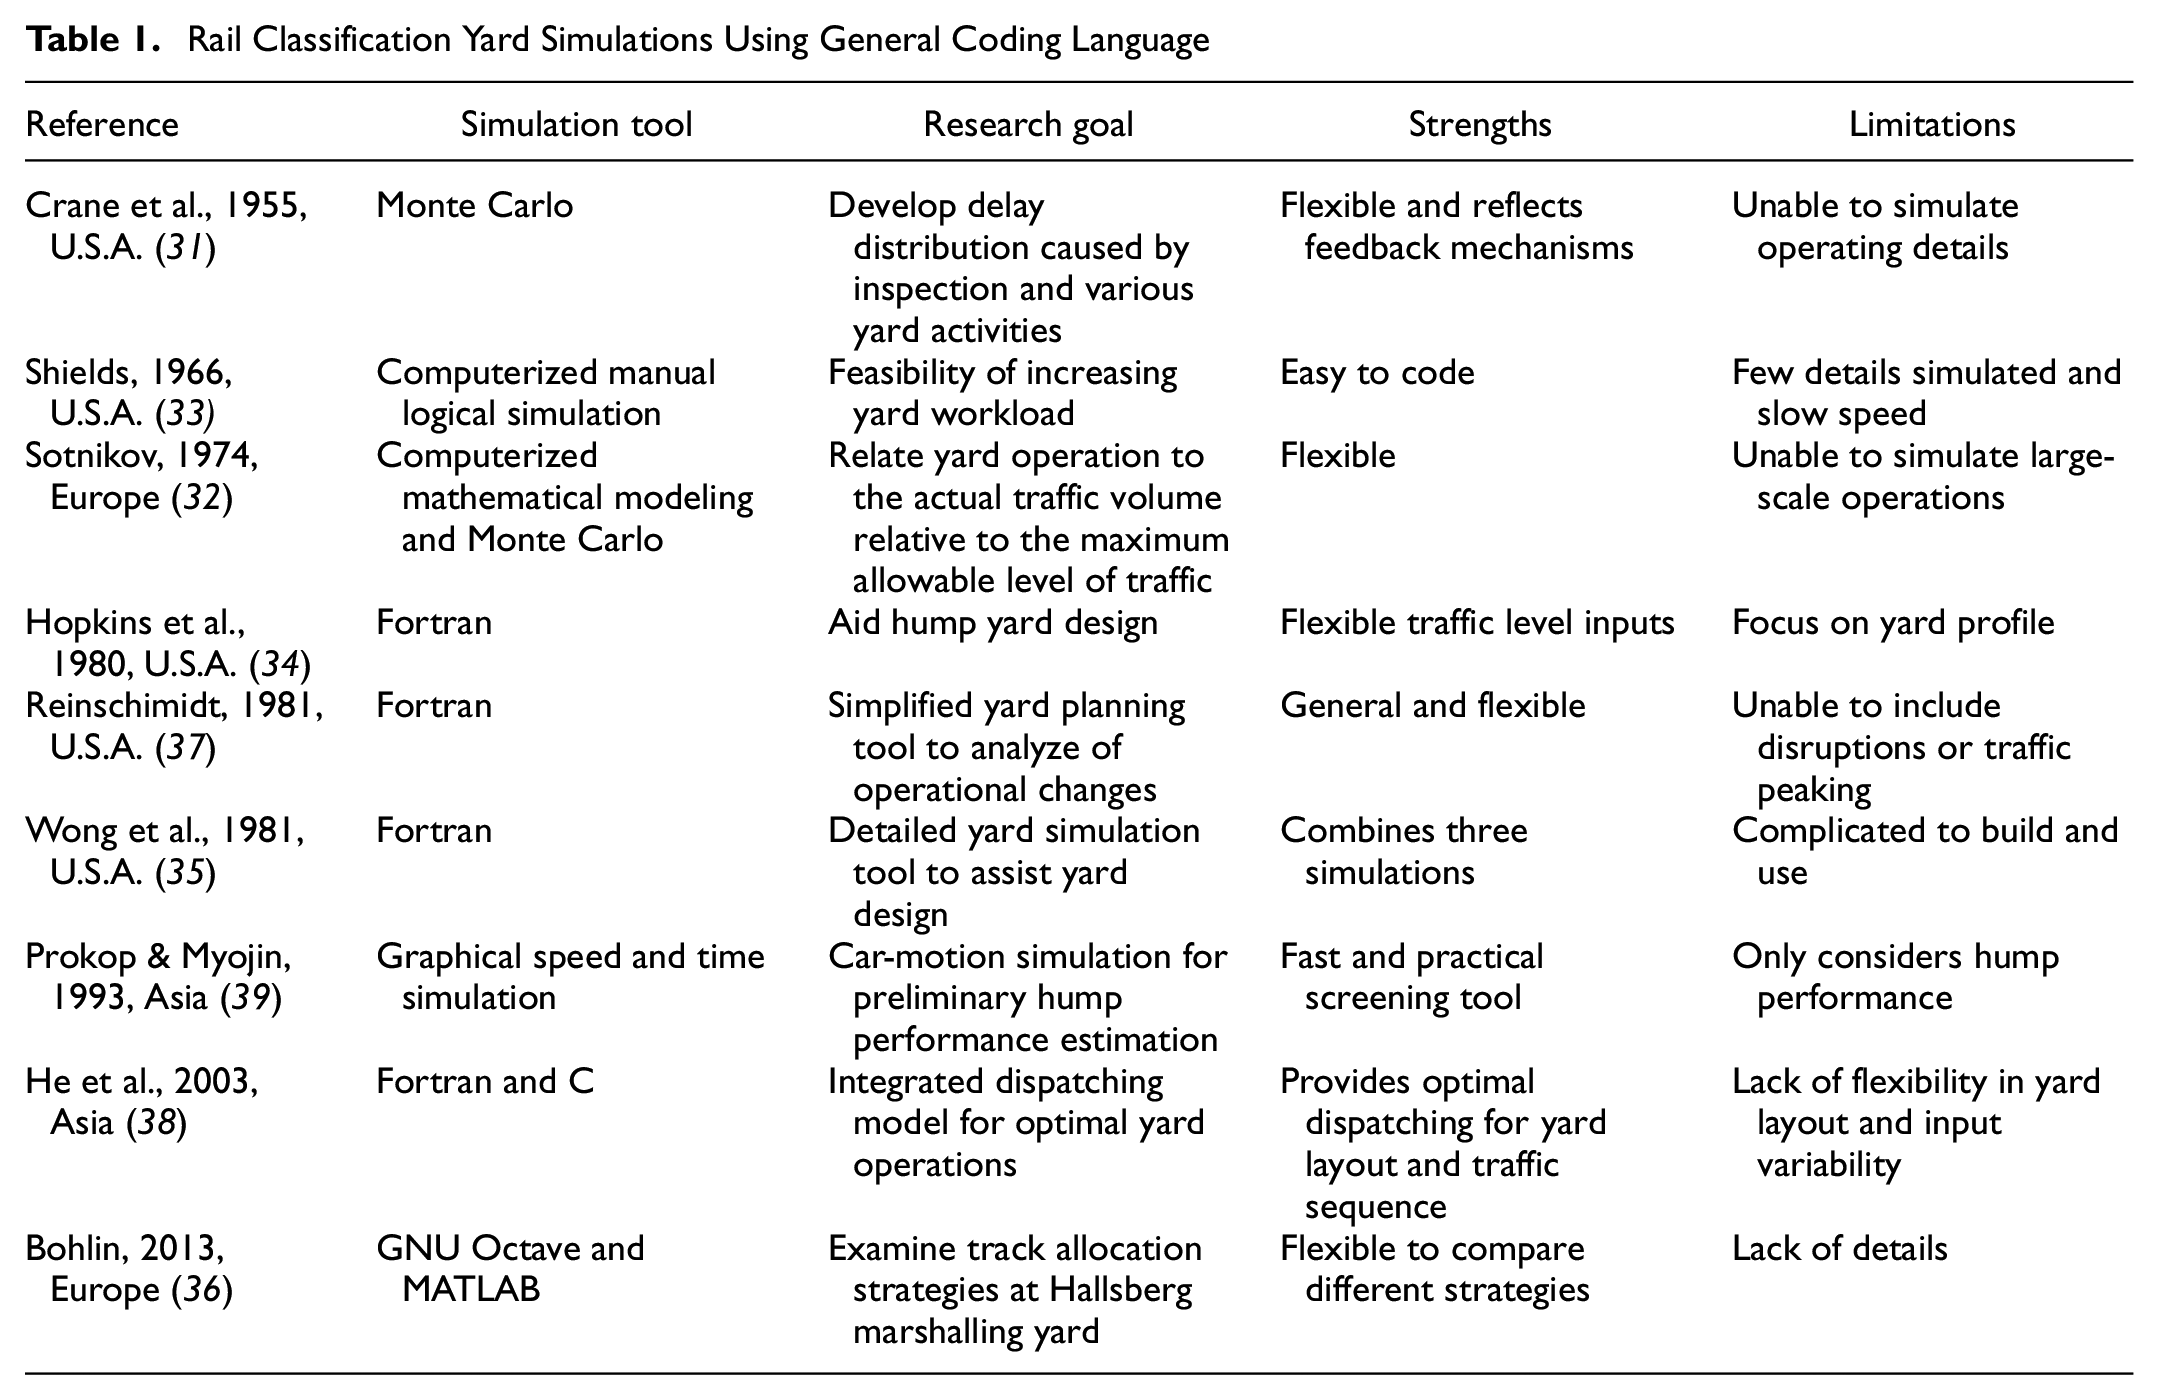
Simulation tools have been widely used as a methodology to model railroad yards and terminals by academia and industry, given the evolution in computational power over the past decades ( 30 ). In reviewing and summarizing simulation tools used in the past and the current state-of-the-art in railroad terminal simulation models, the authors identified three major types of simulation tools: general coding languages, general-purpose simulation software, and custom commercial simulations (Tables 1–3). General coding languages (Table 1) are the most common tools, with researchers converting yard operation to a Monte Carlo process ( 31 , 32 ), mathematical functions ( 32 – 35 ), a queuing model ( 36 ), or a discrete-event list ( 37 , 38 ) featuring computerized simulation instead of manual calculation. Despite the flexibility and ease of building the model, common limitations of these general coding languages are a lack of detailed operating and geometric features and an inability to reflect the specific traffic flow movements of the yard operation. In addition, the number and scope of output performance metrics are usually limited.
Rail Classification Yard Simulations Using General Coding Language
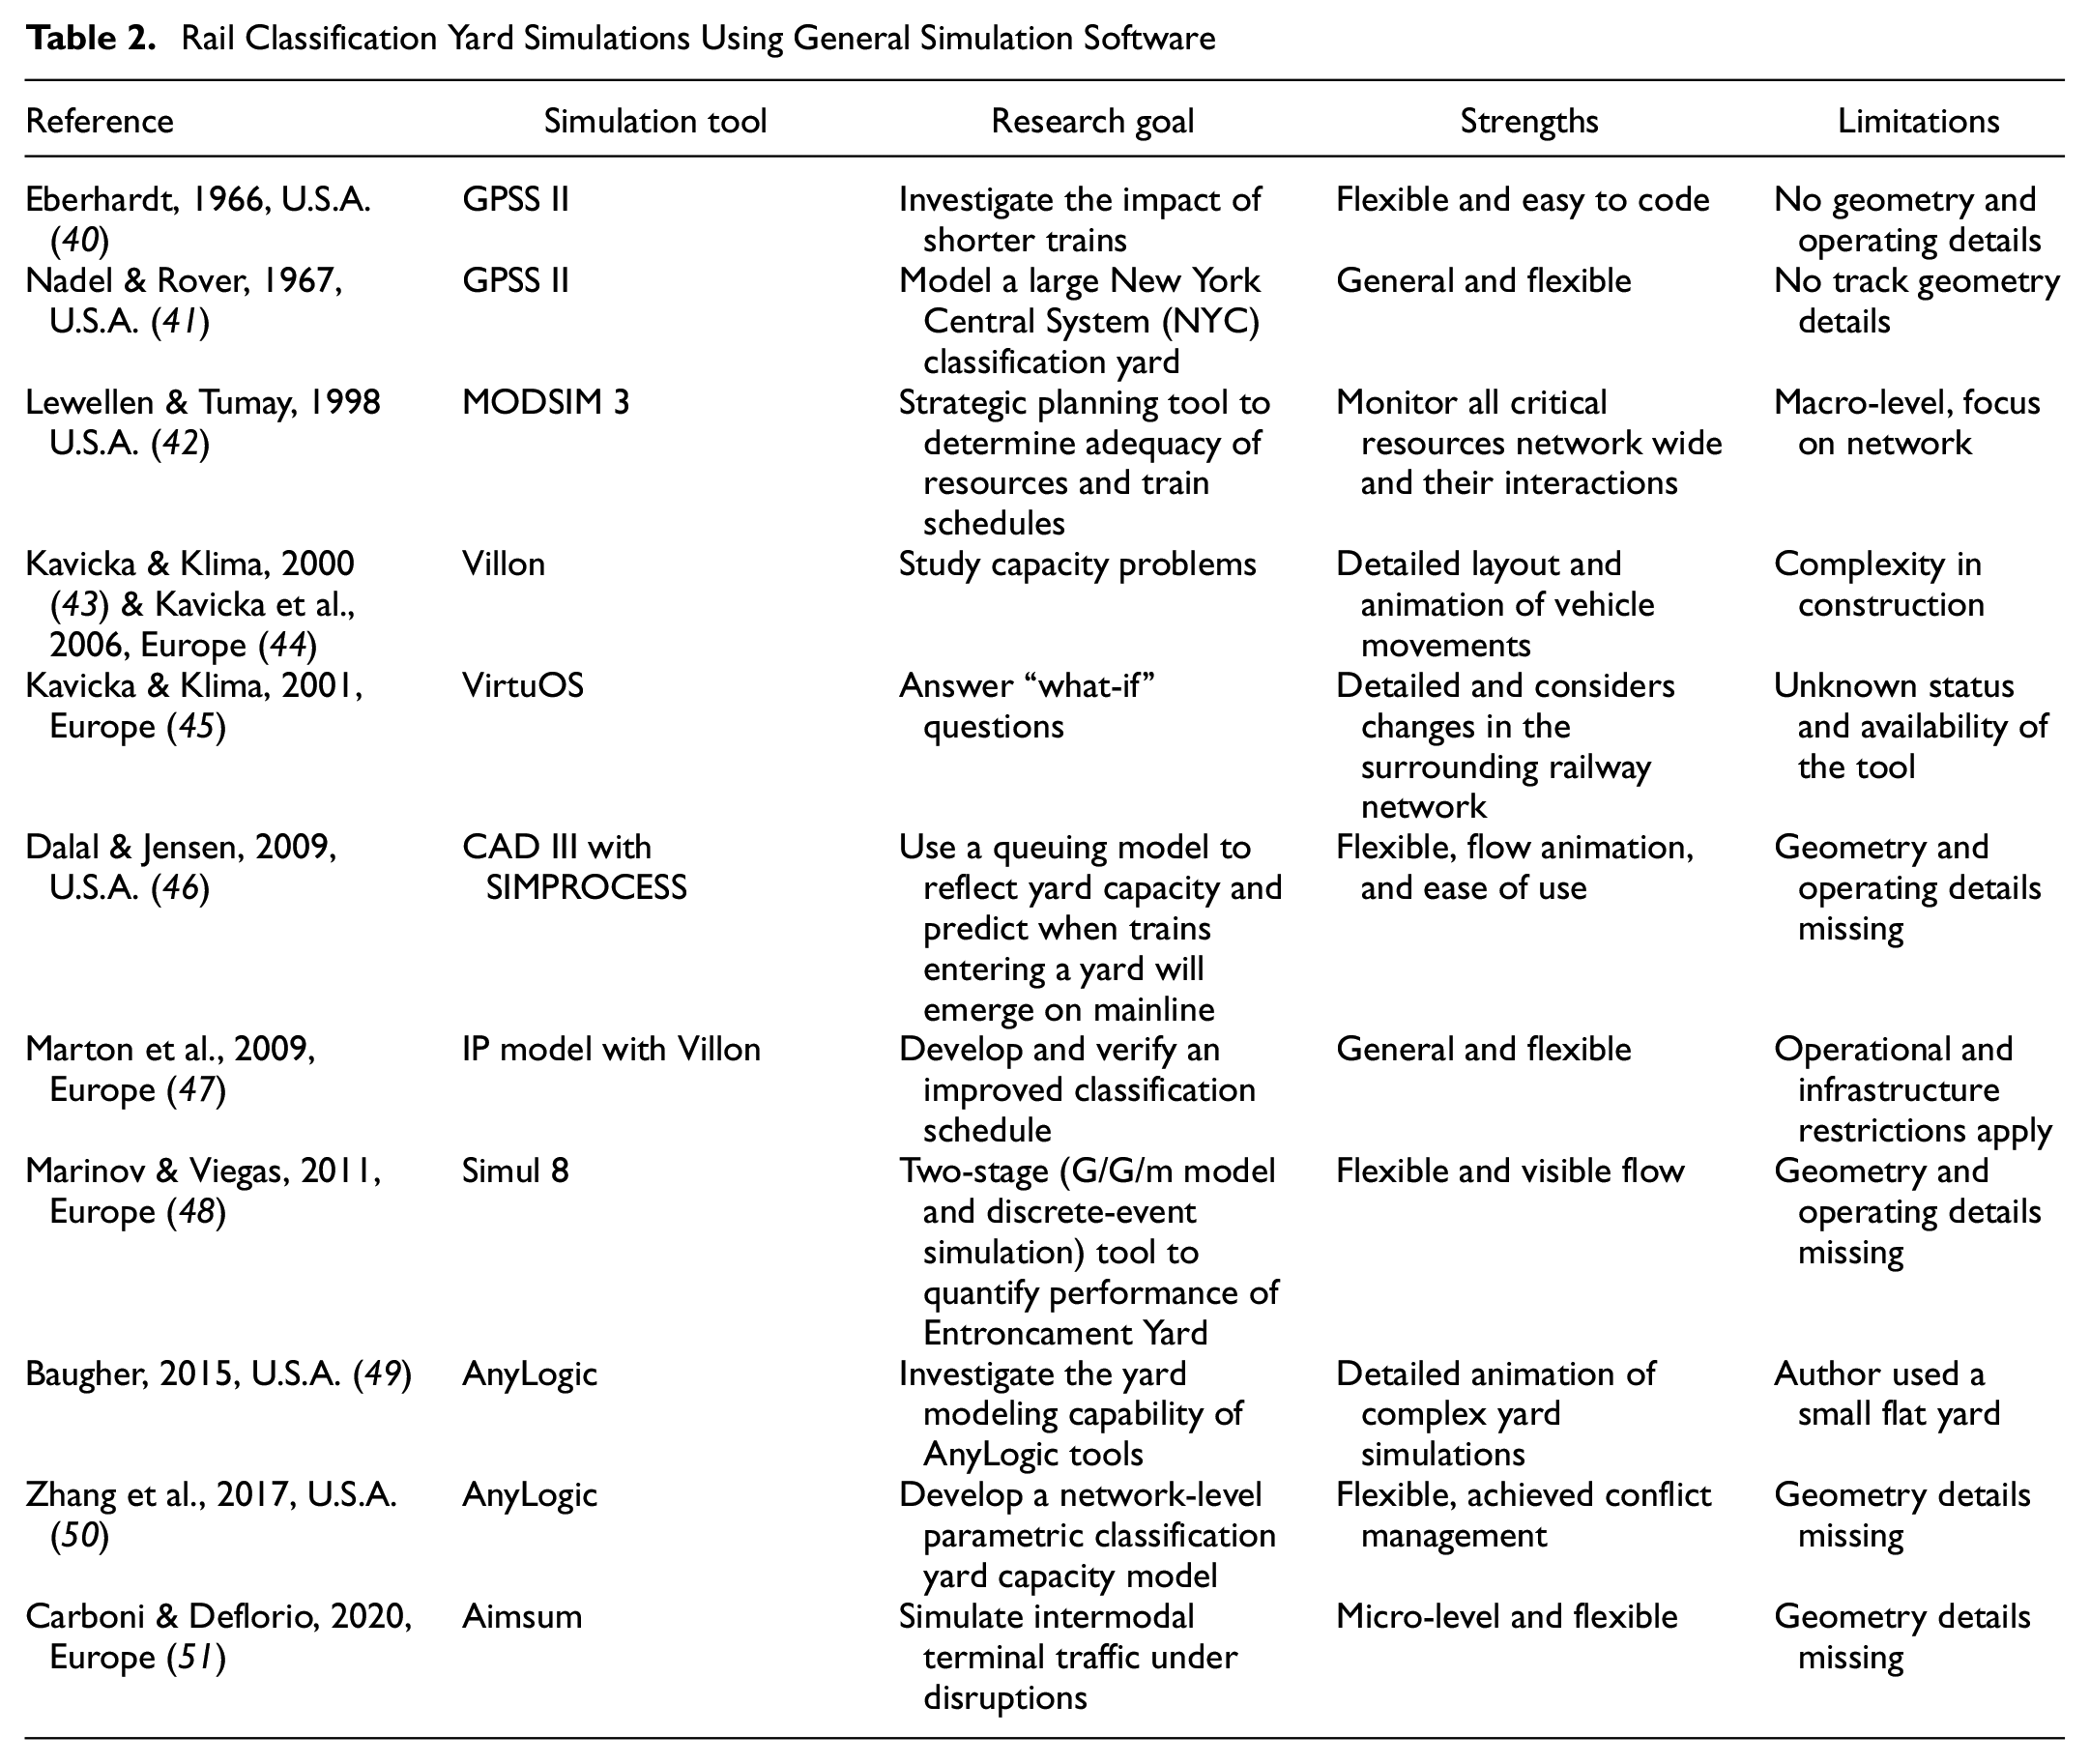
Rail Classification Yard Simulations Using General Simulation Software
Rail Classification Yard Simulations Developed as a Custom Commercial Tool
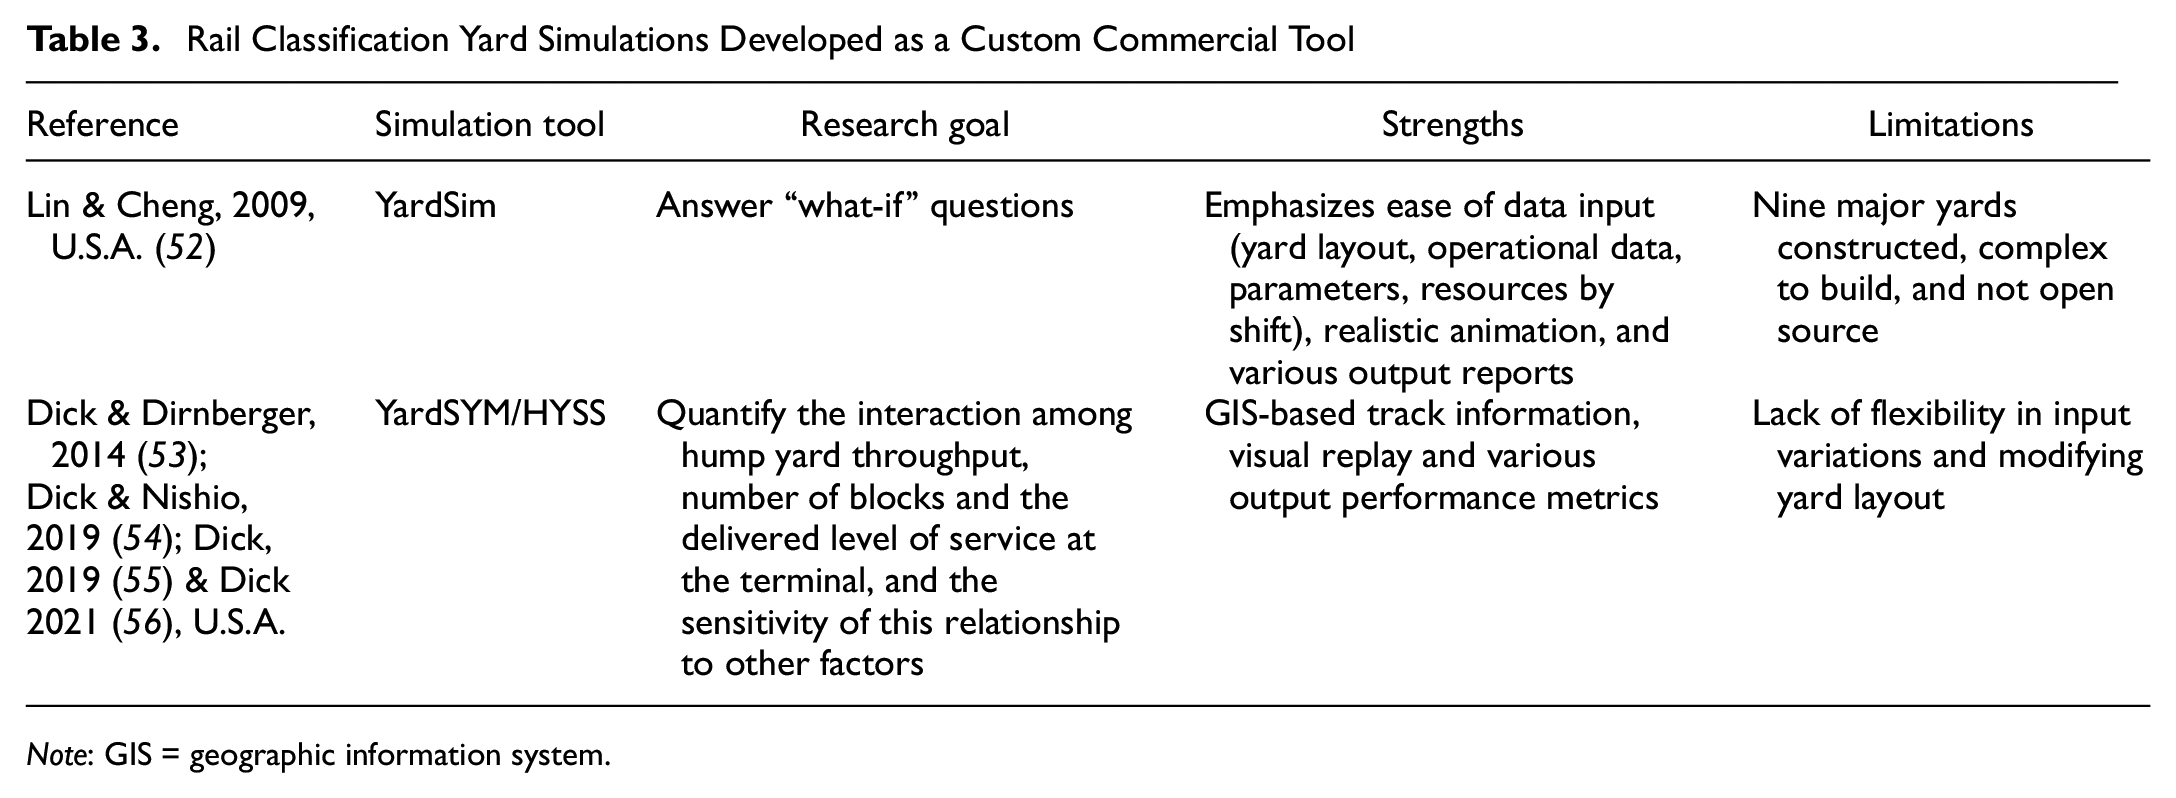
Note: GIS = geographic information system.
General-purpose simulation software is another prevailing type of tool (Table 2), as exemplified by Villon ( 43 , 44 , 47 ), Aimsum ( 51 ), AnyLogic ( 49 , 50 ), and Simul 8 ( 48 ). These tools typically assume a production flow system and ignore the details of movement location and potential routing conflicts in the system. Pre-built logical modules in these general-purpose simulation software environments simplify programming. General-purpose simulation tools usually provide visual animation of flow movements in the system and are able to output many performance metrics during the simulation. Of these tools, AnyLogic has a unique rail library that allows for building actual track profiles, connecting tracks with turnouts, and simulating railway rolling stock moving on the tracks to achieve a maximum level of details in simulating railway operations. Although used to model small flat switching yards ( 49 ) and hump classification yards in an abstract manner ( 50 ), Zhao and Dick ( 57 ) were the first to leverage the rail library in researching hump classification yards.
Lastly, some rail companies have developed their own custom commercial yard simulations (Table 3) to specifically model certain existing hump yards ( 52 – 56 ). These models incorporate accurate track information, interactive data input, visual replay of yard movements, extensive validation, replication of scenarios considering variability, and comprehensive output metrics. However, these tools typically require a large, expensive up-front investment to develop and tailor the model to each specific yard under study, and the resulting tools are not open-sourced to the public or researchers except for specific sponsored studies. In addition, these tools are usually limited to existing yard track layouts and specific operating strategies with limited ability to introduce additional input variation and modify the yard layout by adding tracks or adjusting their length.
In the most closely related work, Dick and Nishio ( 54 ) and Dick ( 55 ) examined the property of a classification yard to amplify or dampen volume variability by developing simulation experiments to study the relationship between schedule flexibility and volume variability. Although they highlighted that schedule flexibility is more detrimental to yard performance than volume variability, they suggested that future research should investigate the level of volume variation more thoroughly. Because of constraints on input variables and output data limitations, the YardSYM model previously used by Dick and Nishio was not able to adequately model the random inbound traffic surges because of seasonality and fluctuating demand for railroad transportation observed in practice. Dick and Nishio were also only able to perform their volume variation experiment for a single-block pattern. As a result, studying levels of volume variation representative of daily, weekly, and seasonal throughput fluctuation in actual railroad operations and the corresponding impact on yard performance across multiple block patterns is a research gap in the current knowledge of railroad operations. This research proposes to expand on and improve the previous research by quantifying the influence of a more representative amount of inbound volume variability on multiple yard performance metrics, and comparing the train size distribution of arrivals and departures across a range of traffic volumes for different blocking patterns. To achieve full control of experimental variables, while considering detailed yard operational and geometric properties, the authors conduct this research using a yard model developed with AnyLogic because of its power and flexibility.
Methodology
AnyLogic Simulation Realization
To investigate the research hypotheses, a representative inline hump classification yard is modeled as a discrete-event simulation using AnyLogic software. AnyLogic is a multi-method simulation modeling tool developed by The AnyLogic Company. The software allows a track layout to be constructed from AutoCAD files, providing flexibility in user-specific yard operations and layout options. AnyLogic generates rich three-dimensional (3D) visualizations and animations to provide evidence that the simulation model is making correct yard operating decisions with the given operating rules.
To simulate classification yard operations for a given yard track layout, AnyLogic requires inbound train schedules and patterns (train size, railcar position and destinations, type of railcars, etc.) as well as an outbound train plan. The model simulates the flow of railcars and switching movements in the yard under specified operating strategies and assumptions, and processes the railcar assignments to outbound trains. During the simulation, individual railcar data, such as arrival and departure time, is collected to return multiple yard performance metrics, such as average dwell time, as well as the distribution of outbound train and block lengths after the simulation period finishes.
To answer the research questions, a representative inline hump classification yard (Figure 1) was modeled along an east–west mainline with AnyLogic. The yard is composed of one receiving yard, one classification yard (bowl), and one departure yard, each with geometric parameters and assumptions typical of recent North American yard construction and expansion projects to handle 10,000-ft trains of approximately 150 railcars. The reader is referred to an earlier paper by the authors for details of the simulation model construction and validation ( 57 ).
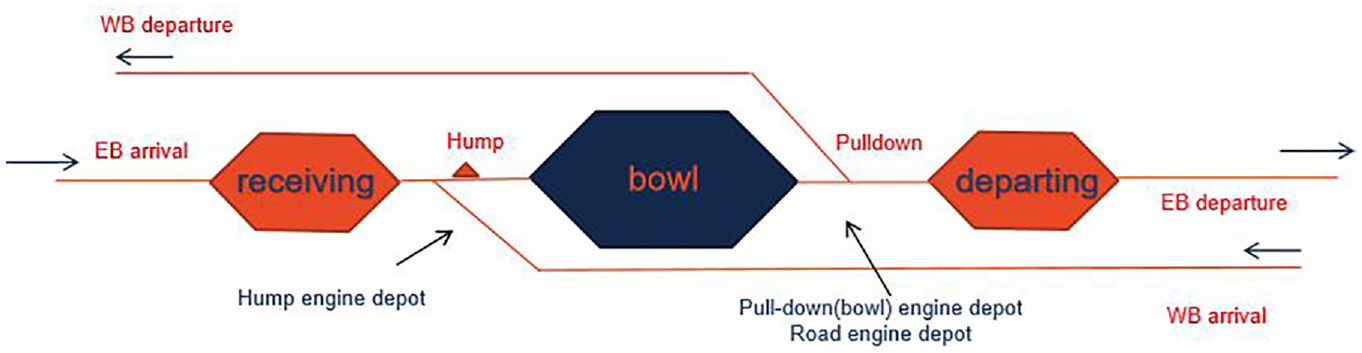
Inline hump classification yard model diagram.
Experimental Design
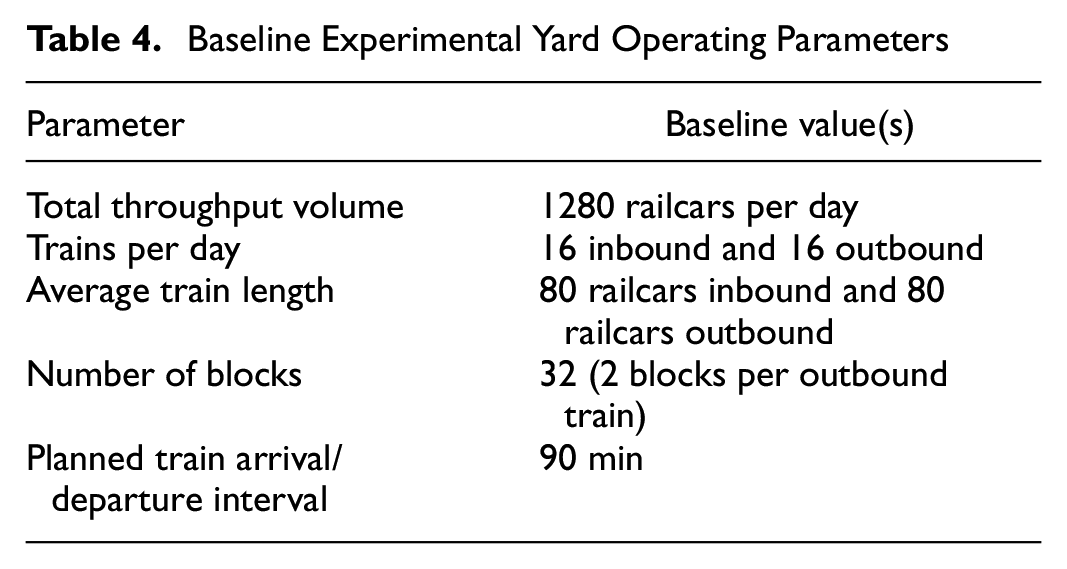
The baseline experimental parameters (Table 4) were selected to represent typical hump classification yard operations and study two main experimental factors: the volume variability and blocking pattern. The baseline schedule includes 16 inbound trains in every 24-h period that brings 1280 railcars of daily throughput volume (average 80 cars per inbound train). A total of 16 outbound trains, each carrying two blocks (32 blocks in total), are scheduled to depart every 90 min during each 24-h period. Outbound block assignments are randomly distributed to railcars in each inbound train such that, in the baseline case with no variation, approximately the same number of railcars will be humped and assigned to each of the 32 blocks formed in the classification bowl yard. With no volume variation, 1280 railcars per day and 16 trains per day, on average, 80-car outbound trains each carrying two 40-car blocks, can be expected for each planned train departure.
Baseline Experimental Yard Operating Parameters
In comparison to the previous work of Dick and Nishio ( 54 ) who varied inbound volume at the “arriving cars per train per outbound block” level, the model developed with AnyLogic has the flexibility to simulate additional random inbound traffic volume variation, including total weekly volume (week-by-week), daily volume in a week (day-by-day), and individual train size on a specific day (train-by-train), either alone or in combination, corresponding to the more complicated throughput volume variation observed at actual classification yards in North America. In addition, the ability of AnyLogic to record detailed information on individual car movements through the yard during the simulation run also allows for detailed analysis of a particular train, block, or railcar. Therefore, the performance of railcars assigned to trains with different block patterns can be studied independently. To supplement the previous research, this paper focuses on extending the range of volume variability and the impact of different block patterns.
Volume Variability
There are three independent factors of volume variability included in the experimental design: weekly volume deviation, daily volume deviation, and individual train length deviation.
For daily volume deviation, instead of simulating the same constant total daily traffic volume every simulated day, daily throughput volume is assumed to vary and follow a normal distribution with a specified mean value and standard deviation. The simulation engine decides the total volume of a particular simulation day using the specified distribution and subsequently equally distributes railcars to each inbound train (all expected to be the same length on a given day).
For individual train length deviation, instead of assuming that all arriving trains are expected to be the same length on a given day, this factor is added to vary the inbound train length across trains arriving on a single simulation day. A normal distribution with the mean value computed from the specified (or calculated) throughput volume for that day and a specified standard deviation is used to decide individual train lengths within a given simulation day. Combining these two factor variables allows the simulation to examine the practical condition of daily throughput volume fluctuation and train length variability.
With the above two factors varying inbound volume based on daily or individual train variation, the volume peaks and troughs in the yard usually dissipate relatively quickly. However, real-world rail classification yards often suffer from prolonged unplanned congestion or seasonal demand increments that lasts longer than a single day and consistently affect multiple arriving trains. To further investigate how longer-duration volume variation influences hump yard performance, weekly volume variation is also introduced. Similar to daily volume deviation, instead of simulating constant total traffic every week for the entire duration of the simulation, the weekly throughput volume is assumed to follow a normal distribution. When weekly variation is present, after the total volume of a particular simulation week is decided by the simulation engine, the initial baseline daily volume of a given week is then determined assuming the weekly traffic is evenly divided over all seven days. Next, the daily volume deviation will vary the actual daily volume based on the initial baseline average daily volume of that week. Lastly, the individual train length is further decided based on the daily volume and train length deviation.
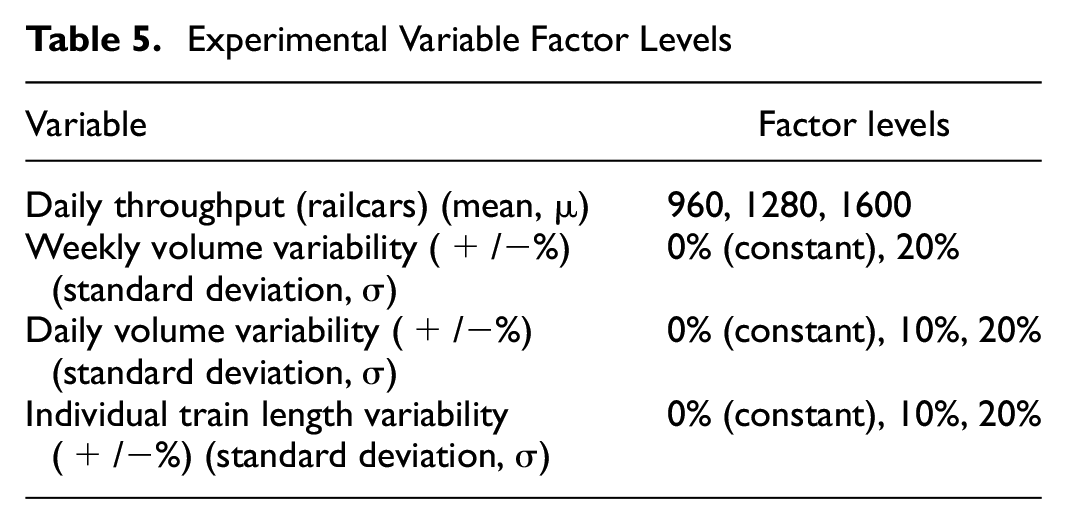
Three volume variable factors are examined in this stage: the mean value of daily throughput, the standard deviation of daily throughput, and the standard deviation of individual train length (Table 5). In addition to the baseline traffic volume, high and low daily throughput volumes were selected as 960 cars per day (60 cars per train) and 1600 cars per day (100 cars per train), respectively. To supplement the baseline case with constant volumes and train size (0% standard deviation), two additional factor levels were selected for the two standard deviations (σ): 10% and 20% of the mean value. Assuming the throughput and train length follow a normal distribution, the simulated throughput and train length can range from three standard deviations lower than the mean to three standard deviations higher than the mean (Figure 2). The combination of all three volume variability factors yields 54 experimental scenarios in total.
Experimental Variable Factor Levels
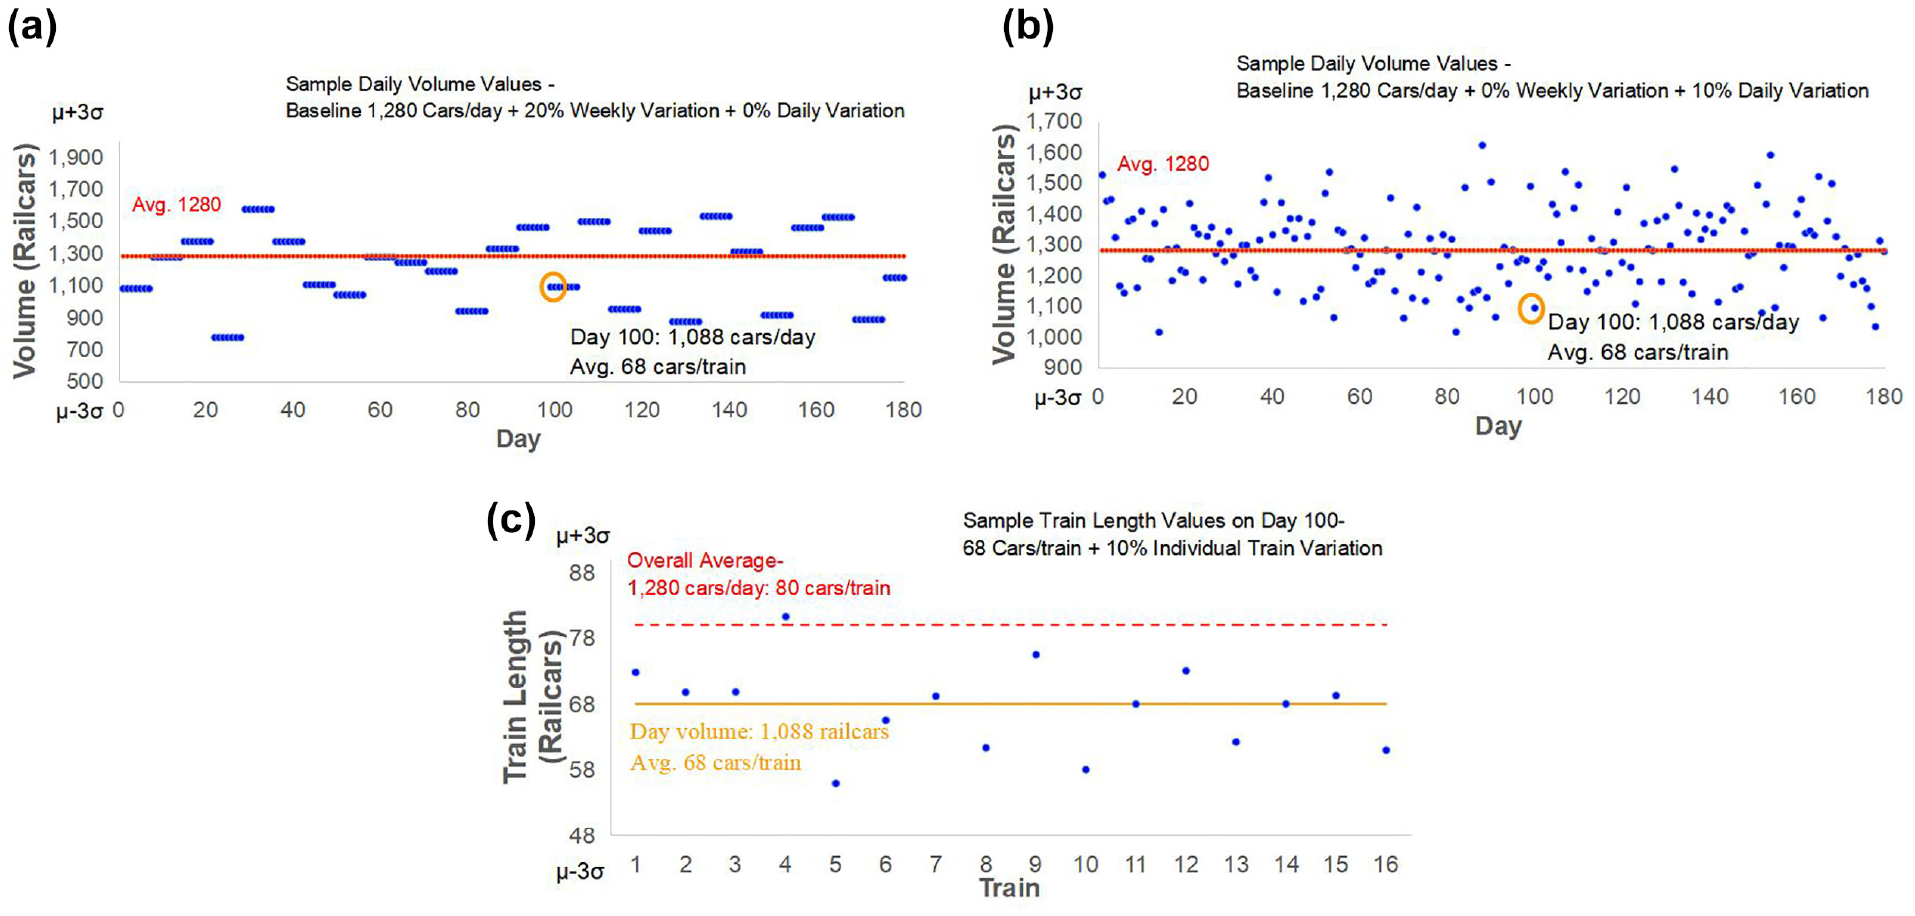
Example distributions of simulated (a) daily railcar volume with week-to-week variation over all 180 simulated days, (b) daily railcar volume with day-to-day variation over all 180 simulated days, and (c) individual arriving train lengths for day 100 in the upper figures.
Block Patterns
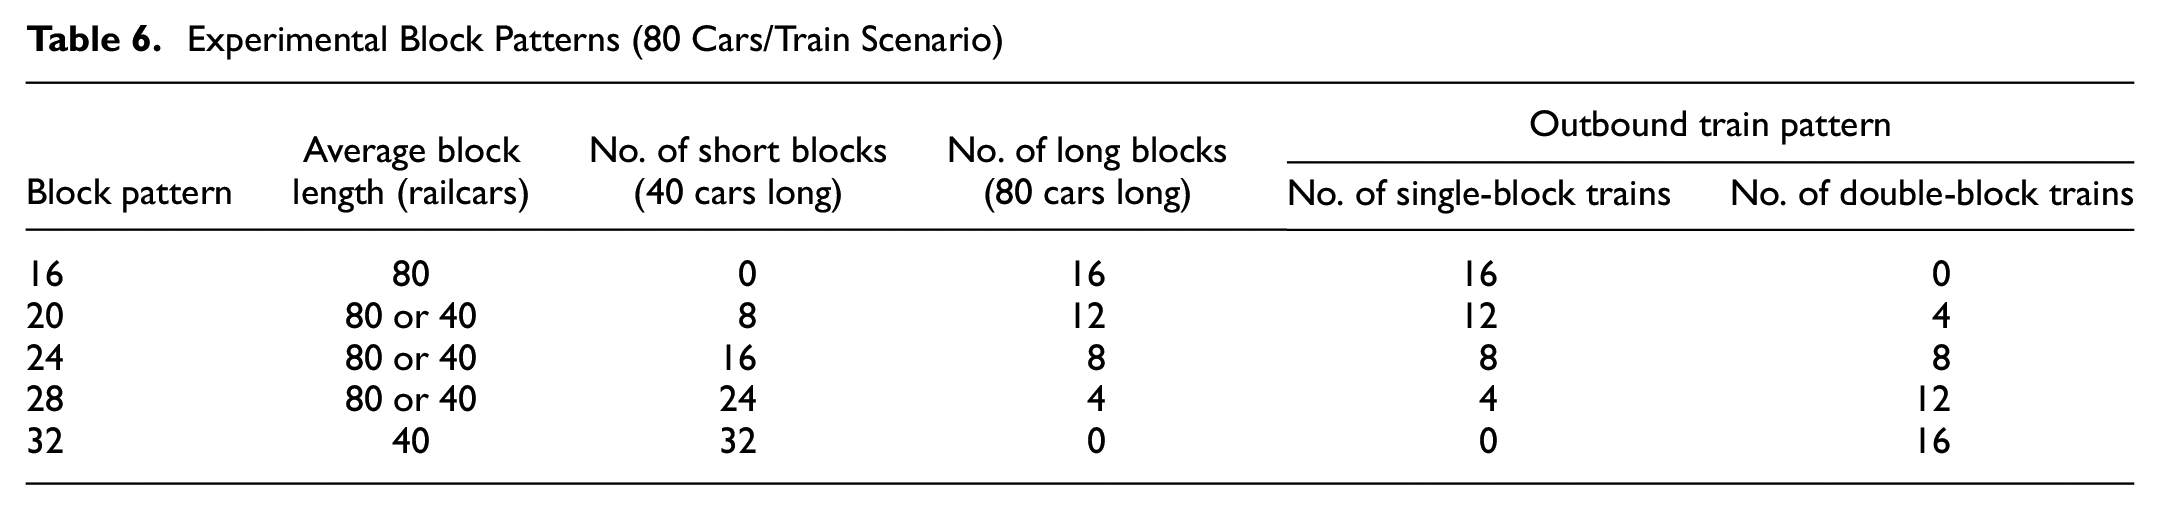
In addition to the baseline scenario with 32 blocks, additional block patterns were simulated to understand the influence of inbound volume variation under different blocking conditions. Two types of blocks are designed to be built on the classification bowl tracks: a long block (train length) and a short block (half of the train length). An outbound train will then either haul one single long block or two short blocks. For the baseline case and an inbound train length of 80 cars (1280 cars/day), inbound trains will have five cars connecting to each long block and two or three cars connecting to each short block, on average. Each block to be built will have a dedicated track to store railcars in the classification bowl, while other empty tracks will be used to store railcars when a block exceeds its assigned bowl track length (average 60 cars long). When fewer blocks are built, more empty bowl tracks are available to handle over-length blocks. However, by distributing the throughput volume over a smaller number of blocks, there will also be a greater number of long blocks that are more likely to exceed the track length when fewer blocks are built in the yard.
Maintaining the same number of inbound and outbound trains, five block patterns with different combinations of single and long blocks were designed and simulated (Table 6).
Experimental Block Patterns (80 Cars/Train Scenario)
Conduct of Simulations and Performance Metrics
For each scenario in the experimental design, the model simulates yard operations continuously for 182 days starting from empty and idle conditions; however, no data is collected during the two-day warm-up period, yielding 180 days of output. The output of this simulation contains multiple performance metrics such as railcar dwell time in each subyard (receiving, classification bowl, and departure), railcar idle time in each subyard, track occupancy, departure on-time ratio, and the number of rehump cars. For this paper, to study the influence of inbound traffic volume variability, the performance metrics of average yard dwell time, train departure on-time ratio, outbound train length distribution, and outbound block size distribution were selected for analysis. To better understand the average yard dwell time, the average bowl idle time, reflecting the car connection time caused by the volume variation, is also collected.
Results: Day-to-Day and Train-to-Train Variability
Throughput, Volume Variability, and Yard Performance
Results from the 27 simulation scenarios with day-to-day and train-to-train volume variability (but no weekly variation) for the 32-block pattern exhibit the known trend of increasing average railcar dwell time with increasing daily throughput volume (Figure 3).
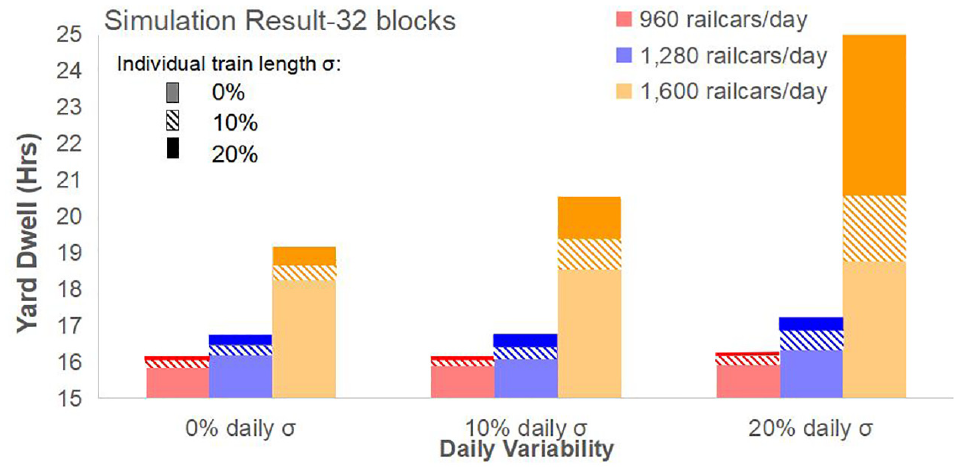
Effect of daily volume and two volume variability factors on average railcar dwell time.
On top of this effect, increasing the individual train length variability and daily volume variability both create additional increases in average yard dwell time. However, the extent of the influence at low volume is negligible when the yard is relatively idle. In general, individual train length fluctuation and daily volume change have larger impacts on yard dwell time performance at high traffic volume. Of the two variability factors, when one is held constant and the other is varied, individual train length variation appears to have a stronger effect than daily volume variability. However, there appears to be an interaction effect, as the effect of daily volume variability increases as the train length variation increases. With higher levels of both types of inbound volume variability, the combined compounding effect at larger traffic volumes is to cause much longer average railcar dwell time in the yard, indicating that the yard is reaching its maximum throughput capacity. Under the circumstance of more inbound volume variation, the capability of a yard to maintain the required level of service decreases, resulting in a reduction of the maximum traffic volume that the yard can process.
Considering the on-time performance of departing trains, the daily throughput volume shows the known trend of decreasing on-time performance with increasing volume (Figure 4). Similar to the results for yard dwell, both daily volume and individual train length deviation harm performance, and the extent increases as the volume increases. Of the two variability factors, when one is held constant and the other is varied, daily volume variability appears to have a stronger effect than individual train length variation, the opposite of what was observed for dwell time. Although the compounding effects of daily volume variation and train length variation produce the worst performance, there is a less obvious interaction effect, as both effects are more consistent for a given traffic volume.
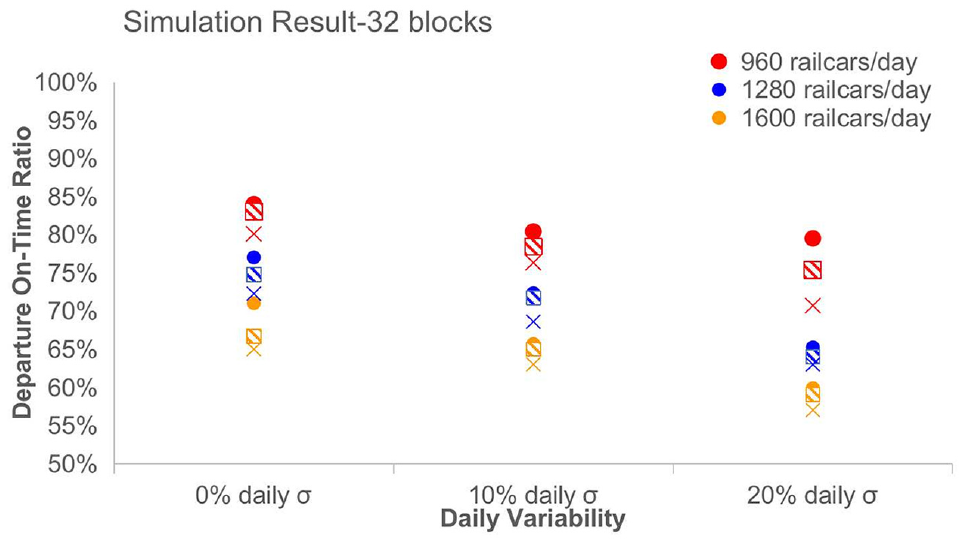
On-time train departure performance under different volume and variability levels.
The possible explanation for the simulation results can be divided into three parts. Firstly, when the yard is under-saturated with sufficient idle resources, a small amount of daily throughput and individual train length variability produce analogous and negligible yard performance impacts. To some extent, the small amount of volume variation is offset or overshadowed by the other sources of randomness existing in the simulation model caused by various operating decisions. Therefore, under this condition, there is little performance benefit of stable inbound traffic, and some railcars actually benefit from the randomness by achieving shorter connection times and accumulating less dwell. For example, railcars connecting to outbound train A from inbound train 1 might be humped right before train A starts pull-down and achieve a short connection, while railcars to train A from a later inbound train 2 miss that connection and experience an additional 24 h of waiting time. With randomness in the inbound train size, a longer train 1 could contain more railcars connecting to outbound train A, while a shorter train 2 could contain fewer railcars for train A that miss their connection and experience an extra 24 h of dwell. In this specific case, the randomness in the train size variation results in more railcars making shorter connections and the yard will exhibit less overall dwell time.
Secondly, when the volume is larger but does not exceed yard capacity, considerable inbound volume variability begins to delay train departures, and therefore the average yard connection time increases. In this case, the random long trains that occur because of individual train variation or random high-volume days caused by daily throughput variation might cause temporary saturation in the subyard or even in the terminal. A long train occupying the hump might cause unexpected queues in the receiving yard, and the long blocks exceeding their assigned bowl track lengths need to employ extra tracks to store railcars, which further adds to the complexity of the pull-down operation. However, most of the extra resource need caused by variability can be absorbed by the surplus capacity of the yard, and therefore the performance only shows a medium disturbance.
Lastly, when the yard is at or very close to capacity (1280 railcars/day on average), the yard is most vulnerable to volume variability. Unlike the under-saturated situation, the extra resources required because of random long trains, peak traffic days, or both, cannot be afforded because there is little or no capacity surplus available. Therefore, the yard level of service declines significantly and may even affect the performance of the mainline.
Block Pattern, Volume Variability, and Yard Performance
Examining the scenarios for the other four block patterns and baseline mean daily volume of 1280 railcars per day (Figure 5), the common trend across all block scenarios is that both daily volume and individual train length deviation increase dwell time marginally in the low–medium variability range and considerably at high variability. Although the magnitude of dwell time increment is not considerable at this volume (57% of saturation volume), the general trend is still insightful.
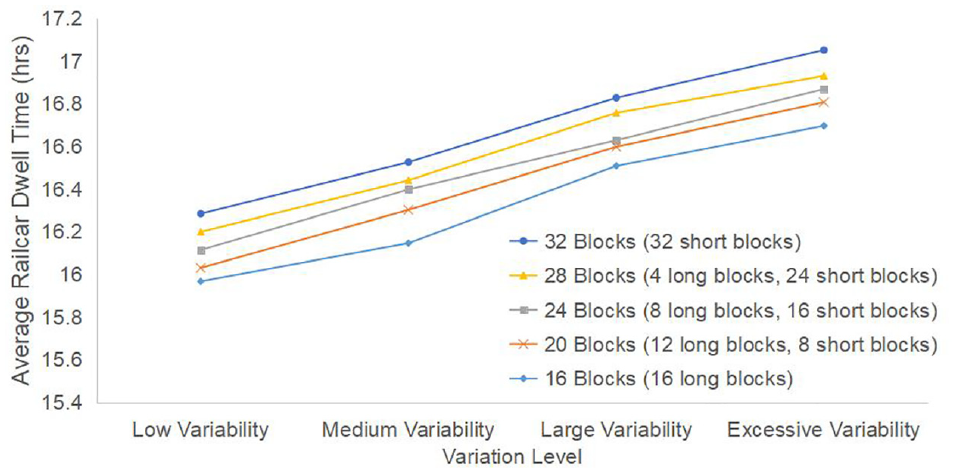
Increment in average dwell time for different blocking patterns and volume variability.
Another trend observable in the results is that as more blocks are formed in the yard, the longer railcars dwell in the yard with any variability level. It can be possibly surmised that railcars connecting to short blocks reside longer in the classification yard compared with railcars connecting to long blocks. To investigate this assumption, the percent increase in average dwell time was calculated separately for railcars belonging to different block types for selected representative variability combinations (Table 7). Overall, railcars connecting to short blocks require a longer time to process in the classification yard, resulting in a longer average dwell time for block patterns that have more short-block trains. Dwell time in the yard for short blocks is larger than for long blocks regardless of the volume variability scenario. However, long blocks are slightly more sensitive to volume fluctuations, since a larger increment in dwell time can be observed for long blocks when comparing low and large/excessive volume variability.
Average Dwell Time Increment for Short and Long Blocks Under Different Blocking Patterns and Variability
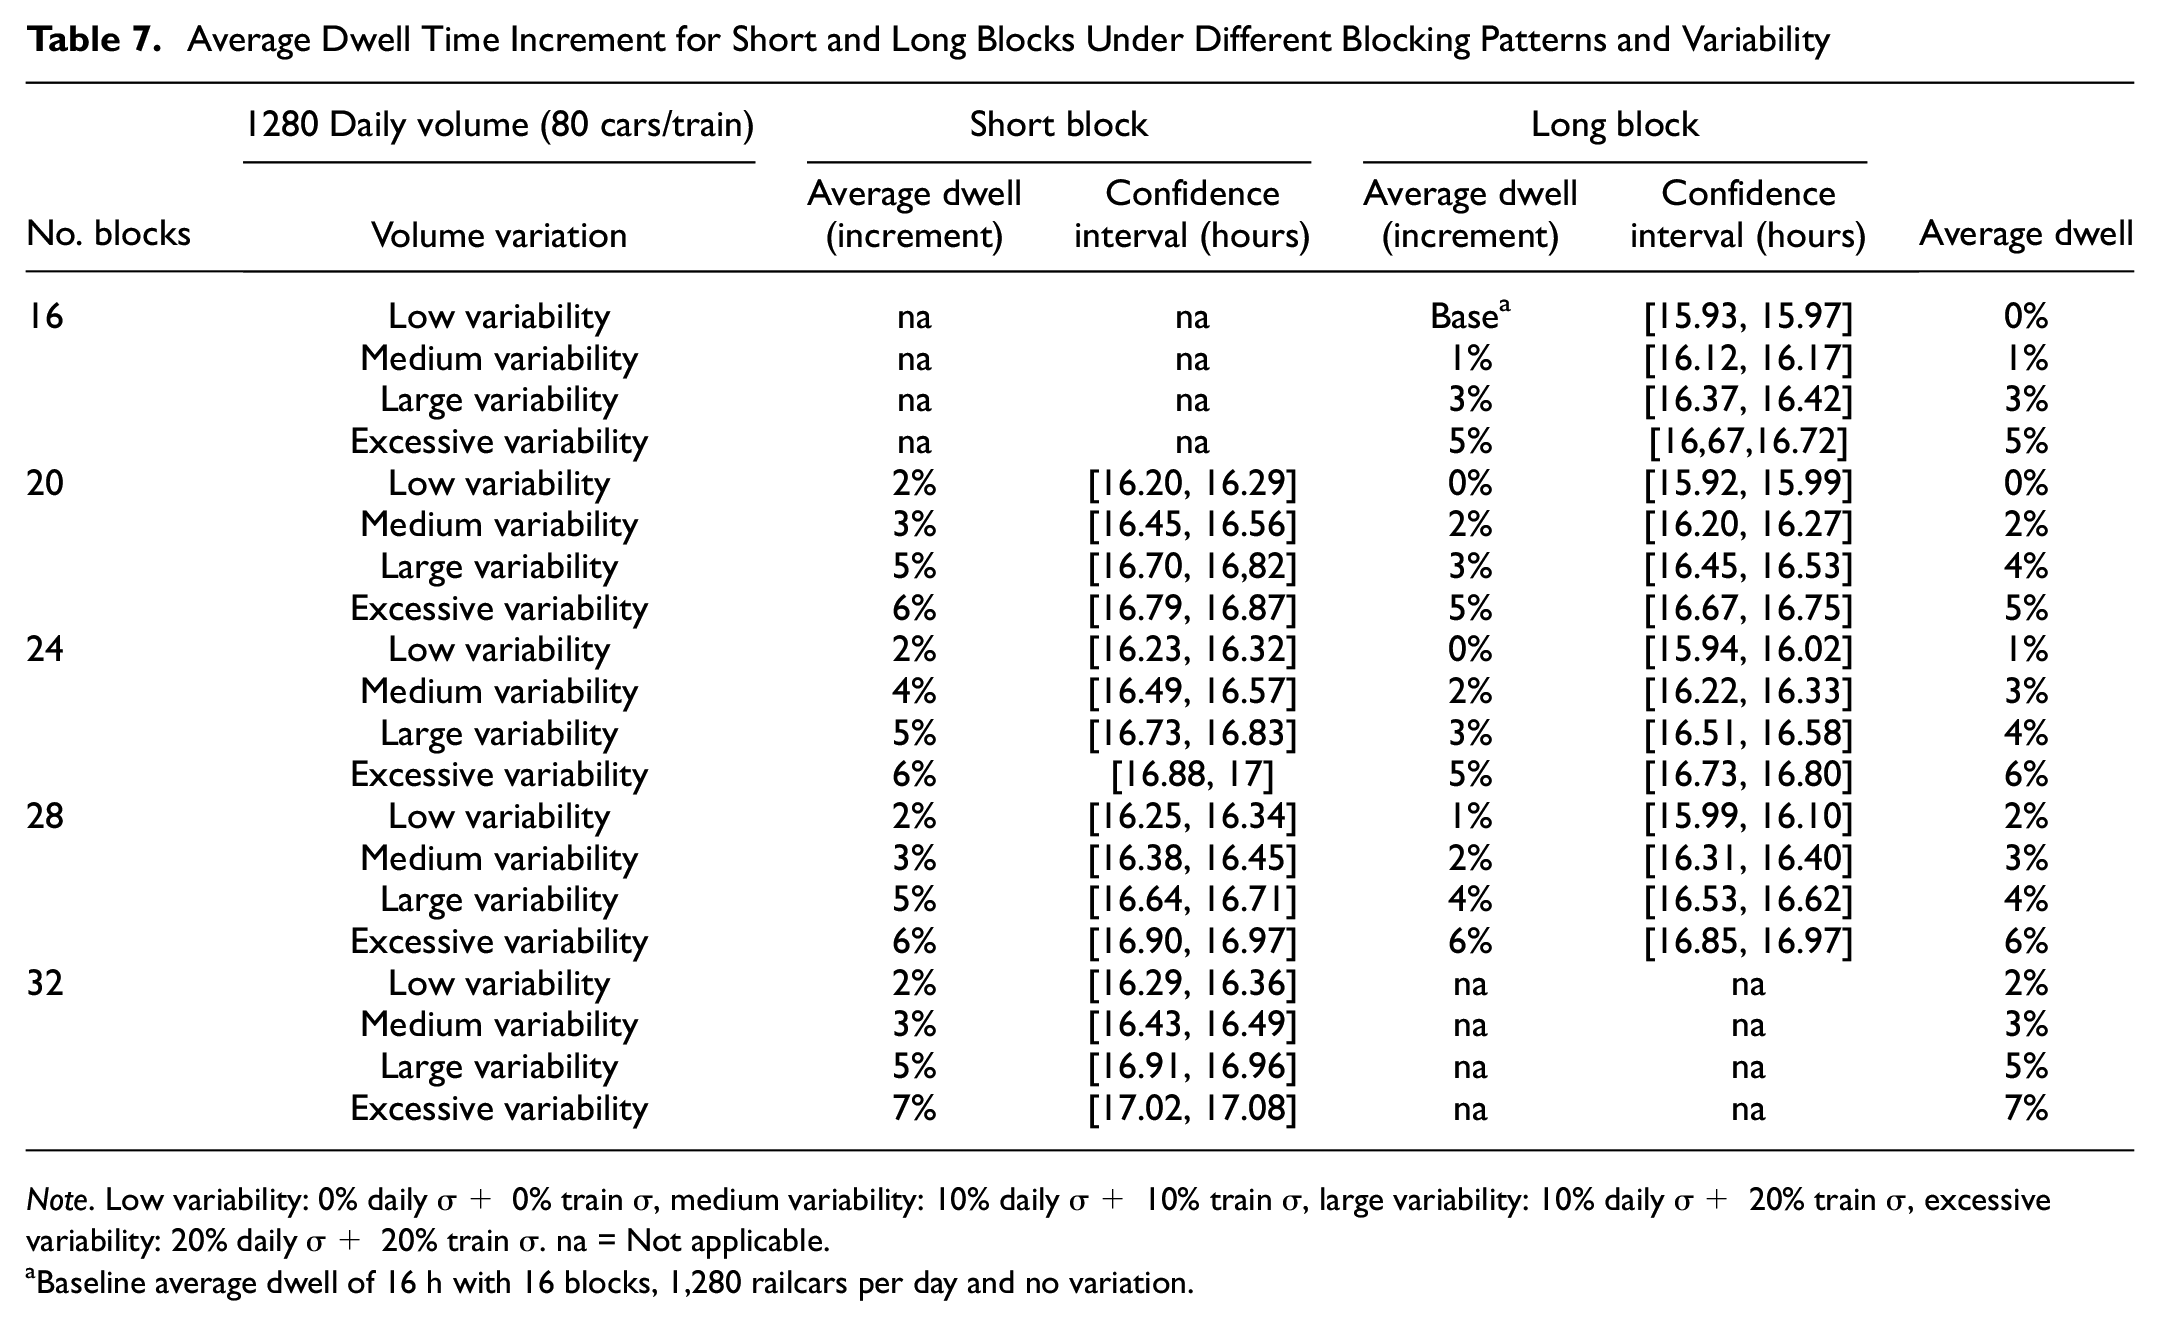
Note. Low variability: 0% daily σ+ 0% train σ, medium variability: 10% daily σ+ 10% train σ, large variability: 10% daily σ+ 20% train σ, excessive variability: 20% daily σ+ 20% train σ. na = Not applicable.
Baseline average dwell of 16 h with 16 blocks, 1,280 railcars per day and no variation.
Propagation and Transformation of Inbound to Outbound Variability
To answer the research question of “does a hump classification yard amplify or dampen volume variability,” the simulation output of inbound train size and outbound train size were compared and analyzed for selected volume and volume variability scenarios. To place this analysis in proper context, it is noted that the simulation model assumes the outbound train schedules are fixed, while pull-down is scheduled to start at an appropriate time before the planned departure. This time offset between the start of the pull-down and planned departure is initially set to a default value but is then automatically adjusted by the model based on the time required to pull-down the blocks on previous days of the simulation run. The railcars belonging to various outbound blocks locate randomly in each inbound train with identical probability density, resulting in identical inbound–outbound pairing features for each block. More details about train assembly rules can be found in a previous paper ( 57 ).
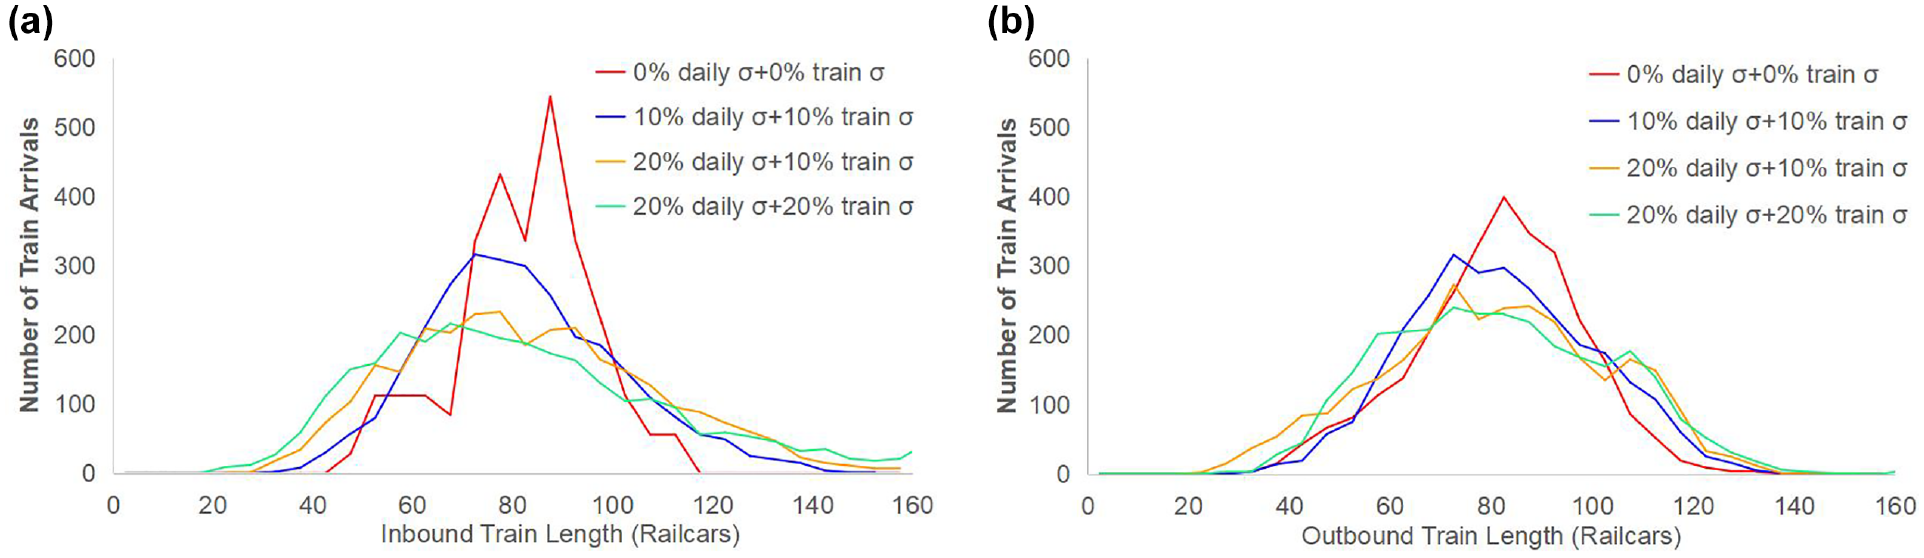
Given the yard throughput of 1280 railcars per day and 16 outbound trains for every simulated scenario, the average inbound train size is 80 railcars for all scenarios regardless of inbound traffic volume variability, and the average outbound train size is also constant at 80 railcars across all scenarios. To determine how the yard propagates train length variability, distributions of inbound train size and outbound train size (Figure 6a) and cumulative distribution of inbound train size and outbound train size (Figure 6b) were developed for the set of scenarios with daily volume variability ranging from 0% to 20% and individual train size variability ranging from 0% to 20%.
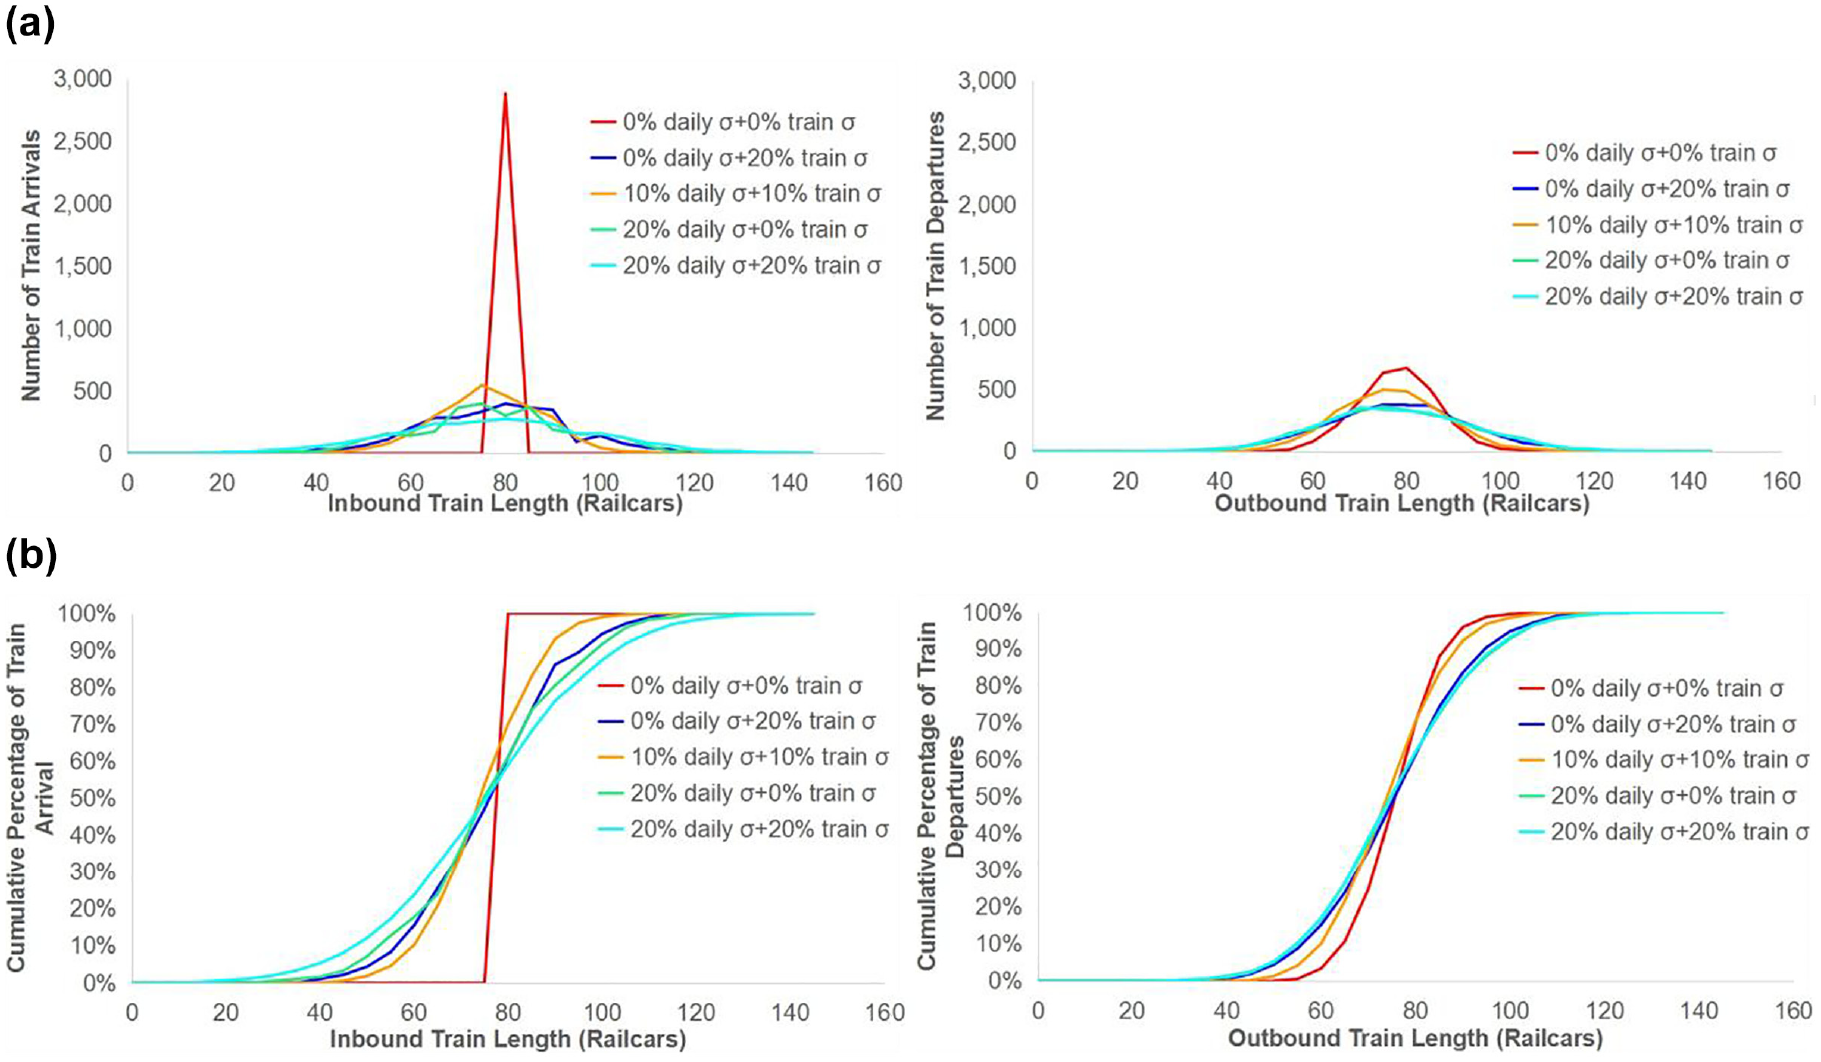
(a) Distribution and (b) cumulative distribution of inbound train length and outbound train length for different levels of inbound train volume variability.
In the scenario with 0% daily volume variability and no individual train size variability, all inbound trains are consistently 80 railcars in length, leading to a vertical line for the cumulative distribution. However, the outbound train length of this scenario shows more diversity and results in a bell-shaped curve of outbound train size distribution. The reason for this result is the randomness of the other processes within the yard simulation and multiple operating strategies. For example, the authors assume railcars connecting to each destination block are located randomly in a given inbound train. Since this random position of railcars in a train determines the order and timing of the railcars being humped into the classification bowl and their ability to connect to the pull-down process, different random railcar sequences within inbound trains can result in various made and missed railcar connections, leading to differing outbound train sizes. When variability increases, the inbound train length distribution spreads out to extremes and reveals a flatter bell-shaped curve. As the output of yard operations, the outbound train size distribution indicates similar curves regardless of the inbound volume variation, with the exception of the general trend that larger variation results in slightly flatter curves. When the inbound traffic volume has a low variation (Figure 7a), the outbound train size distribution disperses, and the yard exhibits the property of amplifying the inbound variability. In contrast, when the inbound traffic volume has high fluctuation (Figure 7b), the outbound train size distribution becomes relatively more centralized to the average, and in this case the classification yard exhibits the property of dampening the volume variability.
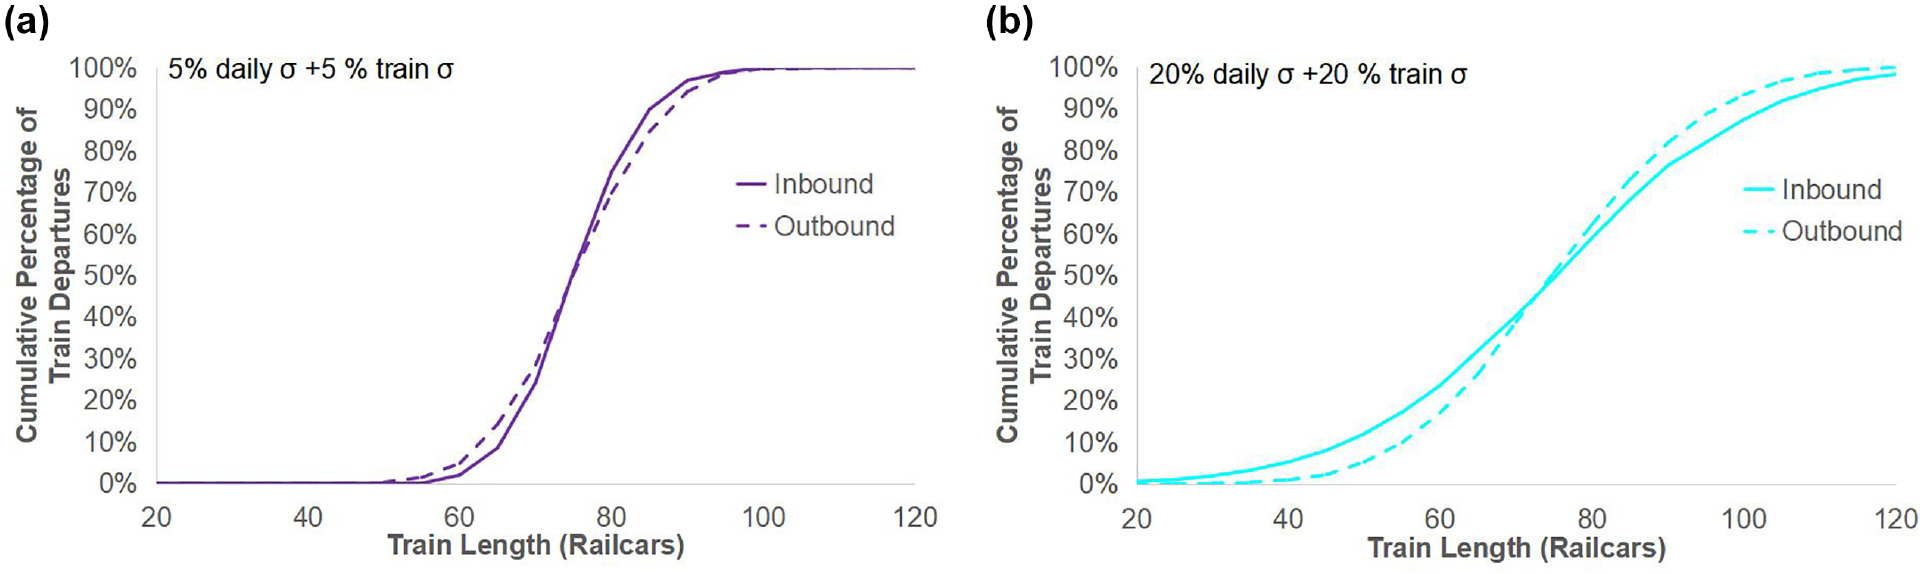
Distribution of inbound train length and outbound train length for (a) low and (b) high inbound train volume variability.
The overall conclusion is that the hump classification yard functions as a node that moderates mainline volume and train length variability. In practice, as manifest freight trains travel in the railway network, the train length will tend to be close to the mean after making different stops at classification yards. Extremely short or long trains at origin will typically trend toward becoming average-length trains as they connect through multiple classification yards. This trend benefits freight railway operators, since the trains at the two length extremes may either cause operating difficulties at terminals and mainline passing sidings because of their long length or be too short to be cost-effective.
Results: Week-to-Week
After adding the scenarios including week-to-week variation to the analysis, Figure 8 (black and grey lines) displays an example simulated result of average daily volume and actual daily volume within each week with and without weekly deviations. When weekly volume variation is present, the overall volume peak and trough conditions last longer before being relieved. The cumulative influence of the prolonged peaks caused by sustained volume variation might manifest in diminished performance later in the week, causing a significant impact on the yard operation that cannot be observed when the volume only rises for a single day, such as in the scenario with no weekly variation.
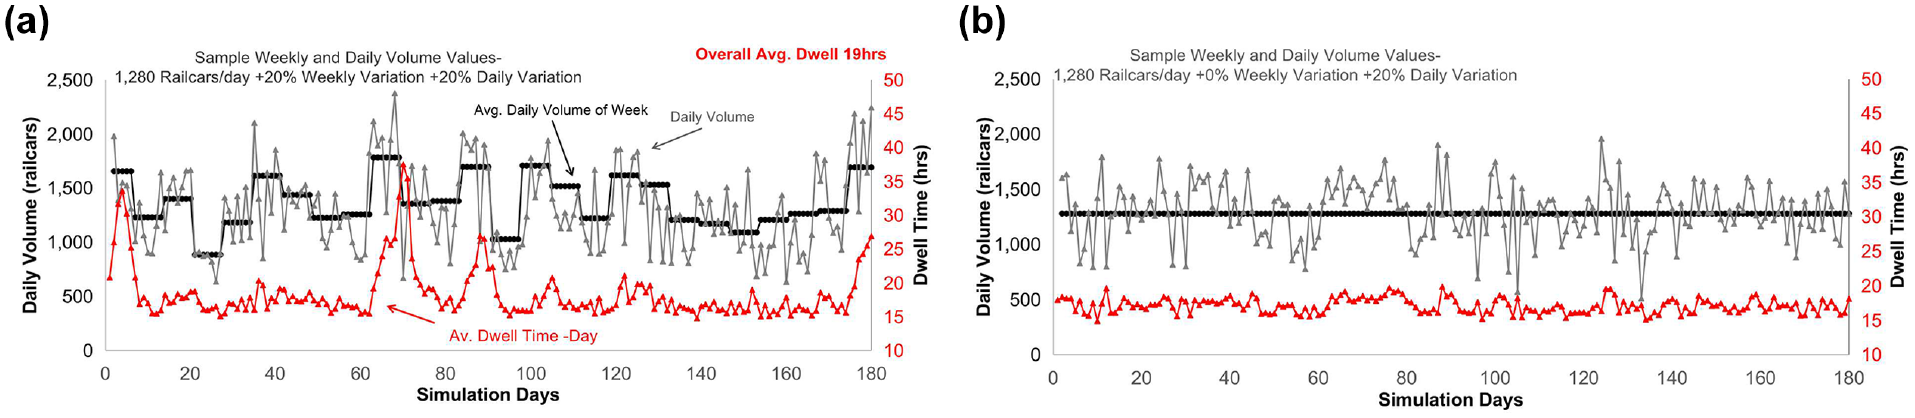
Example distribution of simulated daily volumes and average daily volumes of each week and corresponding average railcar dwell time for (a) 0% and (b) 20% weekly deviation. (Color online only.)
According to the simulation results presented in Figure 8 (red line), the daily average dwell time shows fluctuations corresponding to the volume variation, but is a few days postponed, suggesting the yard exhibits a reaction time to throughput volume variability. More notable increments in average dwell time can be observed with weekly deviation (Figure 8b) than without (Figure 8a) and are typically found slightly after “peak volume” weeks, supporting the hypothesis that the cumulative impact of incremental volume might cause excessive yard congestion and train delays. However, no notable dwell time decrement exists around the low-volume weeks, probably because of the fixed minimum railcar connection time in the yard given the simulated train plan schedules. Although both simulations maintain the same overall railcar throughput in the yard with the same level of daily throughput variation and train length variation, the yard performance is poorer with a weekly variation. Therefore, a conclusion can be drawn that seasonal demand changes that persist over longer periods hurt hump yard capacity and performance more than random demand changes over a shorter period. However, further studies are required to investigate this concept further.
Examining the scenarios for the other eight variability levels with baseline 32 blocks and mean daily volume of 1280 railcars per day (Table 8), the common trend across all scenarios is that adding weekly volume variation harms the yard performance with respect to both railcar dwell time and departure on-time ratio. The effect is marginal at low daily and train variability levels and substantial at extreme daily and train variability levels. Another observation is that varying weekly volume by 20% alone results in a similar dwell time (16.9 h) as observed when varying individual train length by 20% (16.8) or varying daily volume by 20% (16.8 h), indicating that at a low variability level, variation of longer duration does not hurt yard performance much more than the other forms of volume variability. The cumulative effect of fluctuating throughput on yard dwell time is more notable with a higher variability level. For example, the dwell time of 20% train σ+ 20% weekly σ (17.8 h) and 20% daily σ+ 20% weekly σ (17.6 h) is higher than the combination of 20% train σ and 20% daily σ (17.1 h) from the original experiment, indicating that weekly volume variation has a larger impact than daily or individual train variation. However, the departure on-time ratio is lower when varying weekly volume by 20% alone (70%) than varying individual train length by 20% (73%), but better than varying daily volume by 20% (63%). Therefore, the on-time ratio impact should be ranked as daily variation > weekly variation > individual train variation. One potential explanation is that, as mentioned earlier, the simulation engine adjusts the pull-down schedule based on the historical time needed for the train to be ready after pull-down. As the throughput is “predictable” in a week, the simulation slowly advances or delays the pull-down start time to adapt to the volume level and improve the on-time ratio. In comparison, with only daily variation, the throughput fluctuates randomly each day, and any adjustment to the pull-down schedule based on the previous day might be opposite from what the yard needs to achieve good performance. This assumption might not represent real-world practice and needs further investigation.
Effect of Various Volume Variabilities on Dwell Time and Departure On-Time Ratio
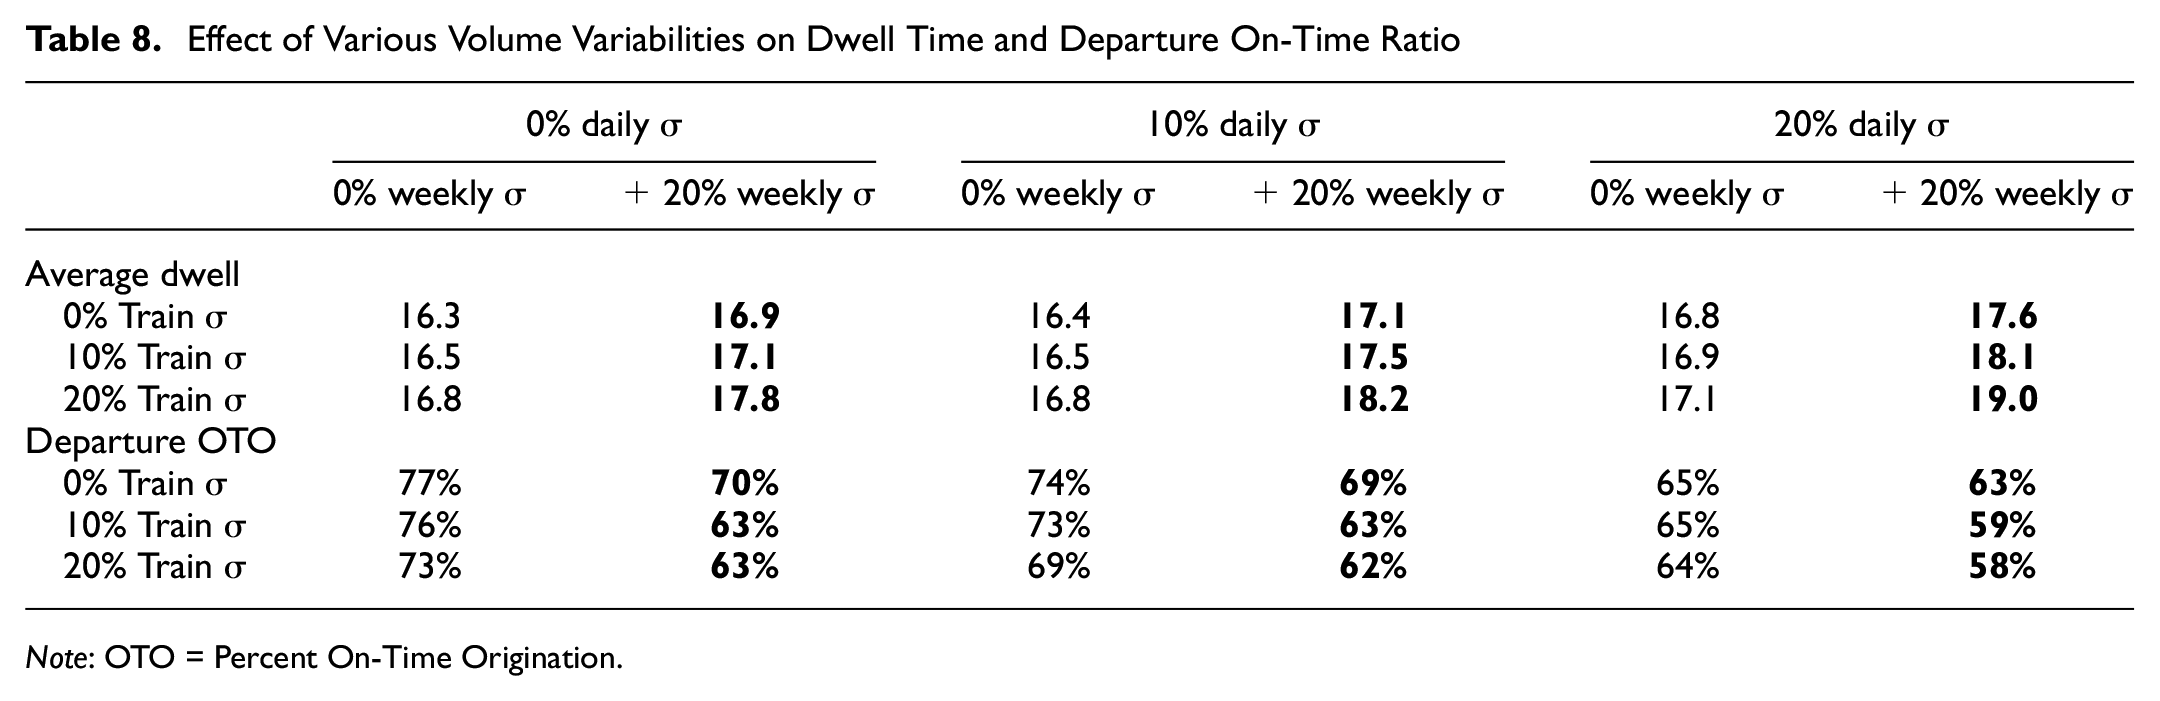
Note: OTO = Percent On-Time Origination.
Lastly, the simulation output of inbound train size and outbound train size were compared and analyzed for selected volume flexibility scenarios with 20% weekly variation (Figure 9). A similar conclusion can be made that a hump classification yard still moderates volume variability even for the longer-duration weekly variation.
Distribution of (a) inbound train length and (b) outbound train length for different levels of inbound train volume flexibility with 20% weekly variation.
Conclusions
This paper used an original hump classification yard simulation model to conduct a novel experiment that systematically investigates and quantifies the propagation and transformation of inbound to outbound traffic volume variability. Some key findings have been identified.
Increasing yard throughput variability, as quantified by increasing inbound train size variability, damages the performance of a railway classification yard by decreasing the ratio of outbound trains that depart on time and increasing the railcar dwell time in the yard. These effects are most apparent under higher traffic volumes as the yard nears capacity.
Longer-duration increases in throughput volume created by weekly volume variability tend to be more impactful than daily volume and individual train size variation, but all three types of volume variation exhibit compounding effects that diminish classification yard dwell time and on-time departure performance.
Forming long blocks in the classification bowl instead of multiple short blocks results in shorter average railcar dwell time regardless of the volume variation level, although the performance of long blocks is more sensitive to inbound train length fluctuations.
Classification yards function to both amplify and dampen volume variability to medium values related to the consistency of the train assembly process. Train arrivals with low volume variability and high volume variability both result in similar outbound train length distributions.
The relationships and trends identified by this research can help one to understand the role of hump classification yards in the railway network and encourage railways to optimize yard operations. Since railcars connecting to long blocks consistently exhibit a shorter yard dwell time than those of short blocks, railroads may consider the operational trade-offs of planning more long blocks. Since the yard acts to moderate volume variability but transform it into schedule flexibility ( 54 ) through more frequent late departures, downstream yards may benefit from less varied inbound train size but also suffer the operational consequences of a more variable train arrival schedule. Therefore, it is of vital importance to understand how the interaction of railway classification yards propagates volume variability and schedule flexibility, and its corresponding effect on overall freight railway network performance. The results of this paper can inform industry decisions to enhance the yard operating strategy and resource utilization to promote network efficiency. Given the urgent and growing demand of eliminating railway transportation delays and improving freight rail service in the U.S.A., understanding the factors that affect network performance is valuable. Considering the similar nature of railroad yard operations internationally, this research and future studies can also inspire freight railway operators outside North America.
Future studies are required to quantify the relationship between schedule flexibility and volume variation within a network scope and to extend the study of yard recovery patterns after a longer duration of excess volume. If given access to actual throughput volume data from the industry, actual volume variation input can be implemented instead of the assumed representative normal distribution. Potential improvements to the AnyLogic simulation model include adding a mainline to connect multiple yards and allow the research team to study the overall network perspective. In addition, field measurements could be utilized to validate the numerous infrastructure, vehicle, and operating assumptions and inputs used to develop the simulation model. The ultimate purpose of this simulation model is to develop a high-level parametric yard capacity and performance model.
Footnotes
Acknowledgements
The authors thank Gongyuan Lu of Southwest Jiaotong University, China, and Geordie Roscoe of the University of Illinois Urbana-Champaign for their helpful advice during the development of simulation model.
Author Contributions
The authors confirm contribution to the paper as follows: study conception and design: J. Zhao, T. Dick; data collection: J. Zhao; analysis and interpretation of results: J. Zhao; draft manuscript preparation: J. Zhao, T. Dick. All authors reviewed the results and approved the final version of the manuscript.
Declaration of Conflicting Interests
The author(s) declared no potential conflicts of interest with respect to the research, authorship, and/or publication of this article.
Funding
The author(s) disclosed receipt of the following financial support for the research, authorship, and/or publication of this article: This research was supported by the National University Rail Center (NURail), a USDOT OST-R University Transportation Center, and the Association of American Railroads (AAR).
Data Accessibility Statement
Some or all data, models, or code that support the findings of this study are available from the corresponding author on reasonable request.