
Abstract
This study develops a comprehensive two-stage location choice framework for business establishments as part of a goods movements modeling. This study aims to formulate a systematic methodology for investigating the location choice of business establishments within Halifax Regional Municipality. This study presents a novel approach that leverages machine learning techniques to generate a systematic choice set, thereby improving the representation of realistic and reasonable location alternatives. Info Canada Business Establishments dataset 2022 is employed to achieve the aim of this study. Combining an unsupervised machine learning technique with the mixed multinomial logit model facilitates a data-driven approach to enhance the precision and robustness of business establishment location choice models. This approach possesses the potential to unveil latent patterns and heterogeneity among potential choice alternatives that may remain obscured when utilizing a conventional multinomial logit model. This thorough analysis offers robust insights into the factors influencing the location choice of business establishments. The findings obtained from this comprehensive study suggest that wholesalers prioritize proximity to highways and positions within business parks for their operations while avoiding higher population density and central business district proximity. Transportation businesses seek larger sites and locations near highways, favoring clustering with related transport companies and valuing accessibility and cost-effectiveness over proximity to business parks or rural settings. The findings of this study could provide valuable insights for commercial vehicle and goods movement modeling, business location strategies, and policymaking concerning sustainable urban development.
Business establishment plays a crucial role in spatial development and is a fundamental component of integrated land use and transportation models. As the primary sources of economic activities, business establishments exert a strong influence in drawing and generating a significant number of personal and commercial trips in the morning and evening peaks ( 1 , 2 ). Commercial trips involving both light and heavy-duty trucks lead to traffic congestion and significantly contribute to emissions, including greenhouse gases (GHGs). The growing concerns arise from the upward trend in commercial vehicle emissions witnessed over the past few decades ( 3 , 4 ). However, the existing literature has extensively examined passenger travel demand, yet the realm of travel demand forecasting modeling has not given comparable attention to commercial vehicles ( 5 – 7 ). The volume and frequency of commercial vehicle movements, along with the resulting emissions, are greatly influenced by the location of businesses. Therefore, a better understanding of the process involved in choosing business establishment locations is essential to develop a comprehensive freight demand modeling.
The location choice of business establishments is a discrete choice involving two distinct steps: the search process and the location choice process ( 8 ). During the search process, businesses gather information, evaluate market conditions, and identify potential locations that meet their specific requirements ( 9 ). This search procedure attempts to create a group of alternatives that are feasible and realistic. Following the search process, businesses carefully evaluate the shortlisted options based on predetermined criteria and preferences before making a decision on the final location ( 10 ). However, most existing studies on the location choice of businesses have focused primarily on the second step while neglecting the initial search process ( 11 ). The location search step is imperative for reliable and precise location choice estimations and predictions, and by ignoring this step, the findings might be unable to capture the full complexity of businesses’ location decisions.
The business establishment location choice model is primarily implemented utilizing the framework of multinomial logit (MNL) models ( 12 , 13 ). Most earlier studies used random sampling of alternatives to generate the choice set ( 14 ). However, these methodologies do not fully depict the behavioral dynamics of a business establishment’s location search process. The inclusion of one or more unreliable alternatives in the choice set is, therefore, quite likely to take place, which will end up resulting in biased parameter estimations for the choice model. Few studies have attempted to create a systematic choice set to address this issue ( 10 , 14 ). However, business location choice decision is influenced by various factors, including distance to the central business district (CBD), proximity to transport infrastructure, socioeconomic attributes, and agglomeration factors ( 12 , 15 ). Considering several characteristics to generate a reasonable choice set yields the challenge of building different types of location alternatives, which may be challenging from a methodological and computational perspective. Therefore, the primary research question of this study is how to develop a more sophisticated approach to capture the multi-dimensional factors to develop a better location choice model of businesses. Thus, this study advances a novel machine learning (ML)-based clustering method to generate a plausible choice set for business location choice modeling.
The rest of this paper is organized as follows: In the next section, a literature review synthesizing establishment location choice models is presented. The study area and relevant data are then introduced. Following this, the conceptual framework of the study is outlined. The ensuing section details the methodology employed in the study. The subsequent section unveils the findings of this study, accompanied by a thorough discussion. Finally, the paper concludes by summarizing key findings and suggesting directions for future research.
Literature Review
Integrated land use and transportation models have primarily focused on residential location choices and associated commuting patterns. However, businesses play a crucial role in generating trips involving commercial vehicle movements. Although the development of large-scale integrated models has grown over the last two decades, commercial vehicles have been underrepresented in travel demand modeling. In recent years, there has been an increase in the number of commercial vehicle movement models ( 16 ). Most existing studies have implemented freight demand forecasting modeling utilizing two main methods: (1) commodity-based modeling and (2) trip/tour-based modeling. Commodity-based modeling focuses on analyzing the flow of goods based on their characteristics, origin, destination, and volume, providing insights into infrastructure needs and policy impacts ( 17 ). On the other hand, trip/tour-based modeling examines individual vehicle trips and interactions with the transportation network, offering detailed insights into congestion, travel times, and operational decisions ( 18 ). In both commodity-based modeling and trip/tour-based modeling approaches for freight demand modeling, the location of business establishments plays a vital role.
Business location choice modeling is a multidisciplinary field that draws insights and methodologies from various academic disciplines ( 19 , 20 ). The location decisions of businesses can often be categorized into three main factors: accessibility, office profile, and business profile ( 21 ). These factors encompass various aspects that influence where a business chooses to locate its operations ( 22 , 23 ). Transportation and infrastructure are critical considerations, as businesses seek locations with good access to highways, airports, ports, and public transit systems ( 24 – 27 ). Such proximity minimizes transportation costs and facilitates the efficient movement of goods and personnel. The locational preferences of businesses are influenced by household income, population density, and proximity to the CBD ( 24 , 28 ). High household incomes attract businesses seeking affluent consumers, densely populated areas appeal to those targeting larger customer bases, and proximity to the CBD affects accessibility and networking opportunities for various firms. Additionally, businesses often favor locations with agglomeration benefits, where the concentration of similar or related industries fosters synergies, knowledge-sharing, and improved access to skilled labor and resources ( 29 – 33 ). In the existing literature, a limited number of studies specifically address business establishment location choice from a freight perspective, focusing on the movement and transportation of goods and commodities ( 34 – 38 ).
Business establishment location choice modeling involves considering a wide range of available alternatives for a business, which can vary from hundreds at the zonal levels to thousands at the parcel levels. The two-step business establishment location choice model that aims to mimic search process has some difficulties in dealing with a wide range of spatial alternatives. One of the most widely adopted techniques to address the challenges associated with many alternatives is a random sampling of alternatives. Manski introduced a two-step discrete-choice modeling framework ( 39 ), wherein the first stage involves deriving a subset of choice alternatives from the universal choice set. This initial selection process can be executed through the application of predetermined criteria for choice set selection or through a random selection approach ( 40 , 41 ). McFadden demonstrated that a subset including the observed choice and a random sample from the potential choices might be used as a substitute for the entire choice set ( 42 ). Although random sampling-based approaches offer computational advantages, it is important to be aware of the potential bias and inconsistent parameter estimates that can arise through improper representation of alternative choice sets ( 43 ). Several studies on modeling the location choice of business establishments have been conducted to address this issue, utilizing observed data to create structured choice sets. For instance, Elgar et al. searched for businesses employing two geographical anchor points: the existing location and the location of the firm’s owner ( 10 ). The chosen set was then constructed by drawing an ellipse around these two points. Then, a MNL model based on random sampling is estimated utilizing the constructed choice set. De Bok and Sanders applied route choice modeling principles to generate systematic choice sets for each identified business relocation ( 14 ). A representative collection of possible business locations was constructed by developing progressive subsets of alternatives ( 44 ). These systematic choice sets have considered a specific location choice attribute, although multiple factors affect the location choice process of businesses. Recently, there have been attempts to utilize ML techniques in the residential location choice model to develop a systematic choice set. For instance, Orvin and Fatmi employed the Gaussian mixture model for their residential location search model ( 45 ). However, the application of ML in the business location choice model remains scarce in literature.
The literature review suggests that there are limited studies which represent the behavioral process of business location choice. Therefore, the primary research question of this study revolves around developing a more refined approach to include the multi-dimensional location choice attributes in the two-step location choice model of businesses. The significance of this research lies in its potential to deepen the understanding of business location choice behavior, improve predictive precision, guide strategic decision-making for businesses, inform policymaking, and optimize resource allocation. In essence, bridging this research gap holds both theoretical implications and practical applications for urban freight movement. In this study, a novel ML approach has been introduced in the two-step location choice model of the business establishment to generate a finite number of plausible alternatives while precisely preserving the multi-dimensional location choice attributes in a single frame. An extensive dataset, Info Canada Business Establishment data for 2022, is utilized in this study to develop the location choice model of businesses as part of a comprehensive freight demand modeling for Halifax Regional Municipality (HRM).
Contribution of the Study
This study contributes significantly to the transportation and land use modeling and geography literature as it models the location choice of business establishments. The strength and novelty of this study lie in its proposed framework, which effectively combines ML techniques with conventional econometric modeling to develop a comprehensive two-stage location choice model of business establishments. One of the substantial contributions of this study is adopting an unsupervised ML algorithm to address the multi-dimensionality of influential factors of the location choices of businesses to address the first stage of the location decision. A Density-Based Spatial Clustering of Applications with Noise (DBSCAN) clustering algorithm was implemented to identify clusters of locations based on multi-dimensional attributes of business location choices. Following the clustering process, econometric modeling (logit/mixed logit model) has been utilized to model the location choice of businesses as part of a comprehensive freight demand modeling.
Potential of DBSCAN for Generating Business Location Choice Sets
DBSCAN holds significant potential for generating business location choice sets. It is a popular clustering algorithm that efficiently identifies dense regions in spatial data. When applied to business location data, it can help identify clusters of potential business sites that share similar characteristics and are located near each other. The applicability lies in its ability to handle noise and outliers in the data, which is crucial when dealing with real-world business location datasets that may contain inaccuracies or irregularities. By eliminating noise and focusing on dense regions, DBSCAN can identify meaningful clusters of potential business locations, helping decision-makers understand the distribution and spatial patterns of suitable areas for new business establishments. In addition, it does not require specifying the number of clusters beforehand, unlike some other clustering algorithms. This attribute is particularly advantageous in generating business location choice sets, as it allows for a more flexible and adaptive approach when dealing with varying market demands and changing geographical conditions. Additionally, the ability to detect irregularly shaped clusters makes it well-suited for capturing complex spatial patterns that might not be easily identifiable through other clustering methods. Consequently, it assists in creating a more accurate and realistic location choice sets, providing valuable insights for businesses to make informed decisions.
Study Area and Data
The area of interest for this research is the HRM, the capital city of Nova Scotia, Canada (Figure 1). This region covers an estimated area of 5,577 square kilometers. A substantial dataset sourced from Info Canada Business Establishments for 2022 has been employed for this research. Table 1 summarizes information about the business establishments in the study area. This reliable and comprehensive dataset contains detailed records of firms with a 7-digit NAICS (North American Industry Classification System) code for the HRM. The data include valuable information about each establishment’s name, type, geographic location, total number of employees, sales volume, and year of establishment. In total, there are twenty different types of establishments. Businesses are categorized into five broad economic sectors—industry, retail, service, transportation, and wholesale—based on their NAICS code to group them more effectively (Table 1).
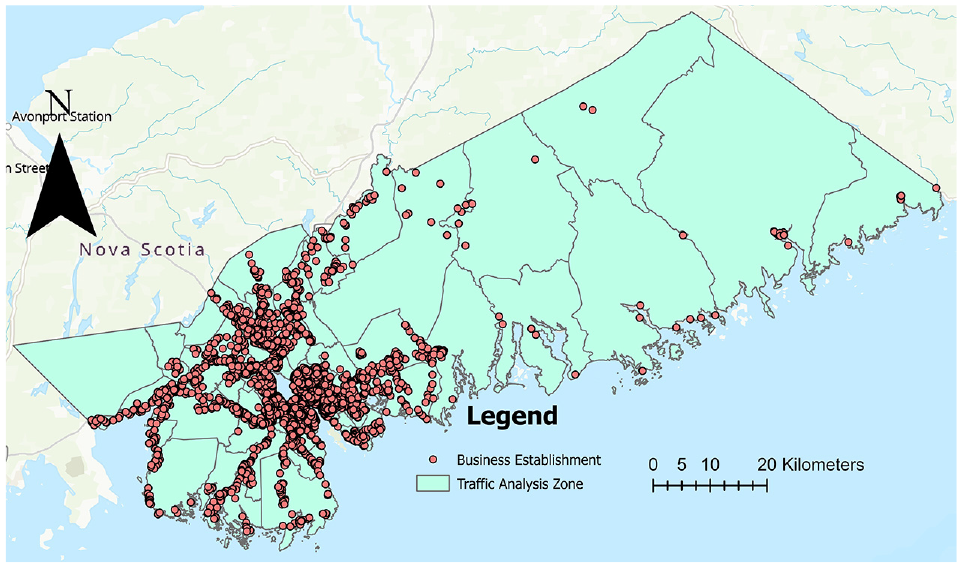
Distribution of establishments within the study area—the Halifax Regional Municipality.
Descriptive Statistics of Info Canada Dataset 2022
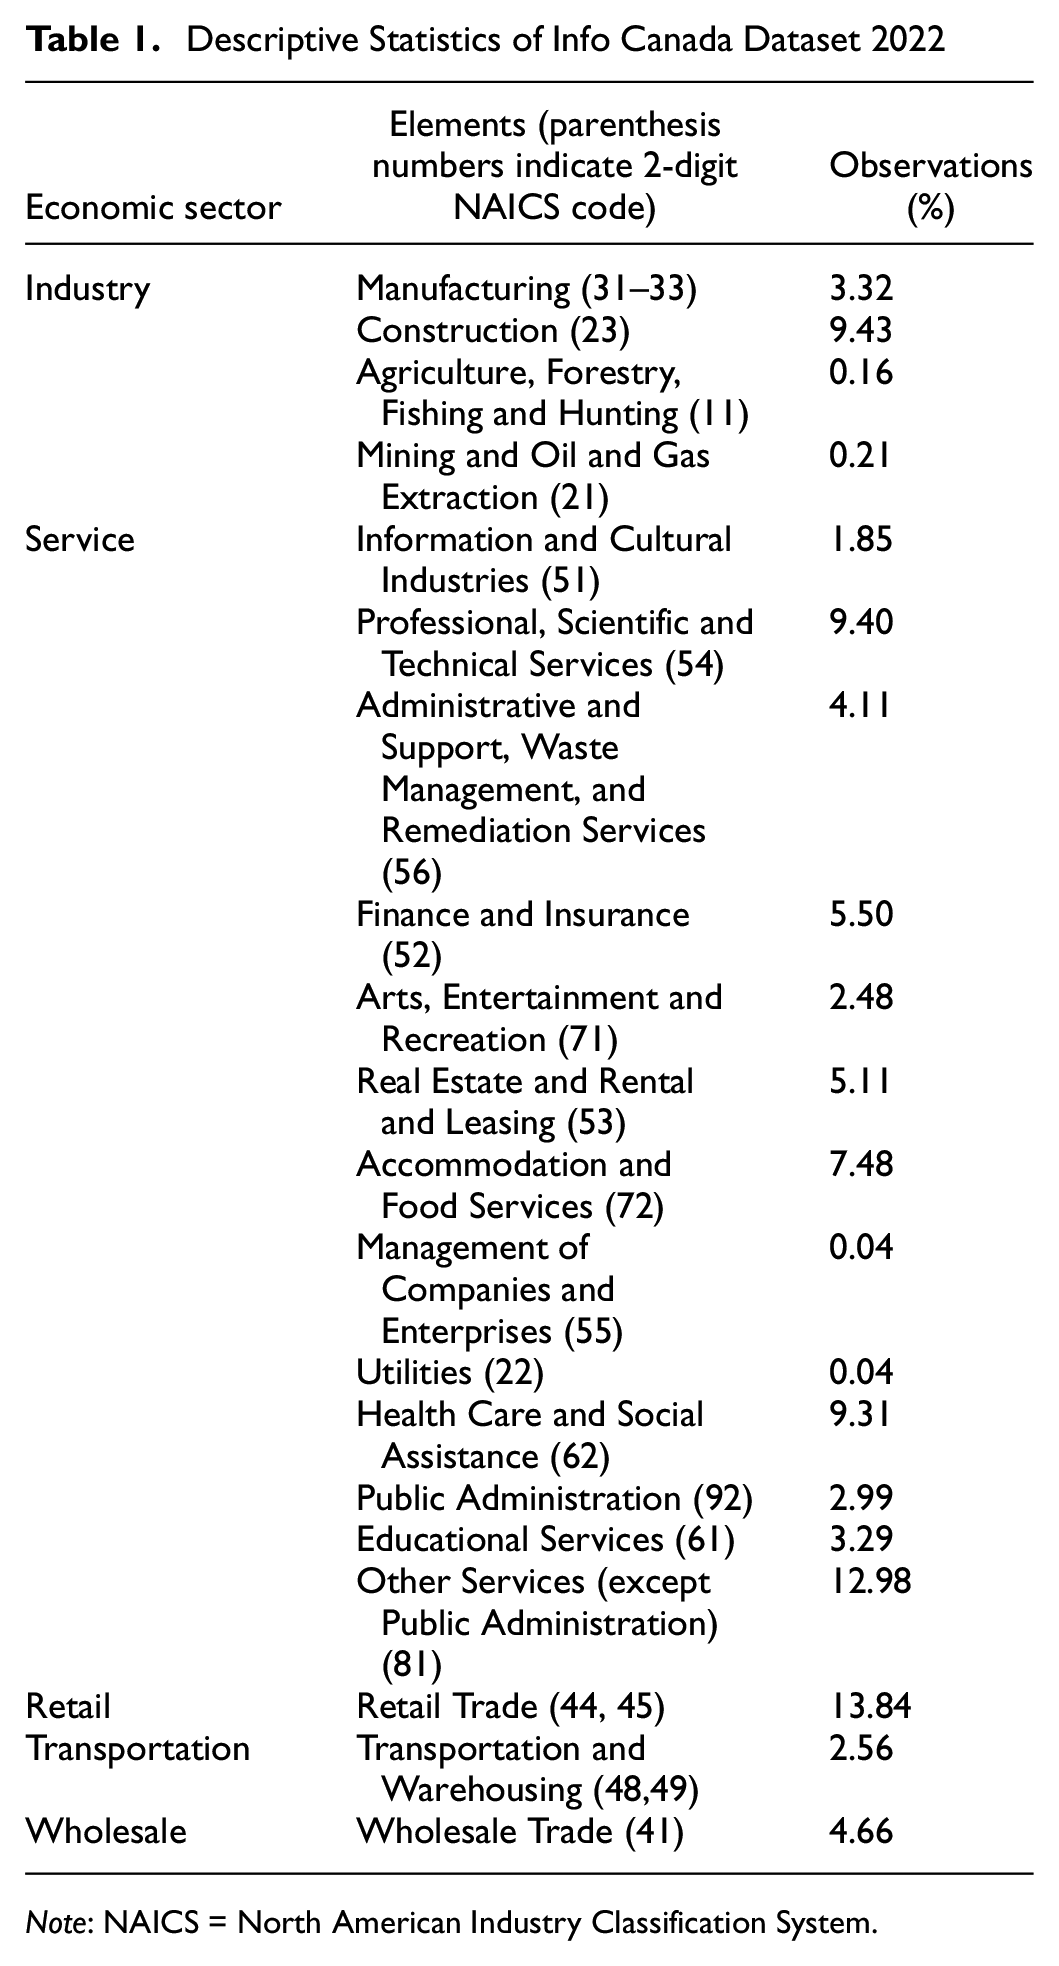
Note: NAICS = North American Industry Classification System.
For geospatial analysis, the exact longitude and latitude coordinates of each business were used to geocode them in ArcGIS Pro. Additionally, the 219 traffic analysis zones in the Halifax Transport Network Model ( 46 ) were spatially joined with the establishments to extract several zonal variables. This study uses entropy, which is a crucial metric for capturing the diversity and heterogeneity of businesses within a specific zone. It allows us to evaluate the range of establishments present in an area, shedding light on regions with dynamic and competitive commercial landscapes. A high zonal entropy value indicates a mixture of consumer preferences, empowering businesses to cater to a broader customer base and potentially discover niche markets that align with specialized offerings. The zonal entropy formula is as follows:

where
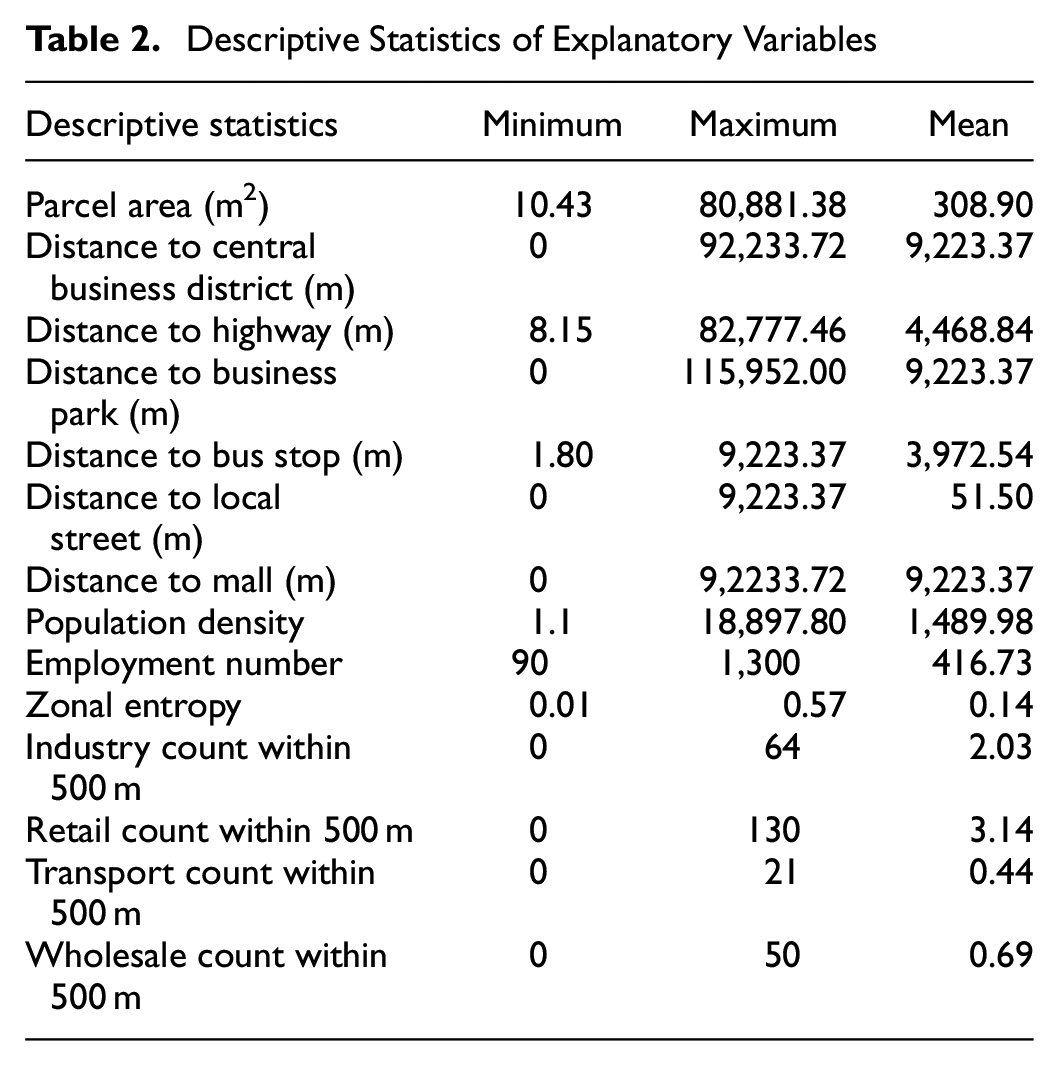
Additional information has been collected from 2021 Canadian Census. In this study, the location choice of a business establishment is considered at the parcel level. Table 2 demonstrates the descriptive statistics of the explanatory variables used in the location choice model. Because the census data are presented in an aggregate manner, it was necessary to disaggregate the information to obtain data at the individual parcel level. To achieve this, the approach employed in this study followed the method proposed by Bracken and Martin ( 47 ), known as cross-area interpolation. This technique utilizes kernel estimation to convert a spatial distribution based on census centroid data into a continuous density surface. Subsequently, this density surface is overlaid onto parcels, making it compatible with other Geographic Information System data. By implementing this method, several variables were generated at the parcel level.
Descriptive Statistics of Explanatory Variables
Conceptual Framework
A comprehensive two-stage location choice model of business establishments is developed in this study (see Figure 2). The developed business establishment location choice model operates at the parcel level, representing the utmost precision in its characterization.
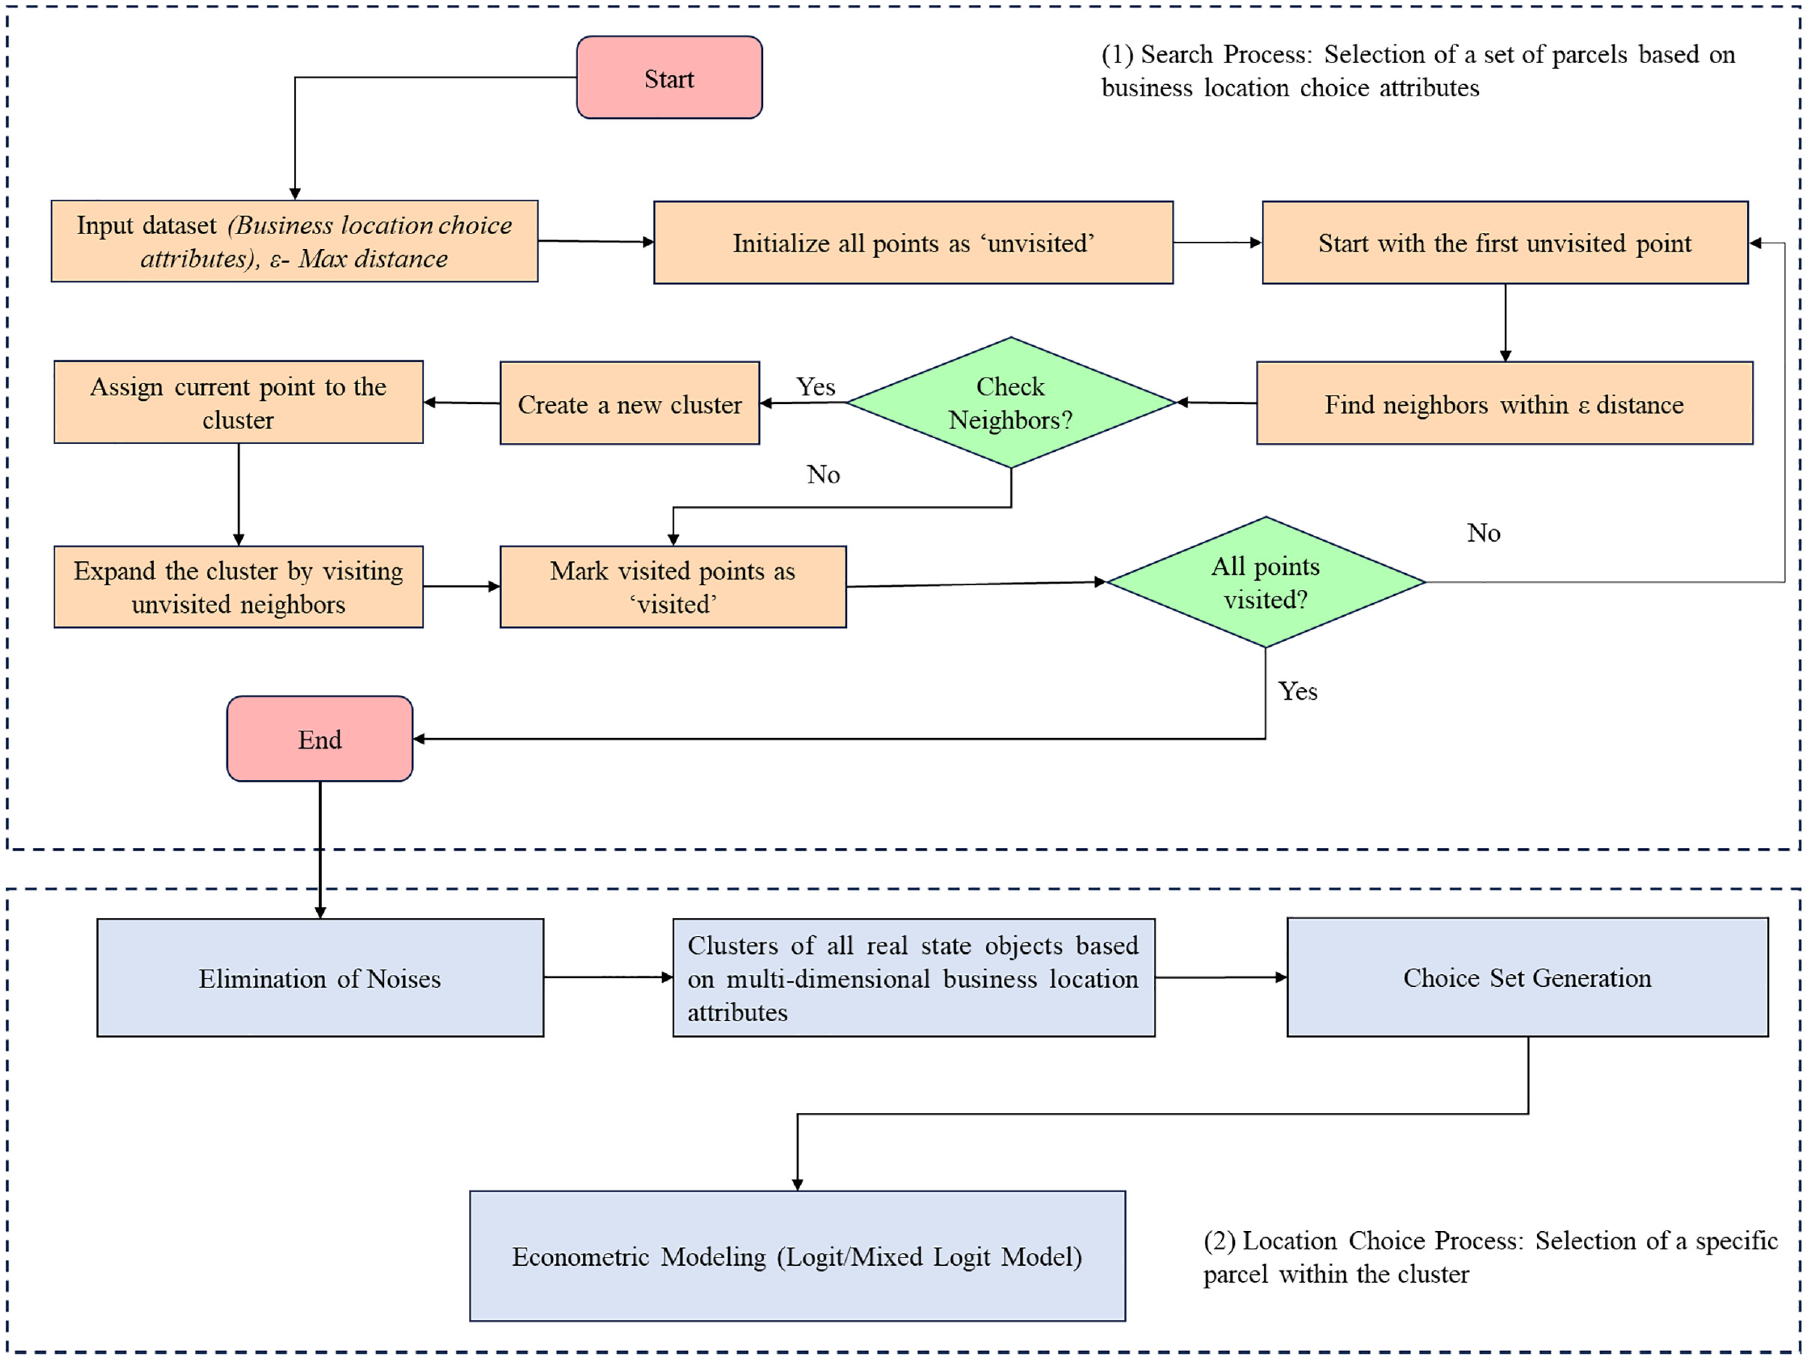
Conceptual framework for two-stage business establishment location choice model.
The DBSCAN generates clusters of parcels based on the relative importance of the multi-dimensional business location choice attributes. It starts with an initial input of data points and the value of epsilon (ε), which defines the maximum distance between points for them to be considered neighbors. The algorithm initializes all points as “unvisited.” Then, it begins with the first unvisited point and finds its neighbors within the specified
This study hypothesized that businesses prioritize multi-dimensional location choice attributes in selecting a business location to depict the first stage of the location choice process, mimicking the search process. For instance, industries encompassing transportation and warehousing, real estate, and rental and leasing, manufacturing, construction, and public administration exhibit a propensity to cluster within regions characterized by low population density. This phenomenon is conjectured to be attributable to several influential factors, notably the cost of land, accessibility to transportation routes, zoning regulations, availability of space for expansion, considerations pertaining to noise and environmental impacts, as well as the advantages arising from specialization and agglomeration economies. The most significant multi-dimensional location choice attributes are included in the unsupervised ML algorithm to categorize real estate objects for each establishment. The generated cluster based on the multi-dimensional location choice attributes have the potential to provide a comprehensive understanding of the economic landscape and potential market opportunities in an area.
Utility maximization is assumed to influence businesses to mimic the second stage of the location choice model. In this stage, the decision-maker is assumed to evaluate a set of alternatives and choose the one that maximizes their utility or satisfies their preferences. This holistic approach aids decision-making processes related to business establishments, enabling stakeholders to identify optimal locations based on market size, competition level, and economic conditions.
Methodology
Density-Based Spatial Clustering of Applications with Noise
DBSCAN is a widely used clustering algorithm for multi-dimensional spatial data based on density. This algorithm seeks to effectively partition data points into clusters, concurrently detecting noise points that do not exhibit strong association with any cluster. This algorithm fundamentally depends on two key parameters: the neighborhood radius denoted as
Let,
A data point xi is considered a core point if the number of points within its neighborhood

The neighborhood

The reachability distance is a crucial concept in DBSCAN, which is the maximum of the distance between a core point

This measure enables the identification of directly density-reachable points, wherein a data point
Additionally, DBSCAN employs the concepts of density-reachability and density-connectivity. A data point
DBSCAN identifies clusters as non-empty sets of data points that satisfy specific conditions. A cluster
Silhouette Coefficient
To assess the quality of clustering results obtained through the application of the DBSCAN algorithm, one of the commonly used matrices is Silhouette Coefficients. The Silhouette Coefficient value represents the similarity of each data point to its assigned cluster compared with other clusters, with a range from −1 to +1. The Silhouette Coefficient plot showcases horizontal bars, one for each cluster, with their widths indicating the number of data points within the respective clusters. Interpretation of the Silhouette Plot involves examining the Silhouette Coefficient values for each cluster. Positive values close to +1 indicate well-clustered data points appropriately assigned to clusters, whereas values near 0 suggest data points near decision boundaries and suboptimal clustering. The Silhouette Coefficient for a single data point i is calculated using the following equation:

where
Mixed Logit Model
This study has formulated distinct location choice models for each economic sector: Industry, Retail, Service, Wholesale and Transportation. To comprehensively address unobserved heterogeneity within business establishments in a given sector, this study employs a mixed multinomial logit (MMNL) modeling approach. Recognizing the diverse preferences inherent in businesses, the adoption of a standard logit model assuming homogeneity proves insufficient in adequately capturing these intricacies. The utilization of the mixed logit model allows for the accommodation of variations in preferences and considers unobservable factors that affect location decisions. This sophisticated modeling approach enhances predictive accuracy, thereby enabling businesses and policymakers to make more informed decisions.
Let

where
Here

In the mixed logit model, the parameter

The form of the distribution for
The expression for the random coefficient, utilizing a normal distribution as the mixing distribution, can be stated as follows:

where
Within the NLOGIT6.0 platform, the model is estimated, and its goodness of fit is measured using the log likelihood function, Akaike information criterion (AIC), and R 2 values.
Results and Discussion
Choice Set Generation Based on Cluster Analysis
In the clustering process, three distinct clusters (Cluster 0, Cluster 1, and Cluster 3) have been identified. The presence of cluster label -1 indicates noise points that were not assigned to any specific cluster.
Figure 3 demonstrates a reasonably separated clusters obtained through the application of the DBSCAN algorithm, offering a reliable and meaningful clustering outcome. The following meaningful insights are extracted from the generated cluster by utilizing density plots (Figure 4) and a heatmap (Figure 5) for all attributes within each cluster:
Cluster 0 (Accessible but less affluent suburban areas): It comprises locations that exhibit a relatively near proximity to key urban amenities, such as the CBD, highways, business parks, public transit, and local streets. However, these areas are notably further away from shopping malls. The population density and income levels in this cluster hover around the average, whereas employment levels are below average. Moreover, the diversity of employment in Cluster 0 is also below average, indicating a lower range of economic activities. These characteristics collectively suggest that Cluster 0 represents accessible but less affluent suburban areas with some clustering of economic activity, albeit with lower diversity. Businesses that might thrive in this cluster include discount retailers catering to value-conscious customers, fast food restaurants strategically located close to residential communities, and various service-based establishments serving the surrounding suburban population.
Cluster 1 (Less accessible, lower density suburban areas): Cluster 1 is situated at considerable distances from the CBD, highways, and business parks. However, these areas enjoy average accessibility to public transit, local streets, and shopping malls. Cluster 1 exhibits significantly lower population density, slightly below-average income, and employment levels. Moreover, the diversity of employment in this cluster is approximately average. This suggests that Cluster 1 represents less accessible, lower density suburban areas with a moderate mix of industries. Businesses likely to thrive in this cluster include big box retailers, requiring substantial land area, automotive-related ventures such as car dealerships and repair shops, and storage facilities well-suited for lower density regions.
Cluster 2 (Accessible, higher density areas near business parks and highways): It comprises locations that are farthest from public transit, local streets, and shopping malls but enjoy the closest proximity to highways and business parks. The distance to the CBD is approximately average. This cluster exhibits significantly higher population density, whereas income and employment levels are slightly below average. Moreover, the diversity of employment in Cluster 2 is below average, indicating a more limited mix of industries. These characteristics collectively suggest that Cluster 2 represents accessible, higher density areas situated near business parks and highways. Businesses that might flourish in this cluster include office buildings seeking locations with excellent transportation access and amenities, hotels catering to business travelers, restaurants targeting affluent customers willing to travel further for a premium dining experience, and specialty retailers offering unique products to an upscale demographic.
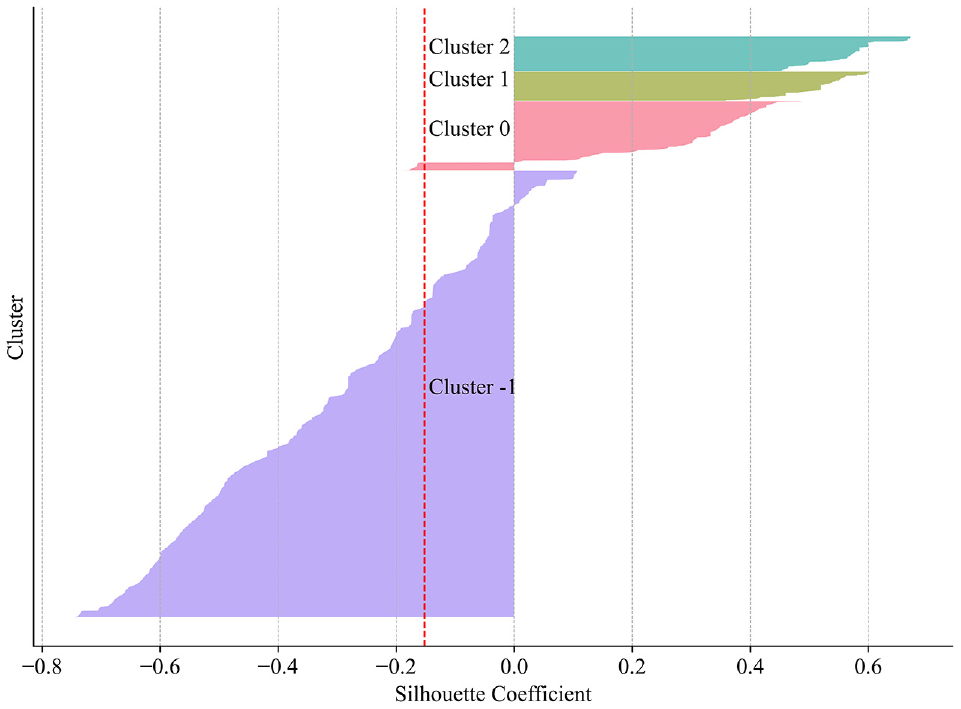
Silhouette plot for density-based spatial clustering of applications with noise (DBSCAN).
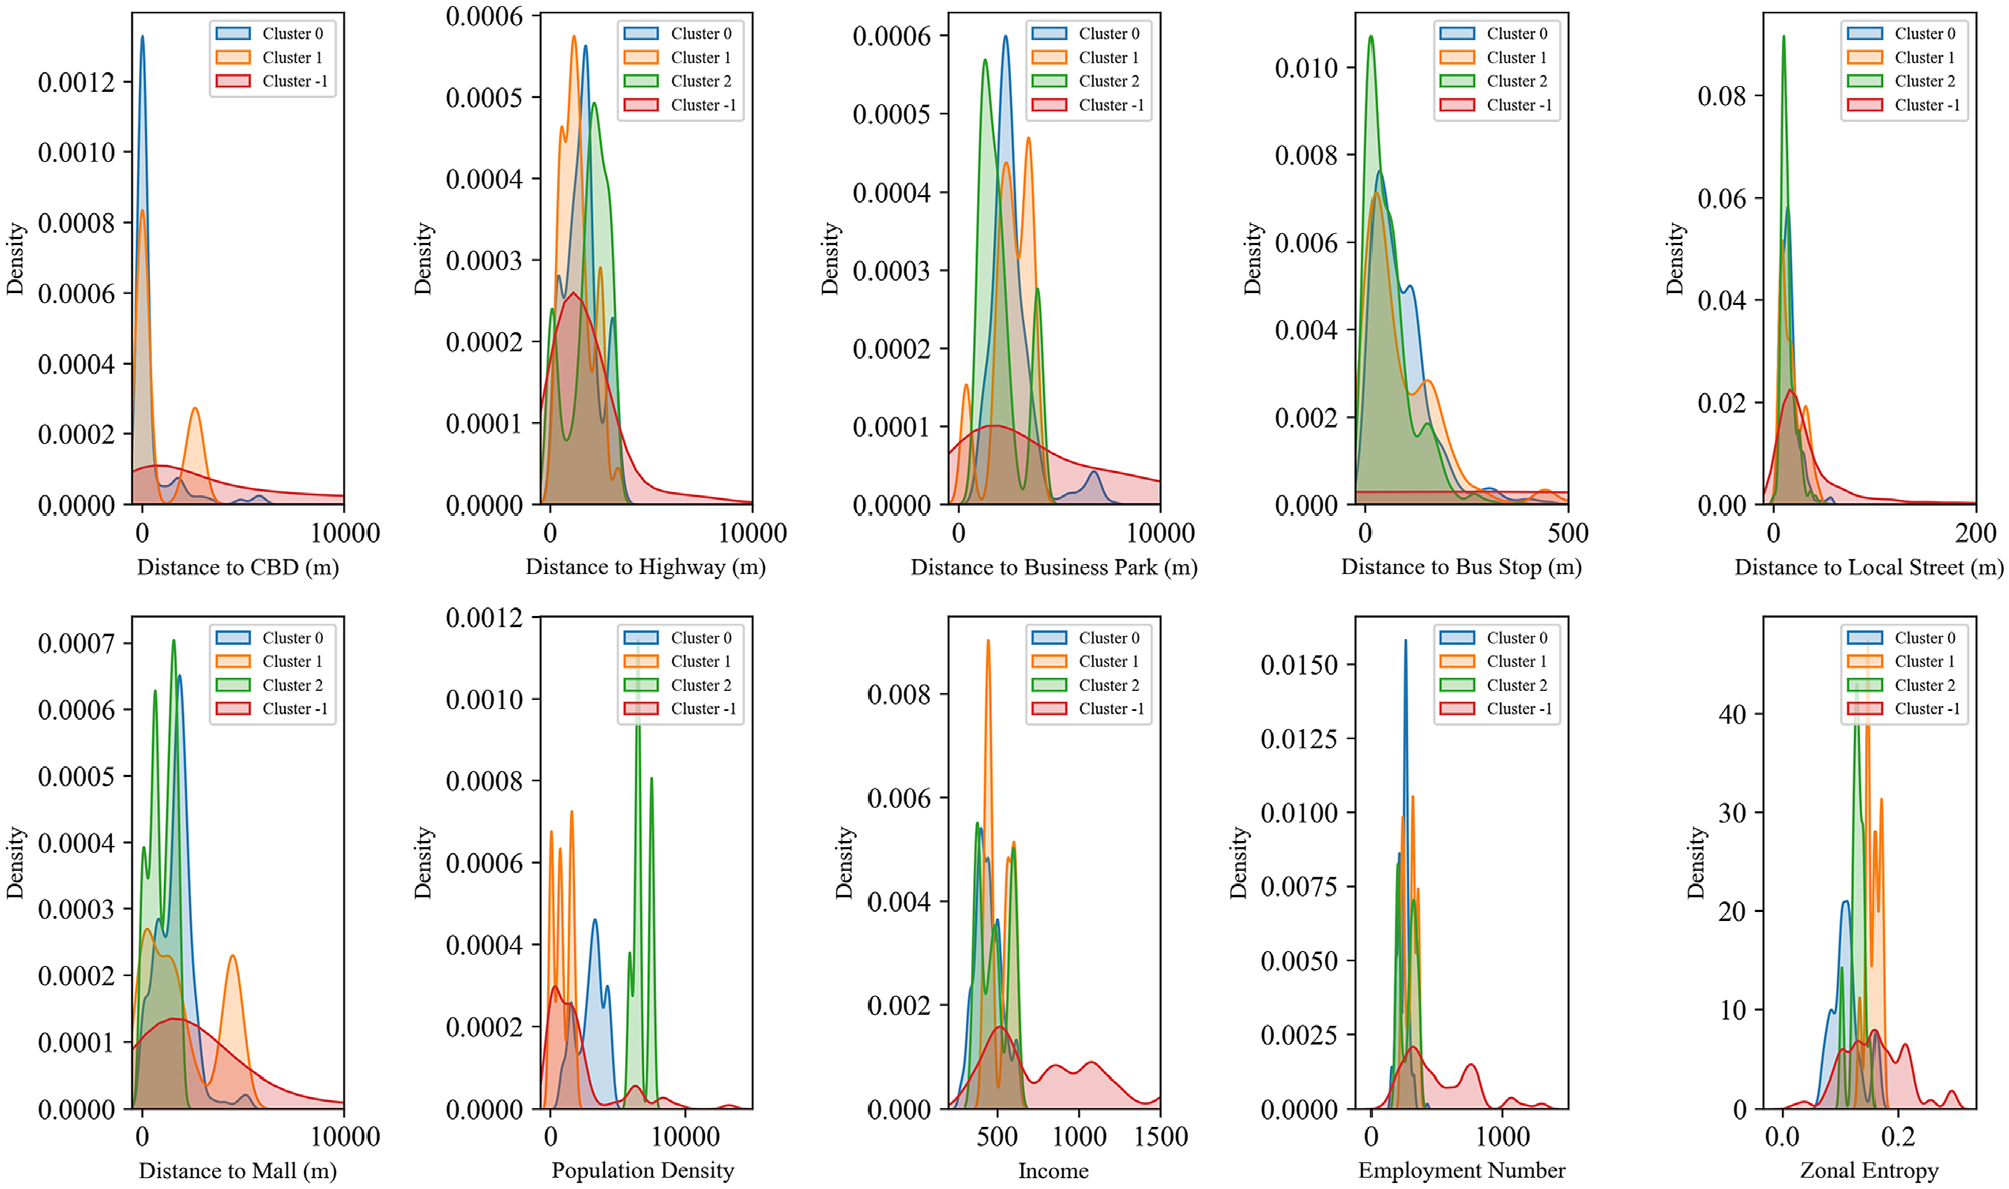
Density plots for all attributes within each cluster.

Heatmap for all attributes within each cluster.
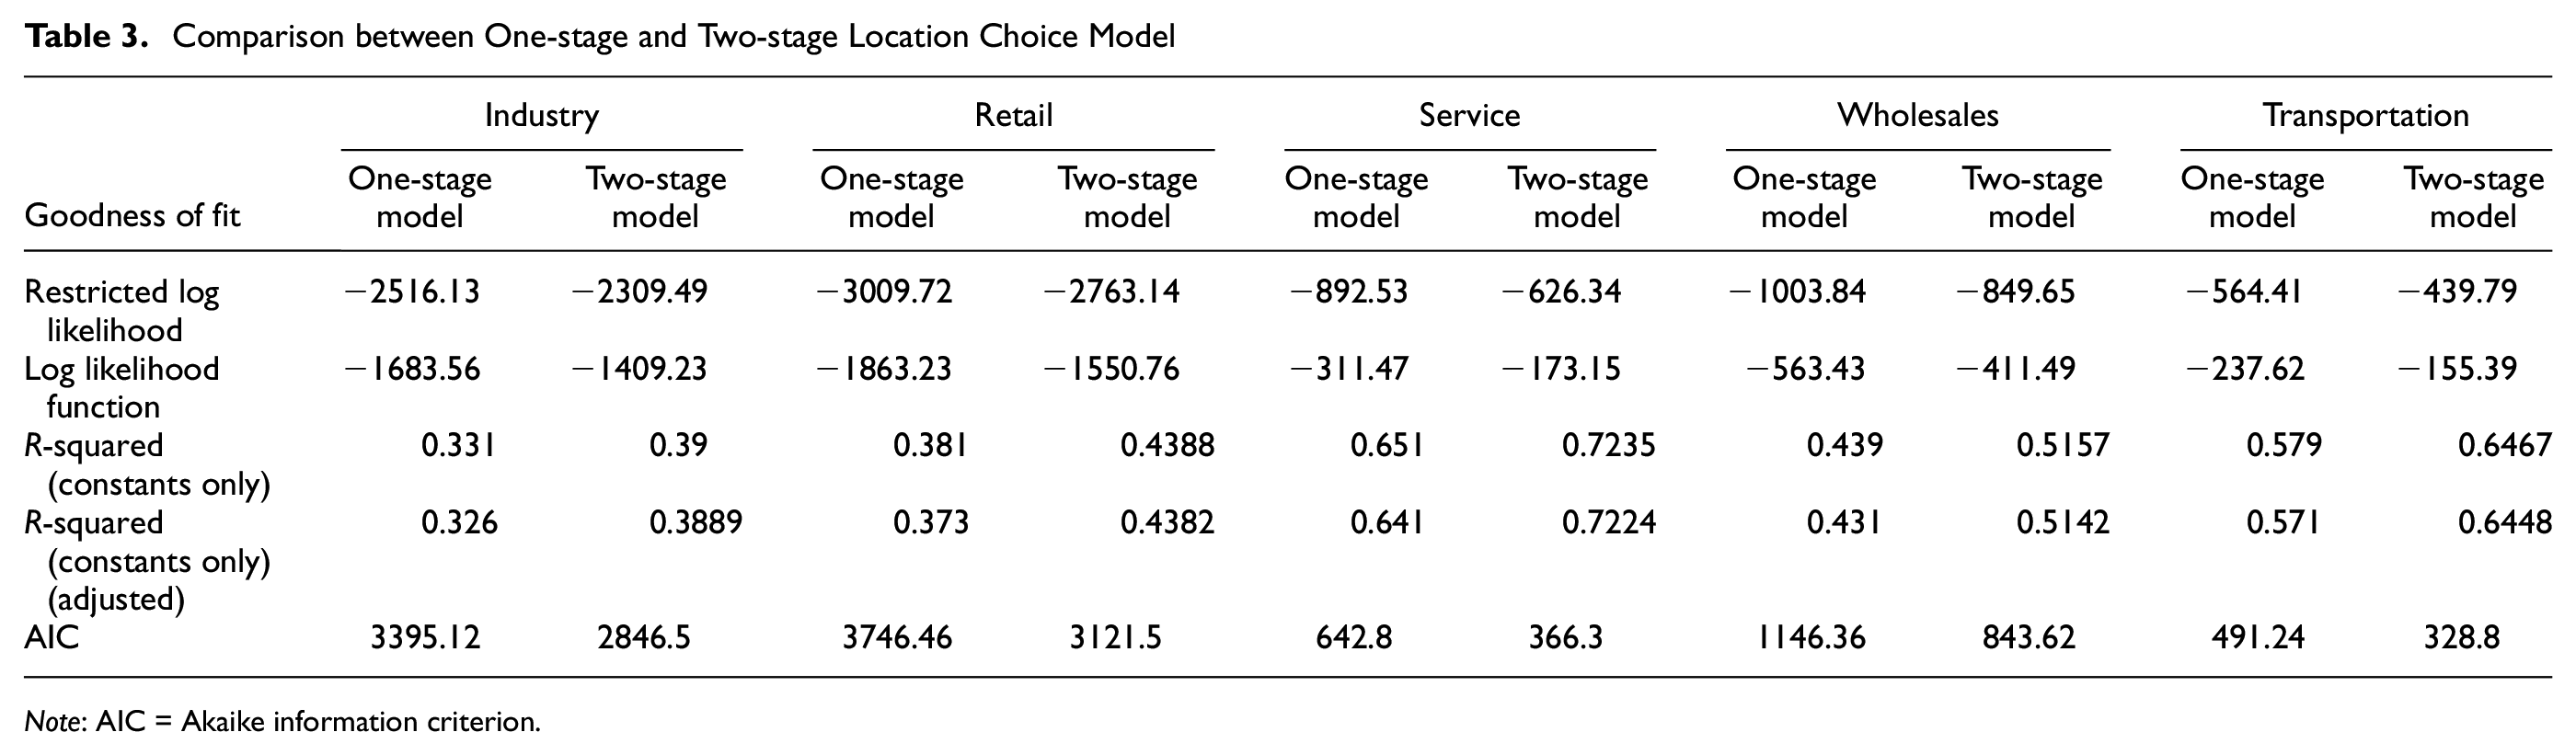
The revealed underlying structure of the clusters provides essential support for data-driven decision-making. Once the noises are removed, the clusters of parcels that emerge serve as the basis for establishing a rational selection pool for a business establishment. Subsequently, ten parcels are randomly chosen, including the one that has been pre-selected, to form the ultimate choice set. The rationale behind choosing this specific number is to minimize computation time. In addition, it reduces the likelihood of violating the independence of irrelevant alternatives as the unobserved attributes of locations in the same neighborhood are likely to be similar ( 42 ). McFadden ( 42 ) demonstrated that a subset, comprising the observed choice and a random sample from the potential choices, can serve as a substitute for the entire choice set. This study postulated that such an approach would eliminate unreliable alternatives from the selection pool. The effectiveness of the systematic choice set was assessed using a MMNL model. In this analysis, ten alternatives were randomly selected, without taking into account the systematic choice set generation, encompassing the pre-selected alternative, forming the final choice set. The findings (Table 3) reveal that the systematic choice set model achieved better goodness of fit compared with the model with randomly chosen alternatives, thus confirming the validity of the initial hypothesis, which suggests that eliminating inaccurate alternatives through the systematic choice set generation improves the goodness of fit.
Comparison between One-stage and Two-stage Location Choice Model
Note: AIC = Akaike information criterion.
Location Choice Model of Five Economic Sectors
The estimated coefficients of the explanatory variables, accompanied by their respective t-statistics in parentheses are presented in Table 4. The coefficients represent the effect of each explanatory variable on the likelihood of a business choosing that location, holding all else constant. Positive coefficients indicate a higher likelihood and negative coefficients a lower likelihood.
Parameter Estimation of Business Location Choice Model
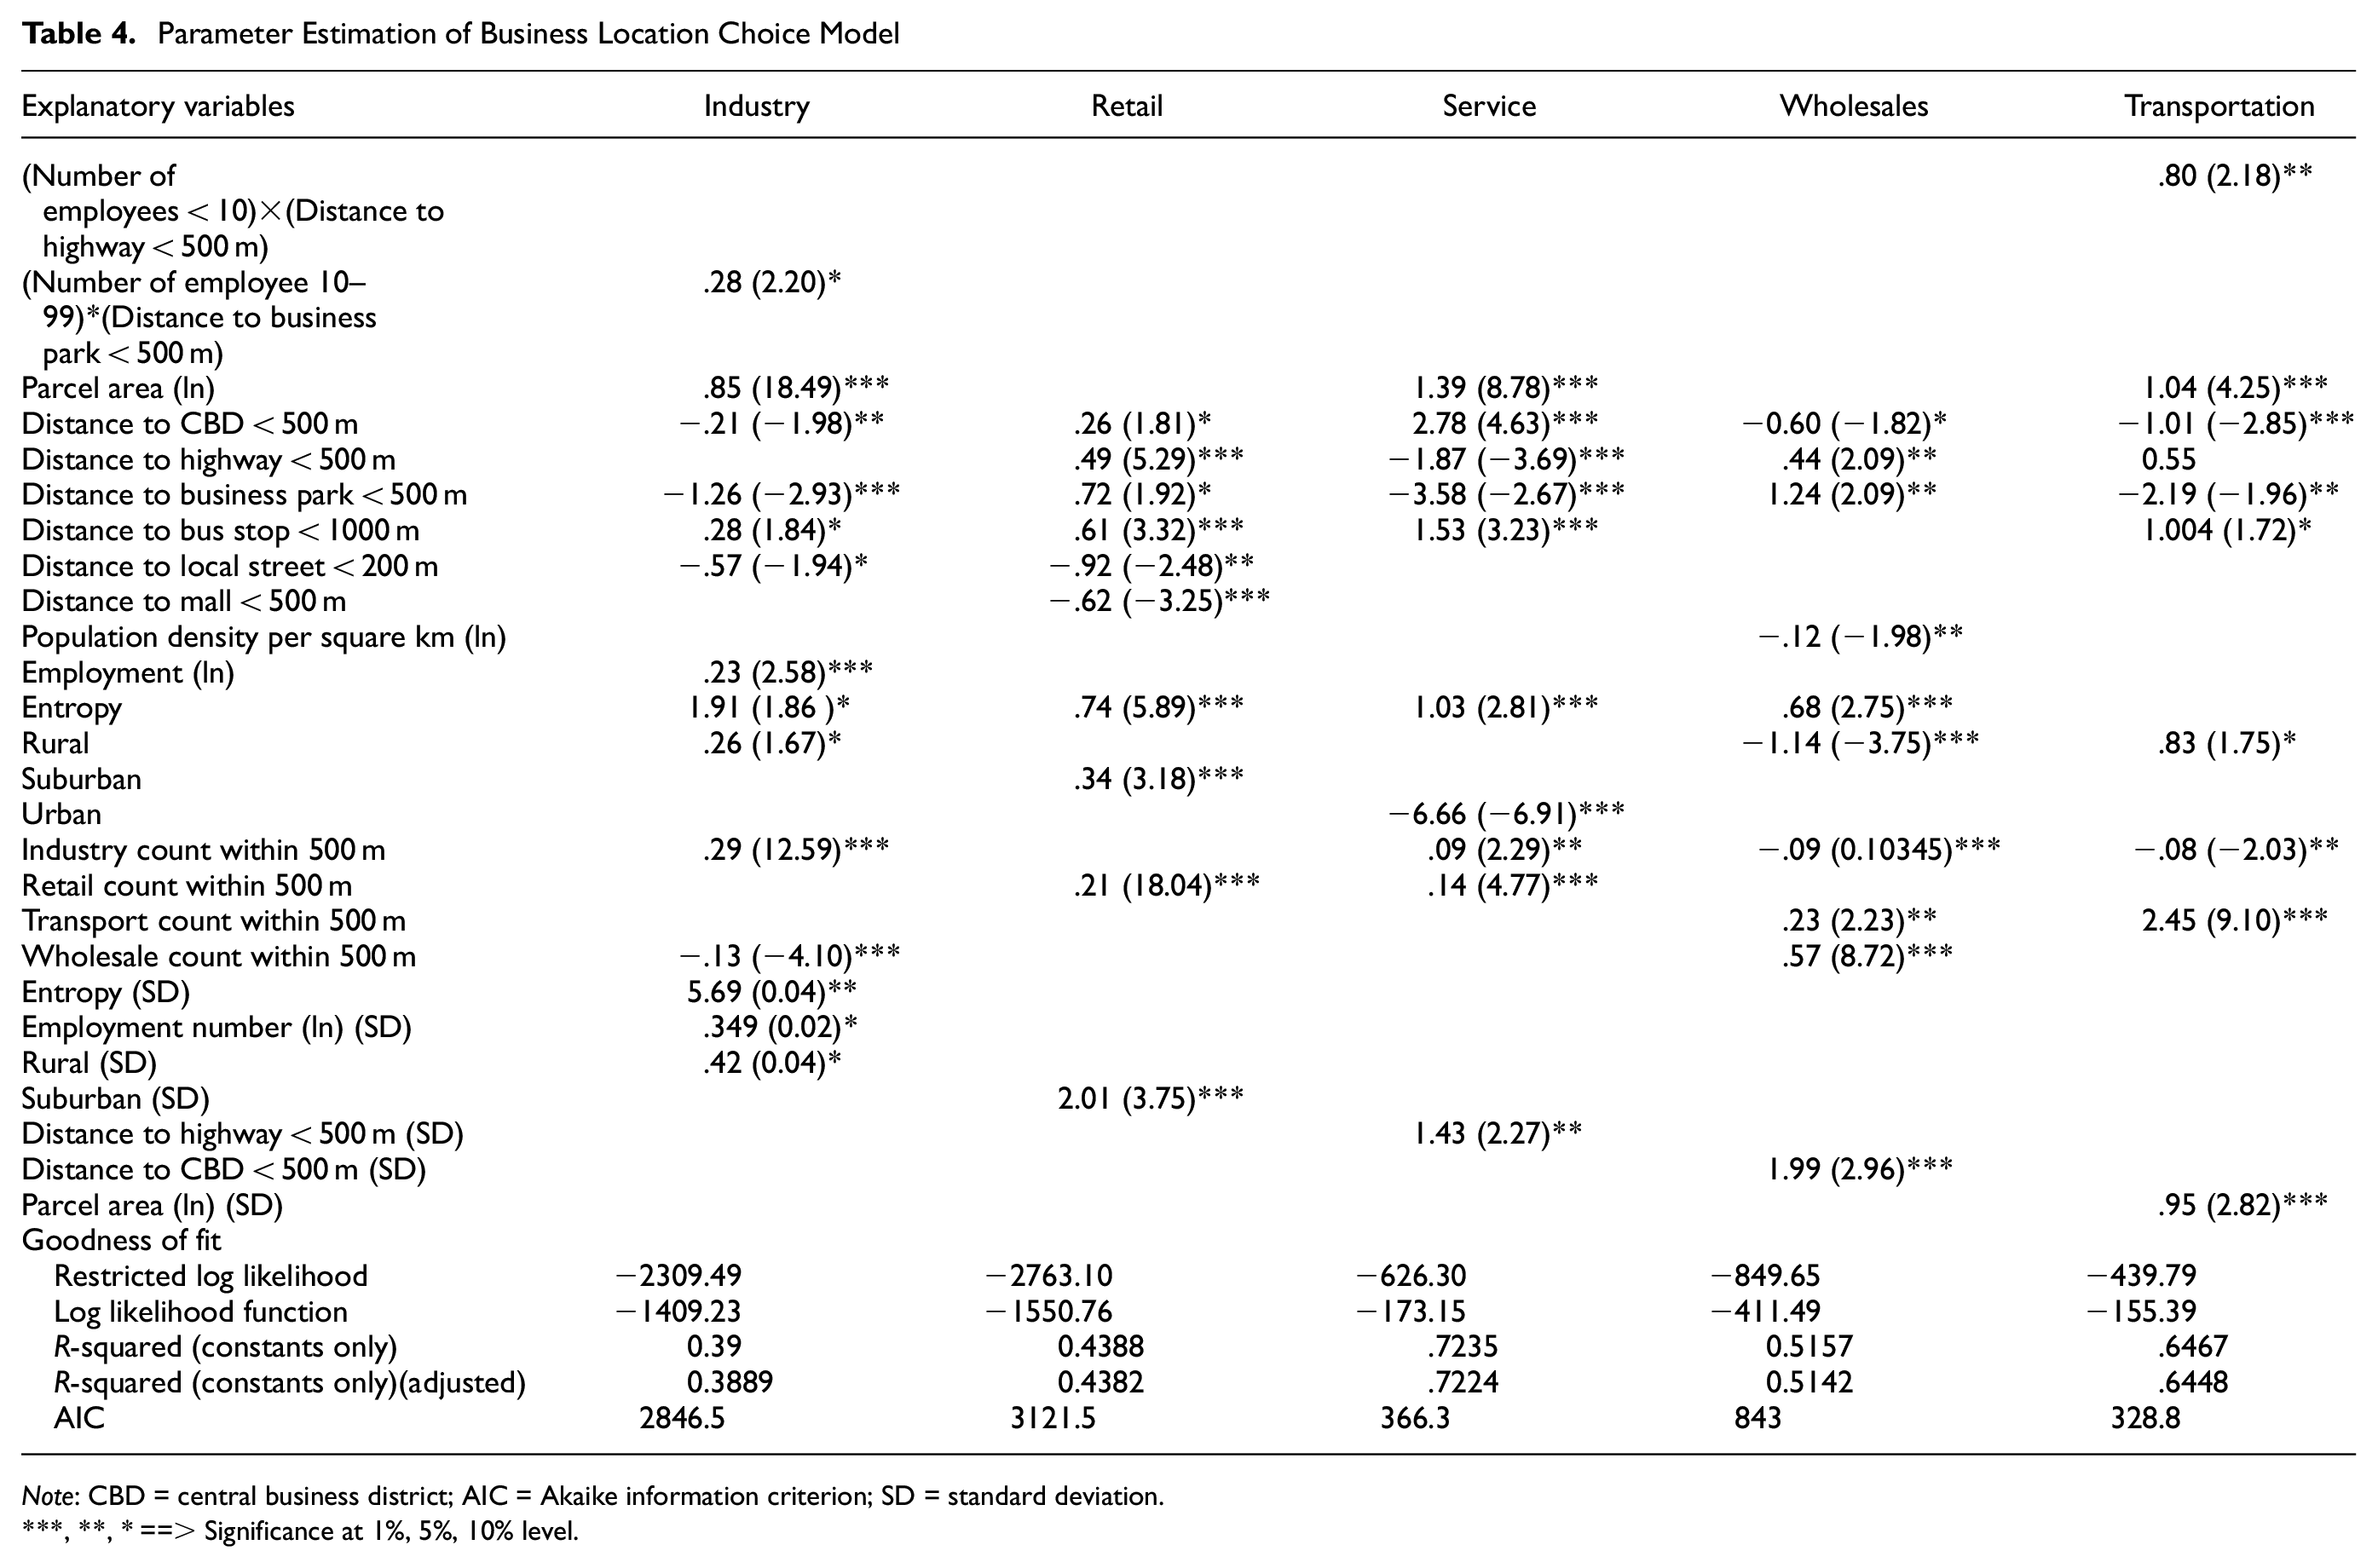
Note: CBD = central business district; AIC = Akaike information criterion; SD = standard deviation.
, **, * ==> Significance at 1%, 5%, 10% level.
Moreover, the suburban setting emerges as a notable aspect affecting the decision of retail location. On average, being in a suburban area increases the likelihood of selection. However, the situation is not uniform among all retailers, as indicated by the standard deviation term. Some retailers strongly prefer suburban locations, whereas others do not find them as appealing. The attractiveness of suburban areas to retailers may stem from various factors, including potentially lower costs, larger land parcels, and more parking options. Nevertheless, the observed variation in retailers’ preferences for factors like customer base, costs, and agglomeration contributes to the heterogeneity in the desirability of suburban locations for retail businesses. Thus, understanding these diverse factors is essential for making informed decisions when choosing the most suitable retail location.
However, certain factors are found to have a negative impact on the log odds of choosing a location for service uses. Proximity to highways, business parks, and urban areas is associated with a decrease in the likelihood of selection. Although major road access is still necessary, service businesses often prefer locations with less highway proximity to avoid noise and congestion. Standalone locations are also preferred over business parks because of the flexibility and cost-effectiveness they offer. Non-urban locations are favored as well, as they provide ample space, lower costs, and less congestion, while still being accessible, as indicated by the positive effect of CBD proximity. Higher land use diversity and the presence of surrounding industries and retailers also play a role in location selection, albeit to a lesser extent. One notable finding is the significant heterogeneity in preferences in relation to highway proximity among service uses. This variation is attributed to the diverse needs and customer bases of different service businesses, leading to differing opinions on the importance of highway proximity in their choice of location.
Conclusions
The framework presented in this study to develop a behaviorally plausible location choice alternatives of business establishments incorporated multi-dimensional built environment and neighborhood attributes. The integration of the unsupervised ML technique with the MMNL model allows a data-driven approach to understand the intricate phenomenon of the two-stage location choice process of business establishment. This approach can help reveal underlying patterns and connections that might not be visible through the traditional one-step MNL model. The rigorous analysis yields insights into how certain types of businesses conduct the initial search process considering the influential built environment and neighborhood characteristics in a two-step location choice model. The outcomes from this study indicate that the choice of location for service businesses is influenced by several factors, such as larger parcel areas, proximity to the CBD, and access to public transit, which are associated with higher log odds of selection. On the other hand, factors like proximity to highways, business parks, and urban areas have a negative impact on the likelihood of selection, with standalone, non-urban locations preferred for their flexibility, cost-effectiveness, and access to diverse customer bases. The transportation industry prefers larger sites for crucial operational needs, and smaller transport businesses choose locations near highways. They prioritize standalone locations over business parks, prefer clustering with related transport businesses, and the volume of goods movements and truck traffic varies widely based on the scale and type of each transportation use.
However, this study is subject to certain limitations and future directions, as it exclusively focuses on a constrained set of the accessibility factors (transportation infrastructure, proximity to major roads, highways, airports, and public transportation options) as the influencing features governing business establishments’ location choice. Although these attributes significantly influence business location decisions, they do not encompass the entirety of the factors that affect location choice of businesses. The inclusion of office and business profile factors in the location choice model for business establishments holds the potential to significantly enhance decision-making accuracy. By incorporating these factors, businesses can make well-informed choices about their preferred locations. The office profile factor allows businesses to identify spaces that cater to their specific spatial needs, work environment preferences, and technological requirements, resulting in increased productivity and employee satisfaction. Simultaneously, the business profile factor aids in selecting locations aligned with strategic objectives and target markets, promoting growth opportunities and networking prospects within the region. By reinforcing brand identity and considering long-term viability, businesses optimize resource allocation and cost-effectiveness.
Furthermore, to enhance the comprehensiveness of location choice modeling, the proposed model can be extended to incorporate qualitative data, including interviews with business owners. With regard to practical considerations, exploring efficient data collection methods is crucial, with a focus on participant selection, interview methodologies, and the reliability of gathered information. The integration of qualitative data offers potential advantages, providing a more holistic understanding of business location choice dynamics. Moreover, incorporating qualitative insights can refine and validate the quantitative model, potentially improving its predictive accuracy and making the location choice model more relevant to real-world scenarios. Additionally, the developed model has the potential to address temporal dynamics in real-world applications through the development of hybrid models (a combination of a time-series forecasting model to predict future conditions and then using DBSCAN to cluster locations based on those predicted conditions). However, the proposed model may encounter certain challenges in practical implementation, particularly in the areas of parameter tuning, cluster adaptability, and memory efficiency. Making strategic parameter choices and implementing optimizations are crucial for ensuring accurate modeling.
The developed two-step location choice model focusing on major economic sectors, including industry, retail, service, wholesale, and transportation, constitutes a noteworthy contribution to the existing literature. The integration of this novel and potentially insightful method provides valuable and in-depth insights for various domains, such as commercial vehicle movement modeling, urban planning, business location strategies, and policymaking concerning economic development. Most importantly, this study represents a substantial advancement in location choice modeling in developing a commercial goods movement modeling for an integrated transport, land use and energy modeling system.
Footnotes
Acknowledgements
The authors would like to thank Climate Action Awareness Fund (CAAF) and Natural Sciences and Engineering Research Council of Canada (NSERC) Discovery Grant for their contributions in supporting this research. The authors are grateful to Maria Lutes for her time to proofread the manuscript.
Author Contributions
The authors confirm contribution to the paper as follows: study conception and design: NM, MAH; data collection: NM, MAH; analysis and interpretation of results: NM, MAH; draft manuscript preparation: NM, MAH. All authors reviewed the results and approved the final version of the manuscript.
Declaration of Conflicting Interests
The author(s) declared no potential conflicts of interest with respect to the research, authorship, and/or publication of this article.
Funding
The author(s) received no financial support for the research, authorship, and/or publication of this article.