
Abstract
Despite much having been published about the effects of the built environment (BE) on urban travel in the developed world, few articles have so far been published based on studies using a megacity in a developing country. The paper addresses the existing gaps in research by conducting a study in Dhaka, one of the densest urban areas globally. An integrated framework based on the structural equation model and discrete choice model is used to examine how individual commute mode choice behavior is influenced by the BE, as mediated by car ownership and commute distance. Three BE features—population density, street connectivity, and job-to-household ratio—have a direct and total positive association with non-motorized transport use. Although being close to bus stops does not directly affect people’s choice to take non-motorized transport, it does promote non-motorized travel in an indirect way by decreasing car ownership and commute distance. Population density, job-to-household ratio, proximity to the nearest central business district, and bus stop proximity all have a positive direct and total impact on transit use, although larger employment densities directly support automobile use over transit. Understanding how the BE affects commute distance, car ownership, and mode choice is a useful reference for the development of practical measures to reduce demand for automobiles.
Keywords
The transportation sector is a significant source of greenhouse gas emissions, accounting for 23% of the world’s anthropogenic greenhouse gases ( 1 ). This sector’s contribution to greenhouse gas emissions is steadily rising because of the growing demand for car ownership and usage ( 2 ). To mitigate the environmental damage of the transportation sector, urban planners recommend implementing regulations that promote compact development. The compact development hypothesis suggests that residents are more likely to drive less in urban areas with increased population densities, a mix of land uses, and well-connected streets ( 3 – 5 ).
As a result, there have been many studies looking into the possible connection between the built environment (BE) and travel behavior. In this research discourse, several studies incorporate travel distance and car ownership as exogenous variables when analyzing the effects of the BE on travel behavior ( 6 – 10 ). Nevertheless, car ownership is a medium-term decision influenced by a person’s residence choice ( 11 , 12 ). The spatial attributes of a residential area, such as the accessibility of public transportation, can limit or enable the possession of cars. Car ownership, in turn, influences immediate choices, such as how often people use their cars. Again, the BE plays a crucial role in determining the distance between individuals and their destinations, which affects their mode of transportation and frequency of travel ( 3 , 4 ). It suggests that the BE influences travel behavior through intermediary variables, such as car ownership and travel distance. Inclusion of intermediate variables—automobile ownership and travel distance—as exogenous variables will cause overcontrol bias ( 13 , 14 ) and understate the influence of the BE ( 2 , 11 , 12 , 15 , 16 ). As a result, when investigating the impact of the BE on individual mode choice behavior, it is critical to examine the mediating effects of automobile ownership and commute distance ( 11 , 12 , 16 ).
Many studies have studied the influence of the BE on mode choice behavior in the urban context of a developed country. Cities in developed countries and developing countries have different social and BE settings, and therefore research from the former may not be applicable to the latter. Urban spatial structures in developing countries are entirely distinct from those seen in developed countries with respect to primacy and mono-centricity, street layouts, population densities and trends, and the spatial distribution of the poor ( 17 ). This is notably evident in Dhaka, Bangladesh’s capital and largest metropolis, with a population density of over 45,000 people per square kilometer, making it one of the densest cities ( 10 ). Dhaka’s transportation authorities and planners have unique challenges because of the heterogeneity of modes, a discontinuous roadway system, a growing trend of private vehicles, and a poor public and non-motorized transportation system ( 10 , 18 ). Over the past five years, the private vehicle industry has experienced an average yearly growth rate ranging from 5% to 10%. Private automobiles accounted for 78% of all newly registered motor vehicles in 2019 ( 18 ). The utilization of private automobiles is expected to rise in the foreseeable future, as the nation is making progress toward graduating from the United Nations’ classification as a least developed country ( 19 ). The policy and planning papers of Dhaka have largely neglected the possible effects of BE characteristics on travel behavior, instead focusing solely on sociodemographic aspects. This study adds to the existing body of knowledge by highlighting the hitherto unexplored link between Dhaka’s BE and mode choice and by offering crucial policy implications in this context.
This study aims to shed light on the direct and indirect role that Dhaka’s BE plays in shaping commuters’ choices for sustainable forms of transportation (non-motorized and public transit). Considering the intermediary role of commuting distance and car ownership will result in an in-depth reference with respect to the complex mechanism through which the BE influences individuals’ decisions with respect to transport modes for daily commute. The study will help cities in developing countries to formulate effective transportation and urban planning policies to reduce increasing automotive demand.
Literature Review
BE and Travel Behavior
The significance of the BE in influencing mode choice has been extensively researched during the last few decades. While attempts have been made to appropriately describe and measure the various aspects of the BE, Ewing and Cervero’s ( 4 ) 5Ds (density, diversity, design, distance to transit stop, and distance to destination) is widely acknowledged in the transport literature. Street connectivity has a significant impact on commuting mode choice, as it reduces spatial separation and encourages commuters to walk to various destinations, including transit stations, therefore increasing transit ridership ( 20 – 22 ). By bringing diverse destinations closer together, land use diversity and destination accessibility enhance non-motorized and transit choice ( 4 , 23 , 24 ). As greater density is required to enable frequent mass transit service ( 22 ), it is expected that density increases transit use.
Despite the extensive literature on the BE’s impact on travel behavior, few studies have been conducted in developing nations. Analyzing mode selection behaviors in the city of Dhaka, Nakshi and Debnath ( 18 ) found that incorporating BE variables greatly enhances the predictive capability of their model. They specifically highlighted land use mix, distance to bus stops, and road density as major determinants of mode choice. Because of its narrow focus on trips to prominent destinations, this study fails to provide a comprehensive overview of the relationship between the BE and mode choice in Dhaka. Street connectivity has been recognized as an important BE variable influencing transportation mode selection in three developing cities, Bogota ( 25 ), Shiraz ( 21 ), and Dhaka ( 26 ). Increased land use diversity, density, and availability of public transportation have the potential to slightly reduce the reliance on private vehicles in the Indian metropolis ( 24 , 27 ). Nevertheless, there is limited information about the influence of the BE on the selection of transportation modes in the context of the Global South, specifically in Bangladesh. To fully understand and address the limited availability of facilities and opportunities for non-motorized and public transportation in many cities in Bangladesh, it is necessary to conduct a study on how the BE affects people’s choice of transportation.
Role of Car Ownership and Commuting Distance as Mediator Variables
Owning a car is an intermediate decision that affects a short-term decision (mode choice), and car ownership is influenced by a long-term decision (residential location) ( 28 ). For instance, a densely populated area with excellent public transportation access is linked to a lower likelihood of owning a car ( 11 , 12 , 29 ). When jobs and households are close together, the rate of car ownership drops as well ( 30 ). Another influential factor of mode choice is commuting distance: locals choose non-motorized transportation for shorter trips, whereas cars are preferred for longer ones ( 16 , 24 , 26 , 31 , 32 ). Commuting distance is reduced if a commuter chooses a home location closer to the job center ( 33 ). Furthermore, at the regional scale, a city’s spatial organization (i.e., polycentricity) dictates commuting distance ( 34 , 35 ), and land use features (such as densely populated areas with convenient access to jobs) affect commuting distance at the local level ( 33 , 36 , 37 ).
Consequently, numerous research has examined the intermediate function of commuting distance and car ownership when analyzing the relationship between the BE and mode choice ( 11 , 15 , 16 , 38–40). Based on the results of these studies, the BE’s effects are biased when we disregard the mediating influence of factors such as car ownership and commute distance. Previous research indicated that a basic discrete choice model (DCM) was insufficient in accurately representing the mediating effects. Therefore, a combination of the DCM and the structural equation model (SEM) was employed instead ( 11 , 15 , 16 , 38–40).
Data and Method
Spatial Unit of the BE Measure
The study uses Dhaka city, Bangladesh’s capital and a fast-growing megacity with a 3.96% annual growth rate of population in 2011, as an empirical study area. The study area covered the central part of the Dhaka Metropolitan Area (shown in Figure 1). A neighborhood or traffic analysis zone (TAZ) demarcated in the Revised Strategic Transport Plan-2015 (RSTP) of Dhaka city was selected as a spatial unit for measuring the BE indicators. TAZs are about 1.50 km2 in size.
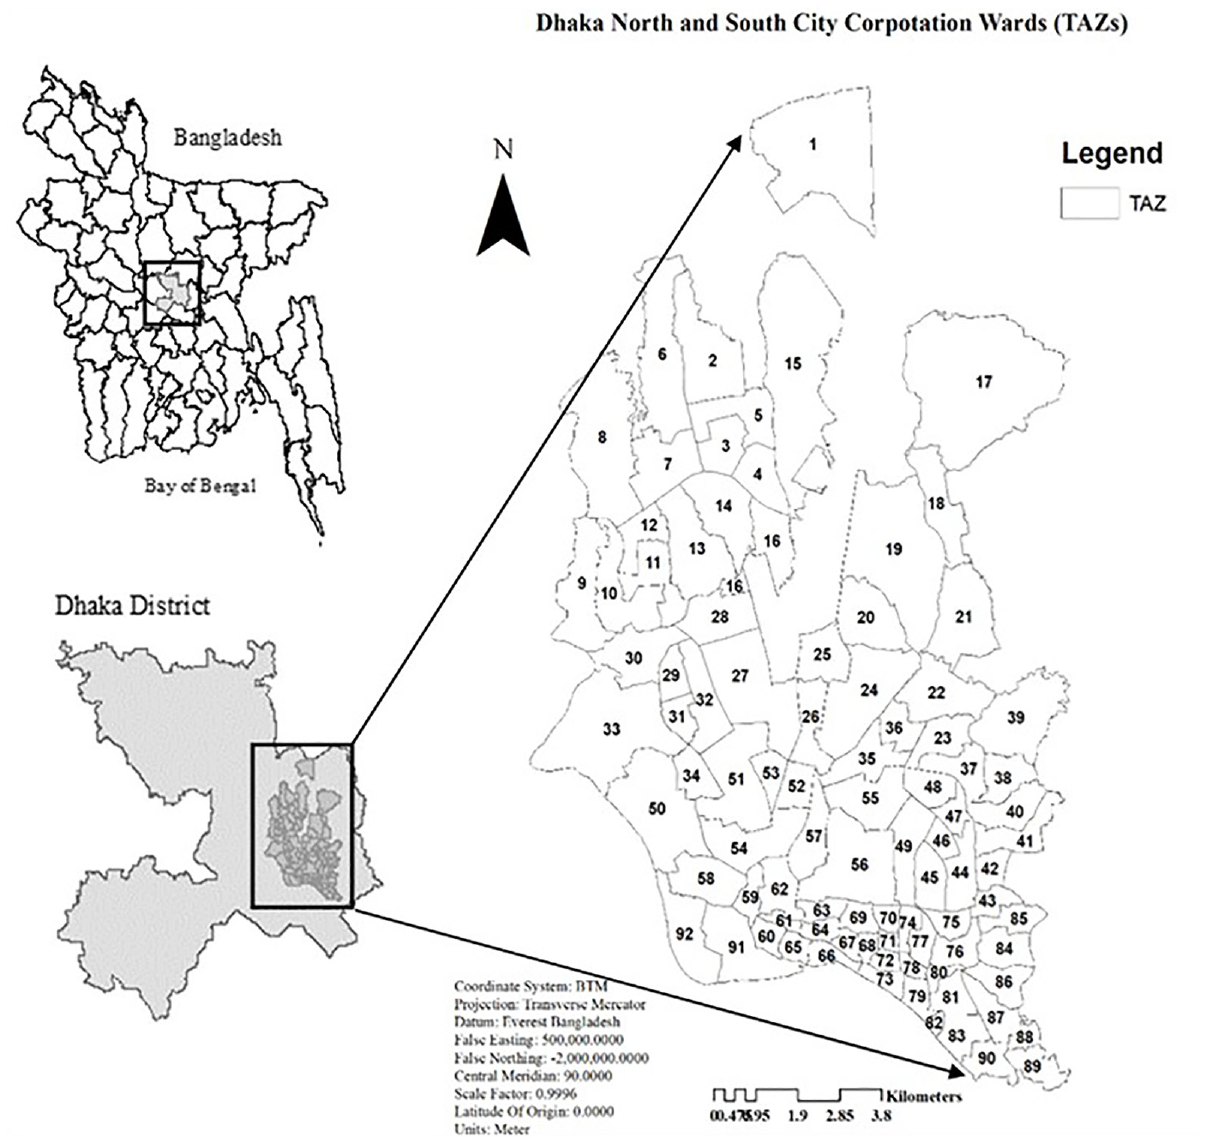
Map showing Dhaka’s geographic location with the traffic analysis zone (TAZ) boundary.
Computation of BE Indicators
We chose BE factors based on the well-established 5D guidelines established by Ewing and Cervero ( 4 ), as well as earlier research conducted in India and Bangladesh ( 2 , 10 , 18 , 24 , 26 , 27 , 41–43). Population and employment data from the Bangladesh Bureau of Statistics (BBS) were used to calculate the density indicator. The remaining 4D indicators were measured using data on land use and the road network from the Draft Structure Plan (DSP) (2016–2031) database created by the responsible government’s authority.
Density
In the literature, population density and employment density are frequently used as density indicators ( 24 , 41 ). We determined density by determining the number of residents and jobs per unit area:

where Ni is the number of residents or jobs of neighborhood i and Ai is the area of neighborhood i.
Diversity
Diversity can be represented using the entropy index ( 10 , 16 ). Using the entropy index, one may determine how diverse land use is in a region of interest. Entropy index values vary from 0 to 1, with a lower value closer to 0 indicating less variation in land use and a higher value closer to 1 indicating perfect diversity. It may be stated formally as follows:

Here, i represents land use classes. Five types of land use were analyzed in this study, residential, commercial, industrial, institutional, and recreational, according to the DSP 2016–2035 land use database;
Design
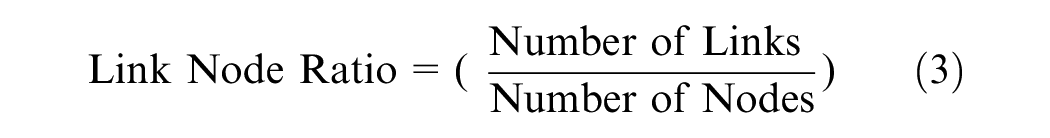
To assess roadway connectivity within a neighborhood, we calculated a link–node ratio. Road segments that connect two nodes are called links, and nodes are intersections; thus, the higher the link ratio, the more connected the road network ( 2 , 10 ). Following a network analysis of Dhaka city roadway data in ArcGIS software, the entire roadway network dataset provided node and link information from which we derived the link–node ratio value using the following equation:
Distance to Transit Stop
The shortest route (network distance) is commonly used to determine the distance to the nearest bus stops ( 16 , 18 , 24 ). We divided the TAZs into 200 m × 200 m squares instead of using the centroid as a reference point to determine the distance to the nearest bus stop (Dhaka’s first mass rapid transit started its operation in 2022). Using the network analyst dataset, we calculated the distance between the centroid of each grid cell and the nearest bus stop. The average distance for each TAZ was calculated after all of the origin-to-bus-stop distances had been gathered.
Distance to Destination
The commonly used measure of destination accessibility is the distance to the central business district (CBD); therefore, we selected the distance to the nearest CBD as a measure of destination access. Furthermore, our data shows that around 40% of work-related trips are made within commuters’ residence. Therefore, following other studies ( 44 , 45 ), we employed the job–household ratio to quantify local job accessibility. If a TAZ has a greater number of jobs than housing units, it is likely that the TAZ will have greater job accessibility.
Travel Characteristics Data
As part of Dhaka’s RSTP-2015, the Dhaka Transport Coordination Authority (DTCA) conducts a household interview survey. During the months of August and November 2014, the household interview survey was performed in collaboration with the Japan International Cooperation Agency (JICA) to gather information about the people of Dhaka, including their travel patterns and sociodemographic characteristics. Information was collected by visiting target households selected through random sampling on weekdays (Sunday to Thursday). The sample was distributed among the survey units in proportion to the population size of the 2011 census report of BBS. The trip information of the previous weekday of respondents was collected.
The household interview survey covered 16,000 households (66,246 persons) conducted in 92 TAZs. For this research, we focused on the BE's influence on the home-based work trips; therefore, we only considered work trips of respondents departing from home. After removing missing observations, the final sample comprises 10,592 trips, coming from 7906 respondents. Among the respondents, 77% were males and 23% were females. According to the World Bank, women formed only around 28% of work force in 2014 ( 46 ), which implies that the availability of female participants in the sample is caused by the very nature of job distribution. The mean sample age is 35 years old. Within the surveyed sample population, 43% were in high-income groups and 19% were in the low-income group. The median household income is 25,000 BDT per month (the equivalent of US$230). Some 38% of households have four people in a family, with an average household size of 4.31. We found most households (93%) have no car for household use, only 2% of households have bicycles, and 4% of households have motorcycles. Driving license information shows that the majority of the respondents have no driving license (91%). Modes were aggregated into three major groups, that is, non-motorized, private, and transit. We considered walking, rickshaw, and bicycle as non-motorized modes, while private car, microbus, and motorcycle were considered as motorized private vehicle, and public bus was considered as transit following the definition in the RSTP-2015. It has been observed that 9% (962) of trips were made by private mode, 58% (6172) were by non-motorized mode, and the remaining 33% (3458) were by transit mode.
Model Development
We employed an integrated modeling framework based on a SEM and a DCM considering car ownership and commuting distance as mediating variables ( 11 , 15 , 16 , 38–40). Figure 2 shows the theoretical layout of our model. An arrow denotes a relationship between variables. When all the arrows point away from a given variable, we say that it is exogenous, and when at least one points in its direction, it is endogenous. That implies a variable that is not influenced by other variables is exogenous, while that influenced by other variables is endogenous. Only sociodemographic factors are exogenous in our modeling framework, whereas the remaining variables are endogenous. The proposed conceptual model analyzes the relationship among socio-economic characteristics, the BE, car ownership, commute distance, and mode choice. The conceptual model has the following guiding specifications.
The final endogenous mode choice variable is influenced by sociodemographic characteristics, BE variables, car ownership, and commuting distance.
To generate a more reliable association between mode choice and BE characteristics, it is crucial to consider residential self-selection ( 47 ). As a result, the assumption is that inhabitants’ sociodemographic characteristics influence their choice of residential BE. However, because our study only addresses sociodemographic influence on the BE, it considers residential self-selection in a limited way.
Sociodemographic characteristics and the BE influence the final endogenous mode choice variable. This influence is assumed to be partly mediated by car ownership and commute distance. Car ownership and commute distance are jointly determined by sociodemographic characteristics and BE variables. Car ownership and commute distance then influence commute mode choice. Consequently, car ownership and commute distance act as mediating variables between the BE and travel mode choice.
The mathematical explanation of this model is thoroughly described in the literature ( 11 , 16 , 39 , 40 ). The multicollinearity between independent variables is checked through the variation inflation factor (VIF). We found that the VIF values of all the independent variables are within the threshold value of 10, which confirms the lack of a multicollinearity problem in the models. This study uses Mplus software to estimate the parameters of the SEM and DCM components simultaneously, and the robust maximum likelihood method is accommodated ( 11 , 16 ).
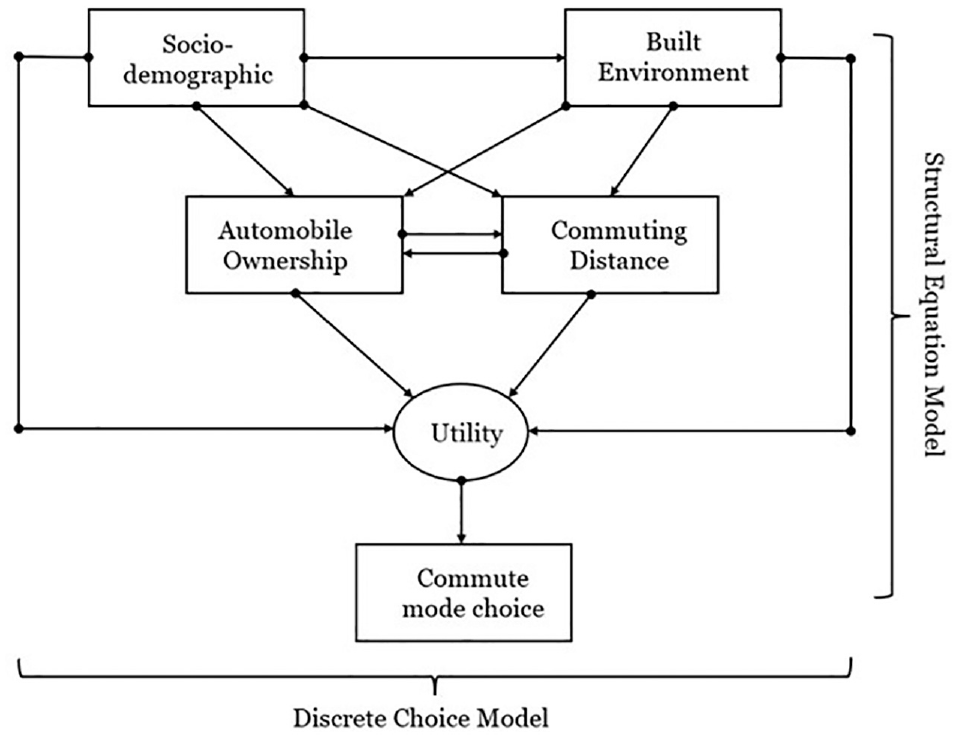
Framework of the integrated structural equation model and discrete choice model.
Model Results and Discussions
Influence of the BE and Sociodemographic Factors on Automobile Ownership
Table 1 demonstrates that the BE correlates with automobile ownership when residents’ sociodemographic attributes are controlled. Population density is positively associated with automobile ownership. The results show that an increase of one standard deviation in population density correlates with an increase of 0.12 standard deviations in automobile ownership, as found similarly by Gómez-Gélvez and Obando ( 48 ) in a conducted in a developing city context. On the other hand, employment density showed the opposite impact on car ownership. The result suggests that an increase of one standard deviation in employment density is associated with a 0.08 standard deviation decrease in automobile ownership, which is because the population living in a neighborhood with high job density make shorter trips ( 16 , 44 ), and thereby have a lower automobile ownership rate. Land use diversity showed a positive association with automobile ownership in the study context, which is quite the opposite the finding from developed countries where mixed land use is expected to reduce the automobile ownership rate ( 5 ). As expected, distance to transit stop is positively associated with the auto-ownership rate, which implies that those who live closer to bus stops have a reduced likelihood of owning a car. However, the impact of street network connectivity and distance to the CBD on automobile ownership fall short of statistical significance, although in the expected direction of impact.
Standardized Impact of the Built Environment (BE) and Sociodemographic Factors on Automobile Ownership and Commuting Distance in Dhaka
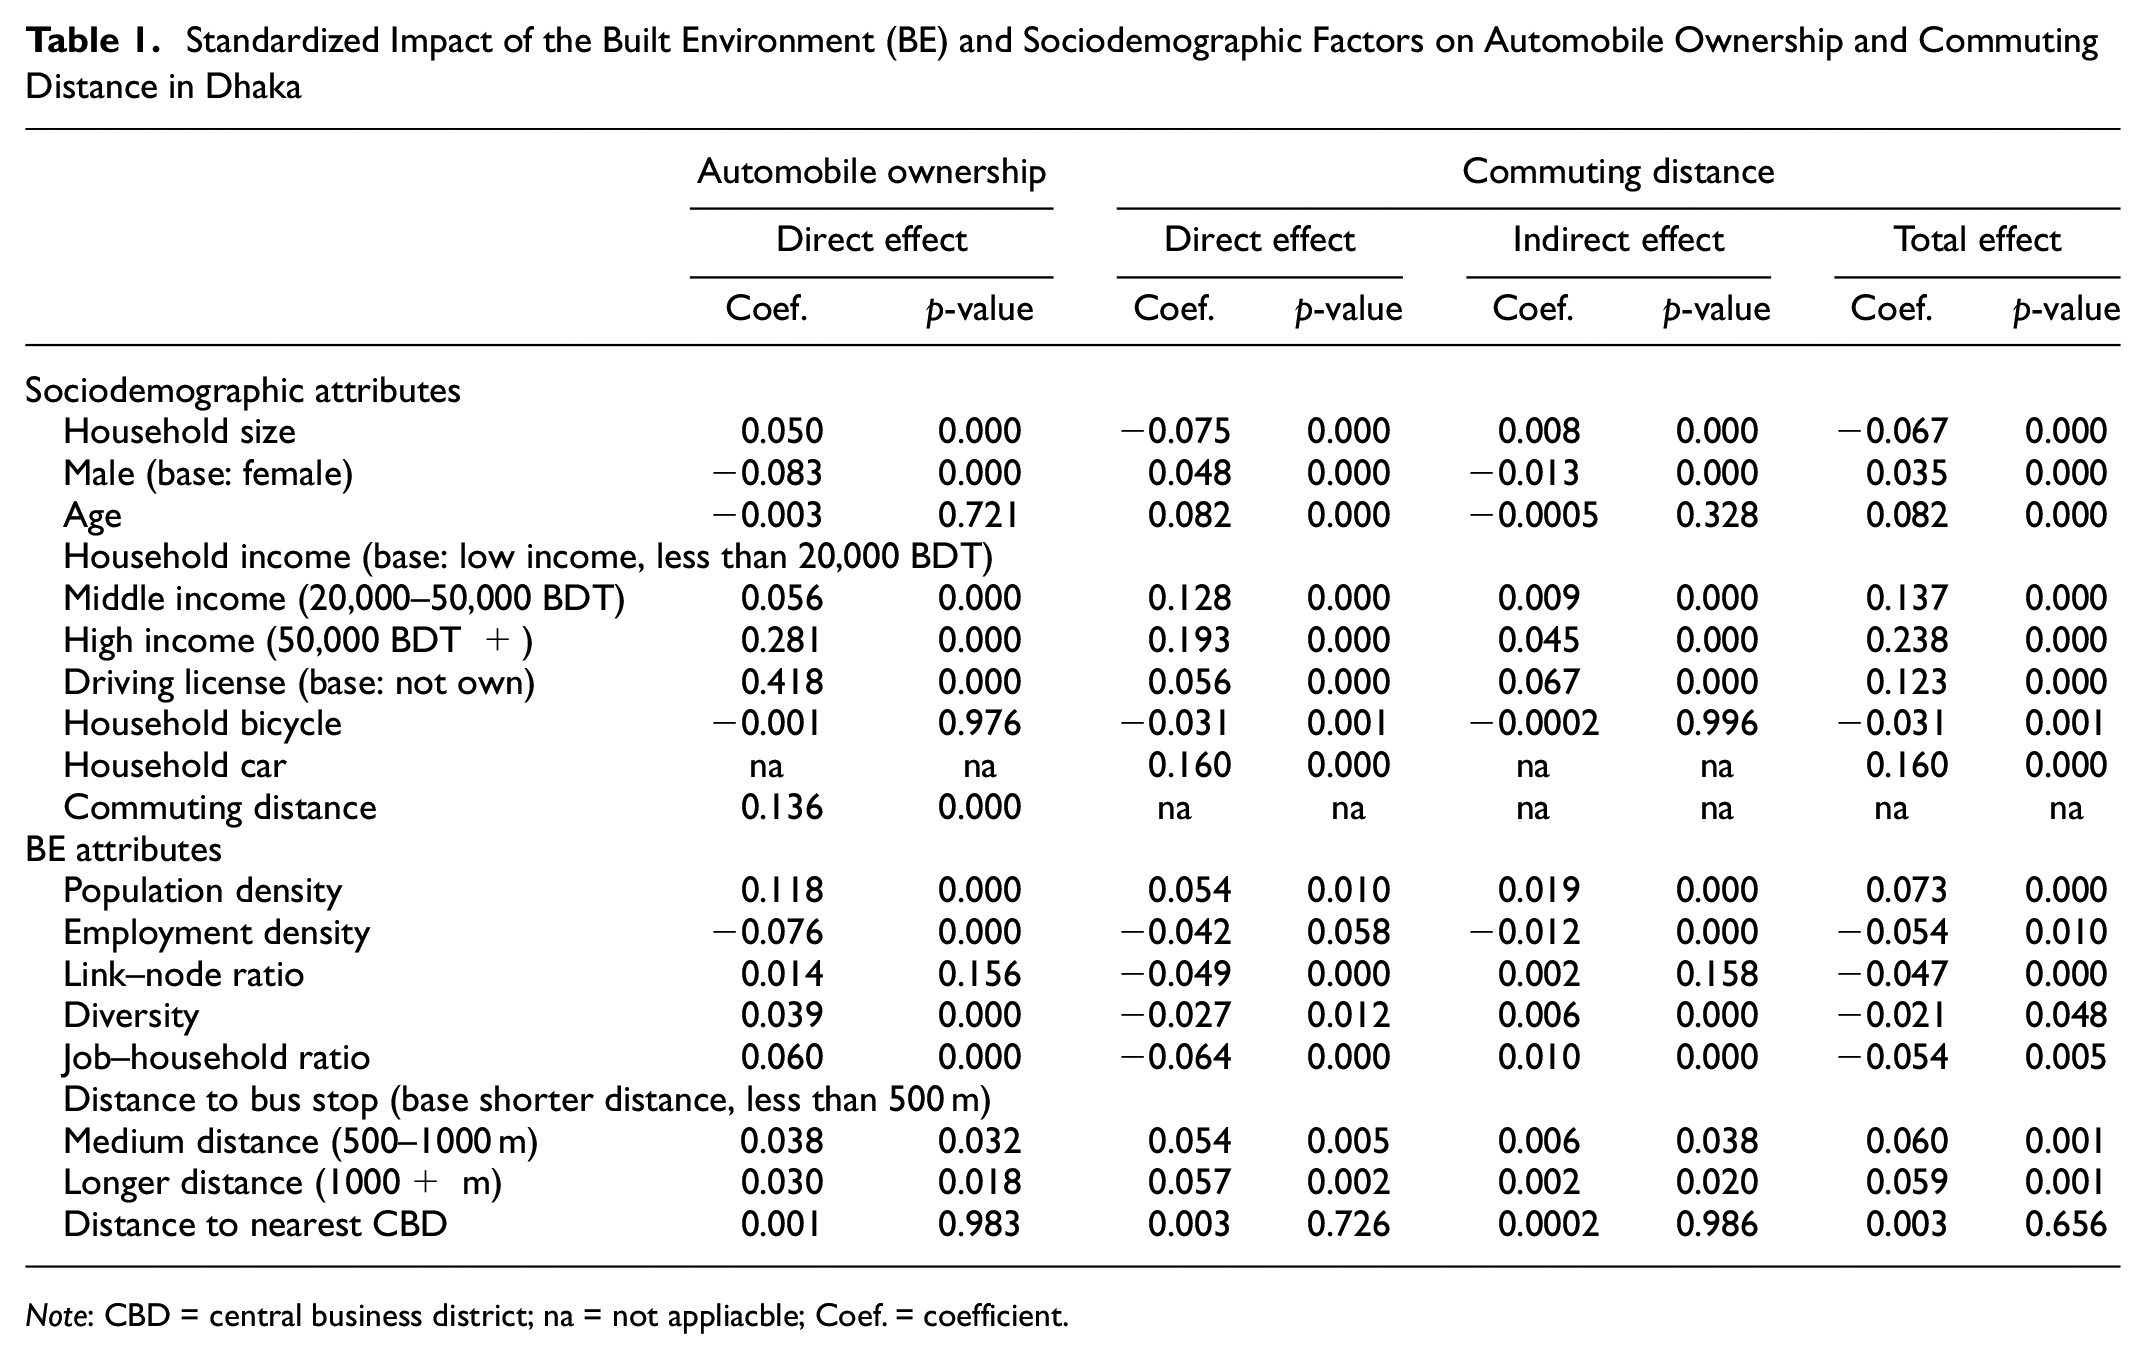
Note: CBD = central business district; na = not appliacble; Coef. = coefficient.
Propensity to own a car is significantly associated with the sociodemographic factors of the travelers. According to the research, the most crucial factors in determining automobile ownership are household income and the availability of a driver’s license. A person's age has little bearing on whether or not they own a car. The larger the family size of a household, the higher the likelihood of owning an automobile. These findings are in line with the literature ( 11 , 12 ). Females compared with males have a greater propensity to own an automobile, as females feel unsafe when traveling on public transit in Dhaka city. This scenario is common in developing cities ( 18 , 49 ), while it is quite the opposite in developed countries ( 7 , 50 ).
The above findings show deviation from what we observe typically in the literature based on developed country case studies. The general observation from the developed country context is that residents of high-density areas are more likely to use public transit, thereby reducing automobile ownership ( 5 ). In our study context, Dhaka, which is one of the most densely populated megacities in the world, has experienced rapid economic progress during the last few decades. However, it still lacks an integrated as well as a standard public transit to match the improved quality of life of residents, which is not demotivating residents to own a private car ( 51 ). When residents are convinced that the existing public transit system meets their transport needs sufficiently, they feel motivated to use public transit ( 52 ). Studies found that an adequate and improved public transit system has the potential to reduce automobile ownership ( 27 , 48 , 53 ). The Dhaka Urban Transport Network Development Study (DHUTS) 2009, a survey of DTCA, also supports this evidence. The DHUTS survey asked residents whether they are car users and whether they might shift toward transit. About 90% of car users (2909 out of 3150 respondents) are willing to shift toward transit given that the improved transit system provides reliability and comfort. Therefore, to derive high-density benefits, an integrated quality public transit system should be implemented in the city. Likewise, land use diversity showed quite opposite findings than those generally observe in the developed country context. Like Dhaka, many Chinese cities have a similar outcome as observed from studies such as Wang et al. ( 29 ).
Effect of BE and Sociodemographic Factors on Commuting Distance
Table 1 shows that all the BE indicators, except distance to the nearest CBD, have statistically significant direct effects on commuting distance. Standardized estimates of employment density, link–node ratio, diversity, and job–housing variables suggest that an increase in one standard deviation of each variable is associated with 0.042, 0.049, 0.027, and 0.064 standard deviation decreases of commuting distance on average, respectively. Higher job density reduces commuting distance by increasing the likelihood of finding a job within a TAZ. A well-connected transport network to the spatial organization of destinations reduces the spatial separation and makes it easier for commuters to make their way to destinations. Similarly, greater diversity of residential locations tends to shorten commuting distance, as this land use pattern allows a variety of destinations (jobs) to be accessible within proximity. People living near a bus stop have a shorter commuting distance. It is reasonable to hypothesize that residents living close to a bus stop would have more mobility options (transit or non-motorized mode), and if they choose these modes, their travel distance will be shorter. Moreover, it is likely that residing near to bus stops is correlated with lower commuting distances, as jobs are often situated nearby. The non-significant status of distance to the nearest CBD variable could be attributed to the city’s spatial pattern: unlike in developed countries such as the U.S.A., where major residential neighborhoods are concentrated in the city’s suburbs and are dominated by an automobile-oriented street network design, most cities in developing countries such as Dhaka are predominantly mixed, with residential neighborhoods located throughout the city. Furthermore, the city’s polycentric structure leads to cross-commuting as well as exchange-commuting ( 7 ), which may also attenuate the significance of this factor.
With respect to indirect influence, proximity to bus stops and employment density shorten commuting distances indirectly by reducing automobile ownership. Factors such as the link–node ratio, diversity, and job–household ratio exhibit opposite direct and indirect impacts on commuting distance. While these factors have significant direct influences in shortening the distance to destinations, they also have marginal positive indirect effects, thereby weakening their total impact on commuting distance.
However, a counterintuitive result arises with respect to population density: residents of high-density areas tend to make longer trips. For example, a study by Kumar et al. ( 54 ) in Delhi found that population density, ranging from 26,000 to 45,000 people per square kilometer, is positively associated with commute distance. Conversely, studies by Yang and Cao ( 55 ) in Guangzhou, China, and Zhu et al. ( 56 ) in Hong Kong argue that high density does not effectively reduce commute distance. In developing countries, the high concentration of urban activity in the city center typically results in outward high-density settlement, where the majority of disadvantaged individuals reside ( 57 , 58 ). The presence of a high-density outward settlement may explain the positive correlation between population density and commute distance ( 17 ). However, in developed countries, population density also has a threshold association with travel distance. For instance, in the Minneapolis–St. Paul Twin Cities area, a threshold of 10 persons per acre has been identified; beyond this threshold, the effect of residential density is offset by congestion effects ( 59 ).
Considering sociodemographic factors, according to Table 1, elderly residents prefer to commute longer distances. The argument for their direct association is that elderly residents may need to balance the distance to their workplace with the distance to their children’s school, leading to a lengthier commute distance. The overall positive total impact of gender on commuting distance suggests that, on average, males tend to commute longer distances. High-income individuals also show a considerable tendency to commute longer distances. Those who possess a driver’s license and a car are more likely to travel further distances. Moreover, for these factors, the sign of both the direct and indirect effects is the same, indicating that the indirect influences of these factors augment the total effects. Both household size and household bicycles exhibit negative direct and indirect influences on commuting distance.
Effect of BE and Sociodemographic Factors on Commuting Mode Choice Behavior
Results
The results of the influence of the BE and sociodemographic characteristics on commuting in Dhaka are summarized in Table 2. Population density emerges as a significant factor, demonstrating a direct positive association with the likelihood of selecting a non-motorized mode and public transit over driving a car; however, its positive association with commuting distance and automobile ownership leads to a negative indirect impact on non-motorized and transit mode choice. Therefore, the positive total impact is mainly the outcome of its direct impact. Conversely, employment density exhibits a negative direct correlation with non-motorized and public transport choice, while the former association has no statistical significance (Table 2). Interestingly, the positive indirect influence of employment density on non-motorized and transit reduces the magnitude of the respective total effect of employment density in a pronounced way; even in non-motorized mode, the total effect turns into positive. The path analysis illustrated in Figure 3 provides a visual representation of how density indicators directly and indirectly shape commuting mode choice.
Standardized Influence of the Built Environment (BE) and Sociodemographic Factors on Commuting Mode Choice Behavior in Dhaka
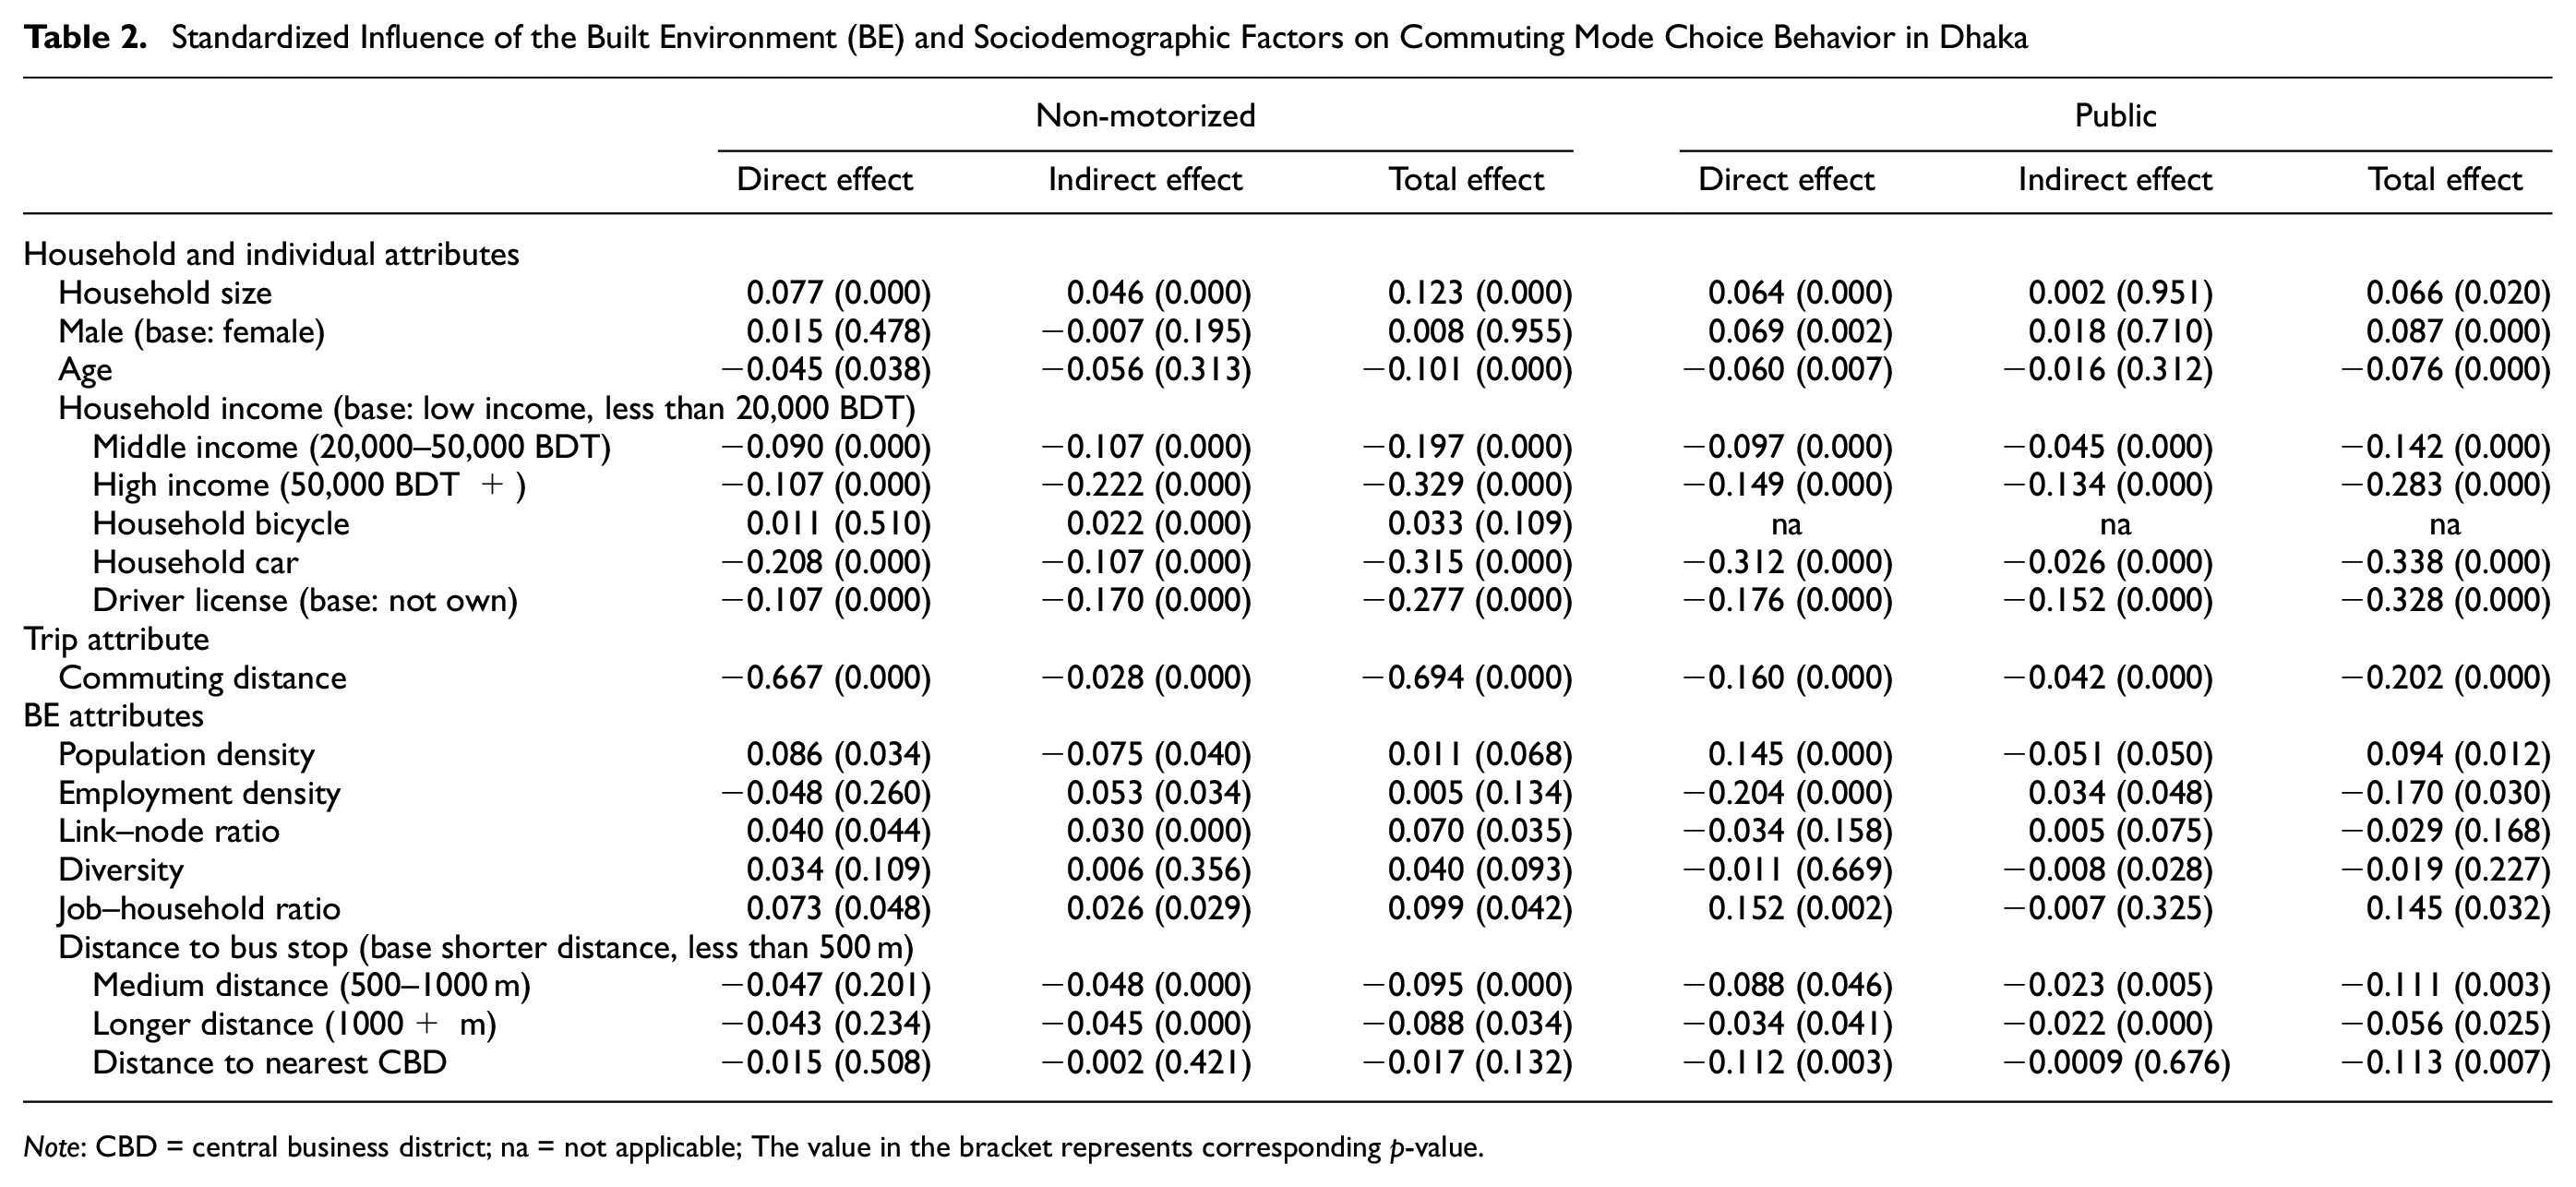
Note: CBD = central business district; na = not applicable; The value in the bracket represents corresponding p-value.
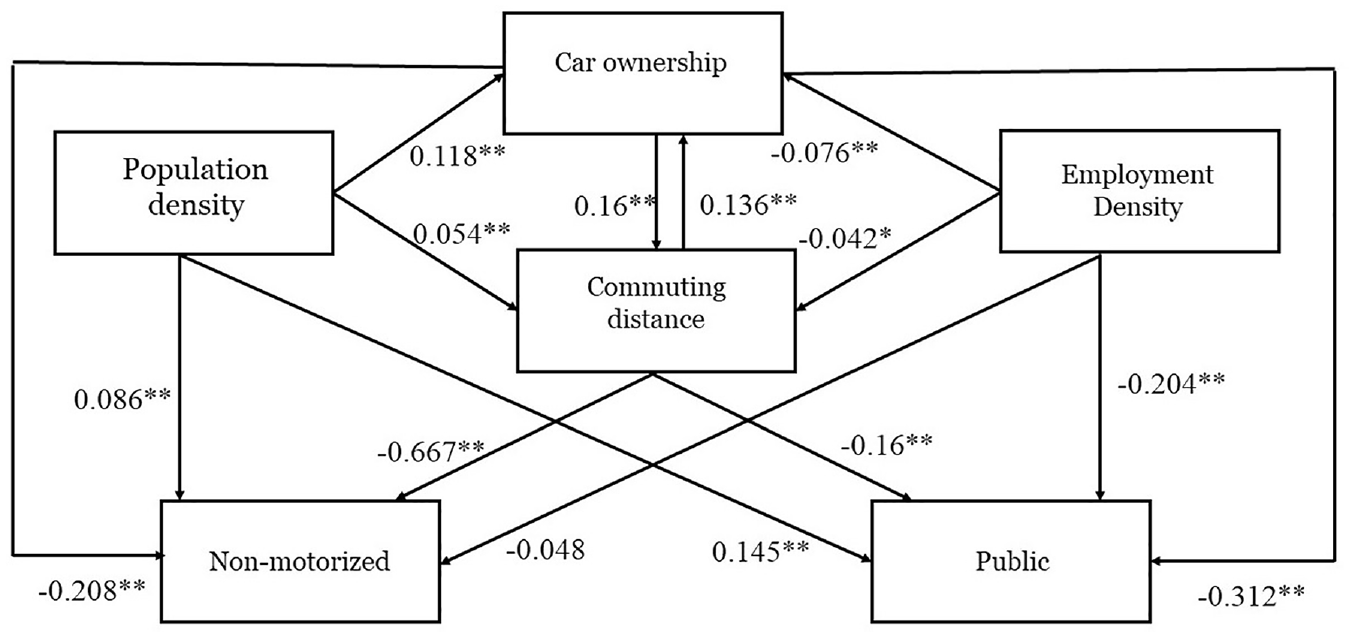
Path diagram showing the impacts of population density and employment density on mode choice.
An increasing job–housing ratio directly associates with increased use of non-motorized and public transportation (Table 2). The positive influence of the job–housing ratio on non-motorized mode choice, both directly and indirectly, strengthens the overall effect. The specific indirect effect of the job–housing ratio on non-motorized mode choice through commuting distance (−0.064×−0.667 + −0.064×0.136×−0.208 = 0.044) is larger than the specific indirect effect through automobile ownership (0.060×−0.208 + 0.060×0.16×−0.667 = −0.018), which leads to a positive significant total indirect effect. This suggests that the job–housing ratio influences non-motorized mode choice directly, and the interplay between the job–housing ratio and commuting distance also influences non-motorized transport. In contrast, the substantial positive total effect of the job–housing ratio on public transit results from the positive direct influence and the negative, yet statistically insignificant, indirect influence. This implies that although the job–housing ratio cannot influence public transit through the interplay, it has the direct associative power to influence public transit mode choice. The direct and indirect impacts of the job–household ratio and distance to the nearest CBD are illustrated in Figure 4. According to Figure 4, because commuting distance and car ownership are not significantly influenced by distance to the nearest CBD, this factor has no statistically significant indirect effect on commute mode choice. However, this variable directly influences public transit mode choice, indicating that proximity to the CBD increases the likelihood of using public transport.
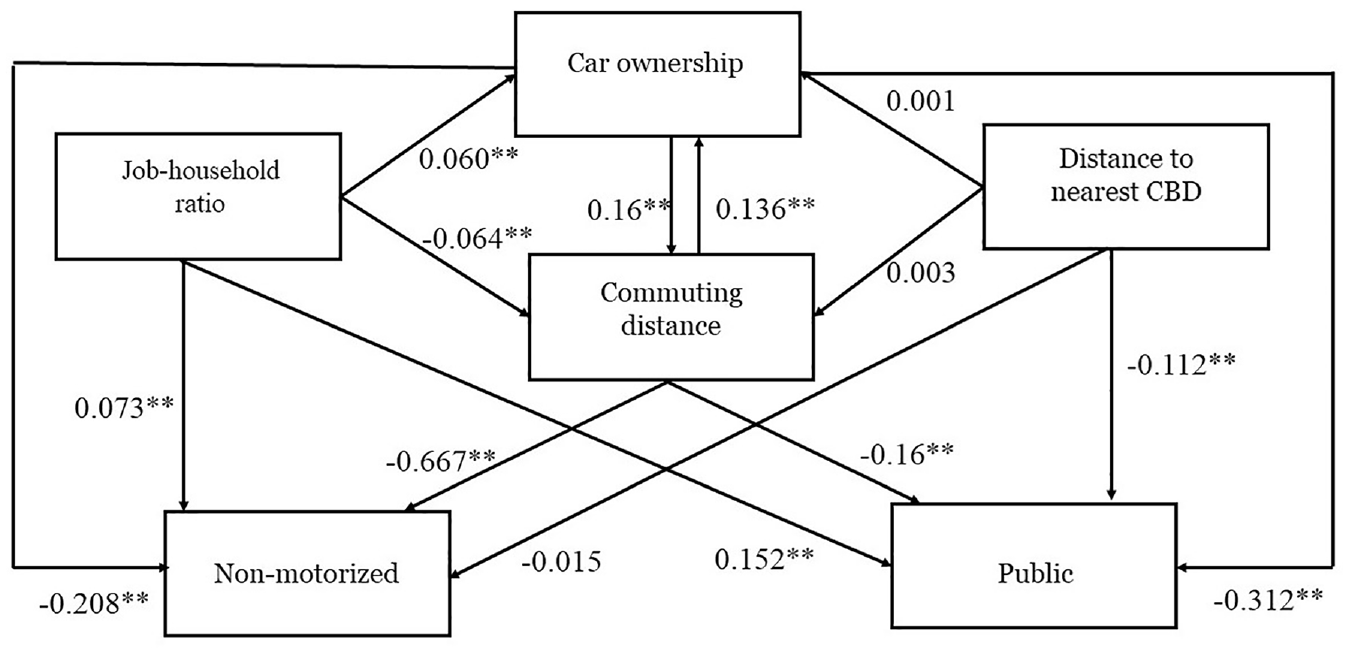
Path diagram showing the impacts of the job–household ratio and distance to the nearest central business district (CBD) on mode choice.
Street connectivity has a substantial direct and indirect correlation with non-motorized use, which strengthens the total effect. Since connectivity does not have a significant association with automobile ownership, its indirect effect primarily results from its impact on commuting distance. However, the probability of choosing public transit has no statistically significant direct association with connectivity, but it rises in an indirect way as connectivity has the potential to shorten commuting distance. This suggests that residents in areas with a well-connected road network are indirectly encouraged to use public transit. The path analysis depicted in Figure 5 illustrates how connectivity and diversity influence commuting mode choice both directly and indirectly.
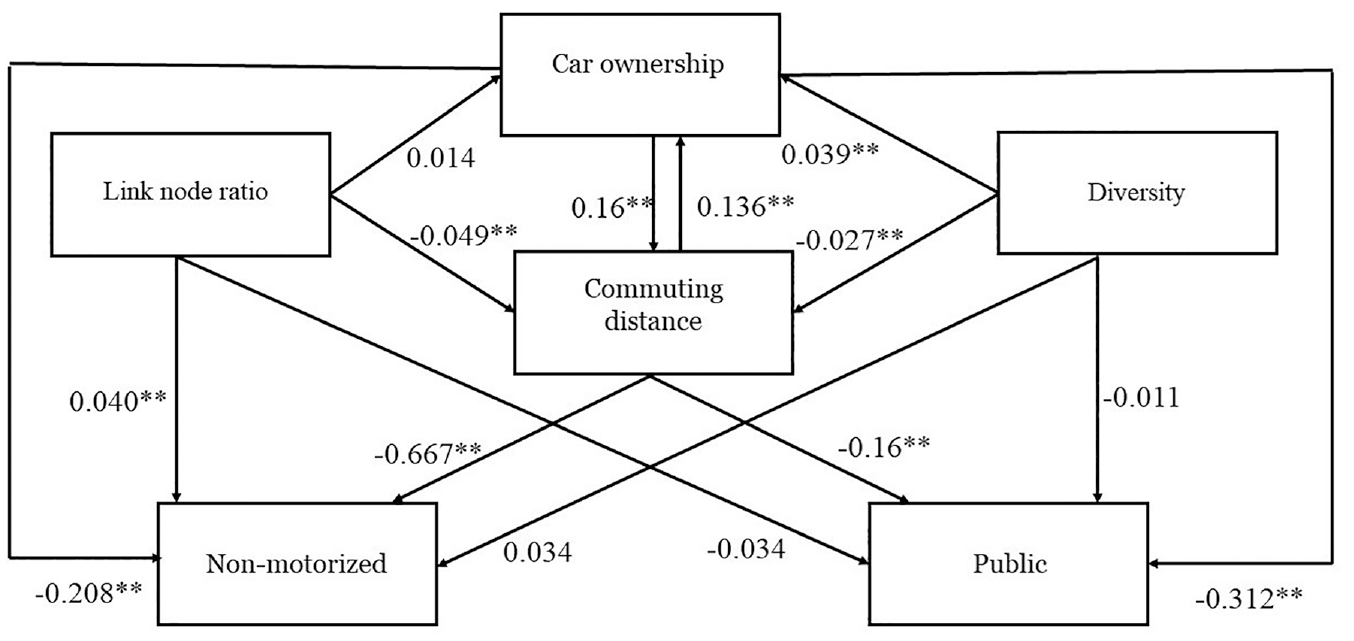
Path diagram showing the impacts of connectivity and diversity on mode choice.
Land use diversity shows no direct significant association with non-motorized mode choice. With respect to its indirect influence, although diversity promotes non-motorized transport by shortening commuting distance, its positive association with automobile ownership results in an insignificant total indirect effect on non-motorized mode choice. However, considering both direct and indirect effects, the total effect of diversity becomes significant at the 90% confidence level. With respect to public transit, there is no significant association between diversity and transit. Although diversity has the potential to shorten commuting distance, the interplay among diversity, automobile ownership, and transit use leads to a significant negative total indirect influence on transit, thereby strengthening the total negative effect. This suggests that, in the study context, although transit use is not influenced by diversity, there is an indirect encouragement of diversity to car use.
Distance to bus stop has no direct influence on non-motorized mode choice, while it has a remarkable indirect effect as it associates with automobile ownership and commuting distance. This implies that the distance factor indirectly facilitates non-motorized use by reducing automobile ownership and commuting distance, thereby resulting in a statistically significant total effect. So, considering the total effect, non-motorized mode choice is influenced by distance to bus stop not through its direct associative power but rather through its association with reduce automobile ownership and commuting distance. With respect to public transit, distance to bus stops has a negative direct and indirect association with public transit use, strengthening its total effect. The direct and indirect impacts of distance to bus stop are illustrated in Figure 6.
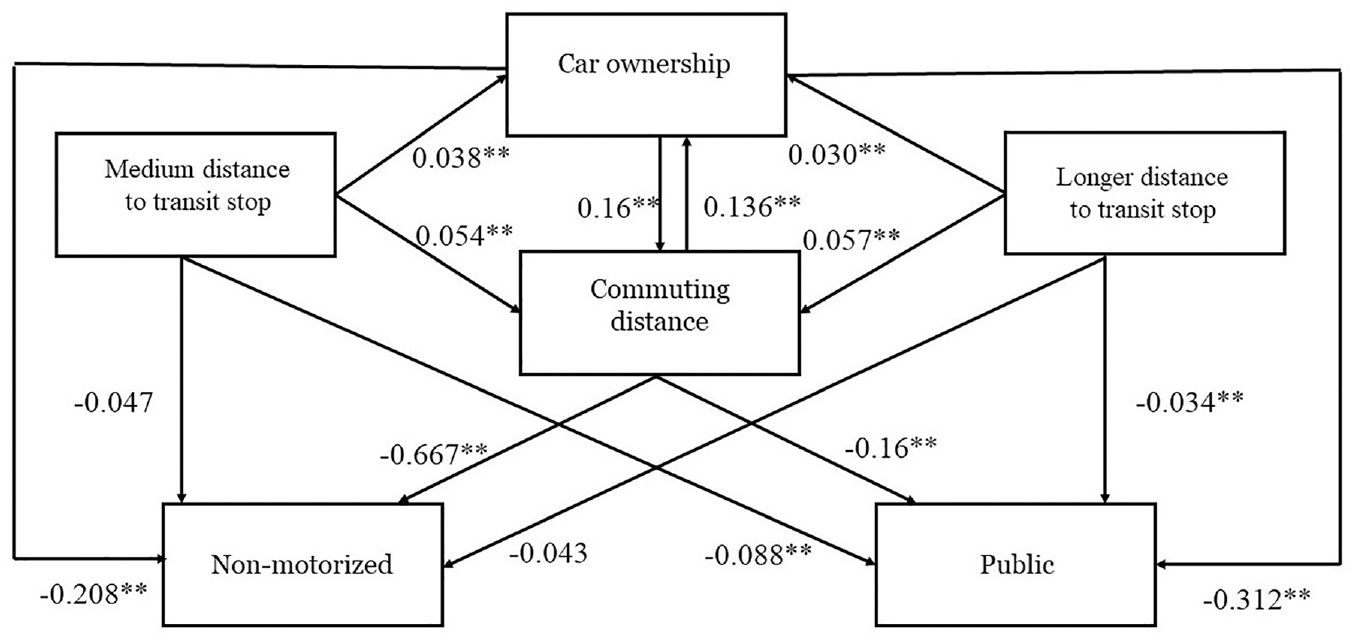
Path diagram showing the impacts of distance to bus stop on mode choice.
With respect to sociodemographic factors, from Table 2 the likelihood of choosing transit and non-motorized modes over the car is significantly associated with household size. Although residents with larger household sizes are more likely to own a car, considering an indirect effect, they get an indirect encouragement to use non-motorized mode through their inclination to travel a shorter distance. Aged people are more unlikely to use non-motorized and transit modes, and also discourage non-motorized and transit modes indirectly, thereby reinforcing the total influence. Because of their direct and indirect influences on car use, their income, automobile ownership, and driving license all contribute to a greater total effect on car use. These findings are consistent with previous research ( 16 , 60 ). There is no significant association between non-motorized mode choice and gender. In comparison, female populations are more unlikely to use transit. This may be the result of the insecurity mentioned above involved in traveling in transit. Another possible explanation is women’s inclination for complex travel chains involving work and other non-work trips, which are difficult to complete utilizing public transportation ( 18 ).
Lastly, after controlling for commuting distance, the BE, and sociodemographic factors, we found that the non-motorized mode use is primarily determined by commute distance, while transit ridership is primarily determined by car ownership (Table 2).
Discussion
The previous literature suggests that higher population density has the potential to concentrate trip origins, thereby attracting non-motorized and public transport modes ( 24 ). However, our results related to the indirect effects of population density contradict the direction found by Ding et al. ( 16 ): they find that choosing non-motorized and public transit is the indirect result of density. This observation underpins Cervero’s ( 17 ) suggestion with respect to the distinctiveness between developed and developing cities with respect to their urban form, spatial structure, land use, and transport features.
Conversely, the findings with respect to higher employment density with lower transit use are supported by the study of Sun et al. ( 60 ), which was also conducted in a high-density megacity like Dhaka. Nevertheless, the co-location of housing and jobs (higher job–housing ratio) significantly favors the non-motorized mode and public transit, suggesting that closer proximity between jobs and housing, rather than increased employment density, is more effective in minimizing automobile use. Tran et al. ( 61 ) also demonstrate that commuters prefer the co-location of housing and jobs.
With respect to the CBD, individuals residing in proximity to it are more inclined to utilize public transportation for their commutes. This may be because the CBD area is relatively well-served by public transportation, thereby encouraging its use. Results with respect to the link–node ratio highlight that high connectivity exerts strong direct and indirect effects on encouraging the use of non-motorized modes. In general, connectivity minimizes spatial separation, which benefits non-motorized modes more than motorized modes because the former is more sensitive to distance changes than the latter ( 6 ). The likelihood of individuals using public or non-motorized transportation is not related to the variety of land uses in Dhaka. Diverse land use can enhance access to amenities, leading to higher land prices and rents. The high-income group, who own multiple cars, can afford certain places. For instance, Dhanmondi and Gulshan are two neighborhoods with diverse land uses that only wealthier individuals can afford to reside in. Finally, the finding that a shorter distance to bus stops increases public transport use is expected, as shorter distances to bus stops make public transport more accessible. In addition, it encourages non-motorized transport use by shortening commute distances and reducing automobile ownership.
Conclusion and Policy Implications
The study examines how indicators of BE affect commute behavior in a developing South Asian country as its geographical case. A very common challenge experienced in cities in developing countries is inadequate urban and transportation planning, aggravated by substantial limitations in data availability, including BE attributes and travel behavior data, which are either collected irregularly or not reported by the authorities ( 62 ). The current study makes use of the most recent travel survey data from Dhaka to understand the complex mechanism involved in commuters’ mode choice decision. The identified interplay of the BE, car ownership, commute distance, and mode choice would help policymakers and planners to understand the local context of Dhaka in a nuanced way and, in turn, reflect this knowledge in their planning and policy formation. These results will be useful and generalizable for other developing country cities such as Dhaka, which might be characterized by extremely high population density, poor public transportation services, organic development of land, and lower private car ownership and usage, as well as a significant population of low-income individuals.
The paper applies an integrated SEM and DCM to evaluate the impact of the BE on mode choice and considers both direct and indirect effects. The modeling results show that car ownership and commuting distance act as intermediaries between the BE and commute mode choice, which lead to indirect impacts of the BE on mode choice. This finding aligns with recent research, which suggests that incorporating car ownership and commuting distance as mediating variables, rather than treating them as exogenous variables, enhances the analytical framework for understanding the relationship between commute travel behavior and the BE ( 11 , 16 ).
After incorporating commuting distance, the BE, and sociodemographic factors, our findings show that the non-motorized mode use is primarily determined by commute distance, while transit ridership is primarily influenced by car ownership. This suggests that a key goal for planners interested in encouraging non-motorized transport should be accessibility-based planning, with an emphasis on minimizing the physical distance between homes and opportunities. In Dhaka, individuals who own automobiles tend to rely on them almost exclusively. As the number of people with access to personal vehicles remains low in developing nations, it is imperative that the government take steps to improve the quality of their substandard public transport systems, encouraging citizens to use them not just out of necessity but out of personal choice. Government, private, and aid organizations working in developing nations need to realize that they must act immediately to improve public transport and plan cities around it if they want to rid these places of a car-dependent Western culture.
In addition to that, increasing density in Dhaka is not as successful as in some Western countries for attaining a low-carbon transport system because of its exceptionally high population density. This extreme population density results in longer commuting distances and higher car ownership rates. Furthermore, high employment density tends to favor car usage over transit. This finding is consistent with research conducted in India ( 63 ) and suggests that increasing population density beyond a certain threshold is linked to negative externalities that do not lead to preferable outcomes for the transportation system.
Population density, connectivity, and the job–household ratio all have a favorable relationship with non-motorized mode choice. The indirect effect of connectivity and the job–household ratio increases their overall ability to influence non-motorized choice. Living close to bus stops does not directly affect non-motorized transportation, but it does influence commute distance and car ownership, which in turn affects the choice of the non-motorized mode. On the other hand, population density, the job–household ratio, distance to the nearest CBD, and distance to a bus stop are found to have a positive direct impact on transit use. In summary, according to the findings, improving connectivity, the job–household ratio, and accessibility to transit stops have potential to increase non-motorized and transit use in the context of Dhaka. In addition, improving regional destination accessibility, as expressed by accessibility to the CBD, has the potential to increase transit use.
This research has significant implications for both present and future policy. Two distinct government agencies are responsible for formulating the city’s transport plan and land use plan. The current transport plan simply takes into account traffic flow and transport demand, predicts new transport infrastructures, and pays no attention to the land use–transport interaction. Our research lends credence to the idea of land use–transport interaction in the context of developing cities, and we recommend that policymakers and planners take it into account when formulating and implementing transport strategies.
Government authorities are developing several satellite towns around Dhaka to relieve some of the population strain on the capital city’s infrastructure. Our research suggests that for residents to have shorter commutes and use sustainable modes of transportation (non-motorized and public transport), these new towns should be designed with an enhanced and well-accessible public transportation system, a well-connected street network, and the co-location of housing and employment. Introduction of the recent metro rail service (MRT Line 6) in Dhaka could potentially have significant implications for various aspects of urban travel behavior. For instance, it might lead to a decrease in car ownership and car use as residents may find the metro a more convenient and cost-effective alternative for their daily commute. In addition, the findings suggest that transit-oriented development (TOD) around the newly built metro system has the potential to enhance connectivity, facilitate the co-location of jobs and housing, improve accessibility to a better transit system, and make regional destinations more accessible by public transport. These, in turn, lead to more sustainable commuting behavior.
There are some limitations to this study. Car ownership and commute distance have low explanatory power in the model, suggesting that these dependent variables fluctuate less dramatically with sociodemographic factors and residential location. In addition, residents’ attitudes and preferences, which help shape residential self-selection, have not been considered. Moreover, perceptions of neighborhood social and physical conditions, such as crime and safety concerns, which are common in the Global South ( 62 ), were not explored in the study and should be addressed in future studies. Furthermore, although this cross-sectional study provides valuable information on the association between the BE and travel behavior, it does not imply causality. This study merely opens the door, and more research is required in the future to establish causal links. This could involve considering the micro-scale BE, incorporating longitudinal (panel) data, exploring the impact of residential relocation on travel behavior, and examining the complex links among the BE, travel attitude, and travel behavior. These are some of the future directions of research.
Footnotes
Author Contributions
The authors confirm contribution to the paper as follows: study conception and design: F.R. Ashik, M.H. Rahman, N.M. Zafri; data collection: F.R. Ashik, M.H. Rahman; analysis and interpretation of results: F.R. Ashik, M.H. Rahman, N.M. Zafri, S.M. Labib; draft manuscript preparation: F.R. Ashik, M.H. Rahman, N.M. Zafri, A. Antipova, S.M. Labib. All authors reviewed the results and approved the final version of the manuscript.
Declaration of Conflicting Interests
The author(s) declared no potential conflicts of interest with respect to the research, authorship, and/or publication of this article.
Funding
The author(s) received no financial support for the research, authorship, and/or publication of this article.