
Abstract
Bleeding can have a negative effect on the performance of a pavement, as the layer of asphalt on the surface can become slippery, reduce skid resistance, and lead to premature wear and tear. Therefore, predicting the bleeding area in asphalt pavements will help in maintaining better pavements, increasing the safety of the drivers, and delivering timely maintenance. The aim of the study is to develop a model using a highly sophisticated analysis tool called an artificial neural network (ANN) to predict the bleeding areas in asphalt pavements as output, with one hidden layer and several neurons and using several independent variables as inputs, such as lane annual average daily truck traffic, lane annual truck volume estimate, pavement thickness, average asphalt content, average annual temperature, annual total snowfall, and total annual precipitation. The Long-Term Pavement Performance database will be employed in this study to extract data for the states of Texas, Arizona, and New Mexico. The ideal architecture for forecasting the bleeding of asphalt pavements was concluded to be an ANN model with several neurons in one hidden layer and with 160 data sets, with R2 = 0.71. A standalone ANN equation was also extracted. Additionally, a sensitivity analysis was conducted to determine the sensitivity of the model to a particular change in an input parameter.
Keywords
The process of bleeding involves the development of an asphalt binder film on the pavement’s surface, which results in a bright, glass-like surface that typically becomes sticky. The pavement surface changes from being dark and black to becoming glossy, shiny, and glass-like. A bleeding pavement generates a smacking noise, similar to that observed when driving through rain. In hot climates, the aggregate gaps are filled with asphalt binder, which eventually spreads over the pavement surface. Asphalt binder develops on the surface of pavement over time, since bleeding is a phenomenon that cannot be reversed. Because bleeding decreases a vehicle’s ability to resist skidding, especially on slippery roads, it can be deadly. It is typically seen in wheel pathways where aggregates are subsequently embedded as a result of the recurrent load cycle of tires ( 1 ). In previous studies on asphalt concrete, bleeding has been discussed as mostly caused by inadequate construction techniques. The riding surface of the pavement loses its skid resistance when asphalt builds up on the surface during bleeding, since it is a permanent phenomenon ( 2 ). Bleeding is a maintenance issue that needs to be fixed promptly, either by corrective maintenance or, in uncommon circumstances, by emergency repair. The most popular treatments for bleeding include repairing the pavement with seal coat and bridging over the asphalt with aggregates of different types and gradations.
Wide-ranging studies have been conducted in recent years to create an independent method for analyzing skid resistance and recognizing different pavement flaws, such as cracks, ruts, raveling, and potholes. There is, however, no research that aims to automate the inspection of asphalt pavement bleeding in comparison with other pavement problems, such as cracking, rutting, or potholes. Owing to the capacity for learning and adapting, artificial neural networks (ANNs) have recently been employed in many areas of civil engineering to model the characteristics and behavior of materials, as well as to discover complicated relationships between various characteristics. Moreover, the use of ANNs to predict the permanent deformation of asphalt concrete mixtures modified by nano-additives has been investigated ( 3 ).
Objective
The goal of this study is to develop a robust prediction model using an ANN for precise estimation of bleeding in asphalt pavements. To enable a reliable and complete approach to prediction, the model has been developed to represent a wide range of input factors, including environmental data, traffic data, pavement structure characteristics, and asphalt design. To facilitate the independent use of the model context, the research was also focused on extracting a standalone equation from the ANN model. Engineers and decision-makers could use this equation as a useful tool to anticipate bleeding in asphalt pavements conveniently, without utilizing the complete computing infrastructure of the ANN. Additionally, the sensitivity of the ANN model was analyzed to evaluate the relative effect of the input variables on the predicted bleeding result. By providing an effective and efficient predictive model for bleeding assessment, these goals help to develop pavement engineering practices. Equation extraction, sensitivity analysis, and ANN modeling work together to provide a thorough and reliable approach that results in more effective pavement management and maintenance methods.
Literature Review
The majority of nations have created pavement management systems (PMSs) to keep track of the states of pavements and plan improvements to road serviceability and safety. An effective PMS results in work planning for pavement repair using the appropriate maintenance method at the ideal time, with the lowest possible cost ( 4 ). Asphalt pavements are subject to deterioration in the form of bleeding. This type of pavement distress is typically brought on by heavy traffic during hot weather and results in the formation of a thin layer of binder on the pavement surface ( 5 ). Bleeding is generally caused by problems with the quality of the asphalt binder, incorrect (too high or too low) binder application rates, and poor building techniques. A mixture with too much asphalt binder can cause the pavement to be excessively compacted, and the extra asphalt binder will eventually show up on the pavement’s surface as bleeding ( 6 ). Traffic volume, traffic type (heavy trucks), and traffic motions are all factors that relate to bleeding. In particular at crossroads, starting, stopping, and slowly moving traffic sometimes make bleeding problems worse. Because such traffic has the ability to embed, push, and displace the cover stone, bleeding is made worse when heavy truck traffic and overweight cargoes are present ( 7 ).
Environmental elements, such as humidity and temperature, have a significant effect on bleeding. High temperatures, humidity, fluctuating temperatures, and low temperatures are the main environmental conditions linked to bleeding pavements. When a contractor installs pavement during extended periods of exceptionally hot weather and opens the road before it is ready for traffic, bleeding may result. The asphalt–aggregate bond does not have a chance to fully develop in such circumstances. When there is no wind, the pavement is not cooled, which causes humidity and temperature to have a higher effect on bleeding. This is because the humidity in these circumstances slows down pavement cooling, which enhances bleeding at a particular temperature ( 8 ). The properties of the pavement surface, such as the microtexture and macrotexture, which are crucial components in the resistance of the pavement to skidding, are directly affected by bleeding. The ability of the surface to resist skidding has a considerable effect on both road safety and vehicle agility ( 9 ). In the past, pavement inspection was conducted visually, which is a traditional approach. However, this method has several drawbacks, such as high labor costs, time-consuming processes, unreliable results, and unsafe working conditions for staff. As a result, most transportation agencies are opting to embrace new technologies to conduct pavement inspection more efficiently. These new technologies can help to improve the quality of the inspection while reducing labor costs and providing safer working conditions for staff. By using these technologies, agencies can potentially save time, reduce expenses, and enhance their overall efficiency in the inspection process ( 10 ).
A previous study aimed to develop pavement distress prediction models for flexible pavements located in non-freeze climatic zones using the Long-Term Pavement Performance (LTPP) database. The study was focused on developing models for bleeding distress, fatigue cracking, longitudinal cracking, transverse cracking, raveling distress, and rutting distress. The statistical analysis was conducted using Statistical Package for the Social Sciences (SPSS) software. The bleeding distress model for dry-non-freeze climatic zones was developed using the data obtained from the LTPP database and has R2 = 0.82. The model includes pavement age since overlay (PA) and air voids of asphalt mix (V) as independent variables ( 11 ).
Machine learning is a subfield of artificial intelligence that focuses on developing algorithms that can learn from data and make predictions or decisions based on that learning. The idea of machine learning dates back to the 1950s, when researchers first began exploring the possibility of creating machines that could learn from data. In the following decades, machine learning research continued to advance, with the development of new algorithms and techniques, such as decision trees, neural networks, and support vector machines. Today, machine learning is used in a wide range of applications, from image and speech recognition to natural language processing and predictive analytics. With increasing computational power and advances in machine learning algorithms, edge computing is becoming an area of application where machine learning can improve current technology ( 12 ).
However, progress in the field was slow until the 1990s, when advances in computing power and the availability of large datasets led to a resurgence of interest in machine learning. There are different types of machine learning algorithm. The ANN is a type of supervised learning, in which an algorithm is trained on labeled data, where the correct output is known for each input. The goal is to learn mapping from inputs to outputs that can be used to make predictions on new, unseen, data ( 13 ).
A study was conducted with the aim of creating a model that can predict pavement performance based on its roughness, specifically the International Roughness Index. To achieve this, the study used a well-known technique in the field of computer science called the ANN algorithm, which is a form of soft computing. The model was developed using the LTPP database, which was chosen for comprehensiveness, with respect to the length of time of data collection and the variety of variables included. After developing the ANN model, the results were compared with those obtained using a polynomial nonlinear regression model to determine the effectiveness of the ANN approach. Overall, the research is aimed to provide insights into predicting pavement performance and contribute to the development of better pavement maintenance and management strategies ( 14 ).
It can be concluded from previous studies that few studies are conducted in the field of predicting bleeding in asphalt pavements. Most of the previous methods used a visual method or used convolutional neural networks to analyze a visual image. In this study, an ANN will be utilized to predict the bleeding area in the asphalt pavements using data extracted from the LTPP database. Following the literature review, inputs were chosen to cover the environmental data, traffic data, the structure of the pavement, and the asphalt content.
Data Collection, Selection, and Processing
In this study, the LTPP database was utilized to extract the data. Following the literature review, seven inputs that mostly affect bleeding were used in the study. Traffic factors, such as lane annual average daily traffic, and environmental factors, such as temperature and precipitation, were considered, as well as other factors, such as thickness and asphalt content. A total of 160 observations were extracted from 320 different sections. To build the model, there were seven inputs, one hidden layer with seven neurons, and one output, which is the bleeding area in asphalt pavements. After filtering the data, 61 pavement sections were utilized in the study for the states of Texas, New Mexico, and Arizona, covering all the sections for which there is data for the bleeding area in the asphalt pavements. The sections were divided as follows: 43 sections in Texas, 9 sections in New Mexico, and 9 sections in Arizona. Figure 1 shows the exact locations of the sections used in the study.
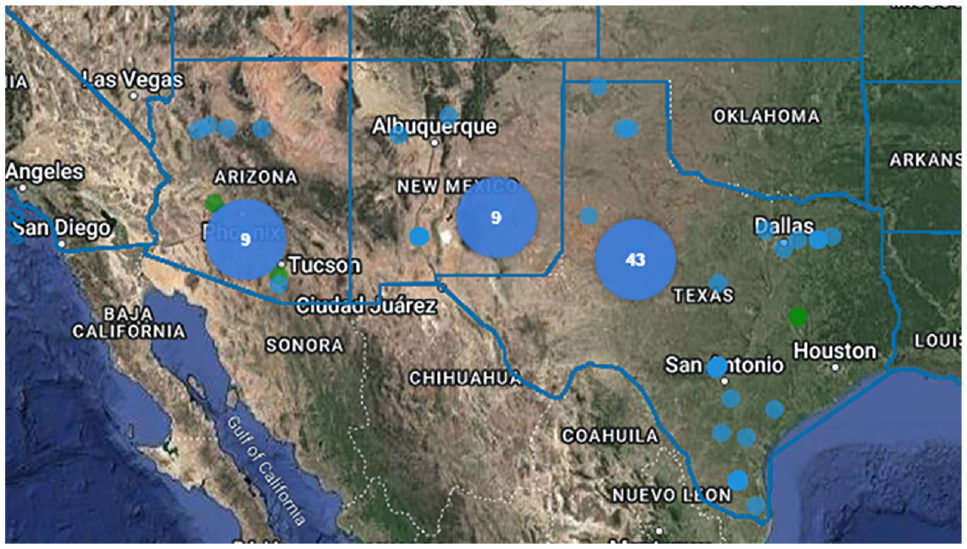
Locations of sections used in the study ( 15 ).
The review of previous studies revealed that various factors affect the bleeding area of asphalt pavements, including environmental changes, asphalt layer thickness, asphalt content, and the frequency of the repeated load. Based on these findings, the researchers extracted seven input variables (temperature, thickness, lane annual average daily truck traffic, lane annual truck volume estimate, precipitation, asphalt content, and annual snowfall) from the LTPP database to create an ANN model that can predict the bleeding area.
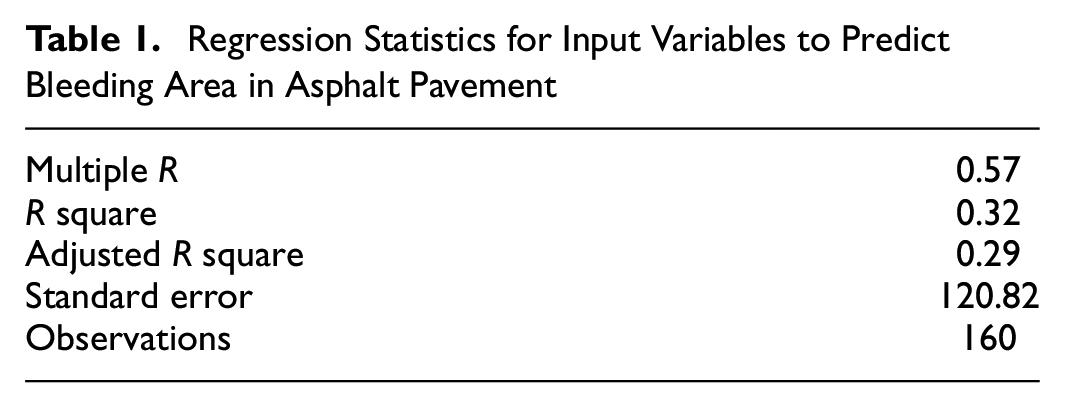
To determine the correlation between the input variables and output values, a regression analysis was conducted. The obtained value of R2 was 0.32, indicating that the input variables can explain 32.29% of the output values as shown in Figure 2. The difference between R2 and adjusted R2 was minimal, suggesting that other regression methods should be explored to significantly enhance the prediction accuracy. Table 1 provides more details of the results.
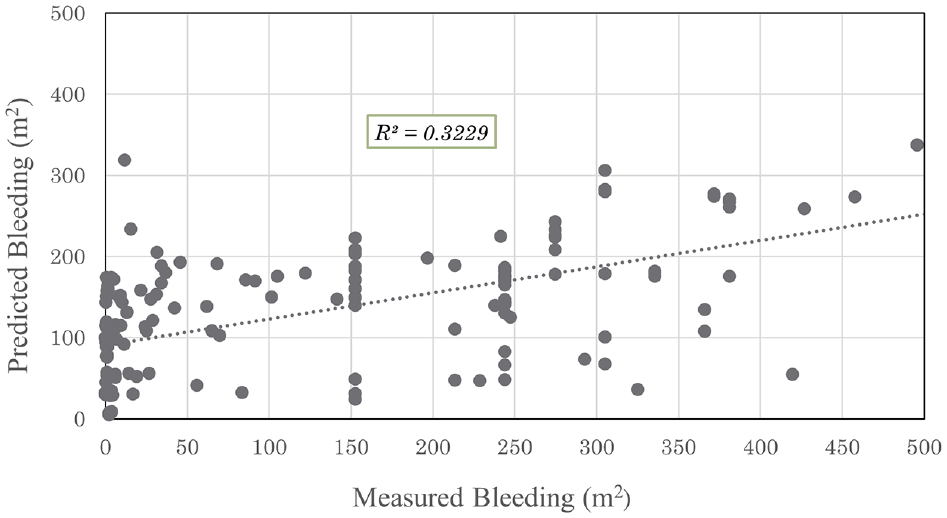
Relation between bleeding area and regression model.
Regression Statistics for Input Variables to Predict Bleeding Area in Asphalt Pavement
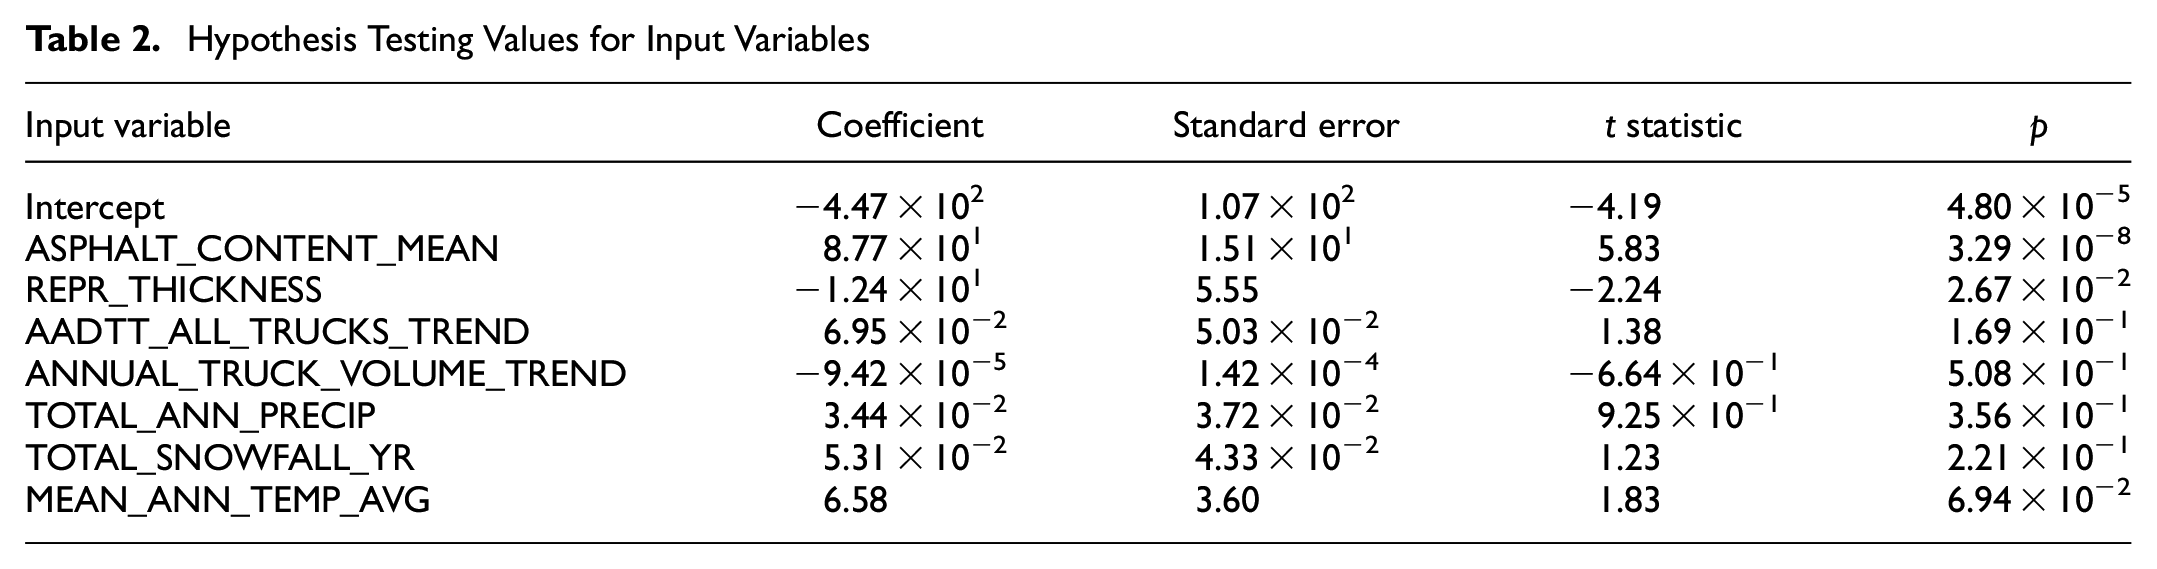
The regression statistics show a positive outcome, indicating that it is worthwhile to further develop the prediction model using the same variables. To test the variables, t statistics and p values were utilized. Table 2 provides evidence that the t statistics and p values validate a strong correlation between the input and output variables. A lower value of p indicates a stronger correlation between the variables, while a higher value of p suggests that the relationship is merely by chance. Therefore, based on the t statistics and p, it can be concluded that the input variables are highly correlated with the output variable and that continuing to use them in the prediction model would be effective.
Hypothesis Testing Values for Input Variables
ANN Bleeding Model Development
To create a prediction model, 160 data points were used with seven input variables. The main objective was to construct an ANN-based prediction model with the smallest number of neurons, and to obtain an equation from the model. Various kinds of ANN can be employed to create a predictive model. In this particular study, a multilayer ANN with one hidden layer and seven neurons was used. The decision to use the minimum number of neurons and hidden layers was based on the desire to obtain a simplified equation with a high coefficient of determination (R2).
Figure 3 displays the architecture of the developed ANN model. Before feeding the inputs into the model, the seven input variables were first normalized to lie within the range [−1,1] in the input layer. The normalized inputs were then multiplied by their corresponding weights and added together, and a bias term was included in the end. The resulting matrix multiplication and addition were then forwarded into the hidden layer, which consists of one hidden layer with seven neurons. The weights and biases used in this process were labeled as Wih and Bih. Next, a hyperbolic tangent function was applied to the input in the hidden layer, converting it into a new output. The output of the hyperbolic tangent function was then multiplied by another weight (Who) from the hidden layer to the output, and a bias term (Bho) was added to that. After all of these computations, the outcome in the output layer was a normalized output that falls within [−1,1]. Finally, the normalized output was denormalized, and the model provided the final output. The entire process of the model is illustrated in Figure 3.
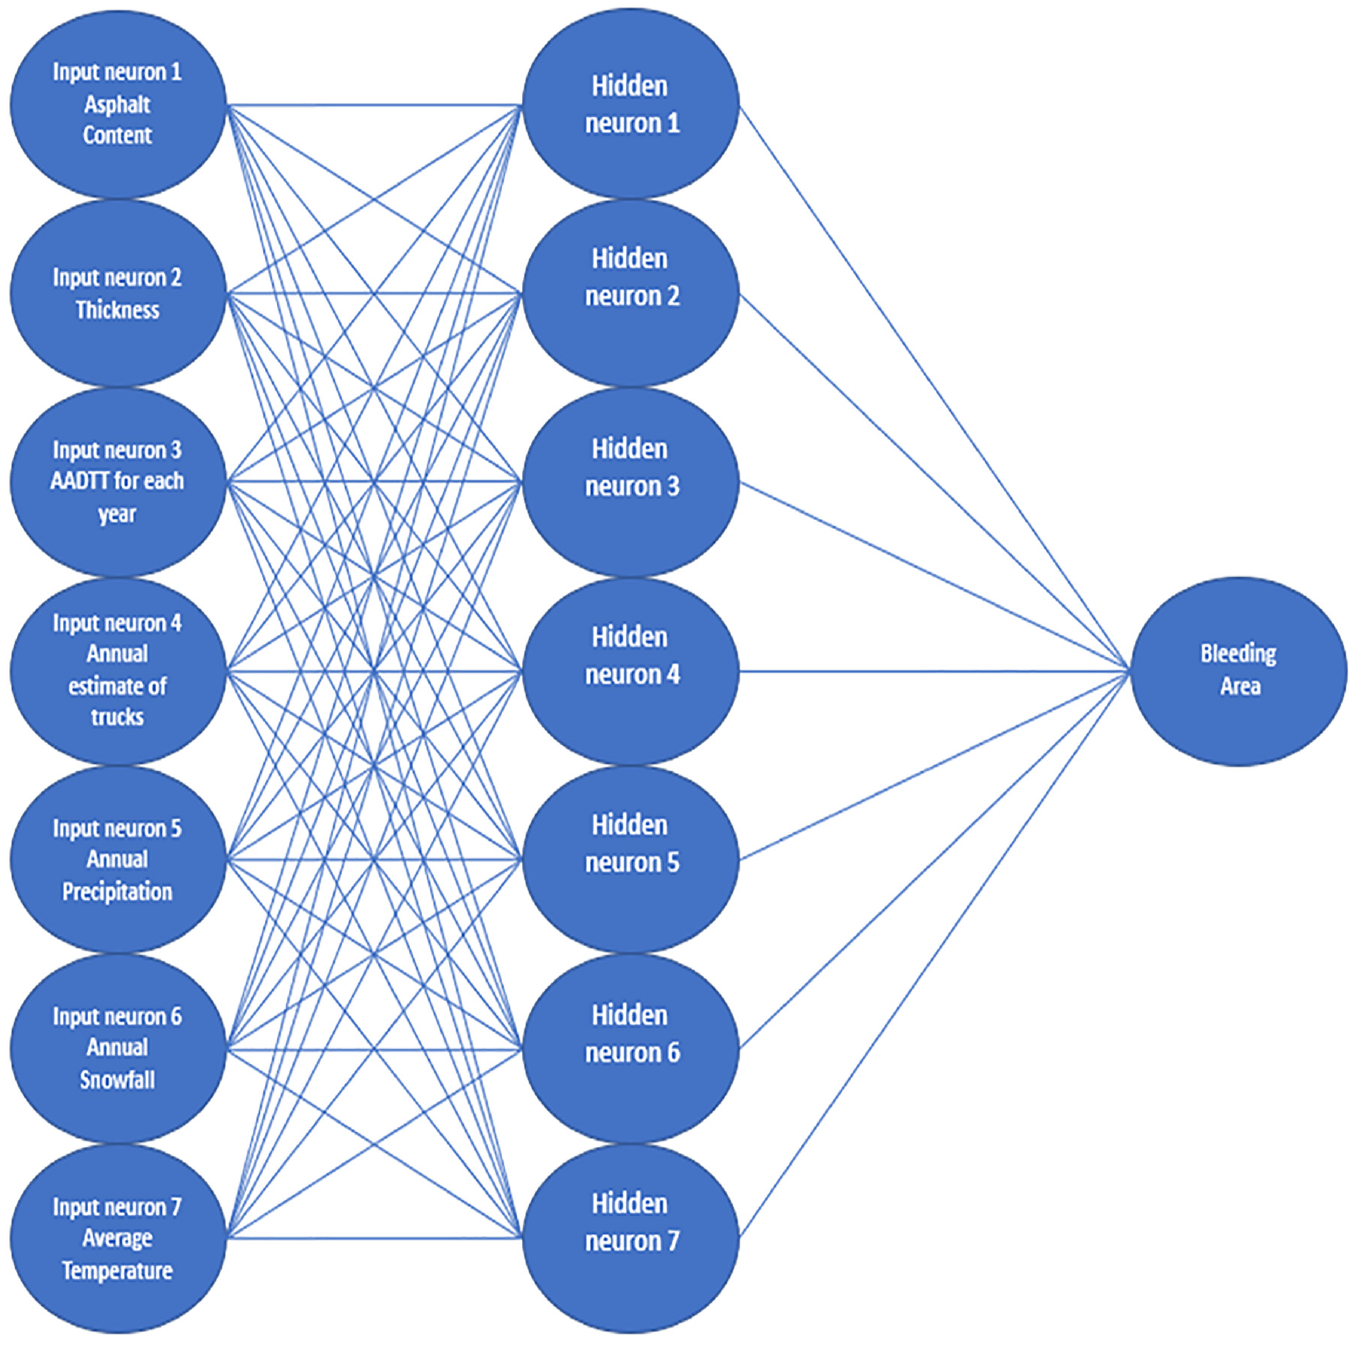
Architecture of developed artificial neural network model.
The input database contained 160 data points, of which 112 data points were randomly selected for training, constituting 70% of the entire dataset. To minimize the effect of variables with large numerical values, all inputs were normalized within the range [−1,1]. Later, the denormalization process was applied to obtain the actual output value. During the first iteration, the model randomly assigned weights and biases. The model’s output was then compared with the measured data from the training dataset, and the difference between them was considered as the error. The primary aim of the training was to minimize the mean squared error (MSE) by changing the weights and biases with each iteration using the backpropagation algorithm. Each iteration involving forward, and backward propagation is called an epoch, and the MSE is optimized with every epoch. According to Figure 4, it took 16 epochs to optimize the model.
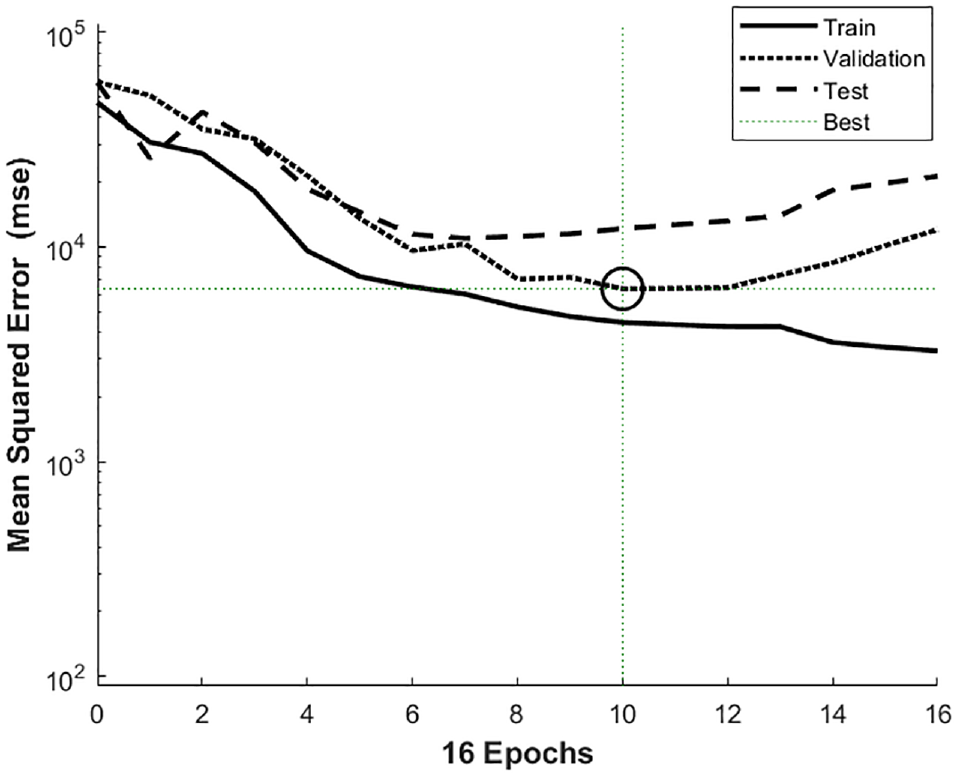
Optimizing the mean square error.
To prevent overfitting, the input data were split into three distinct sets: 70% of the data was used to train the model, while 15% was set aside for validation purposes. Finally, the remaining 15% of the data was used to test the model after the training and validation processes were completed. By dividing the data in this way, the model is protected from simply memorizing the input data and becoming too specialized. Instead, it is forced to learn and generalize from the patterns present in the input data. Overfitting occurs when the model performs well on the training data but fails to generalize well on new, unseen, data. Therefore, by validating the model with a separate dataset, we can ensure that it will perform well on new data that it has not seen before. The graphs in Figure 5 depict the results of the regression performed during the training, validation, and testing phases of the ANN prediction model. The values of R2 obtained during each of these steps are 0.78, 0.77, and 0.48, respectively. The relatively lower R2 of the testing dataset indicates the necessity of utilizing larger set of training data in future work.
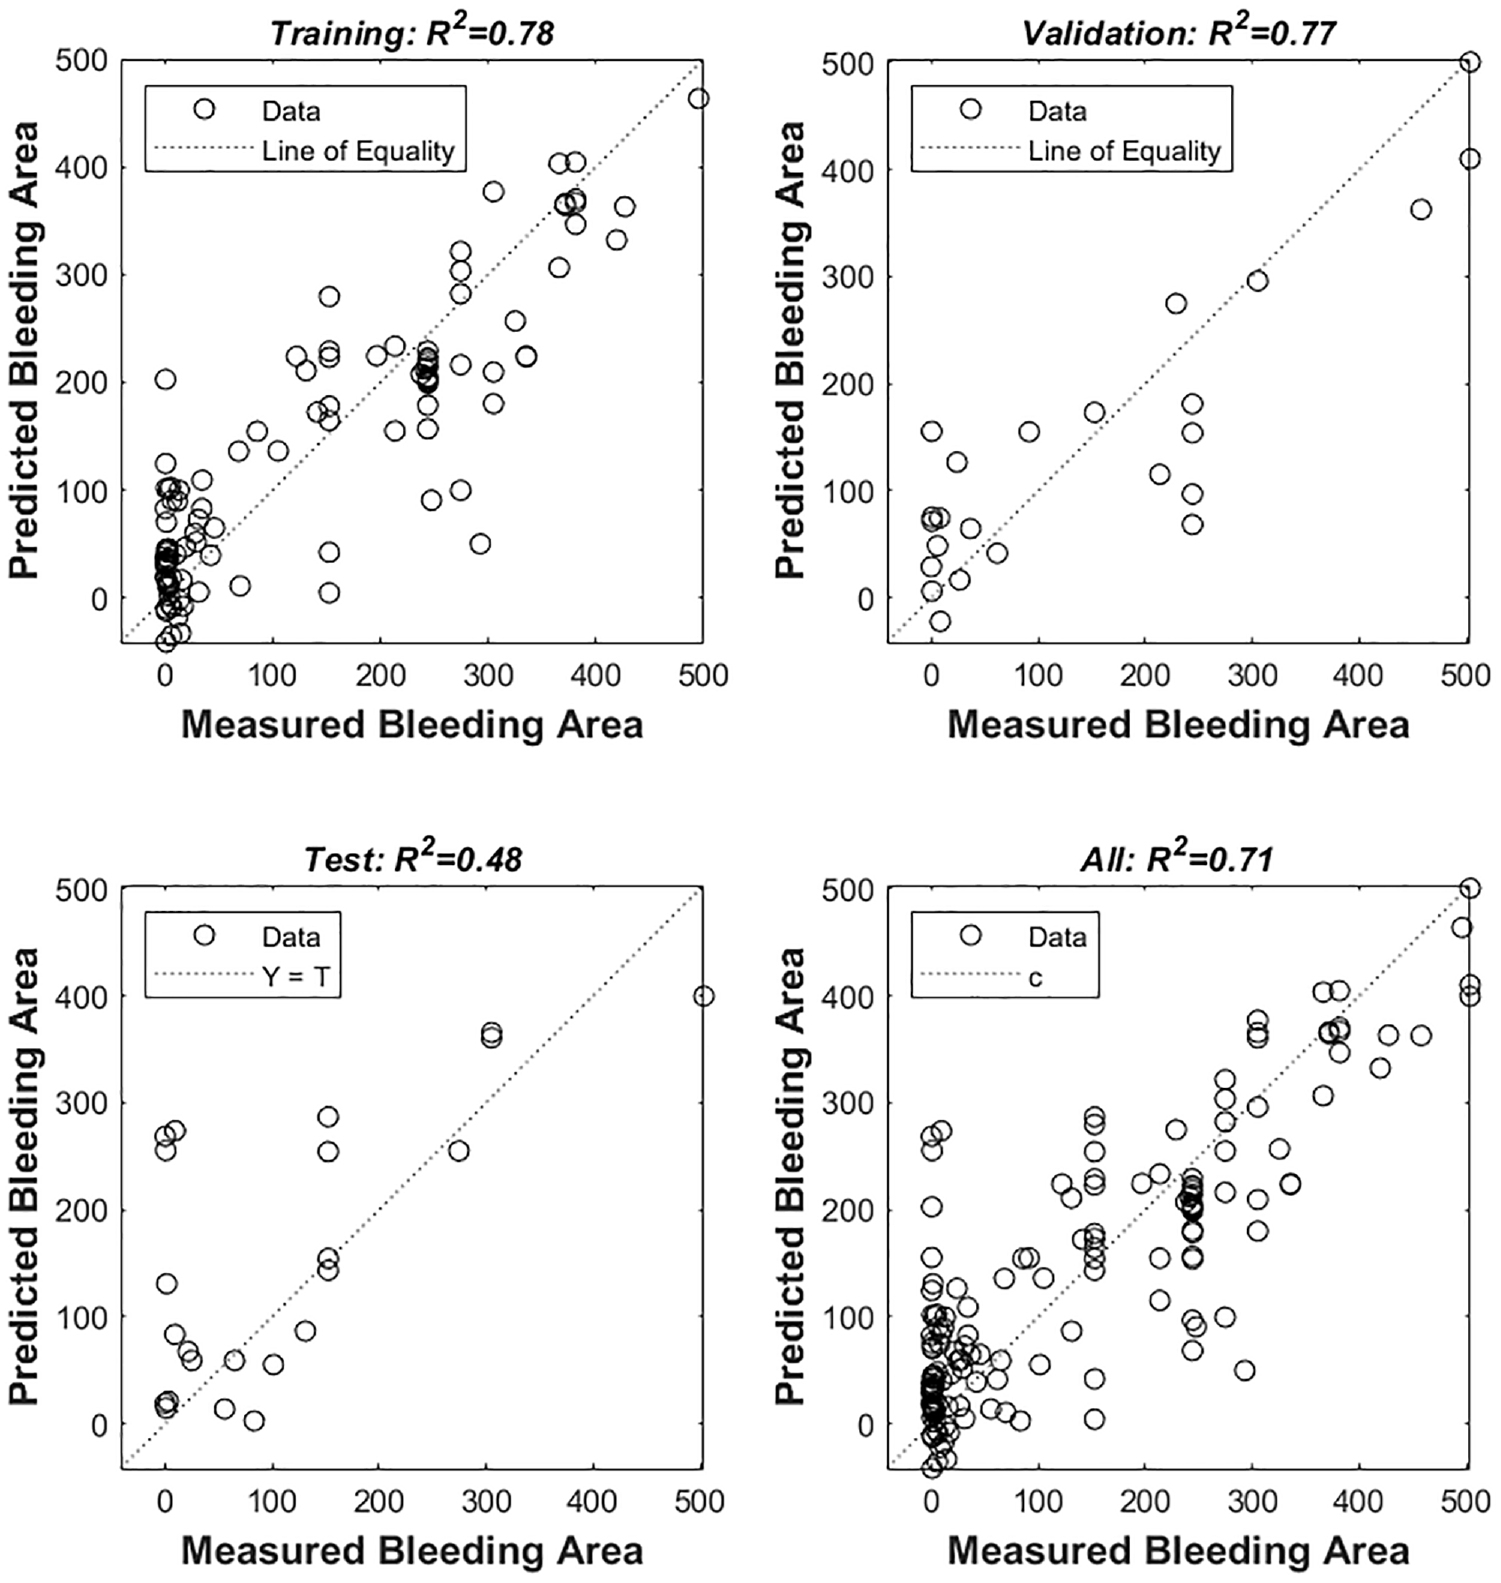
Evaluating the model predicted output against the measured target bleeding area.
There is a high demand for a predictive model that can be replicated and consistently produce accurate results. To address this need, in the study a model was employed that had a single hidden layer containing seven neurons, which used the tangent hyperbolic function as its activation function. The model’s mathematical formulation is expressed as a matrix multiplication equation:
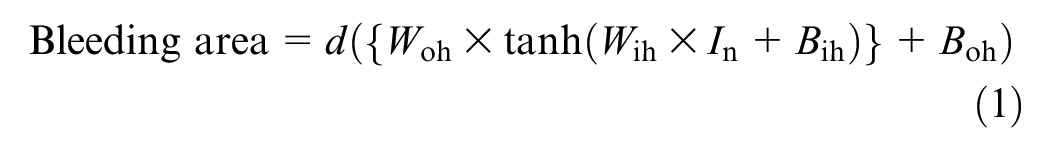
where d = denormalization operator; Wih = weight from input to hidden layer; Bih = bias for each neuron; In = normalized input variable; Who = weight from hidden layer to output; Bho = bias for the hidden layer to output.
The matrices representing the weights and biases for the developed model, which were obtained after the completion of the training, validation, and testing phases, are:
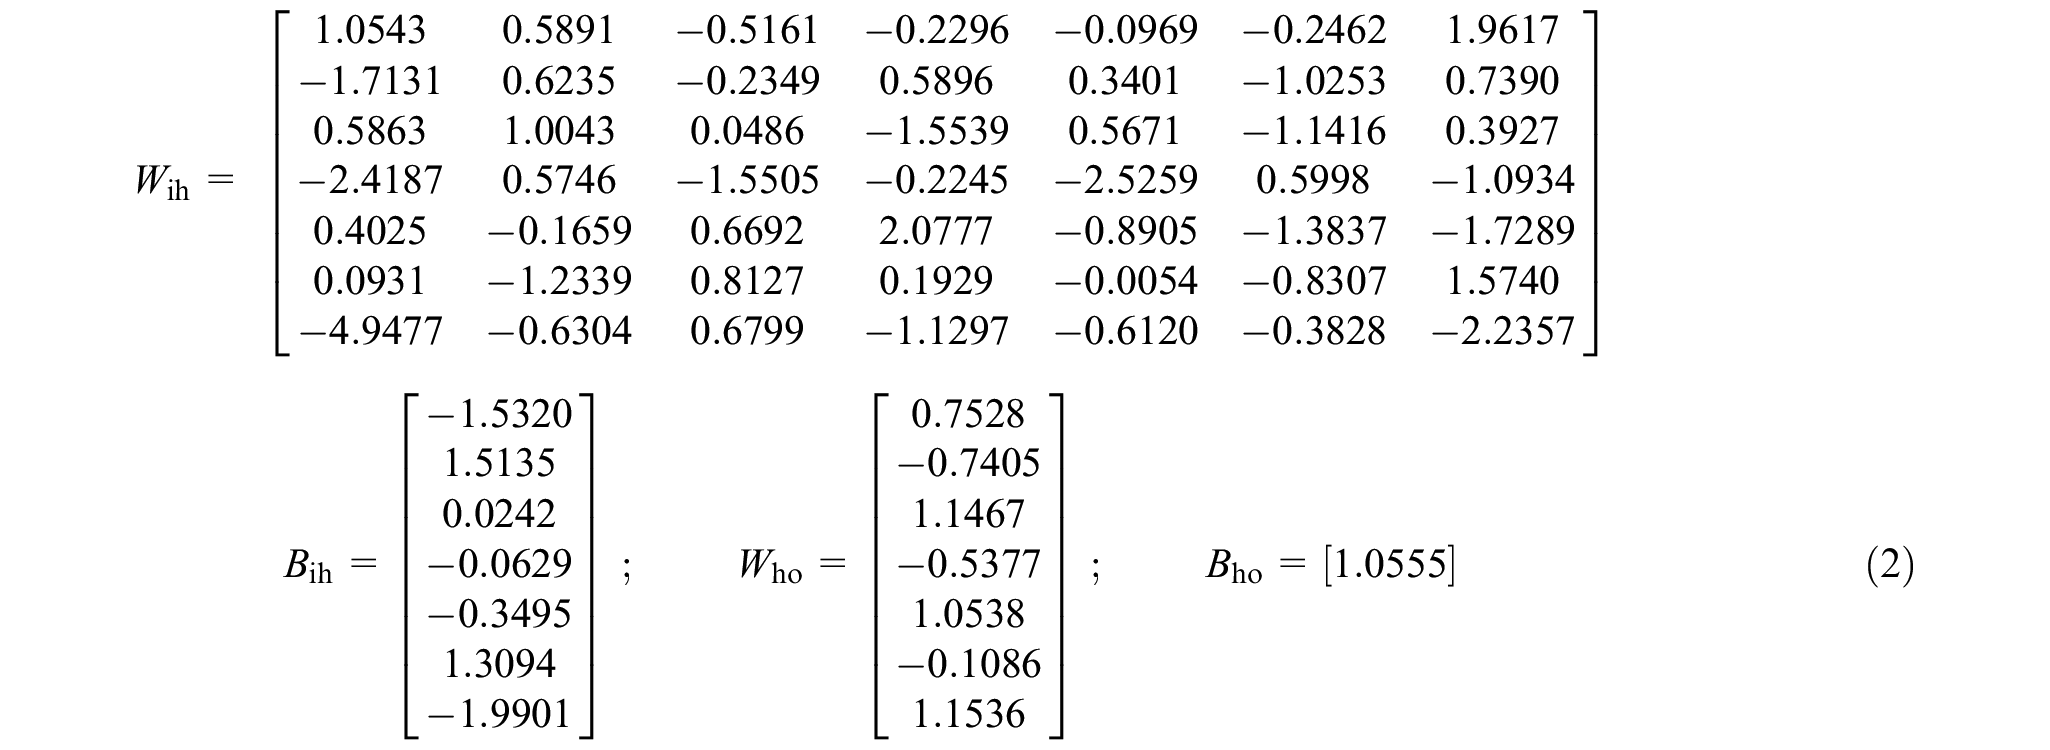
Providing information about the weights and biases used in the model is essential for ensuring its reproducibility and allowing for future use. However, constructing an ANN model from scratch using only weights and biases requires a certain degree of programming expertise. To streamline this process, the study derived an equation from the ANN model, which can be used to facilitate model reproduction without requiring a deep understanding of programming. Since the model contains one hidden layer with seven neurons, the equation incorporates the tangent hyperbolic function. This predictive equation is
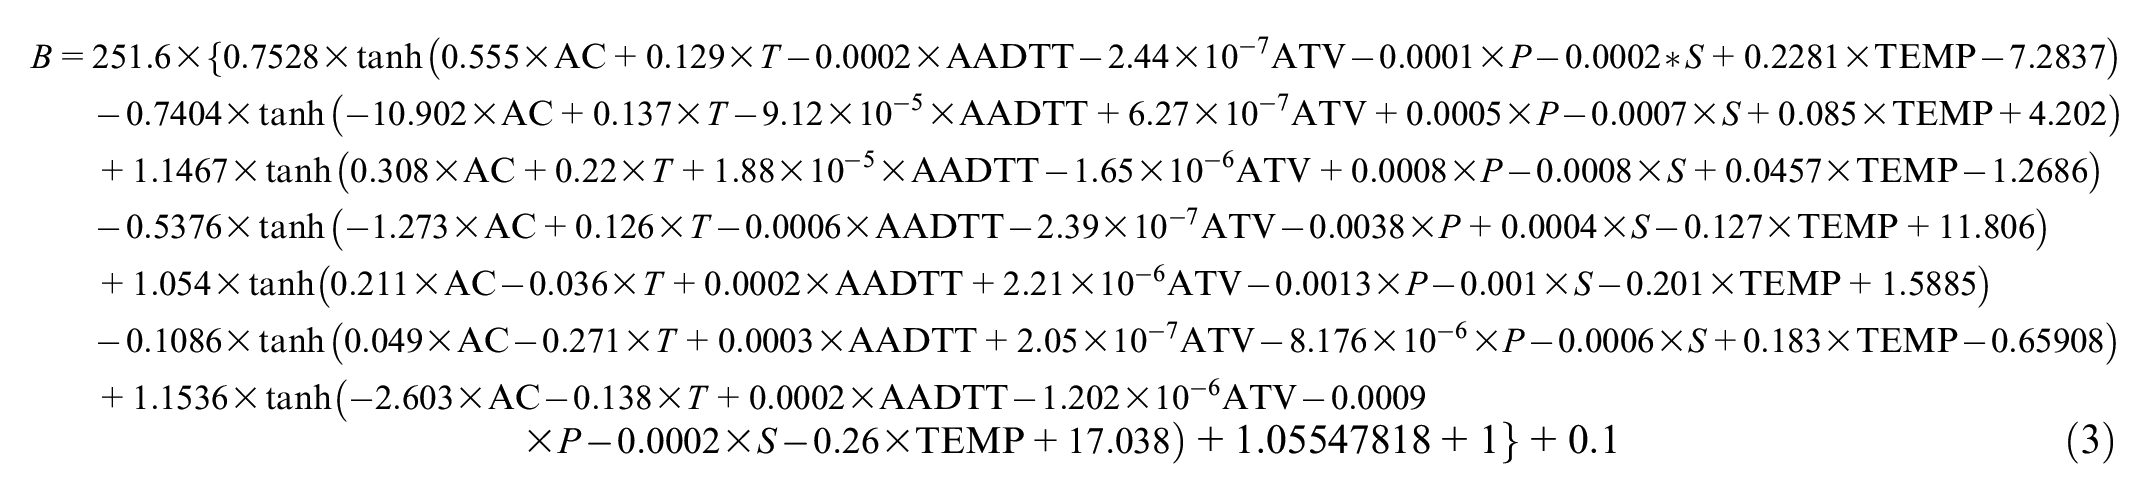
where B = bleeding area (m2); AC = asphalt content (%); T = thickness (in.); AADTT = average annual daily truck traffic; ATV = annual truck volume; P = annual precipitation (mm); S = annual snowfall (mm); TEMP = annual temperature (°C).
Sensitivity Analysis of Developed ANN Model
Sensitivity analysis is a crucial technique for examining the effect of independent variables on the dependent variable. One method of conducting this analysis involves holding all the independent variables at their average values and altering one variable at a time while plotting the resulting values. In this particular investigation, the input and output were examined through three iterations, and a correlation between the two was observed.
The study revealed that the bleeding area varies according to the proportionality of the inputs when evaluating the model’s sensitivity to each input factor. Additionally, it was determined that all the input variables, including the asphalt content, the asphalt thickness, average annual daily truck traffic (AADTT), annual truck volume, precipitation, and temperature, were directly proportional to the bleeding area, while the annual snowfall was inversely proportional. Figure 6 displays the results of the sensitivity analysis for bleeding areas in asphalt pavements.
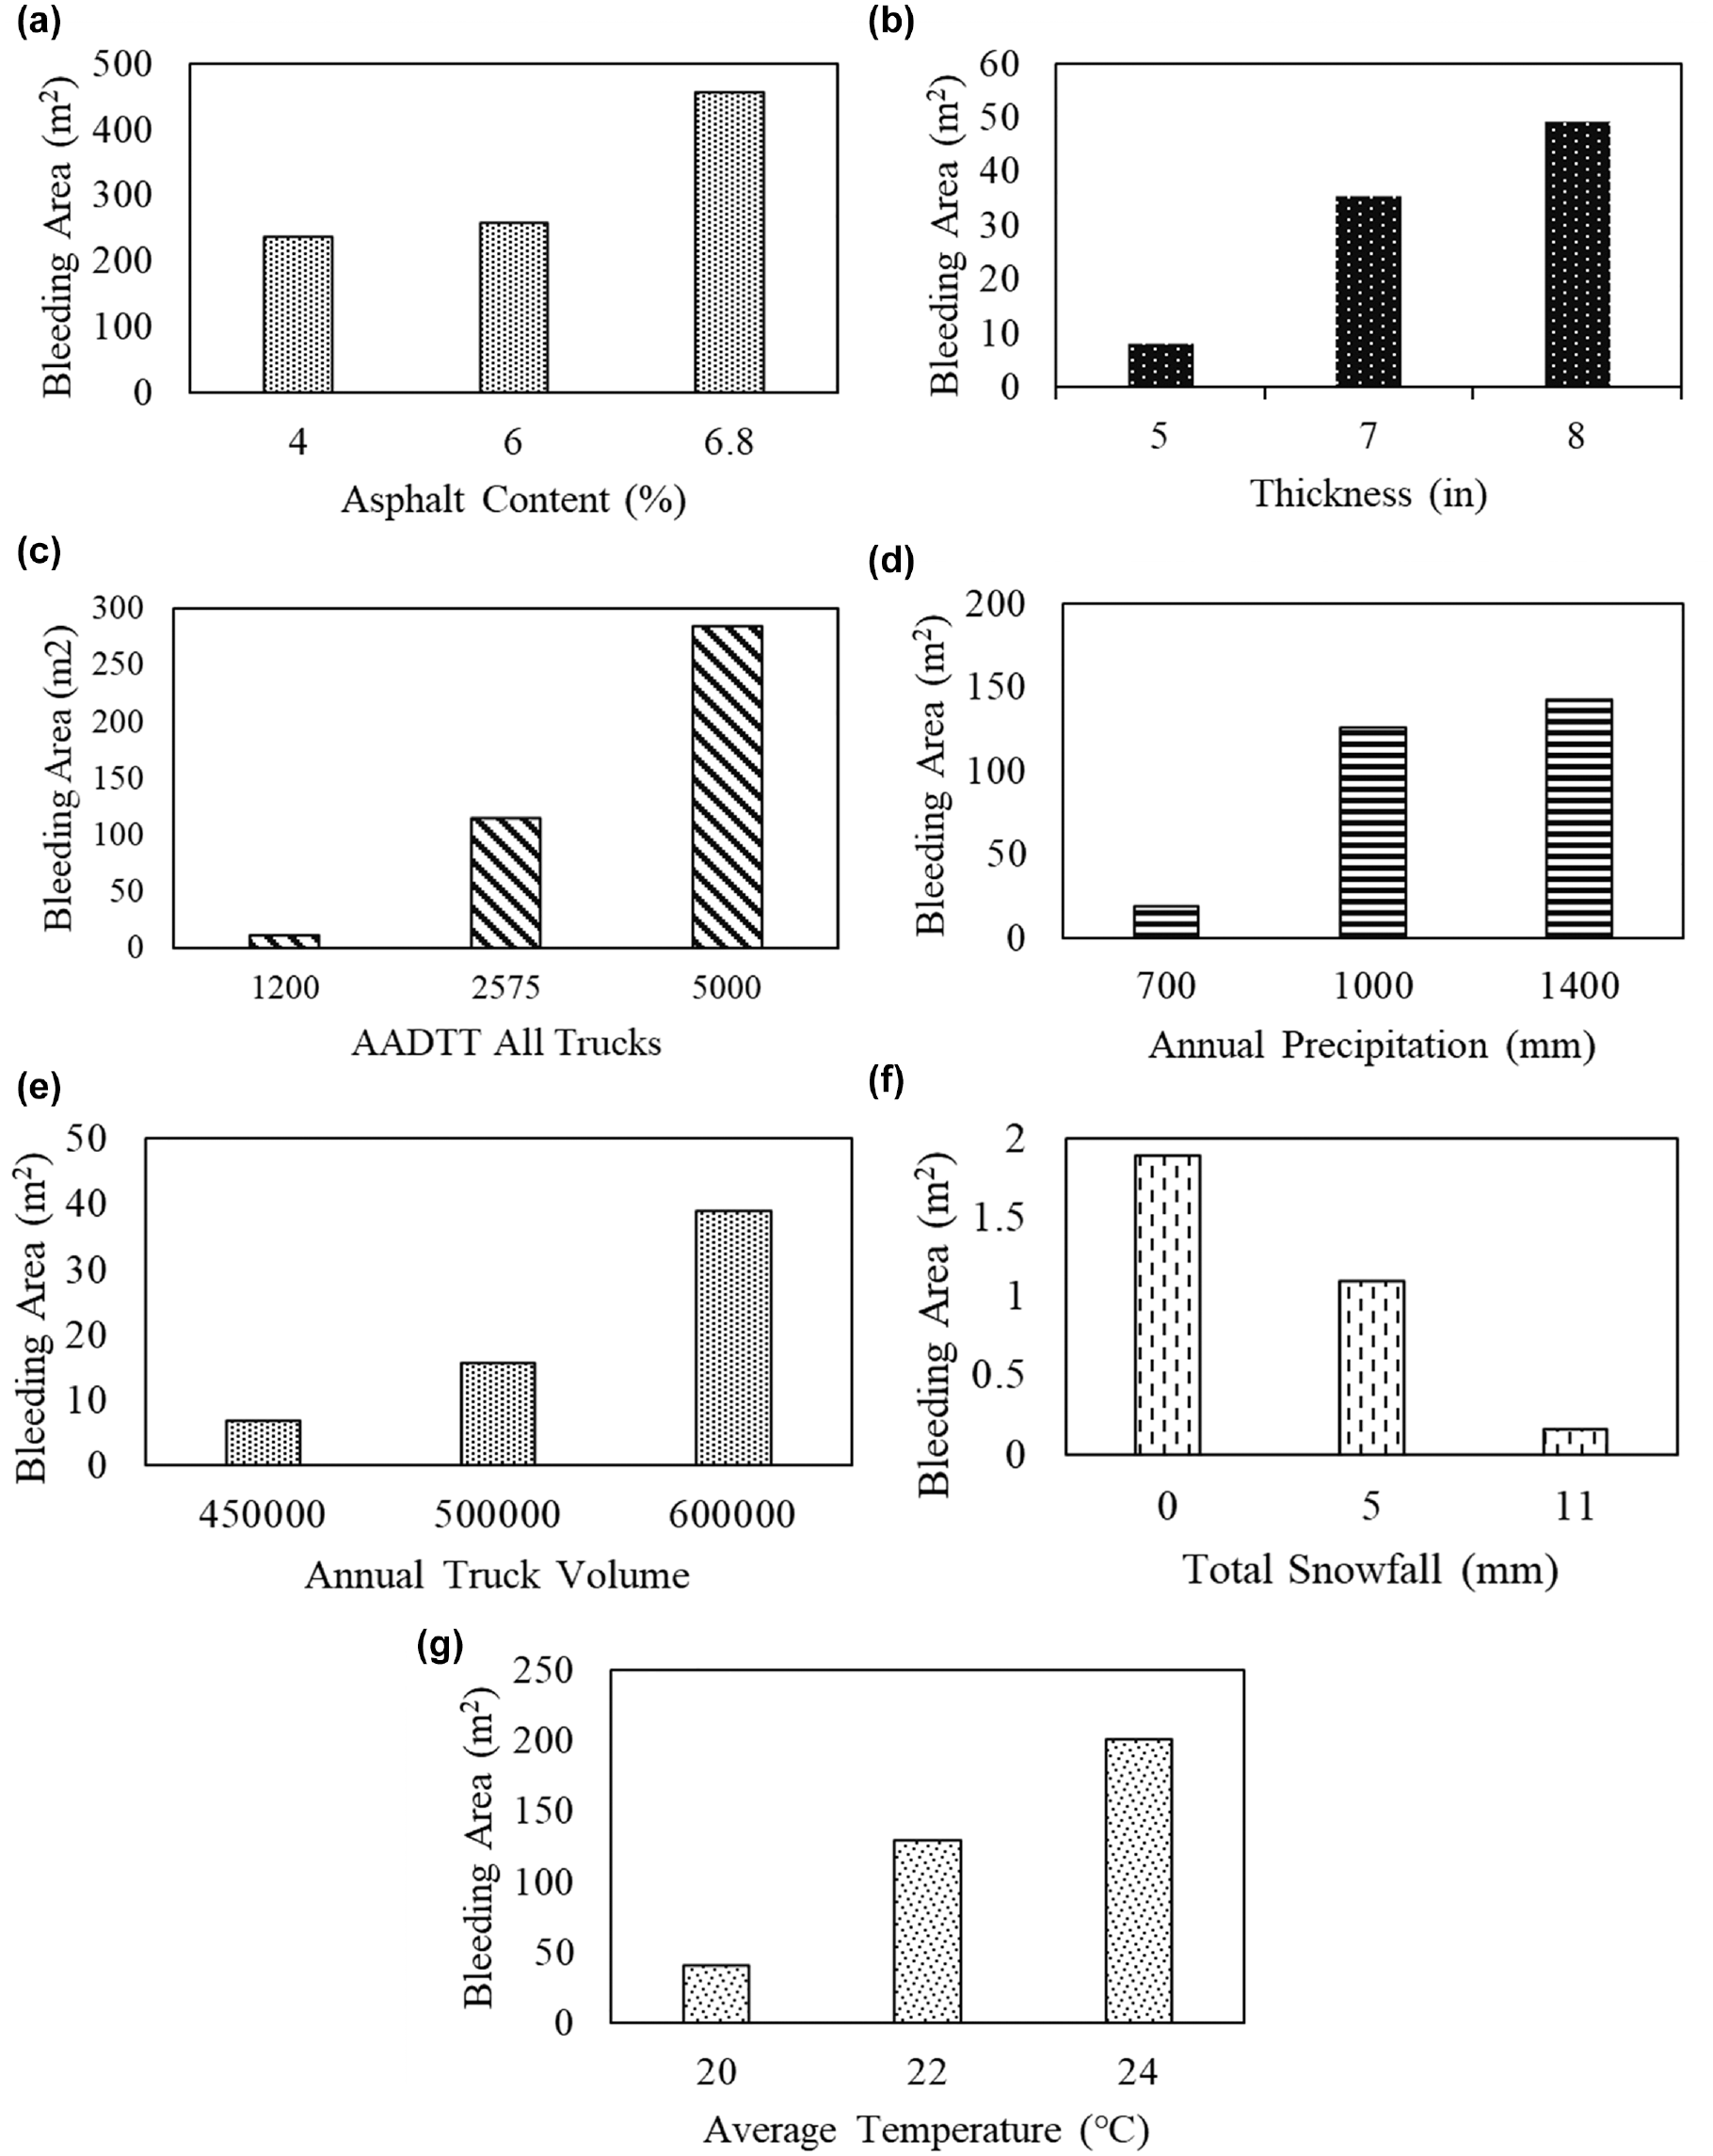
Sensitivity analysis for model inputs: (a) asphalt content; (b) thickness; (c) average annual daily truck traffic (AADTT); (d) precipitation; (e) truck volume; (f) snowfall; (g) temperature.
In this study, another tool was utilized to conduct a comprehensive sensitivity analysis. This analytical tool proves invaluable when dealing with models with several inputs, as it allows the effect of each individual input on the model’s behavior to be discerned. By quantifying the sensitivity index, we can precisely determine the relative influence of each input on the overall outcome of the model:
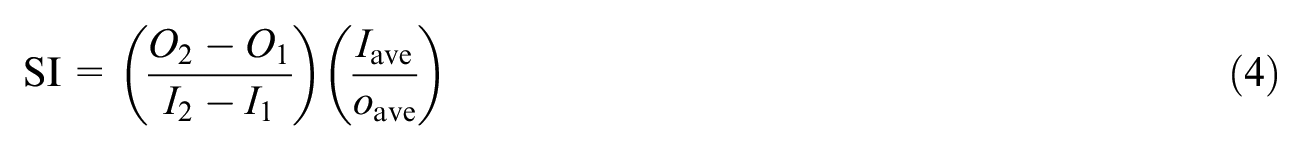
where SI = sensitivity index; I1 = smallest input value; I2 = largest input value; O1 = model output value corresponding to I1; O2 = model output value corresponding to I2; Iave = average of I1 and I2; Oave = average of O1 and O2.
This equation allows numerical values to be assigned to the inputs, ordering them from the most significant to the least influential on the model’s result, allowing determination of the sensitivity index. This process helps identify key variables and potential areas for optimization or enhancement by providing useful insights into the dynamics and interactions of various model components ( 16 ).
The sensitivity index’s (SI’s) greater absolute value denotes a greater effect of that particular input on the model’s output. The absolute value of the SI with the associated input for the study is presented in Figure 7. The average temperature and asphalt content have been shown to have the greatest effect on the bleeding area. The bleeding areas in the asphalt pavements are less affected by the other inputs.
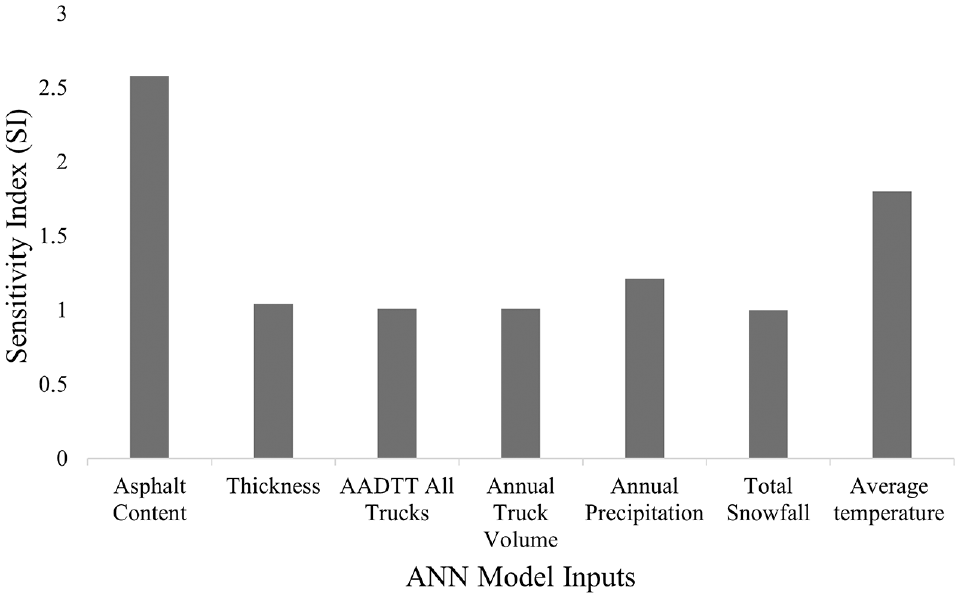
Sensitivity index for model inputs.
Conclusions and Recommendations
In conclusion, our study was effective in developing an ANN model to forecast the bleeding area in asphalt pavements. The model’s architecture included a hidden layer of seven neurons, and the study made use of seven different input variables: temperature, precipitation, yearly snowfall, AADTT, AADTT volume, and asphalt content and thickness. The results of the performance comparison between the ANN model and linear regression made it abundantly evident that the ANN model’s predicting abilities were greater. The ANN model greatly outperformed the linear regression model, which produced R2 = 0.32, and attained a commendable coefficient of determination (R2) of 0.71. The limitation of the model is its dependency on the range of data used for training. The model is more accurate when applied to input values within the range of the training data.
Additionally, a sensitivity analysis was conducted to verify the results of the ANN model and to learn more about how the input factors affected the anticipated bleeding area. Understanding how changes in the input parameters influenced the model’s predictions was made possible by the sensitivity analysis, which emphasized the important elements.
The study’s overall findings highlight how well the developed ANN model predicts the bleeding area in asphalt pavements. The ANN model’s improved ability to capture the complex and nonlinear relationships within the data is indicated by the higher value of R2 obtained, compared with linear regression. This ANN-based prediction technique has a lot of potential to improve decision-making in asphalt pavement management by providing more focused and efficient strategies for dealing with bleeding issues. The results of the sensitivity analysis add to our understanding of the model’s behavior and confirm that it has great promise as a tool for pavement engineering. The ANN model can be included in PMSs to enhance the performance and maintenance of asphalt pavements, delivering safer and more resilient surfaces.
The methodology and insights from the study lay a foundation for more comprehensive models and an enhanced understanding of PMSs. The potential integration of the model with existing PMSs could substantially improve their predictive capabilities. These elaborations underscore the real-world effect and applicability of this study, highlighting its value in the field of pavement engineering and maintenance, and demonstrating its promise as a tool for future advancements in pavement management.
Expanding the dataset to include data from various regions would make the model more robust, and there is also a chance that the input parameters, such as pavement characteristics, traffic characteristics, or environmental considerations, could be increased in future research to improve the ANN model’s prediction for bleeding in asphalt pavements. Also, using different strategies, such as incorporating additional data, optimizing model parameters, and exploring alternative machine learning techniques, can improve the accuracy of the model.
Footnotes
Author Contributions
The authors confirm contribution to the paper as follows: study conception and design: R. Khalifah, M. I. Souliman; data collection: R. Khalifah, M. I. Souliman; analysis and interpretation of results: R. Khalifah, P. Lama, M. I. Souliman; draft manuscript preparation: R. Khalifah, P. Lama, M. Souliman, O. Elbagalati. All authors reviewed the results and approved the final version of the manuscript.
Declaration of Conflicting Interests
The author(s) declared no potential conflicts of interest with respect to the research, authorship, and/or publication of this article.
Funding
The author(s) received no financial support for the research, authorship, and/or publication of this article.