
Abstract
Wildfire evacuations have become a persistent challenge all over the world in recent years. Studies have proposed various evacuation strategies, such as vehicle reduction, phased evacuation, and prohibition of on-street parking, which have demonstrated effectiveness in specific communities. However, a comprehensive study that generalizes the effectiveness and applicability of these strategies across different types of communities is lacking. This generalization could hold significant value for small, resource-strapped communities situated in wildland–urban interface zones (i.e., comprising a mix of residences and flammable vegetation) that lack the resources to conduct dedicated evacuation studies. In this study, two indicators, the ratio of background traffic volume to the number of evacuees (RBE), and the ratio of the capacity of the main evacuation roads to the number of evacuees (RCE) were derived to categorize communities into specific groups based on their characteristics during wildfire events. Through evacuation simulations of some typical real-world communities, the applicability and effectiveness of each strategy for each group was assessed. For the given scenarios considered, the findings revealed that for communities with high a RBE and low RCE, promoting carpooling with more than two people per vehicle, extending phased evacuation intervals with safety assurance for evacuees, and enforcing on-street parking prohibition made evacuations more effective. For other communities, encouraging families to use fewer vehicles and implementing a 15-min phased interval, if possible, could potentially be useful.
Keywords
Owing to the combination of climate change effects such as higher temperatures and droughts, along with the expansion of residential developments into forested regions, wildfires in rural areas have transformed into an ongoing crisis all over the world ( 1 ). Empirical evidence suggests a notable escalation in both the effects and intensity of wildfires in recent years, resulting in substantial economic losses and a significant number of casualties ( 2 ). The Camp Fire—the deadliest and most destructive wildfire in California’s history—claimed the lives of over 80 individuals and inflicted financial losses exceeding 8 billion dollars: the scale and complexity of the incident overwhelmed the initial evacuation plans ( 3 ). It is thus imperative to engage in thoughtful reflection and formulate tailored evacuation strategies for communities at risk of wildfires.
In the literature, a long line of studies have investigated evacuation strategies: most focus on how to improve evacuation efficiency within the duration of a few hours to reduce evacuation time. As summarized by Zhao and Wong, these strategies are designed to (i) improve the network capacity through strategies such as prohibiting on-street parking and contraflow, or (ii) optimize network utilization by evacuees through strategies such as vehicle reduction (i.e., carpooling) and phased evacuation, which reduce the number of evacuating vehicles and lower the peak demand on the roadways, respectively, by temporally spreading out evacuees ( 4 ). In relation to improvements in network capacity, Cova indicated that on-street parking restrictions prevent low-capacity roads from becoming even lower ( 5 ). A study of community capacity enhancement in relation to fire disaster mitigation in Banda Aceh, Indonesia, also demonstrated the benefit of prohibiting on-street parking ( 6 ). Several studies have investigated instituting contraflow, that is, reversing the direction of traffic as an evacuation strategy ( 7 , 8 ). Clark et al. found that instigating a contraflow evacuation in the event of a tropical cyclone had the potential to effectively evacuate residents from the danger area, but that sometimes such a contraflow evacuation could cause severe traffic congestion ( 9 ). It is therefore necessary to analyze road conditions before implementing this strategy. In optimizing network utilization, the vehicle reduction/carpooling approach represents on demand reduction, as opposed to capacity augmentation ( 10 ). A hurricane evacuation study by Sadri et al. showed that 41% of evacuees were willing to ride with others from neighboring households to save money and travel time ( 11 ). In a case study of Berkeley Hills, CA, Zhao and Wong proposed that vehicle reduction could effectively mitigate traffic congestion by 69% if each household shared one vehicle during a wildfire evacuation ( 4 ). Harris conducted an analysis to assess the impact of vehicle reduction during hurricane evacuations, demonstrating that increasing car occupancy from 1 to 2 people yielded a notable enhancement in evacuation rates: a 9.5% improvement ( 12 ). In relation to phased evacuation, So and Daganzo pointed out that those closer to danger should leave first ( 13 ). Chen and Zhan tested all phased sequences in a road network with four evacuation zones ( 14 ). They found that if the affected area had a high population density and the road network followed a grid structure, implementing a phased evacuation strategy that involves alternating nonadjacent zones can effectively reduce overall evacuation time. Li et al. found that under slow-moving fires, the phased strategy performed better than the simultaneous strategy, with a reduction of 1.6% to 24.09% in total fire exposure time ( 15 ).
Although the above-mentioned strategies proved effective in certain cases, not all strategies can be perfectly applied across all fire-prone communities because of their uniqueness. Furthermore, few small, resource-strapped communities with an intermix of residences and flammable vegetation in wildland–urban interface (WUI) zones have the resources to conduct dedicated evacuation studies. Therefore, it is necessary to understand the potential applicability of the proposed strategies across different types of communities. At this point, it is worth noting a limitation of some of the existing studies. When the aforementioned strategies were tested, background traffic, which refers to the traffic that cannot be redirected and passes through the evacuation area, was seldom considered in the existing body of research. However, for many fire-prone communities, discussions of background traffic are crucial, as such traffic surrounding these communities can be heavy during the daytime, which could impede evacuations. One potential reason for not having considered background traffic in evacuation studies is the lack of such data. To solve this problem, Gehlot et al. proposed utilizing Google Map Directions API to extract road travel speed data at hourly intervals, which was considered as the speed limit for the respective roads ( 16 ). Although this approach partially integrates background traffic, it cannot capture the interaction between the evacuees and the background traffic. This is because the interaction between evacuation vehicles and background traffic can cause delays, which can also affect the flow of roads both upstream and downstream. Recently, several agencies have been collecting travel and demographic information from the residents of certain cities to help understand the commuting patterns there. After processing the collected data, the travel data, which includes the origin (O), destination (D), departure time, and travel purpose, can be elicited. These kinds of commuting data can be taken as background traffic data, which is useful to the integration of background traffic into research on wildfire evacuations. For example, Metropolitan Transportation Commission provides typical daily travel data of the Bay Area, CA (www.mtc.ca.gov); the U.S. Department of Transportation produces national household travel data (www.rosap.ntl.bts.gov), and the U.S. Census Bureau provides census data based on, for instance, the 2012 to 2016 American Community Survey Data (https://ctpp.transportation.org).
To explore the effectiveness and applicability of these evacuation strategies across different types of community in the event of a wildfire, the current study derived two indicators to categorize communities into groups based on their characteristics. One was the ratio of background traffic volume to the number of evacuees (RBE); the other was the ratio of the capacity of the main evacuation roads to the number of evacuees (RCE). RBE measures the impact of background traffic on the evacuation and RCE measures the impact of road capacity. Communities were categorized under four groups for analysis: a group of communities of high RBE and high RCE, a group of communities of high RBE and low RCE, a group of communities of low RBE and high RCE, and a group of communities of low RBE and low RCE. Through simulations of different evacuation strategies on communities that typified the different groups, the applicability and effectiveness of each evacuation strategy for each specific group were assessed. These findings will provide recommendations for selecting appropriate evacuation strategies for other similar communities or the same community but during different evacuation periods.
To the best of the authors’ knowledge, this study is one of the first attempts to analyze the potential generalizability of certain evacuation strategies to communities with different characteristics. The main contributions of this study are as follows: (i) the evacuation strategies were evaluated on communities with different RBEs and RCEs using an agent-based simulation model; (ii) the criteria for categorizing communities into groups of high and low RBEs and RCEs were determined based on a simplified traffic network and verified on four cases; (iii) typical real-world communities affiliated with the different groups were adopted for the evacuation analyses and to analyze the applicability and effectiveness of each evacuation strategy for each group.
The remainder of the paper is organized as follows. Section “Methods” presents the simulation model, tested evacuation strategies, and the performance evaluation criteria of each strategy. Section “Division Criteria for Communities” determines the criteria for categorizing communities using a simplified traffic network. Section “Case studies” describes some of the WUI communities that were selected as test sites. Section “Results and Discussion” presents the results and analyzes the performance of the tested evacuation strategies in different types of communities. Finally, our conclusions are presented in Section “Conclusions and Future.”
Methods
Spatial–Queue-Based Traffic Simulation
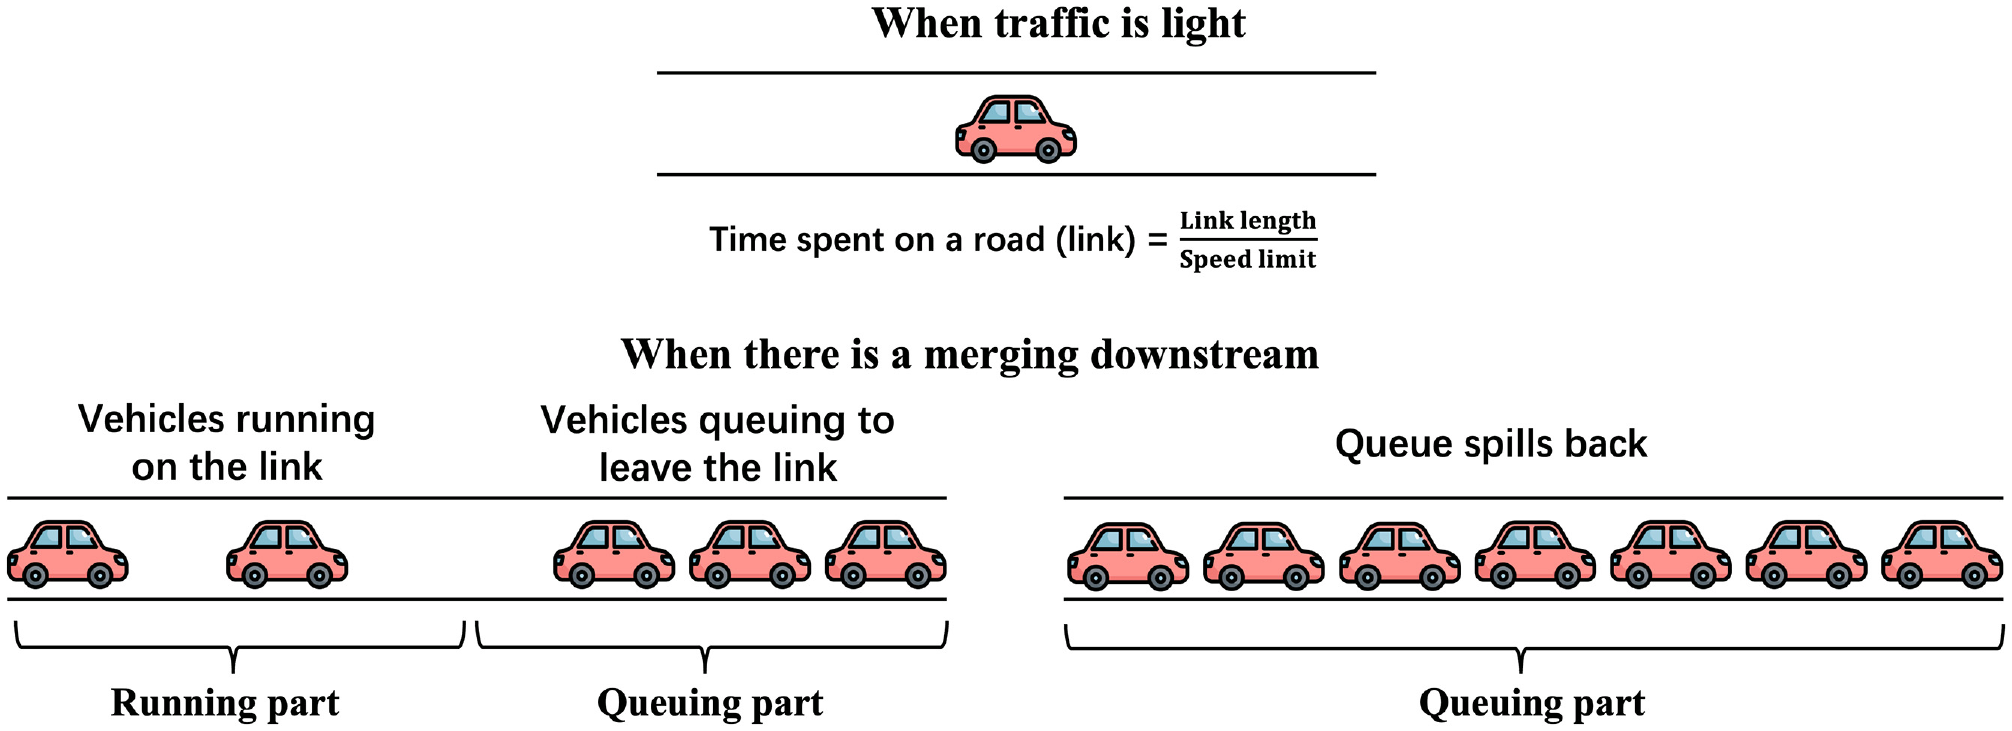
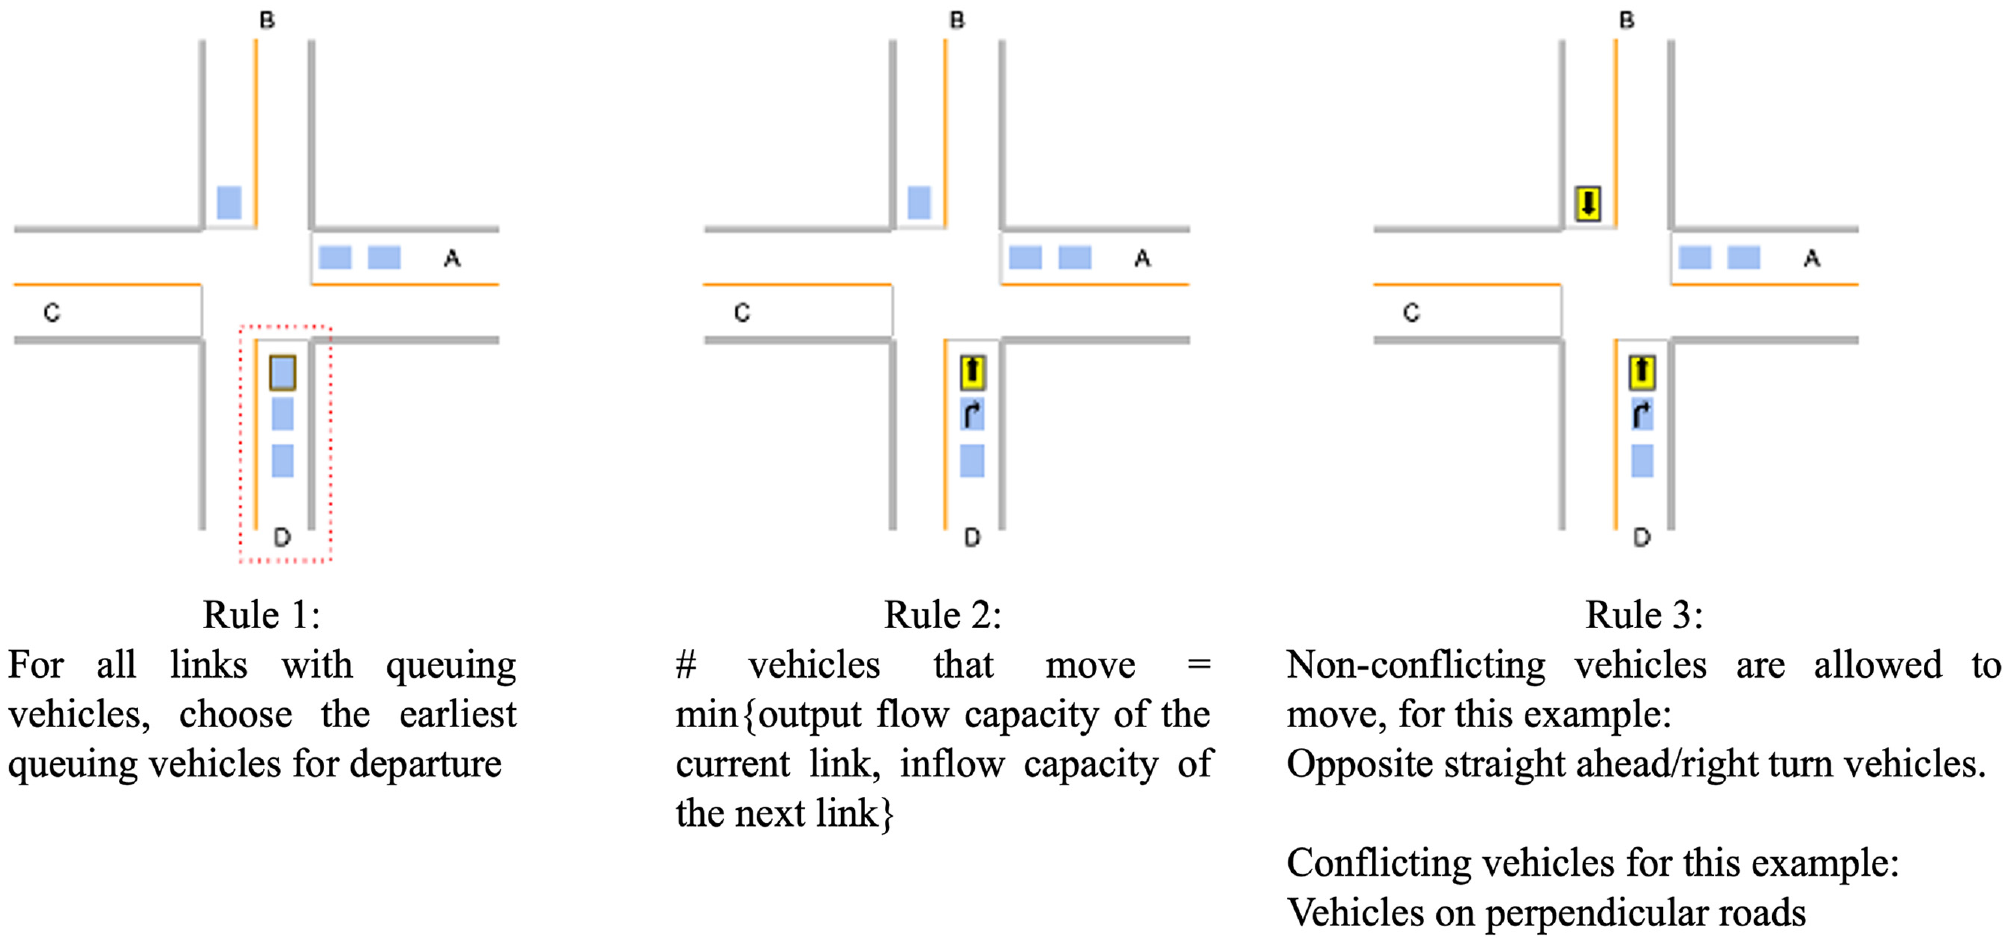
A spatial–queue-based traffic model, developed by the research team (https://github.com/cb-cities/spatial_queue), was utilized to simulate the evacuation process owing to its lower data intensity and ease of programming compared with popular microscopic simulators that implement car-following and lane-changing behaviors. The simulation model consisted of three basic elements: (i) vehicles, (ii) intersections (nodes), and (iii) road links. Illustrative link and node models are shown in Figures 1 and 2.
An illustrative link model.
An illustrative node model.
Each vehicle is simulated as one agent interacting with other vehicle agents. An initial route is given to each vehicle agent, and the routes are updated every 600 s based on the evolving traffic status (e.g., congestion), in a manner that imitates how route recommendations are updated in real time in navigation apps like Google Maps, Apple Maps, and Waze.
Figure 1 shows the rationale of the link model. A link in the road network graph corresponds to a stretch of road between two intersections. The link simulates the time that it takes for a vehicle to move from the upstream node to the downstream node, creating the effects of queues and spillbacks. When a vehicle enters upstream of a link, it becomes a running vehicle and needs to spend at least the free flow travel time on a link before joining a queue at the end where it becomes a queuing vehicle. When the end of the queue formed by vehicles with physical length reaches the upstream end of the link, spillback occurs, and no more vehicles can enter this link. The link flow capacity was assumed to be 2,000 vehicles per hour per lane (vphpl), aligning with the roadway capacity standard ( 17 ). It is worth noting that the capacity of different roads varies, and the design values should preferably be verified based on actual situations before being adopted. In this study, the link capacities of the simulated roads were imposed in a coin flip probability manner at each 1-s time step, with a probability of a queuing vehicle at the front leaving the current link or entering the next link at 0.56 vehicles per second per lane (vps/lane).
Figure 2 shows the rationale of the node model. The node moves vehicles at the front of each link—the first to queue at the intersection—to the next link at each 1-s time step if they satisfy the inflow capacity of the next link, the outflow capacity of the current link, and do not conflict with other vehicles moving through the intersection at that time step, such as those turning left or from perpendicular directions. Vehicles entering an intersection were assumed to have equal priority, except for vehicles already in the roundabouts, which had higher priority than vehicles feeding into the roundabouts. All intersections were modeled as nonsignalized in anticipation of power failures.
Evacuation Strategies and Scenario Development
The aim of this study was to compare the effectiveness of various evacuation strategies in areas with different attributes by conducting scenario testing with controlled variables. The scenarios can be summarized into three types:
• Vehicle reduction. As a small increase in vehicles on the roads during an evacuation can significantly increase congestion, it is imperative to know how the policy of carpooling can make a difference to evacuation efficiency ( 18 , 19 ).
• Phased evacuation. Several studies have demonstrated the effectiveness of phased evacuation ( 13 , 14 ). In this study, the effect of the phased evacuation strategy on evacuations in areas with different attributes was analyzed.
• Prohibition of on-street parking on “red flag warning” days (i.e., when a forecast warning is issued by the National Weather Service in the United States to inform the public, firefighters, and land management agencies that conditions are ideal for wildland fire combustion and rapid spread). On-street parking reduces the number of accessible lanes, which in turn reduces road capacity, causing delays in the evacuation progress ( 20 , 21 ). Therefore, it is necessary to analyze the impact of on-street parking in areas with different attributes to provide policy makers with a qualitative and quantitative analysis of whether to prohibit on-street parking on days with an increased risk of fire breaking out (i.e., red flag days).
For a set of strategy variables, a base case value was chosen for comparison. Details of each strategy are given in Table 1.
Descriptions of Scenarios
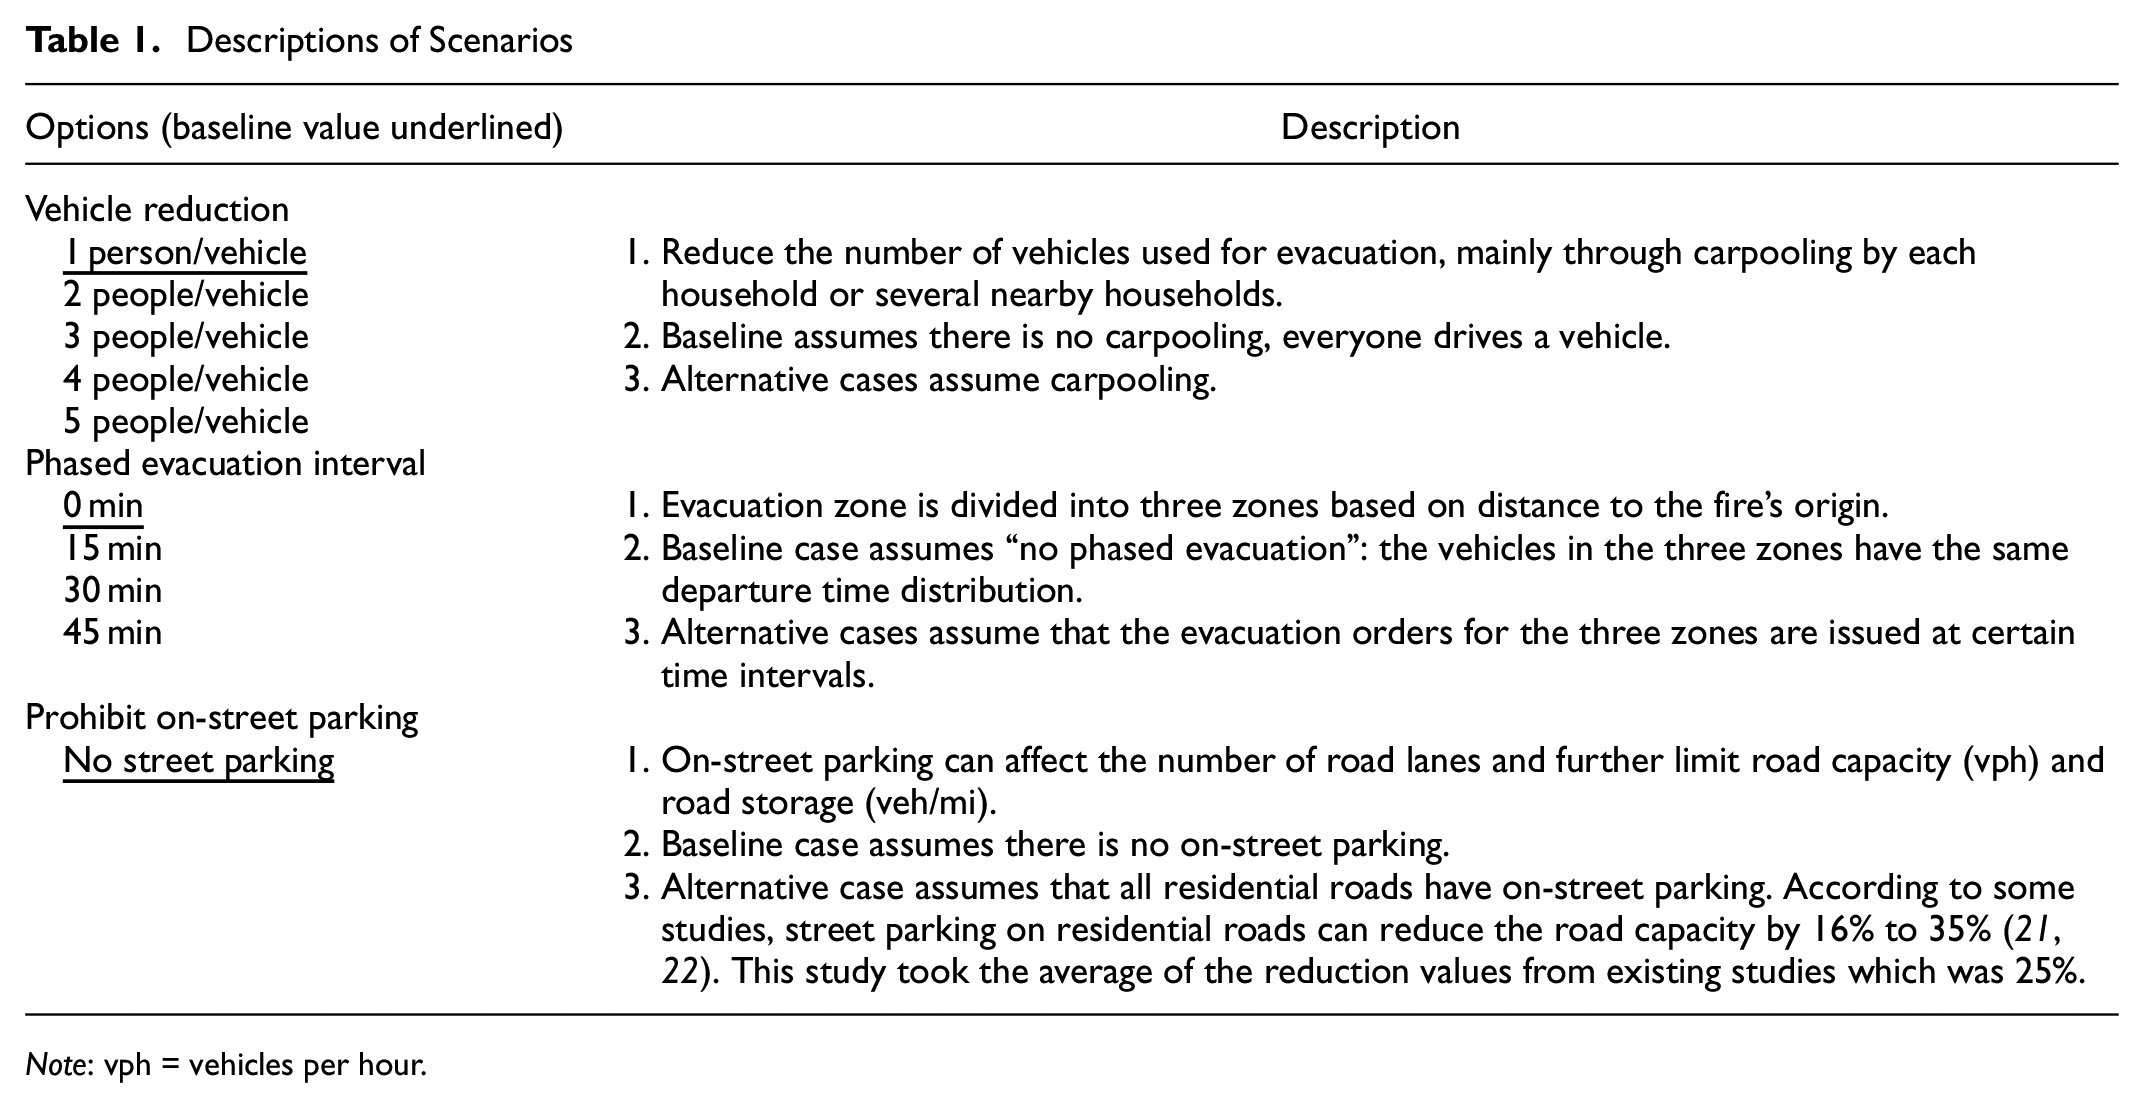
Note: vph = vehicles per hour.
Evaluation of Evacuation Strategies
In this study, one of the most widely used performance indicators was employed to evaluate the outcomes under different evacuation strategies: average travel time. This metric represents the average time spent in the evacuation process, from leaving the origin to reaching a point at least 2 mi away from the fire area. It was assumed that destinations that were 2 mi away put individuals at a safer distance from the danger. Figure 3 presents an example of how to calculate travel time. The fire ignites at 9 a.m., and one vehicle starts to evacuate at 9:10 a.m. and takes 40 min to leave 2 mi away from the fire area. Therefore, for this vehicle, the travel time is 40 min.
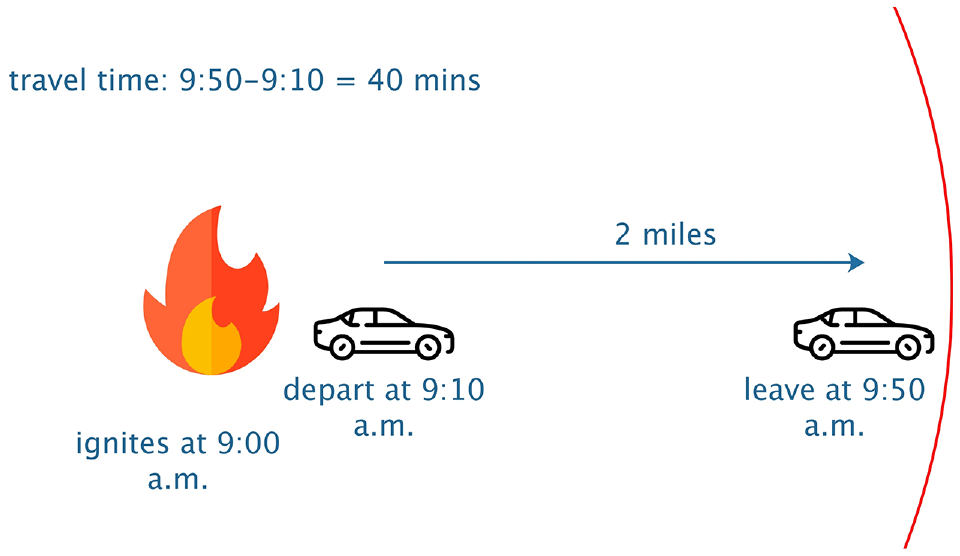
Illustration of how to calculate travel time.
Division Criteria for Communities
There is no research on the criteria for dividing communities into high and low RBEs and RCEs in the existing studies. In this study, a simplified network was devised with the purpose of delineating the thresholds separating communities by high and low RBEs and RCEs. In general, actual community road networks mainly consist of the three types shown in Figure 4. Type I has one main exit and one main road. Type II has several exits and one main evacuation road. This kind of network can be transformed into a Type I network because the two indicators describing the community characteristics, RBE and RCE, are concerned only about the number of vehicles in the background traffic and the capacity of the main road (see Figure 5). Even if there are several exits, evacuees will eventually enter the main road, therefore, Type II can be converted into a Type I network. Type III provides several exits and main roads for its community (Figure 6). This can also be transformed into a Type I network. For example, if there are two main roads surrounding this community, it can be divided into two halves. Evacuations from this community will therefore be like evacuations from two separate communities: one belonging to Type I, the other to Type II. As stated, the Type II can also be transformed into a Type I network. Therefore, we only need to build a Type I network to generate some general rules for all the communities.
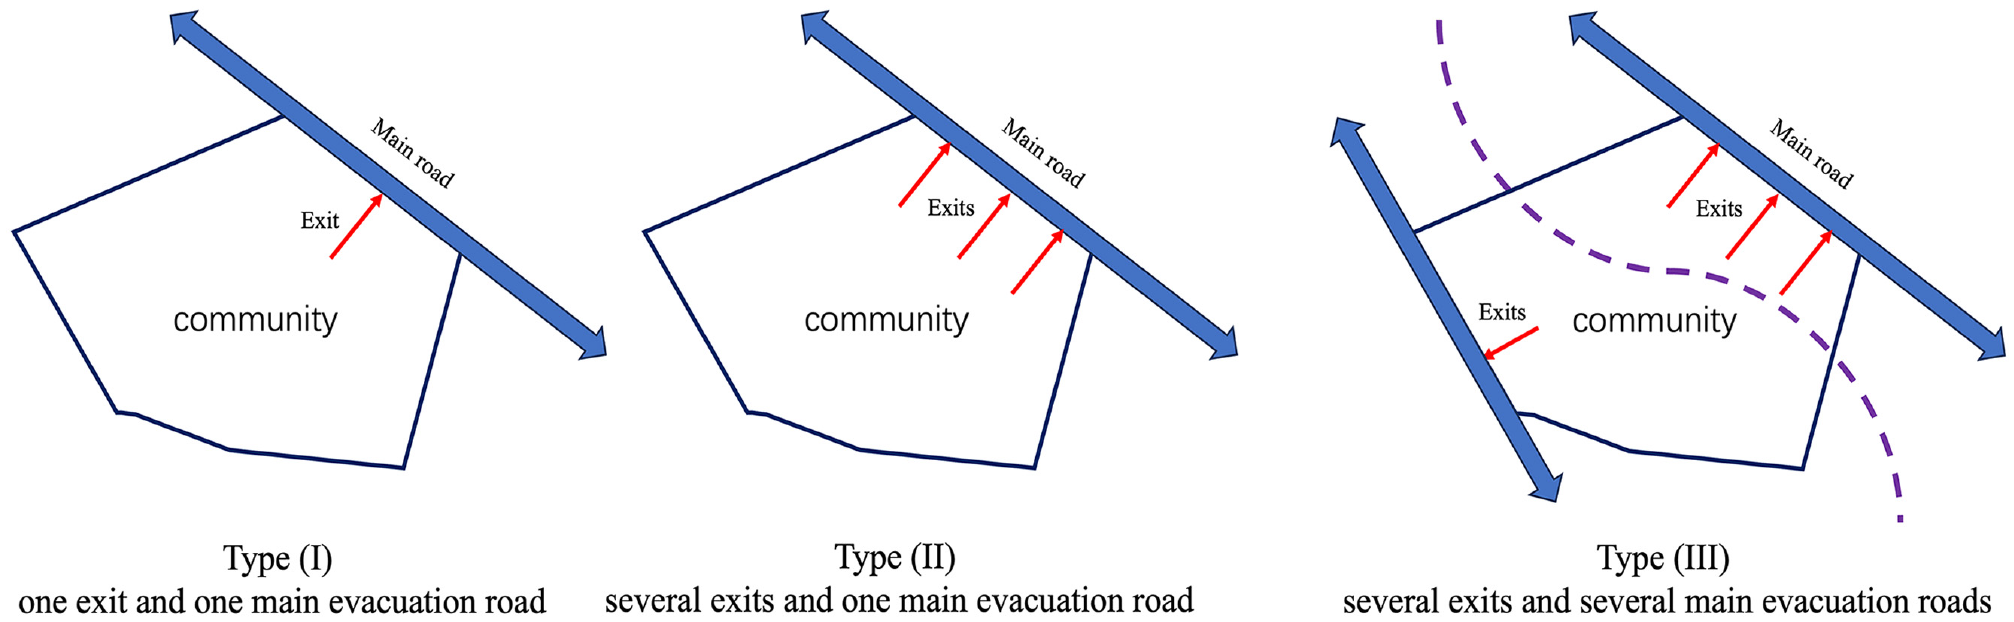
Three types of community road network.
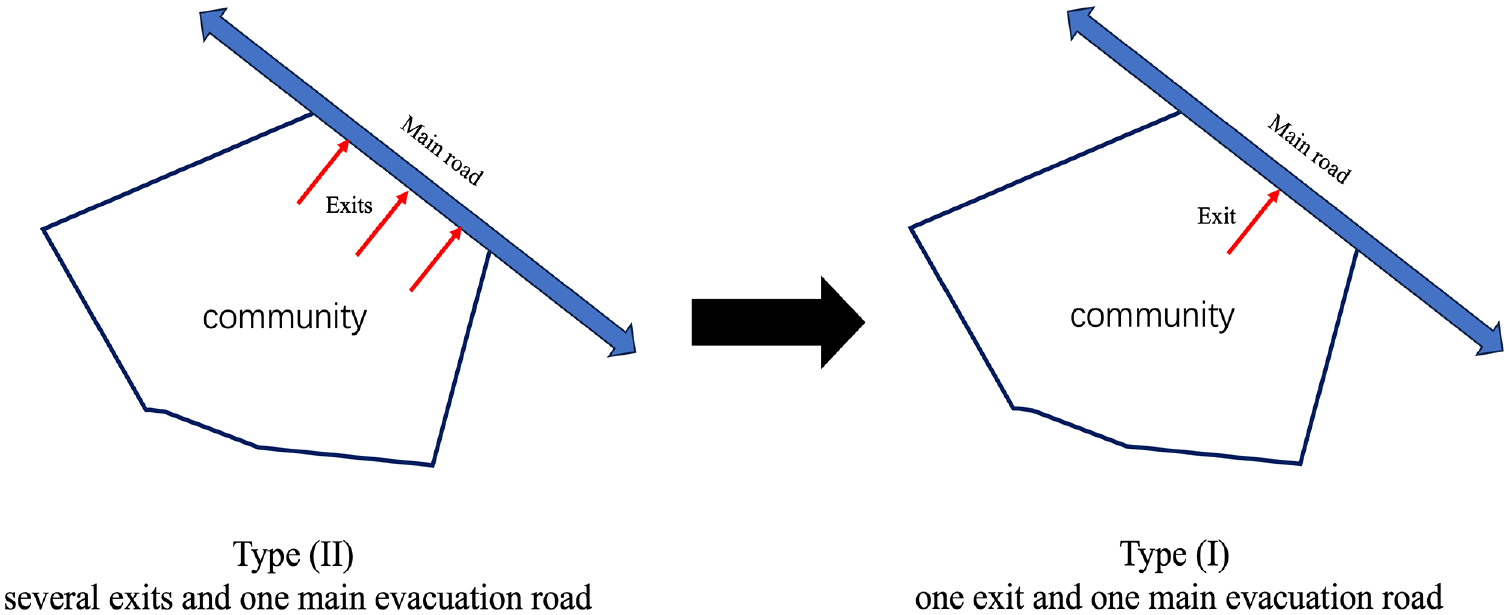
Type II can be transformed into a Type I network.
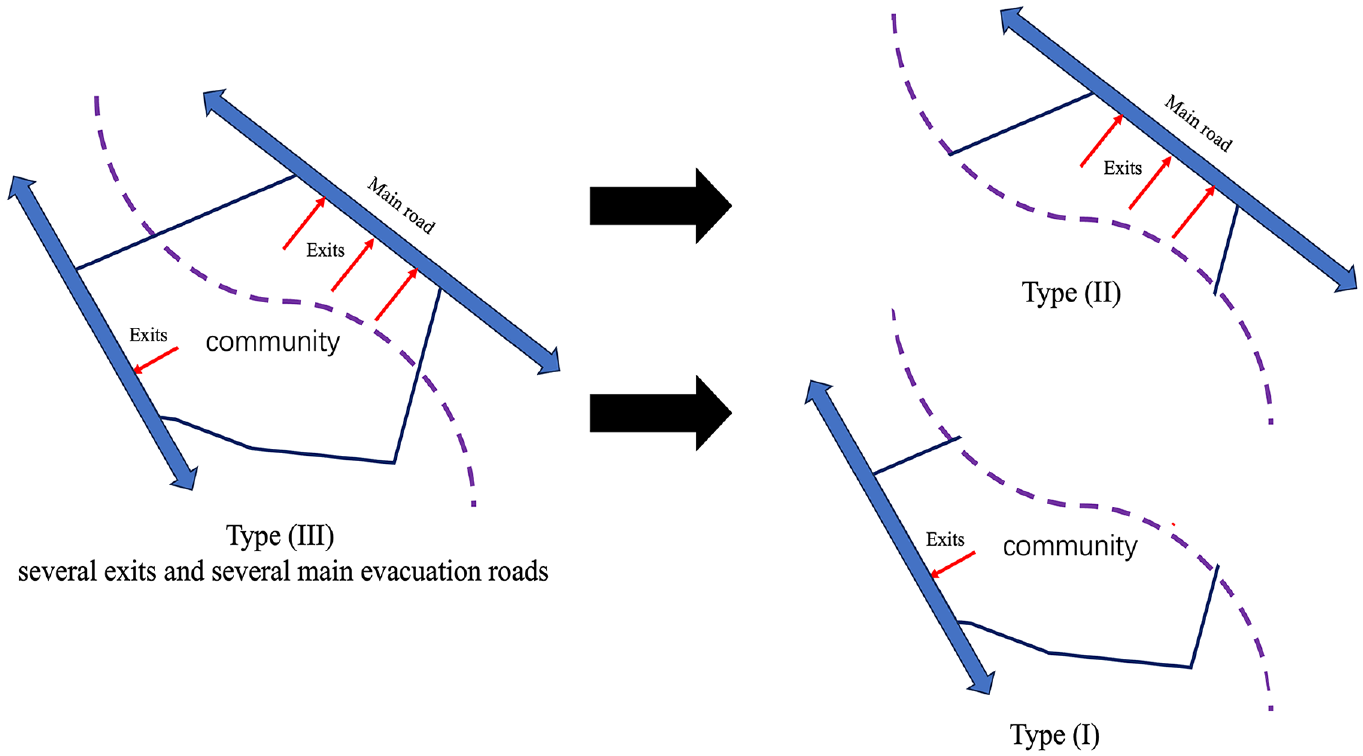
Type III can be transformed into Type I and II networks.
The simplified network shown in Figure 7 was used for establishing the preliminary values for the RBE and RCE thresholds. There were 10 nodes and 16 links. The length and capacity of each link were set to 10 m and 2,000 vehicles per hour (vph), respectively. The number of evacuees was set to 1,000, and all evacuees evacuated from Nodes 1 to 10. The departure time of each evacuee was sampled based on a truncated normal distribution with a mean of 20 min and a standard deviation of 20 min. The initial number of background vehicles was set to 1,500 (750 traveled from Node 10 to Node 3, and 750 traveled from Node 3 to Node 10); the departure time of each background vehicle was sampled based on a uniform distribution with a range of 0 to 180 min.
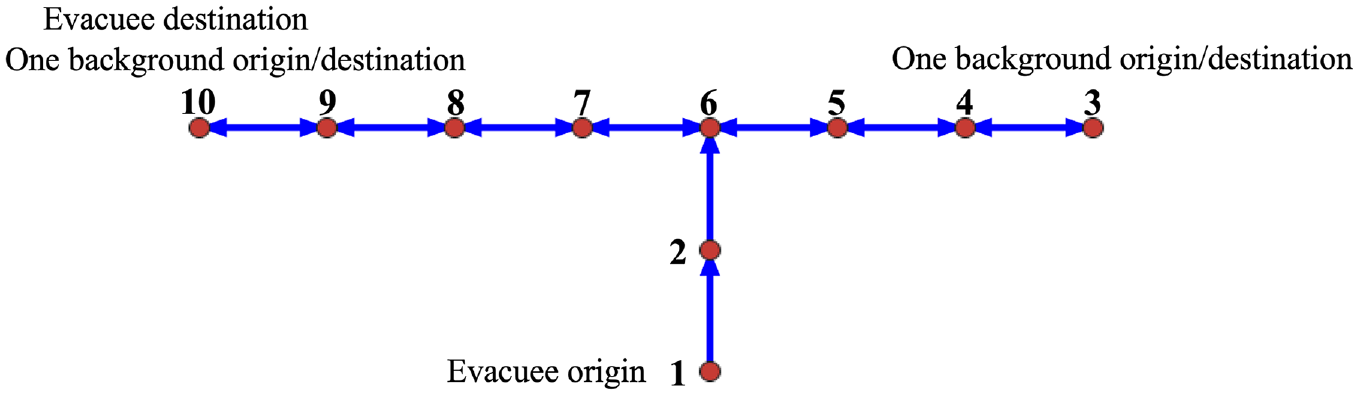
Simplified network.
Two experiments were conducted to analyze the RBE and RCE thresholds. The first experiment involved increasing the number of background vehicles from 500 to 3,000, at an increment of 500 in each step. This corresponded to the RBE increasing from 0.5 to 3.0, at an increment of 0.5. The second experiment involved increasing the capacity of Links 2 → 6 from 1,000 to 2,000 vph, at an increment of 100 vph in each step. This corresponded to the RCE increasing from 1.0 to 2.0. The output was the average travel time of the evacuees. Each experiment was conducted 10 times and the results are given in Figures 8 and 9. Figure 8 shows that when the RBE increased to around 1.5, an inflection point appeared on the curve, and after that, the average travel time continued to have an approximately linear relationship with the RBE. However, the slope of the curve corresponding to RBEs over 1.5 was larger than that of the curve corresponding to RBEs below 1.5. This indicated that if the RBE increased to over 1.5, the impact of the background traffic on the evacuation was larger. Therefore, RBE = 1.5 was assumed as the threshold that separated communities of high and low RBEs. Figure 9 shows that when the RCE increased to around 1.7 the curve became flatter. This implied that when the ratio of the capacity to the number of evacuees increases to a certain level, traffic will flow more smoothly. Therefore, RCE = 1.7 was assumed as the threshold that separated communities of high and low RCEs.
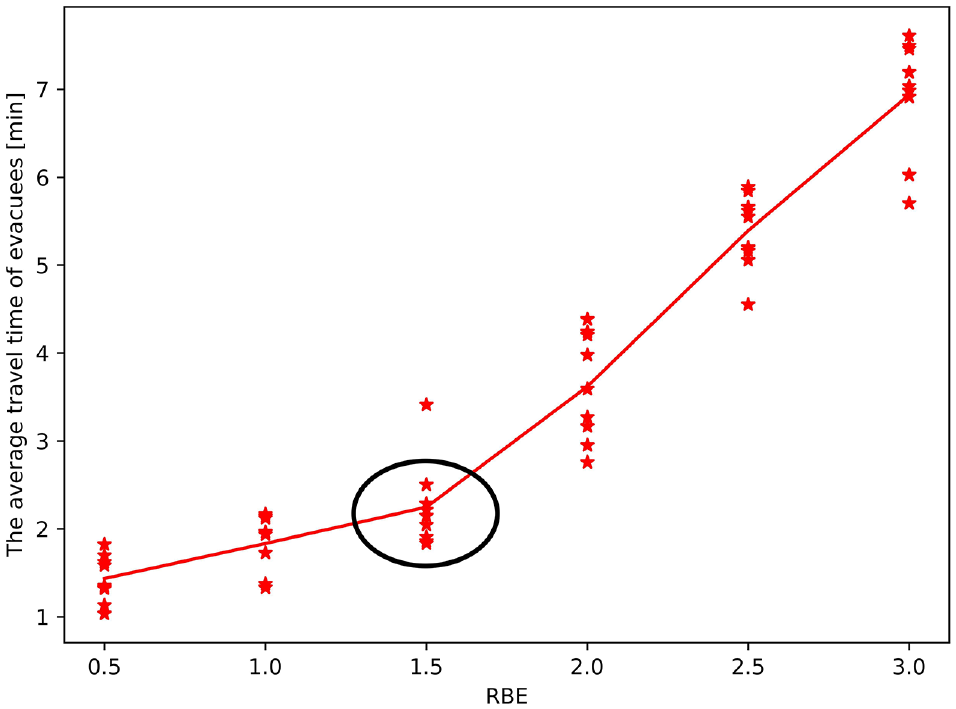
The average travel time of evacuees under different RBEs.
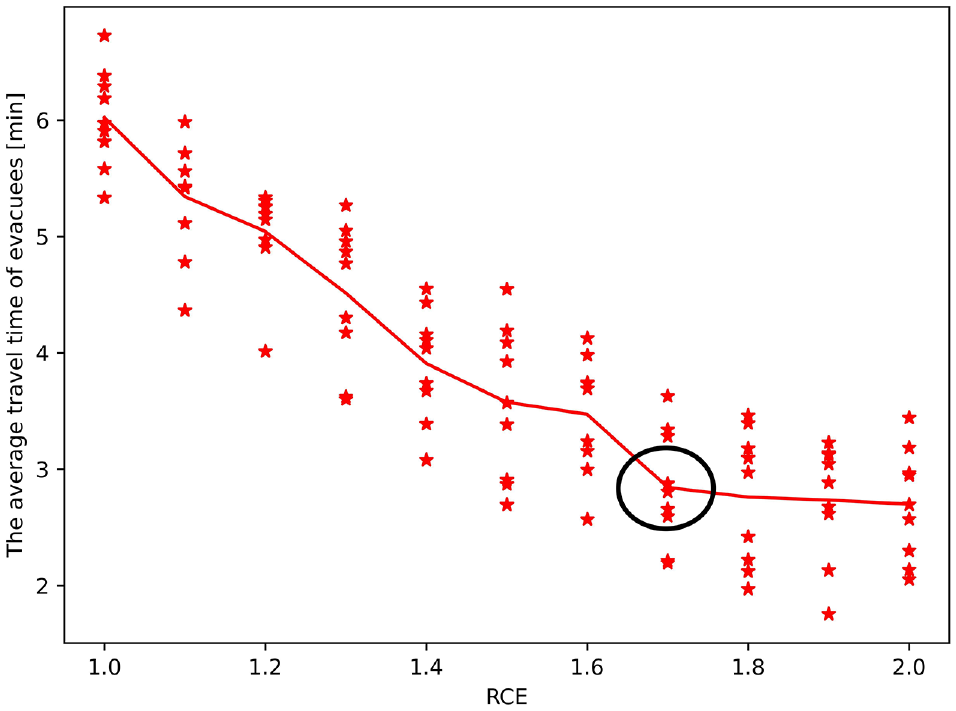
The average travel time of evacuees under different RCEs.
Case Studies
Tested Representative Communities
This study focused on the performance of various evacuation strategies for small communities in the WUI areas of Marin County, CA. The selected communities were Ross Valley, Woodacre Bowl, Tamalpais Valley, and an area near Highway 101 and Ignacio Boulevard in Novato (hereafter referred to as “Novato Neighborhood”). These four communities have different RBEs and RCEs, which will be detailed later in this section. The locations and boundaries of these four communities are presented in Figure 10.
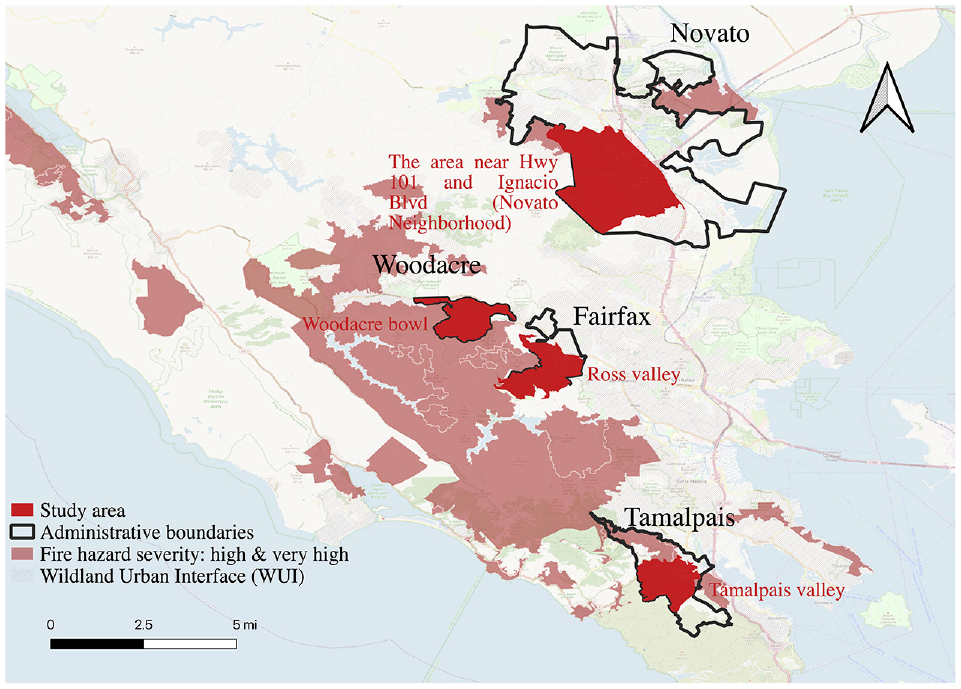
Locations and boundaries of the selected communities.
Road Network and Potential Wildfire Ignition Areas
Because background traffic can run through the entirety of Marin County, the road network used in the simulation model included not only the four study communities but the whole county. The road network for the study area was obtained from OSMnx, a python package (https://osmnx.readthedocs.io/); a directed node-and-link-based road network for Marin County was then obtained, as shown in Figure 11. Nodes and links are commonly used structures to represent a network: a node represents one road intersection, whereas a link represents the stretch of road between two intersections. The final Marin County-wide road network consisted of 40,209 links and 17,857 nodes. Figure 11 also shows the four potential wildfire ignition points around the four test communities, chosen to be within a 2-mi radius from selected community boundaries over “fuels” such as grass or low vegetation.
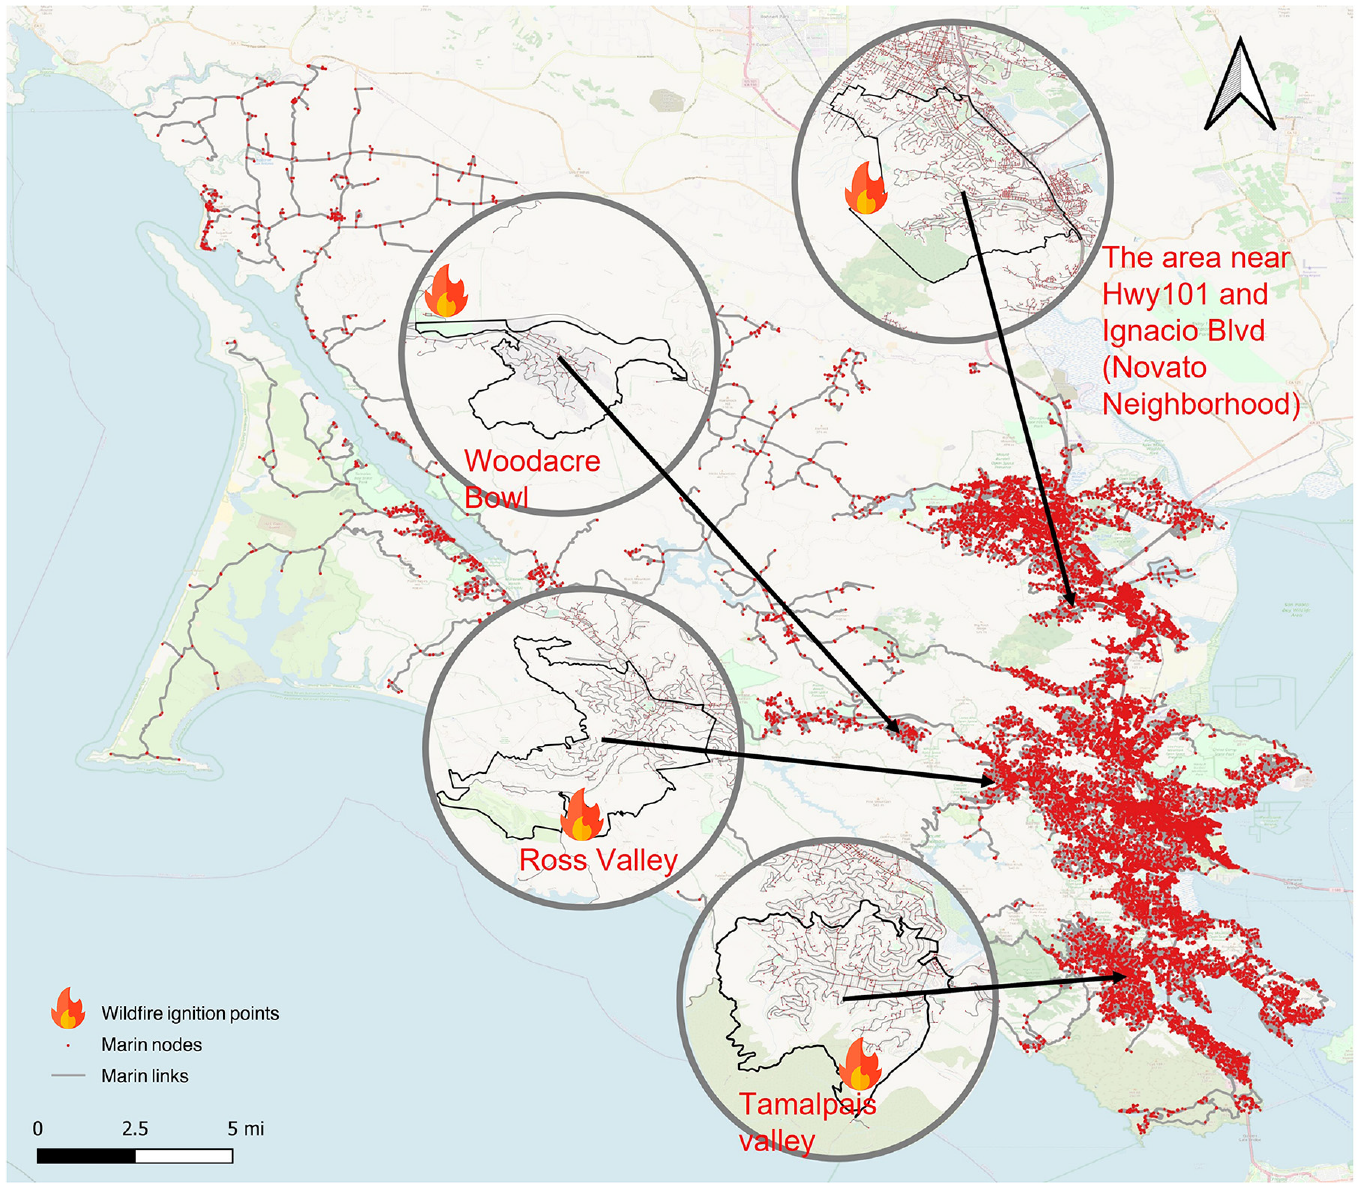
Road network of Marin County and the potential wildfire ignition points.
Background Traffic
The background traffic origin–destination (O-D) demand data from the Metropolitan Transportation Committee (MTC; http://mtcdrive.app.box.com/v/pba50-2015-TM152-IPA-17) uses an activity-based travel model to simulate the travel-related choices of Bay Area residents. The activity-based model used inputs from the MTC 2015 Bay Area Travel Survey, which included 2-day travel diaries from over 15,000 households. In the model, tour was the unit of analysis: a tour represents a closed or half-closed chain of trips starting and ending at home or the workplace. A tour further includes at least one destination and at least two successive trips. The model generated both tour and trip lists for each resident. The individual and joint trips were later aggregated into O-D matrices.
MTC traffic O-D data cover trips for the whole Bay Area, however, our focus was limited to Marin County, therefore, trips that did not pass through the county were filtered out. For the remaining trips, only the trip segments undertaken within the county were retained to reduce subsequent computing time. The process is illustrated in Figure 12: where the initial O-D is outside Marin County and the corresponding adjusted O-D is within the county, the initial O-D is adjusted to the point where the boundary of Marin County intersects with the route from the origin to the destination (Figure 12, a and b ). In Figure 12c, where both the initial origin and destination are outside Marin County, these origins and destinations are adjusted to the boundary points.
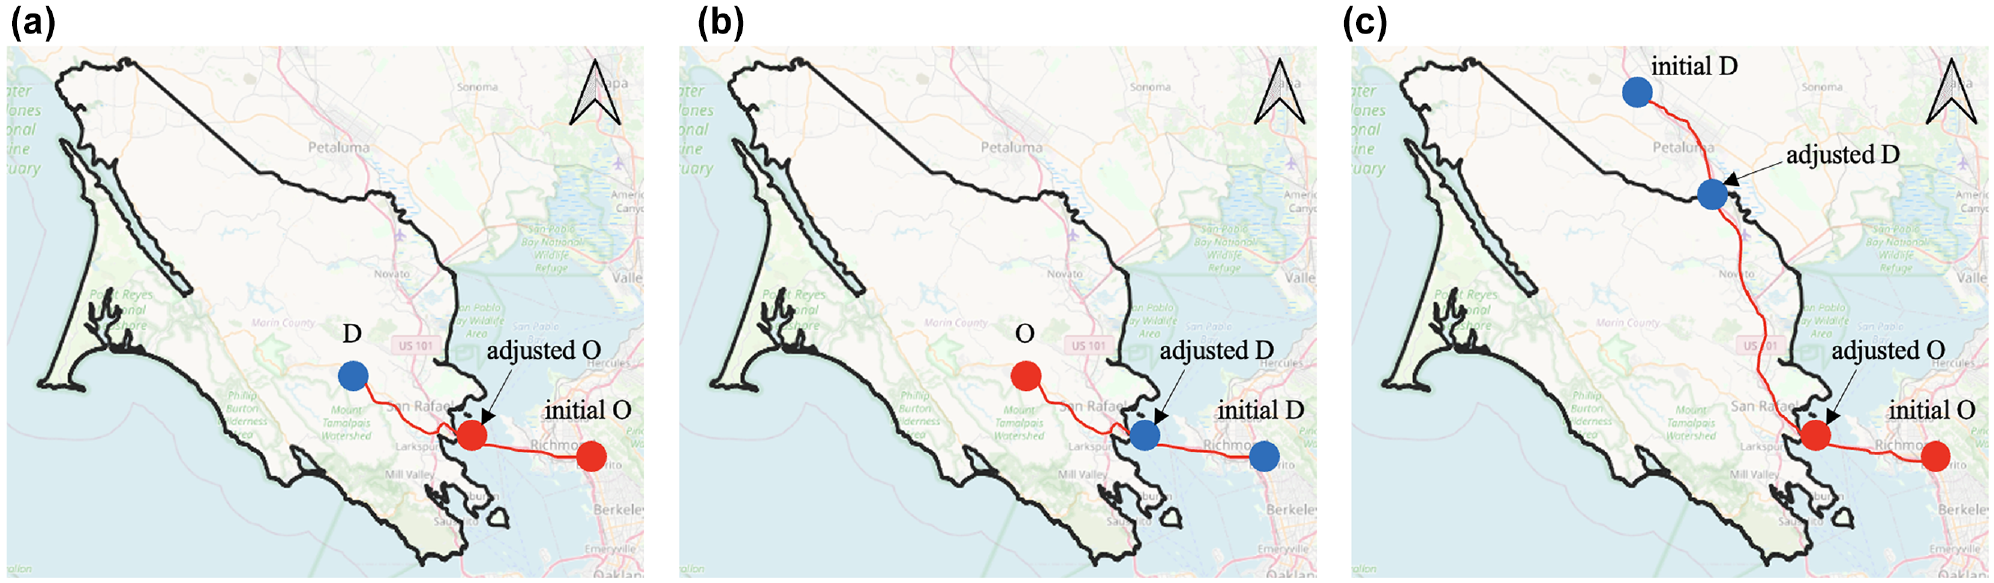
Changes in origin (O) and destination (D) that are outside Marin County to its border: (a) O is outside, (b) D is outside, and (c) O and D are outside.
After preprocessing, the number of background O-D trips during one modeled day was 823,916. After running the simulation with background O-Ds as inputs, the background traffic around the four tested sites was obtained (see Figure 13). The volume of background traffic was observed to reach its maximum during peak hours, which was double the volume during off-peak hours. For the number of residents in these four cases, the volume of background traffic was also found to be relatively large all day, therefore, were a wildfire to break out, the background vehicles would have a significant impact on the surrounding evacuating vehicles. When calculating RBE, the volume of background traffic 3 h after the evacuation was counted. This approach was taken because the duration of the evacuation might be very long under certain strategies (e.g., phased evacuation), therefore, background traffic could have a lasting effect on an evacuation.
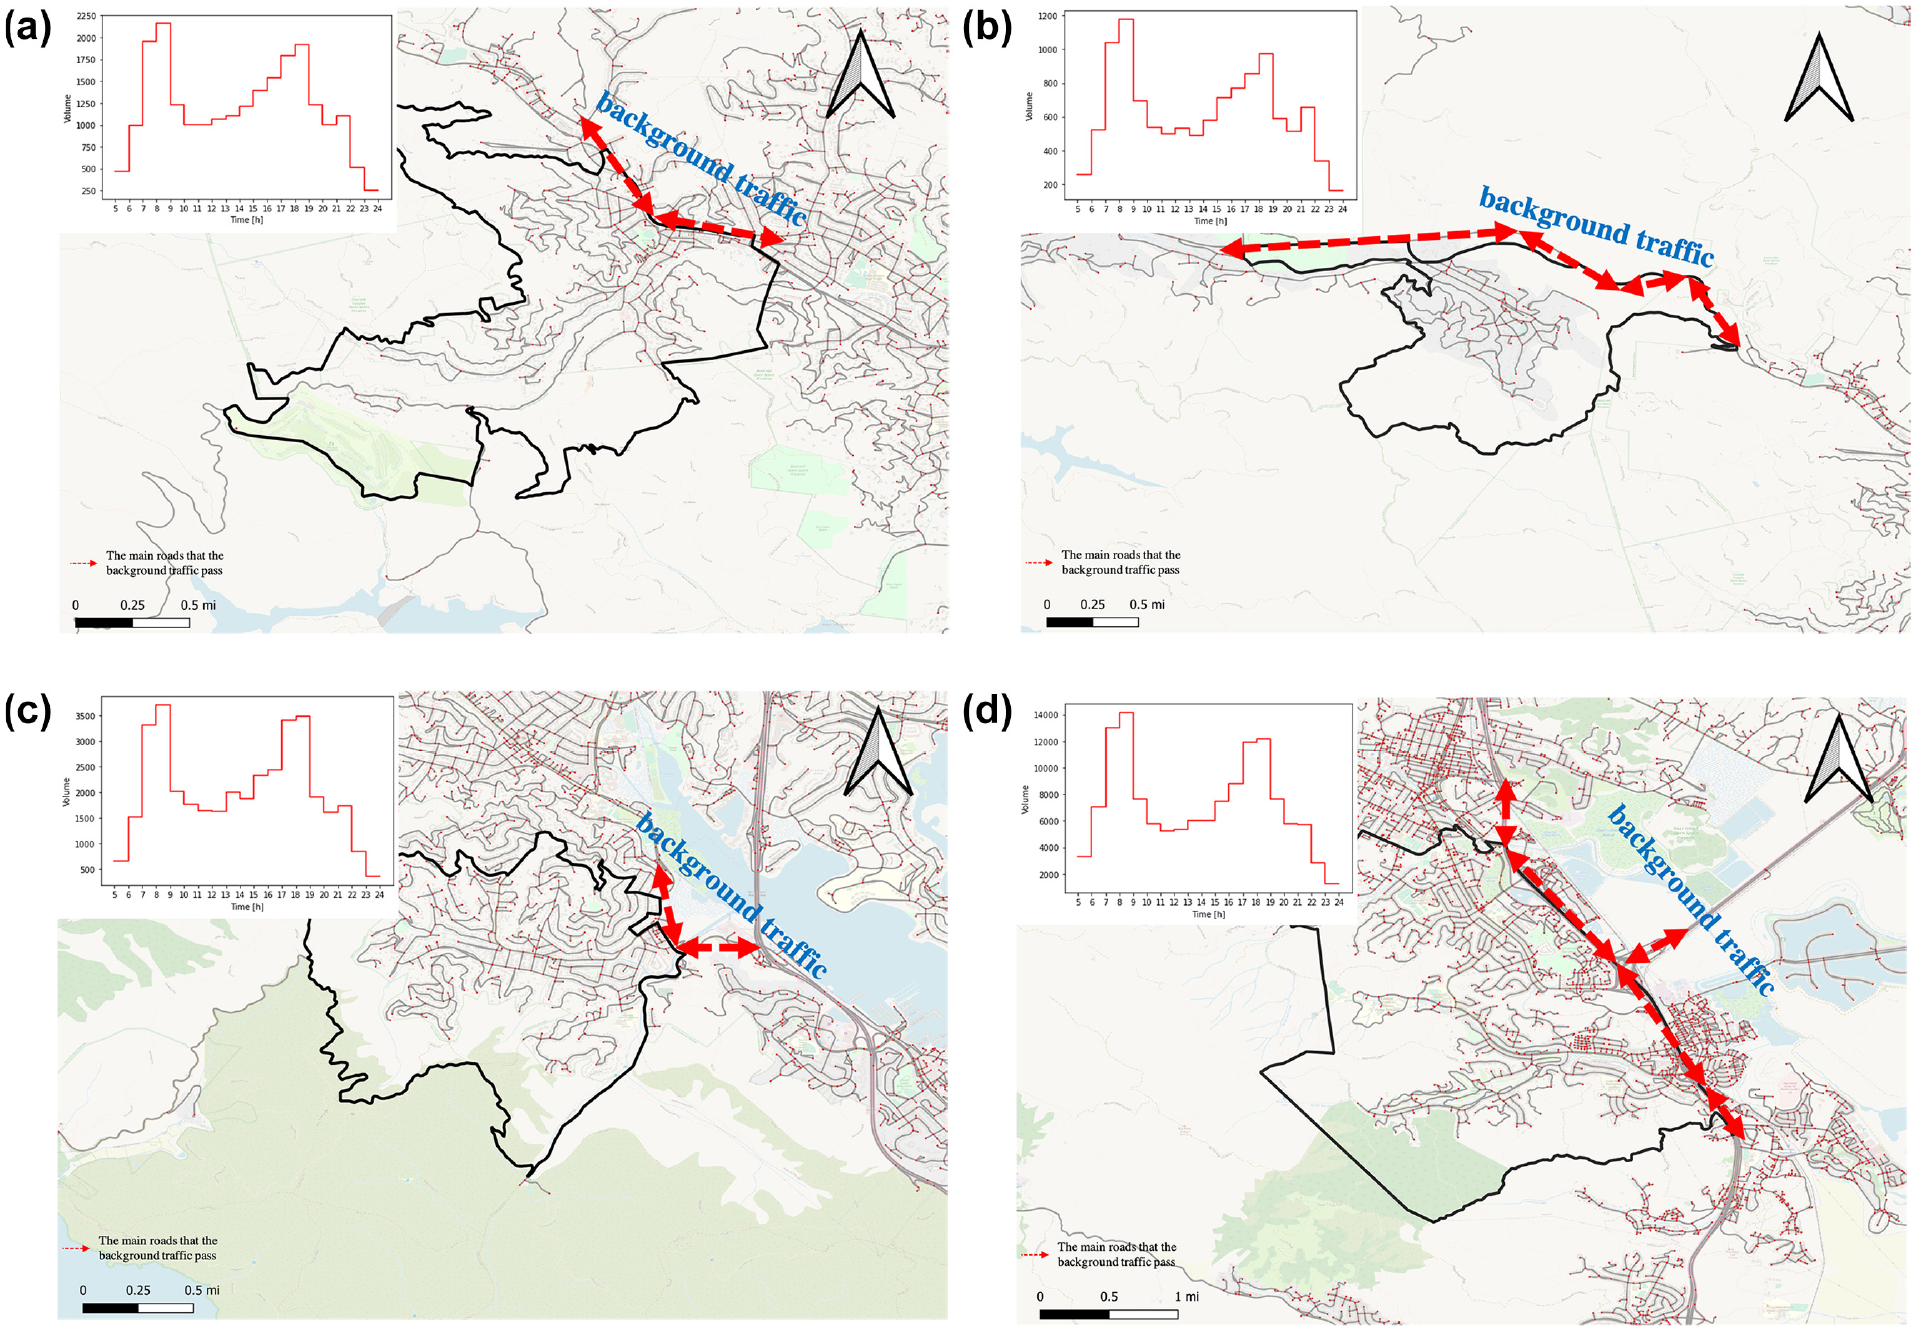
Background traffic around the four tested communities: (a) Ross Valley, (b) Woodacre Bowl, (c) Tamalpais Valley, and (d) Novato Neighborhood.
Evacuee O-D Demand
From the background O-D data, the location where each person began their day was known and this was regarded as their residence. Using the background O-D data, it was possible to determine how many residents were at home when the fire ignited, and these residents were classified as evacuees. The origin of these evacuees was their home. The evacuation destinations of these evacuees were set as the border of Marin County and other counties in the vicinity, as shown in Figure 14. Several evacuation destinations were available for evacuees to choose from. In this study, it was assumed that the evacuees from Tamalpais Valley would choose the bottom destination (Golden Gate Bridge) and the middle destination (Richmond-San Rafael Bridge); evacuees from Ross Valley and Woodacre Bowl were assumed to choose the middle destination (Richmond-San Rafael Bridge); and those from Novato Neighborhood were assumed to choose the top two destinations (Redwood Highway and Sears Point Bridge) and the middle destination (Richmond-San Rafael Bridge). The treatment of destination choice was intentionally simplistic and did not therefore consider factors such as shelter availability, proximity to resources, or destination safety, all of which could influence an evacuee’s decision. This study therefore focused mainly on the most dangerous part of the trip, that is, the time required to get 2 mi away from the extent of the fire. The time taken to reach the destination is not reported, as this provides relatively little information on the evacuees’ risk in relation to the proximity of the fire.
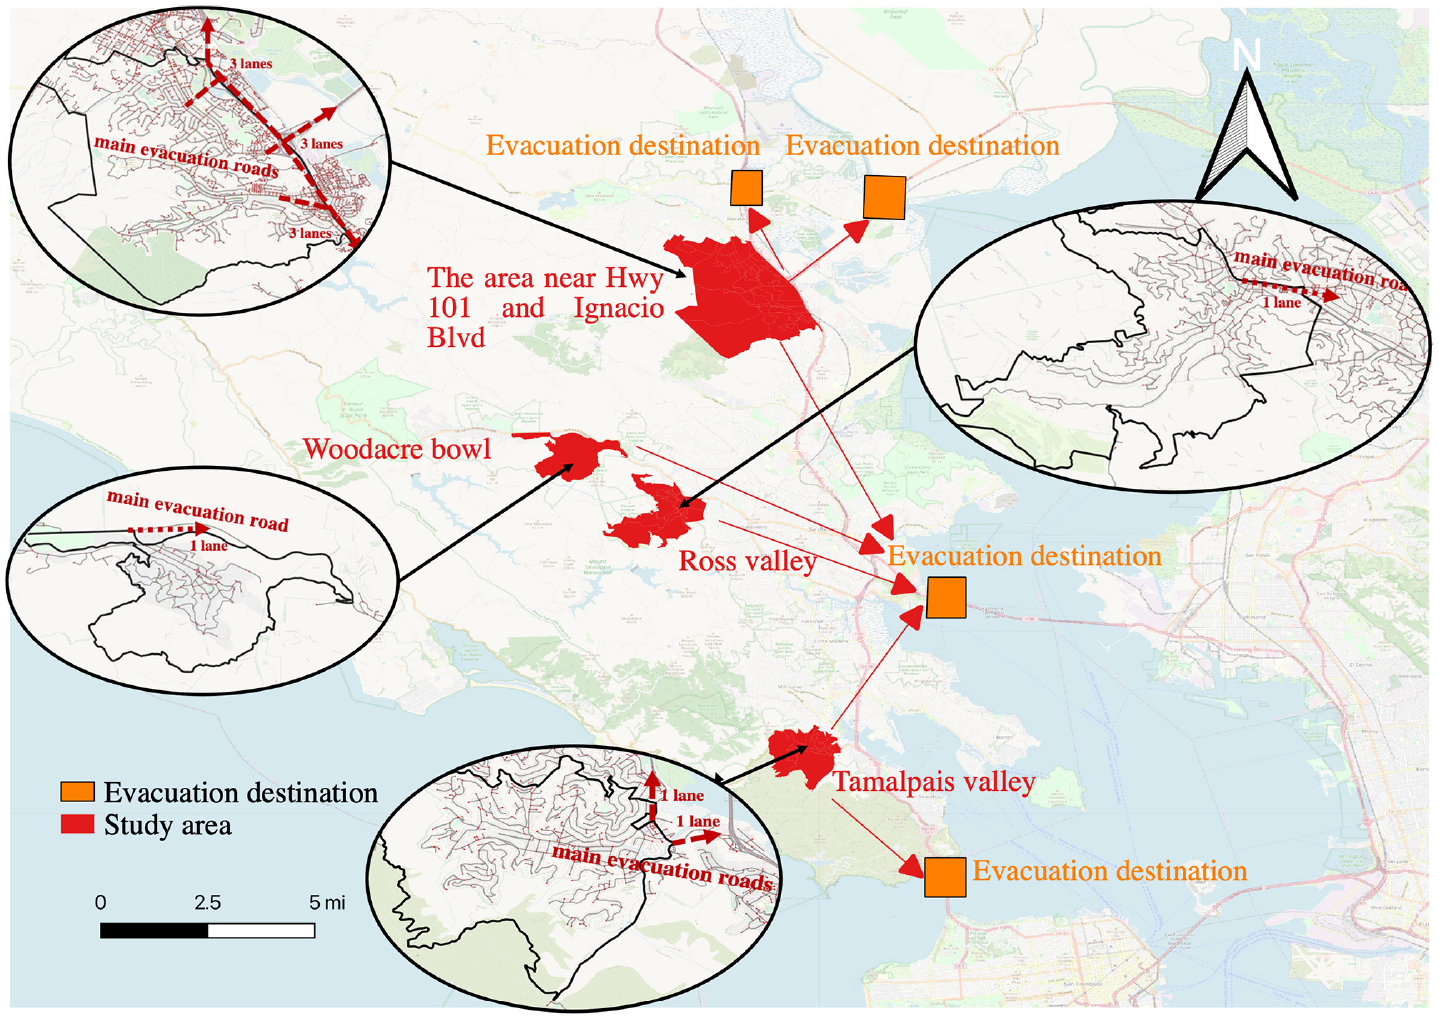
Evacuation destinations and main evacuation roads for each community.
Fire ignition time was set to 9 a.m., that is, residents would begin to evacuate right after 9 a.m. The reason for selecting this fire ignition time rather than a peak hour (e.g., 7 or 8 a.m.) was to retain the focus on analyzing the performance of different strategies in areas with different RBEs and RCEs. Table 2 provides a summary of the number of evacuees and RBEs and RCEs for each community. From Table 2, it can be seen that had the evacuation time been set to peak hours, the RCEs for the four communities would have been equally low (i.e., below 1.7, as established in the simplified network); this would not have offered enough scenarios or helped to categorize the evacuation scenarios based on RCE. However, with the evacuation time set to 9 a.m., these communities had different RCEs, which facilitated analyzing the performance of different strategies under a more diverse set of scenarios. However, it was noted that the RBE at 9 a.m. was comparable to that of peak hours for each community. Therefore, it was reasonable to set the fire ignition time to 9 a.m. in the simulation analysis to provide diverse, contrasting cases.
Summary of Number of Evacuees, RBE, and RCE for each Community
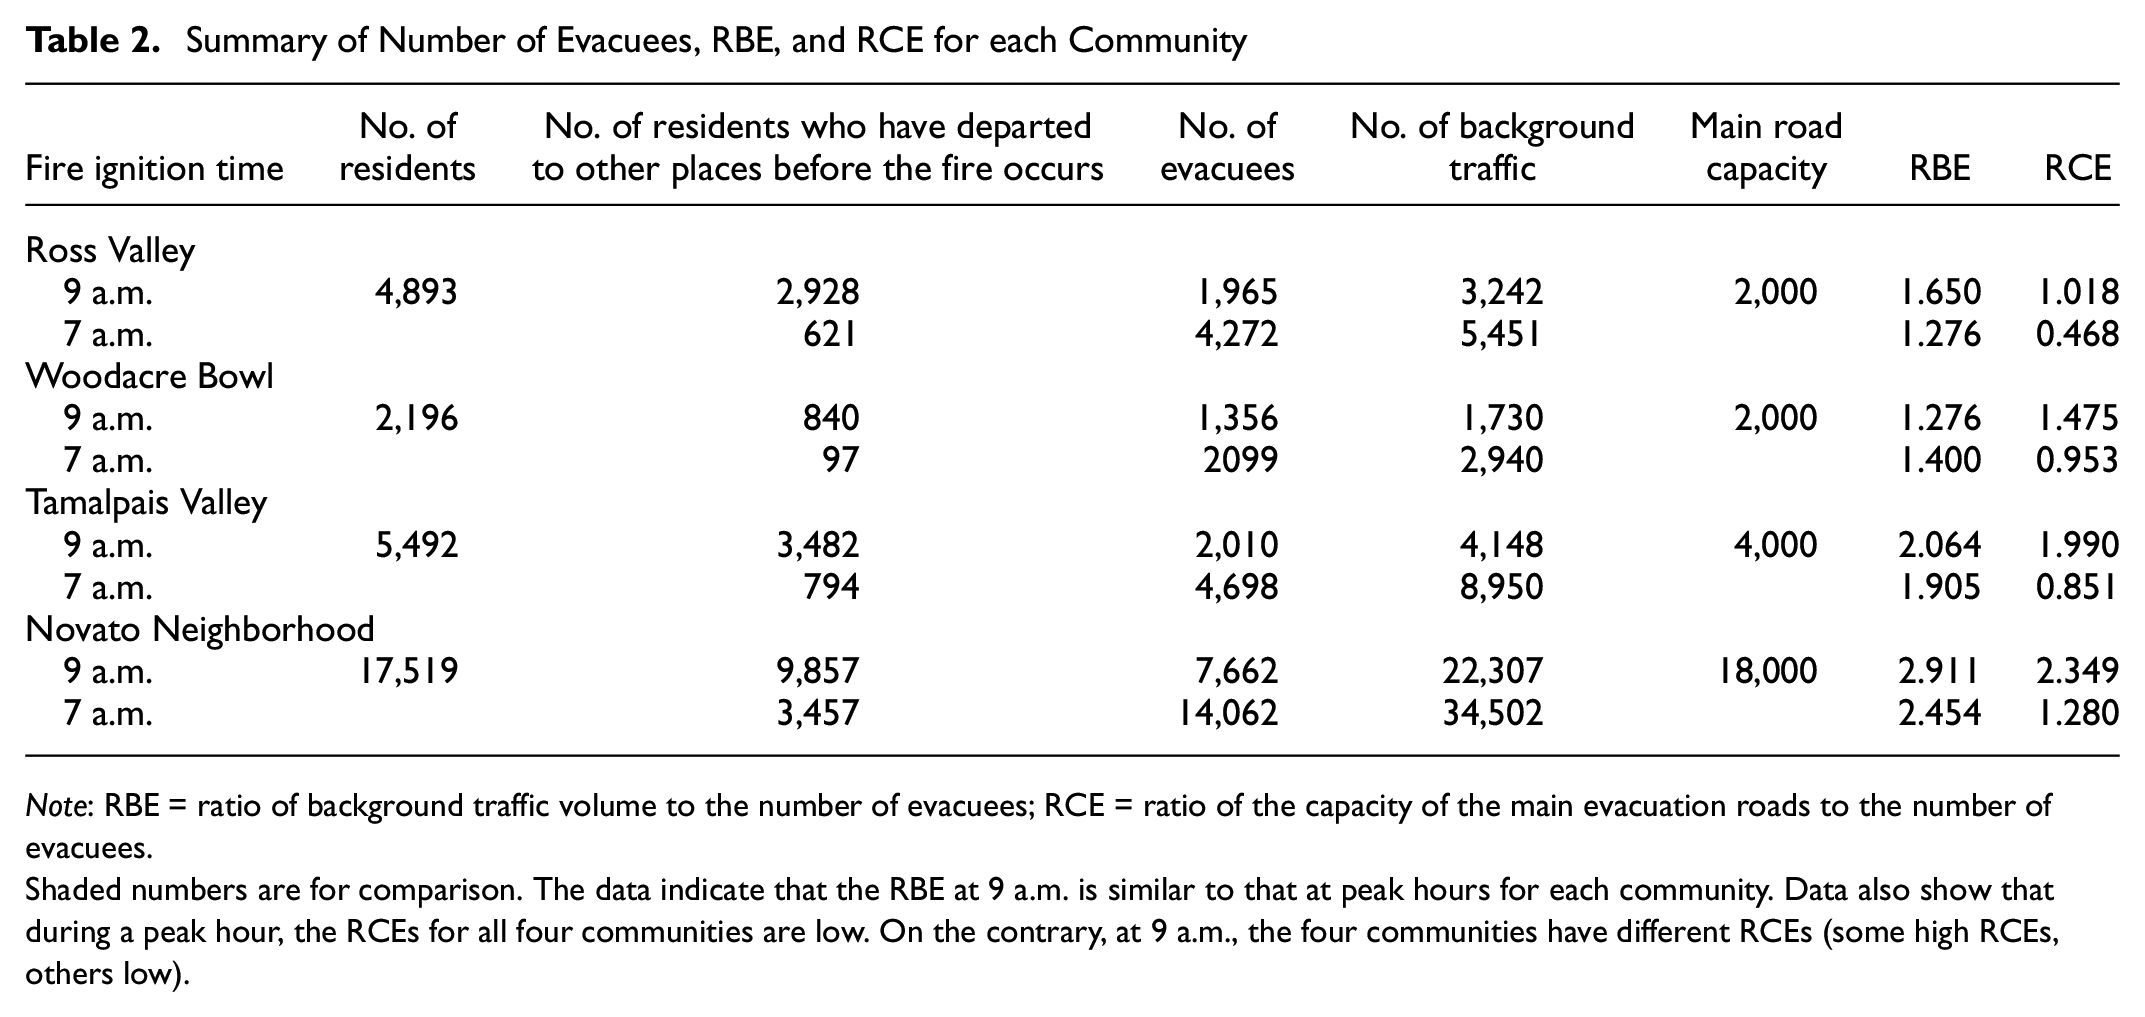
Note: RBE = ratio of background traffic volume to the number of evacuees; RCE = ratio of the capacity of the main evacuation roads to the number of evacuees.
Shaded numbers are for comparison. The data indicate that the RBE at 9 a.m. is similar to that at peak hours for each community. Data also show that during a peak hour, the RCEs for all four communities are low. On the contrary, at 9 a.m., the four communities have different RCEs (some high RCEs, others low).
An assumption was made about the departure times of evacuees using truncated normal distribution (i.e., truncated around the mean ± 1 standard deviation [SD]). The mean departure time and the SD were set to 9:10 a.m. and 10 min, respectively. For the phased evacuation strategy, the departure time of each phased zone differed. First, the four areas were divided into several small traffic analysis zones, provided by MTC. The details of the zones of Ross Valley, Woodacre Bowl, Tamalpais Valley, and Novato Neighborhood are illustrated in Figure 15, a to d . The zones in red are the closest zones to the fire ignition point and it was assumed that people in these zones were the first to leave. Those in orange and pink were respectively the second and third to leave. To test the efficiency of phased evacuation, cases of evacuees departing from different phased zones at 15-, 30-, and 45-min intervals were considered. For example, if the interval is 30 min, then the mean departure times of evacuees in the three zones would be 9:10, 9:40, and 10:10 a.m. SD was 10 min for all three zones.
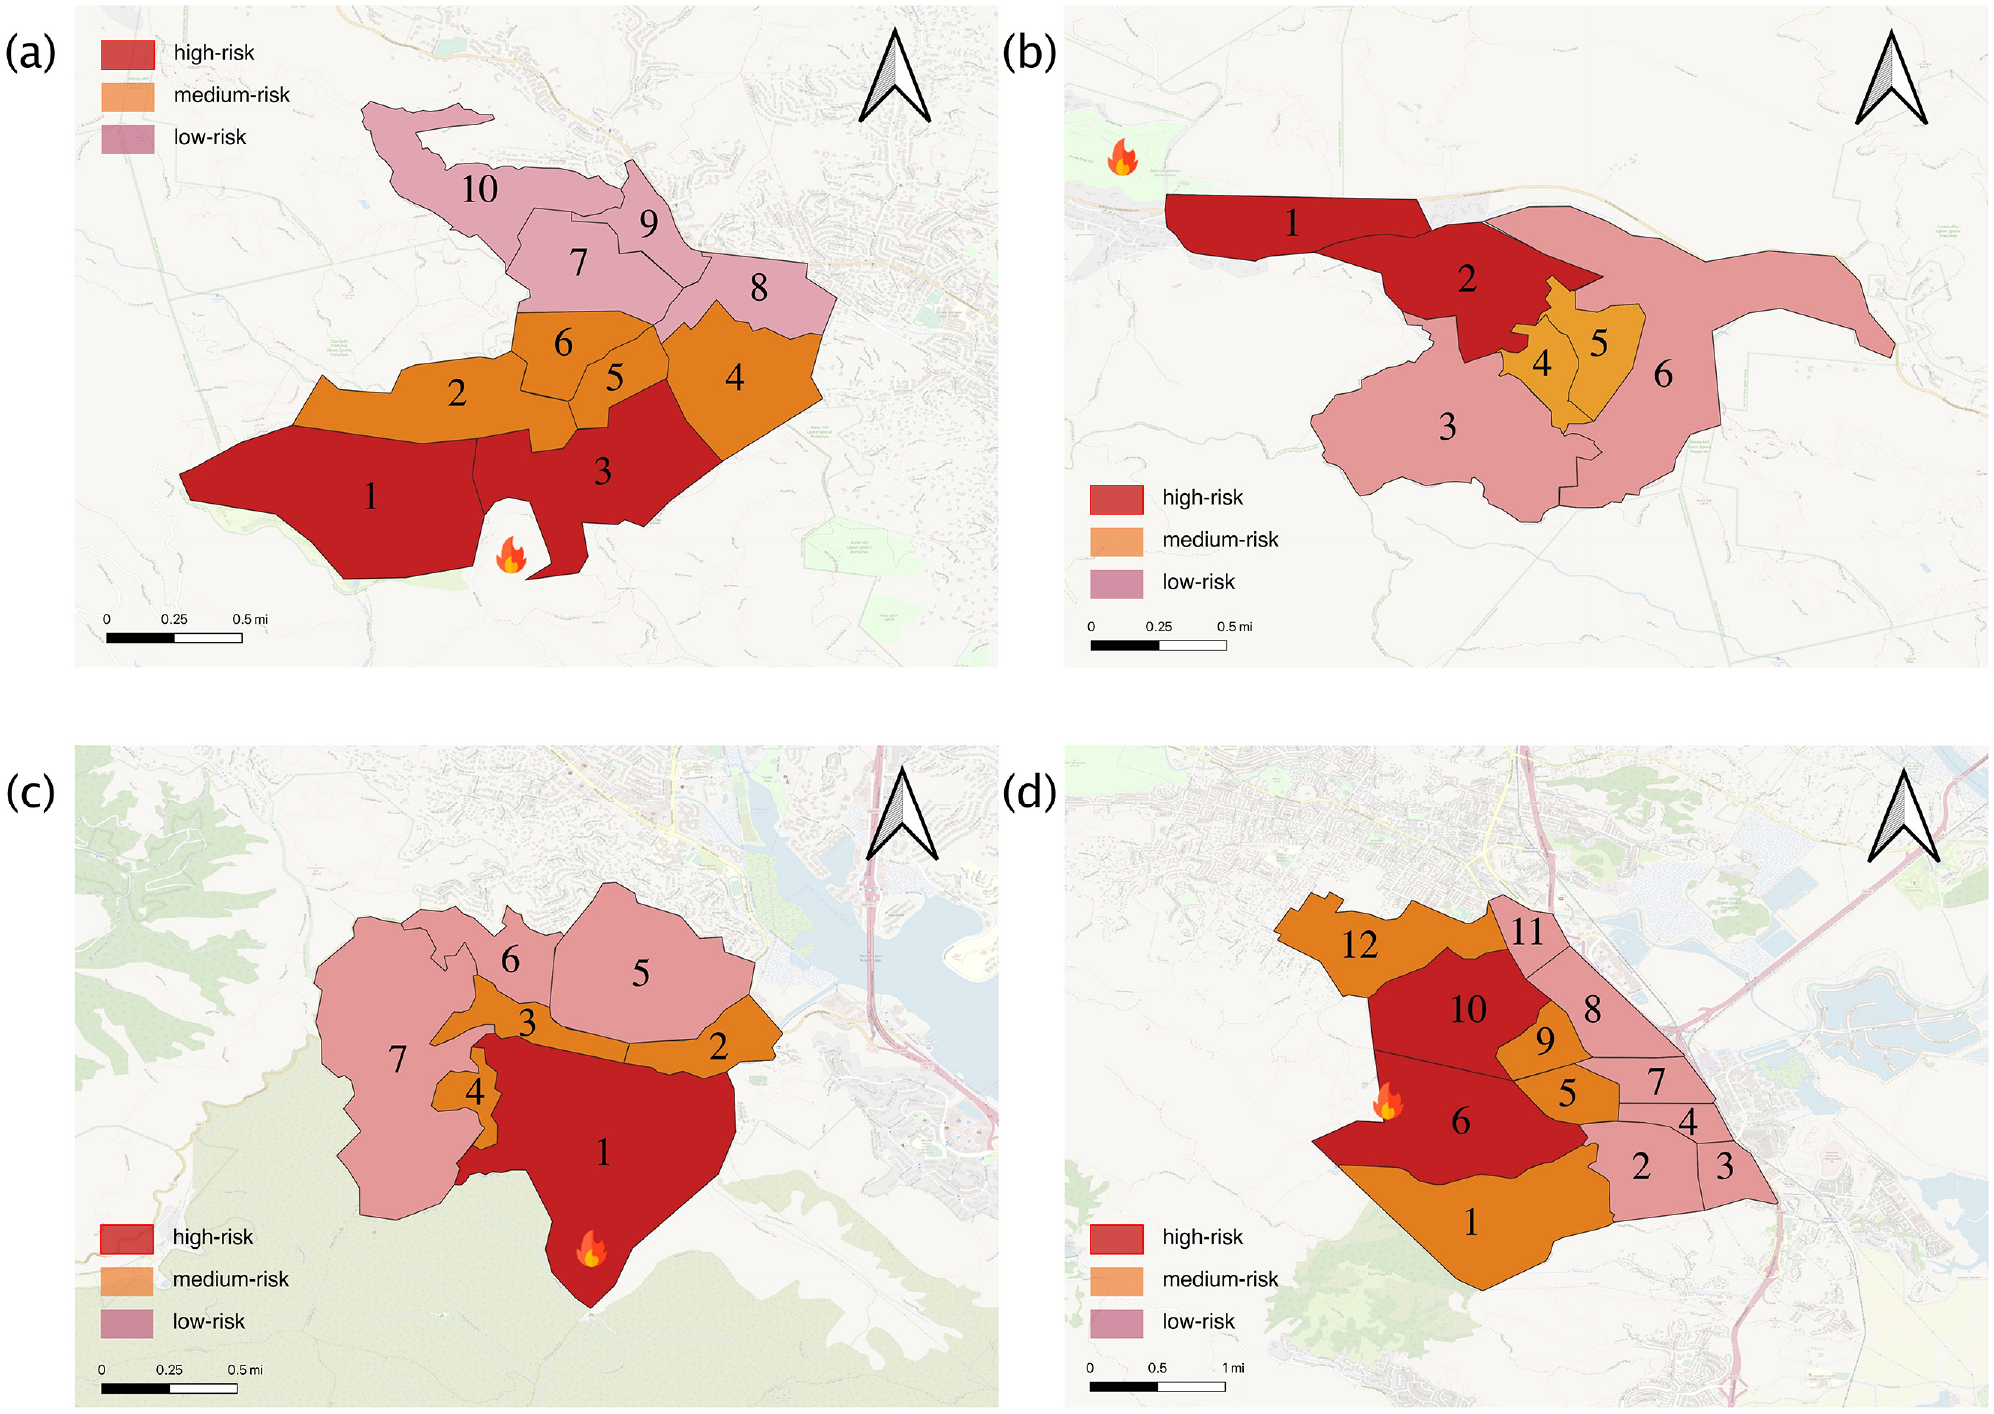
Zones of the four communities: (a) Ross Valley, (b) Woodacre Bowl, (c) Tamalpais Valley, and (d) Novato Neighborhood.
Division of the Tested Communities into Different Groups
The suggested thresholds for RBE and RCE were obtained based on the work presented in the section covering division criteria for communities. With these criteria, the four communities were divided into different groups in the 9 a.m. wildfire/evacuation event as shown in Figure 16. Woodacre Bowl had both a low RBE and low RCE; Ross Valley had a high RBE and a low RCE; and both Tamalpais Valley and Novato Neighborhood had a high RBE and low RCE. Higher RBE and lower RCE indicate more congestion for evacuues, while lower RBE and higher RCE indicate less congestion.
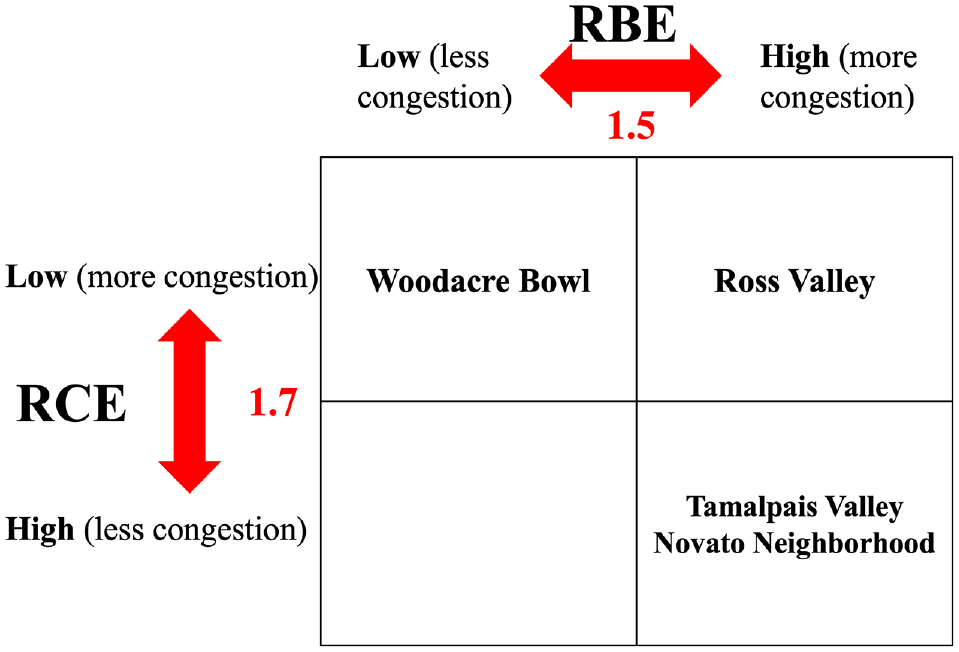
Categorizing communities into their respective groups.
Results and Discussion
The main focus of this study was to understand the applicability of commonly used evacuation strategies in communities with different RBE and RCE values. These strategies, including vehicle reduction, phased evacuation, and prohibition of on-street parking, are identified in Table 2. Through controlled experiments, evacuations under the strategy options were simulated and the results were compared against the baseline (baseline parameter values were set to those presented as underlined values in Table 2). The results are shown in Figures 17 to 19.
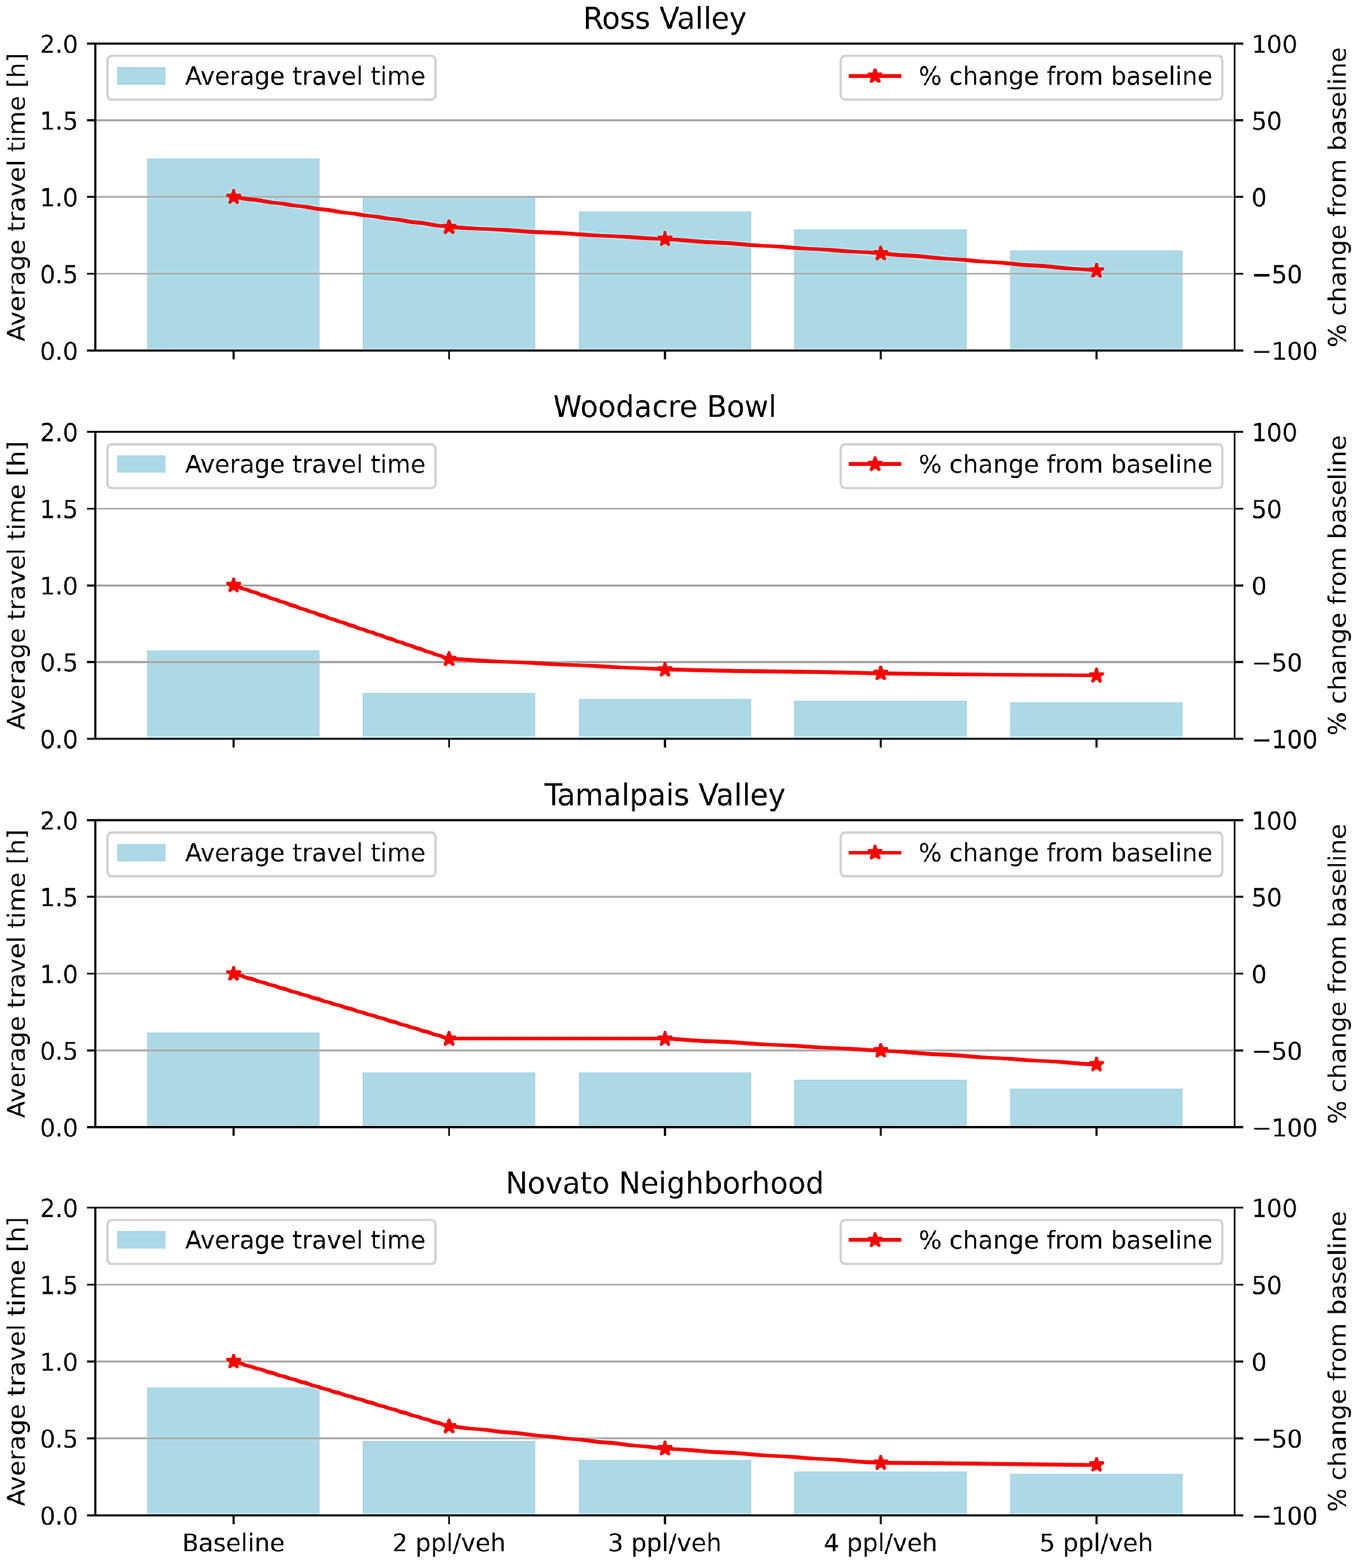
Results of the impact of vehicle reduction on different communities.
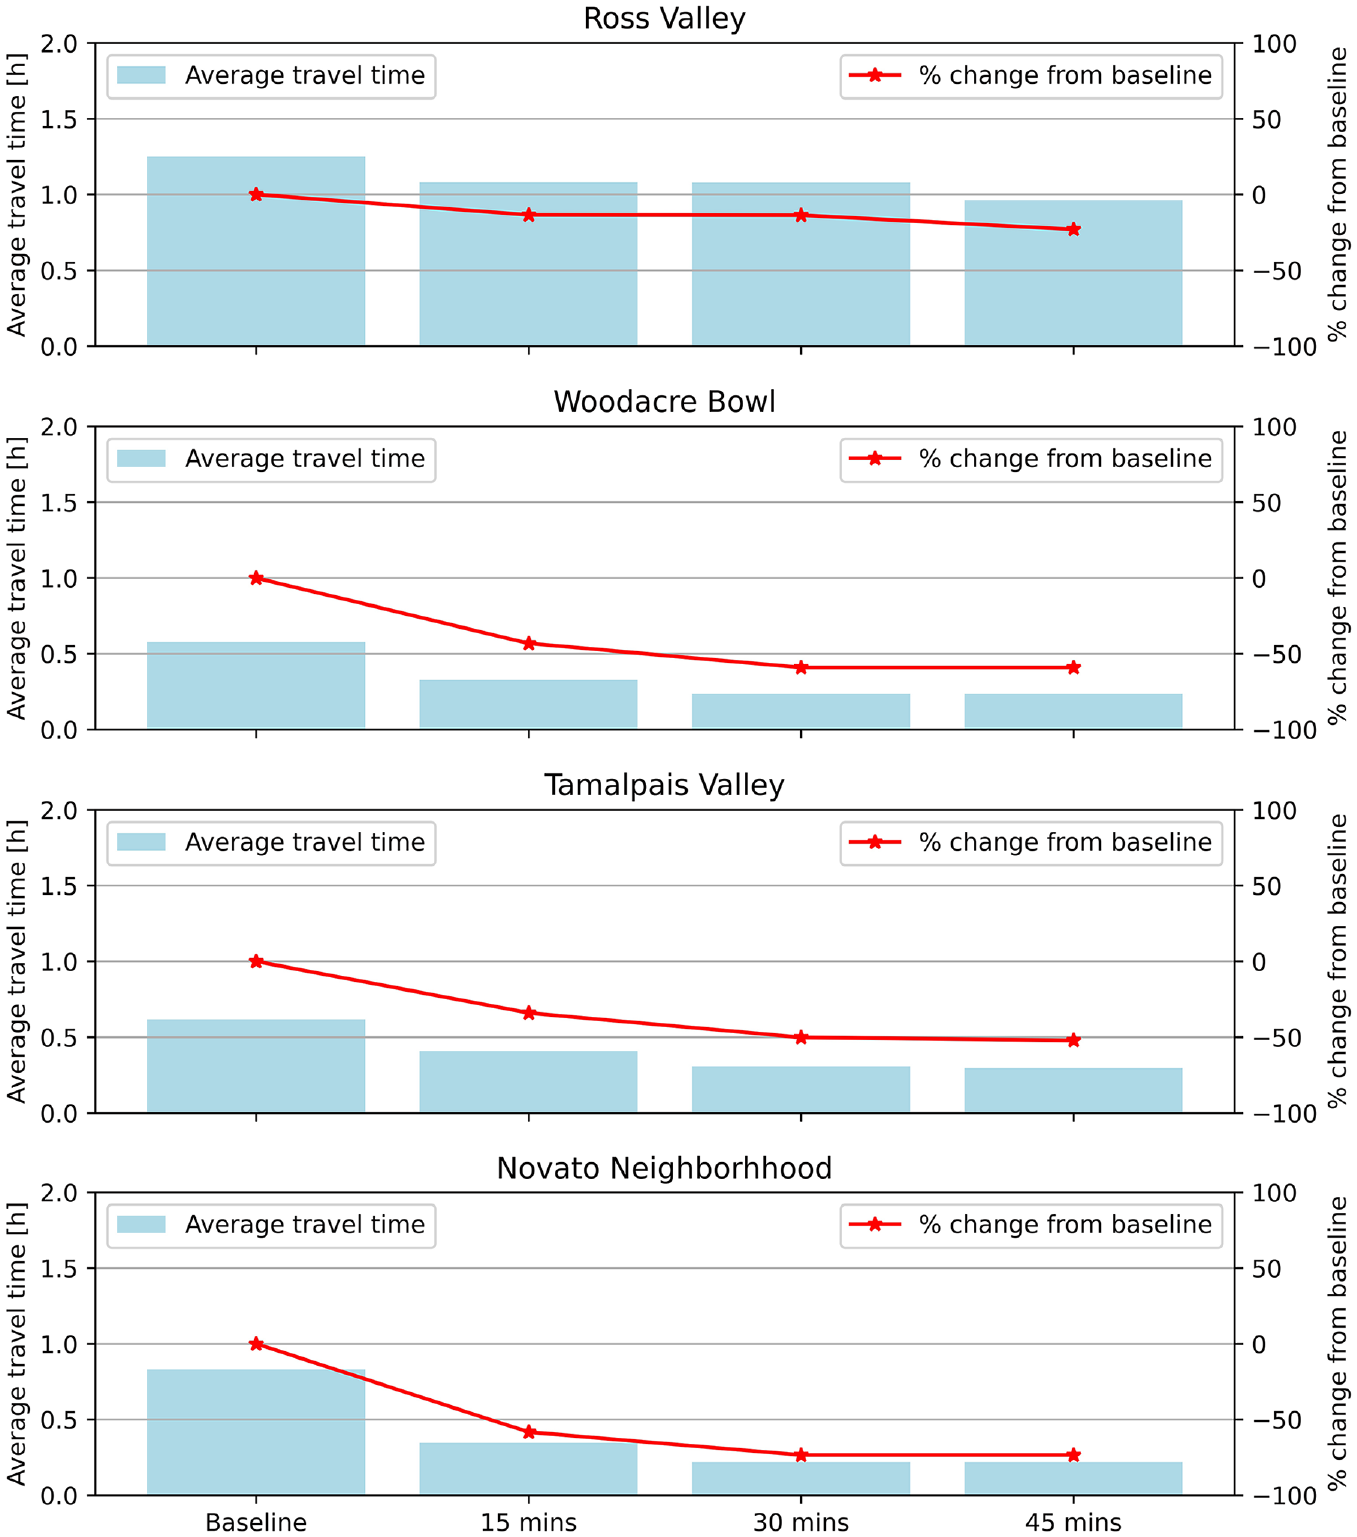
Results of the impact of phased evacuation on different communities.
Results of the impact of on-street parking on different communities.
Figure 17 shows the results of the impact of vehicle reduction on these four communities. As more people shared one vehicle, the average travel time of evacuees decreased because the fewer evacuating vehicles on the road alleviated congestion and expedited the evacuation. When more than four people shared one vehicle, the average travel time of evacuees in all four communities reduced by around 50%. Considering a scenario in which an average of two people in a family share one vehicle rather than one person per vehicle, the Ross Valley evacuation performed the worst, with only a 19.6% reduction in average travel time. Evacuations in the other three communities performed better: the reductions were double that of Ross Valley (48% reduction in Woodacre Bowl, 42.4% in Tamalpais Valley, and 42.2% in Novato Neighborhood). Ross Valley had a high RBE and low RCE, which indicated that the background traffic ratio was high and the evacuation road was saturated. The combination of these two factors led to the poor result. In contrast, only one of the two factors presented as low in the other three communities. For example, Woodacre Bowl had a high RCE but a low RBE, which resulted in a higher evacuation efficiency compared with Ross Valley. In summary, it is suggested that in communities with a high RBE and low RCE, it will be necessary to encourage more people (over two) to share one vehicle, as this could significantly improve the evacuation efficiency in such a community. For communities with either a high RBE or a low RCE, it is recommended that family members consider sharing one vehicle, as our simulation results showed that having two people in a car increased evacuation efficiency by over 40% in this scenario.
Figure 18 shows the impact of phased evacuation. This strategy had a positive impact on evacuation efficiency—the longer the interval, the higher the evacuation efficiency. This is because phased evacuation spreads out the evacuees temporally, leading to higher RCEs in units of time. However, the performance across the different communities varied under this approach. In the case of Ross Valley, which had a high RBE and low RCE, average travel time exhibited reductions of 13.5%, 13.7%, and 23.0% for evacuation intervals of 15, 30, and 45 min, respectively. Conversely, for the cases of Woodacre Bowl, Tamalpais Valley, and Novato Neighborhood, which all had only one high RBE or low RCE, the minimum reduction in average travel time was 34.0%, 50.2%, and 52.1%, for evacuation intervals of 15, 30, and 45 min, respectively. This demonstrated that the simultaneous presence of high RBE and low RCE significantly affected the efficiency of phased evacuation. This is because the simultaneous presentation of a high RBE and a low RCE signified a much more severe congestion scenario than those where only one of the factors was poor. Even if phased evacuation could alleviate congestion to some extent by temporally spreading vehicles out, the congestion caused by high RBEs and low RCEs would still slow the evacuation speed. In contrast, communities with only one high RBE or low RCE did not have severe congestion, and applying this evacuation strategy could further improve evacuation efficiency. It was further noted that the evacuation efficiency of Novato Neighborhood was much higher than that of Tamalpais Valley, although both had the same RBE and RCE categories. This can be explained by Figure 14, which shows that Novato Neighborhood had more evacuation roads—in three directions—that were spatially dispersed. However, Tamalpais Valley only had two main evacuation roads, which were very close to each other, potentially causing road congestion. Under phased evacuation, the Novato Neighborhood routes were much less congested than those in Tamalpais Valley, therefore, the evacuees evacuated more quickly. From the analysis above, it is suggested that communities with a high RBE and low RCE should prolong evacuation intervals to further improve efficiency. However, a prerequisite is to ensure that longer intervals will not lead to late-departing residents being threatened by the approaching fire (e.g., if the fire is moving rapidly or closing in on the community). For communities with only a high RBE or low RCE, 15-min intervals could improve efficiency by at least 35%.
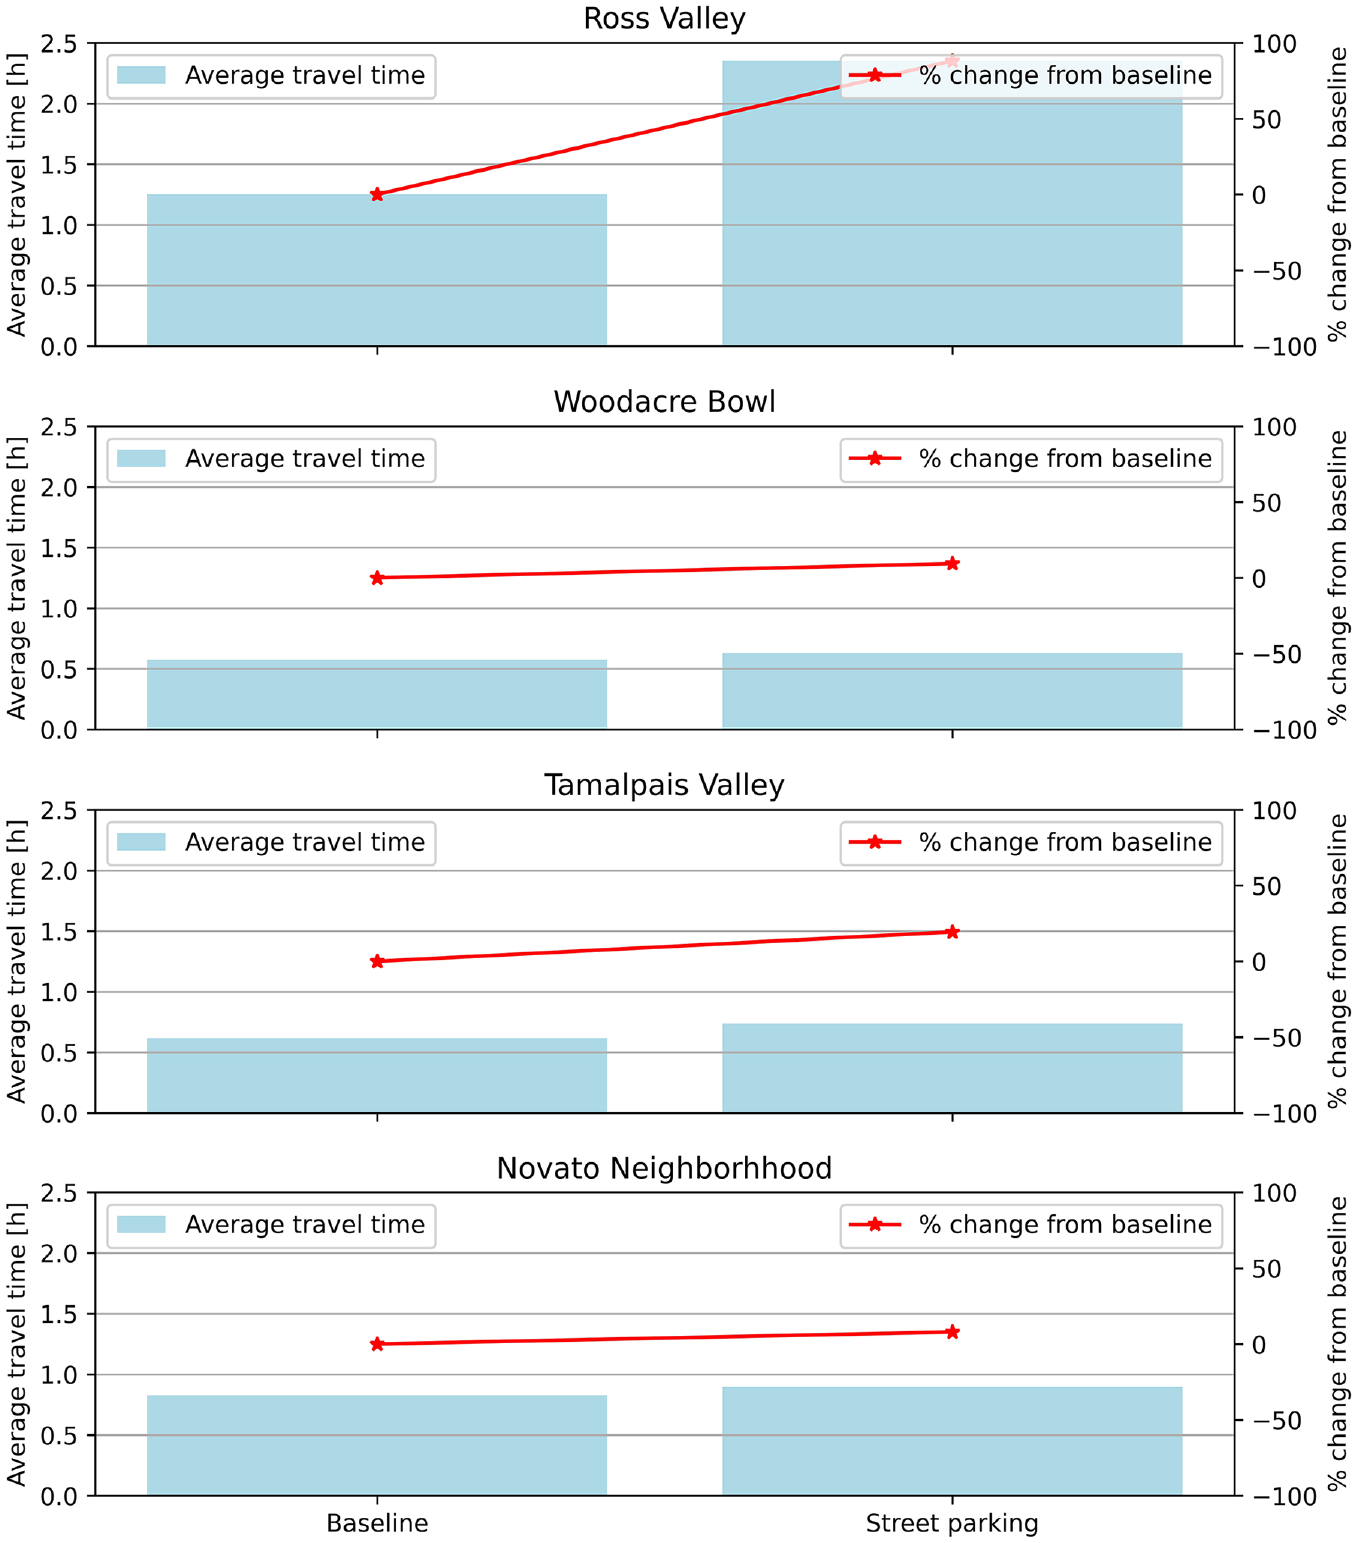
Figure 19 shows the impact of on-street parking on evacuation strategies. It was observed that if on-street parking was not prohibited on a red flag day, the average travel time of evacuees for all the communities increased. This was because on-street parking will reduce road capacity and the number of lanes available, making it difficult for vehicles to flow through the links. It is worth noting that the magnitudes of the increases in average travel time varied across the communities. In the case of Ross Valley (high RBE and low RCE), the reduction in road capacity greatly increased the average travel time by over 88%. The reason this changed significantly was that the reduced capacity resulted in a lower RCE. The evacuation roads were already congested as the initial RBEs and RCEs were poor (over 1.5 and below 1.7, respectively); as the RCE continued to decrease, the situation worsened, consequently, the average travel time was predicted to increase. In contrast, the average travel time did not increase that much in the other three communities, where either the RBE or RCE was poor. On-street parking increased the average travel time for Woodacre Bowl (low RBE and low RCE) by 9.5%; the average travel time for Tamalpais Valley (high RBE and high RCE) increased by 19.4%; and the average travel time for Novato Neighborhood (high RBE and high RCE) increased by 8.0%. The significantly greater increase in average travel time that was observed for Tamalpais Valley can be explained by the road capacity reducing by 25%: its RCE dropped to 1.49—significantly below the threshold of 1.7. Tamalpais Valley therefore transitioned from a community with a high RBE and a high RCE into one with a high RBE and low RCE, resulting in high congestion. Woodacre Bowl and Novato Neighborhood maintained their types. Therefore, the impact of on-street parking was less significant for these communities than for Tamalpais Valley. These results also served to verify the appropriateness of the RCE threshold. In relation to on-street parking during red flag days, it is suggested that in communities with a high RBE and low RCE, on-street parking must be prohibited before the evacuation to improve the evacuation efficiency. For communities with only one high RBE or low RCE, prohibition of on-street parking is not mandatory.
In summary, from the discussion and analysis of the different types of communities, some suggestions can be made. In communities with a high RBE and low RCE, encouraging more than two people to share a vehicle, implement a longer phased interval (if the fire is not close by), and enforcing the prohibition of on-street parking to facilitate the evacuation process is recommended. For communities with only one high RBE or low RCE, families should be encouraged to share one vehicle and adopt a 15-min phased interval for evacuation, whereas prohibition of on-street parking is not necessary. Determination of the RBE and RCE categories for each community depends on the timing of the fire breaking out.
Conclusions and Future Work
This study applied a spatial–queue-based dynamic traffic simulation model to explore the impacts of three strategies—vehicle reduction, phased evacuation, and prohibition of on-street parking—on the evacuation efficiency of communities with different RBEs and RCEs. Through simulations on a simplified traffic network, the critical thresholds for RBE and RCE were identified as 1.5 and 1.7, respectively. Real-world case studies of four distinct communities, namely Ross Valley, Woodacre Bowl, Tamalpais Valley, and Novato Neighborhood were employed, each characterized by varying combinations of high or low RBE and RCE values. The results showed that all three evacuation strategies had a positive effect on the evacuation efficiency in all cases. More people sharing one vehicle and longer phased intervals reduced average travel time. However, the performance of a community with a high RBE and a low RCE was the worst for all three strategies. For the vehicle reduction strategy (i.e., two people sharing one vehicle), the evacuation efficiency improvement for the community with a high RBE and a low RCE was only 19.6%, compared with at least 40% in the communities with only one high RBE or low RCE. For the strategy of phased evacuation (15-min phased interval), the efficiency improvement for the community with a high RBE and a low RCE was only 13.5%, in contrast to at least 34% for the other communities. Prohibition of on-street parking increased evacuation efficiency by over 80% for the community with a high RBE and a low RCE, compared with a maximum of 20% for the other communities. Therefore, for communities with a high RBE and a low RCE, policies of two or more people sharing one vehicle, prolonging the phased interval if the fire does not pose an immediate threat to the safety of evacuees, and prohibiting on-street parking are recommended. For communities with only one high RBE or one low RCE, or neither a high RBE nor low RCE, it is still suggested for at least two people to share one vehicle and implementing 15-min phased intervals for evacuation.
There were several limitations in the analysis of this study. The simplified network employed may only represent communities in rural areas where there are few main roads. In general, such communities are resource-strapped compared with communities in cities, and may not have the capability to undertake evacuation analyses. The analyses and recommendations in this study could therefore support the design of evacuation strategies for these communities. In future, additional evaluations could be carried out on similar communities to further investigate the proposed strategies. For the prohibiton of on-street parking, the reduction of capacity for different communities with different number of lanes should be different. In general, the percentage reduction on capacity should be larger in communities with fewer lanes, and smaller in communities with more lanes. The residential roads on the selected communities in the current research had only one lane in each direction, therefore, the reduction is set the same. In future work, communities that have different numbers of lanes will be considered and more research on how the capacity might change will be carried out. In this study, it was assumed that all evacuees would comply with traffic evacuation orders. However, this assumption may be idealistic: some households may not be willing to abandon their cars, and may prioritize protecting their properties. It was noted that auto insurance covers wildfire damage to cars if the car owner has bought comprehensive cover, therefore, this strategy could be feasible. For those without comprehensive cover, it is recommended that there be provision of disaster relief reimbursement, which could incentivize drivers to abandon their vehicles when necessary. Residents may resist complying with a phased evacuation order and find traffic management strategies intimidating, leading them to alter their evacuation decisions. It will therefore be essential to investigate the factors influencing household compliance with phased evacuation orders. This would contribute to a more nuanced understanding of evacuation dynamics and help enhance the effectiveness of evacuation plans in real-world scenarios. Further, during wildfires, the travel behavior of background traffic could change, therefore, we plan to explore such changes through surveys and GPS trajectory analysis.
Footnotes
Acknowledgements
The authors thank Mark Brown and Charlotte Jourdain of Marin Wildfire Prevention Authority for identifying the case study sites and for their advice.
Author Contributions
The authors confirm contribution to the paper as follows: study conception and design: P. Li, B. Zhao; data collection: P. Li, B. Zhao; analysis and interpretation of results: P. Li, B. Zhao, K. Soga; draft manuscript preparation: P. Li, B. Zhao, L. Comfort. All authors reviewed the results and approved the final version of the manuscript.
Declaration of Conflicting Interests
The authors declared no potential conflicts of interest with respect to the research, authorship, and/or publication of this article.
Funding
The authors disclosed receipt of the following financial support for the research, authorship, and/or publication of this article: This material is based on work supported by the National Science Foundation (grant no. 2230636 SCC-IRG Track 1 Designing Smart, Sustainable Risk Reduction in Hazard-Prone Communities: Modeling Risk Across Scales of Time and Space). This research is also supported by Institute of Transportation Studies, University of California.
Data Accessibility Statement
The datasets generated during and/or analyzed during the current study are available from the first author or the corresponding author on reasonable request.