
Abstract
Despite concerns over distracted driving, many Americans still engage in risky activities while driving, leading to crashes and fatal outcomes. This study aims to investigate the impact of individual risk attitudes and in-vehicle technologies on various types of distracted driving behaviors (DDB), providing insights into the factors that contribute to an increased likelihood of DDB and enhancing an understanding of the effects of advanced vehicle technologies (AVT) on driver behavior. The analysis leverages self-reported survey questionnaire data from a nationally representative sample of participants. To assess the relationships between the variables, exploratory factor analysis and multiple linear regression analysis were used. The findings revealed that the presence of AVT and individual risk attitudes each predicted DDB. The presence of driver-assist and safety features did, however, lead to some degree of decreased distracted driving. Convenience features, such as Wi-Fi and Bluetooth, were most likely to increase DDB, highlighting the need for the design of AVT systems to minimize distracted driving while leveraging the benefits of technology. The data also indicate that other factors affect DDB. Notably, younger individuals engaged in more DDB compared with older individuals, and individuals who drive more frequently and for longer distances also exhibited a higher frequency of DDB. Factors such as driving experience and exposure also affected DDB, with driving exposure having a more substantial influence.
Keywords
While driving, people often do the same things they do while sitting on a couch—eating, reading, talking on the phone. On the couch, engaging in these distracting activities may result in missing the plot of a movie; while driving, it can lead to a crash. Distracted drivers pose risks to their own safety and to that of the traveling public. Distracted driving behaviors (DDB) represent a significant risk on the roads, although this risk lags behind the dangers posed by drunk driving or speeding ( 1 , 2 ). In 2021 in the U.S., distraction-affected crashes accounted for 8% of all crashes involving a fatality. Five percent of drivers in fatal crashes in 2021 were reported to be driving distracted, and 3,522 people were killed in crashes involving distracted drivers ( 2 ). The percentage of total fatal crashes that were distraction-affected or involved a distracted driver remained relatively steady between 2017 and 2021, as did the percentage of total traffic crash fatalities that were distraction-affected ( 2 ). While these data highlight the role of distraction in fatal crashes, distraction-affected crashes accounted for 13% of police reported crashes in 2021 ( 2 ), and near-miss incidents related to DDB are likely largely unreported. Taken all together, these data suggest a persistent problem related to DDB and highlight the critical need to address it. To combat DDB effectively, however, it is crucial to understand the factors that contribute to the behaviors.
What Is Distracted Driving?
Distracted driving occurs when the driver’s attention is voluntarily or involuntarily delayed or diverted from performing the primary driving task adequately and safely. Distraction may happen when drivers engage in secondary tasks by interacting with an event or object in their environment, inside or outside the vehicle ( 3 , 4 ). Examples include interaction with a passenger, food or beverage intake, or phone usage ( 3 ). Distractions can be visual (e.g., taking eyes off the road), physical or manual (e.g., taking hands off the wheel or turning to look at someone in the back seat of the vehicle), or auditory or cognitive (e.g., listening to music or taking one’s mind off the driving task) ( 5 ).
Undeniably, one of the most frequent secondary tasks while driving is mobile phone use, and it is the one of the most prevalent forms of DDB. Manual mobile phone use was found to be associated with a significantly higher risk for near-crash situations and car crashes ( 3 ). In 2021, 12% of all distraction-affected fatal crashes involved mobile phone-related DDB by at least one driver, and 410 people died as a result of involvement in a distraction-affected crash where a mobile phone was in use by at least one driver ( 2 ). Much of the previous research on DDB has focused on mobile phone use when investigating DDB, but it is important to note that other forms of DDB, such as eating and drinking while driving, are also common and contribute to the majority of distraction-affected crashes ( 2 , 6 ). Further, while nearly all forms of DDB entail some risks, they are not all equally risky ( 7 ). Based on naturalistic driving study data, DDB that involved visual distractions—such as manually dialing a handheld cell phone, reaching for a non-cell phone object in the vehicle, or reading or writing—posed the greatest increase in crash risk ( 7 ); in contrast, DDB that were cognitive only in nature (e.g., interacting with a passenger, talking or singing alone) have been shown to be associated with smaller relative increases in crash risk ( 8 ). Because of the range of DDB drivers engage in and the contributions that they almost universally make to increased crash risk, the current study aims to examine a broader set of DDB ( 9 ).
Factors That Affect Distracted Driving Behavior
To explain and understand DDB, it is important to consider both contextual factors, such as the presence of in-vehicle technologies, and individual factors of the driver, such as gender, age, and risk preferences, and the interplay between the two.
Contextual Factors: Technologies in the Vehicle
The recent rapid evolution of in-vehicle technologies has the potential to make driving tasks easier for the driver and to make driving safer overall, but the development and deployment of these may have outpaced people’s ability to keep up with them and to understand both their capabilities and limitations. These advanced vehicle technologies (AVT) may play a crucial role in the driving experience by providing innovative features and safety measures to enhance the comfort and overall performance of the vehicle.
New vehicle technologies can be grouped into three groups based on their primary focus (cf. 10). The first is driver assistant features, referring to technologies that provide support to the driver when performing a dynamic driving task. Safety features refer to those that aim to reduce risk and increase driving safety by providing alerts or actively changing the vehicle’s state when needed. Lastly, convenience features are those technologies that enhance the driver’s experience.
While these AVT aim to enhance safety by assisting in the driving task, thus reducing the driver’s workload and freeing the driver to focus better on the road, they are not without drawbacks. Studies show that driving automation systems, such as Tesla’s autopilot, may result in drivers’ visual inattention and reduced vehicle control, as they engage in non-driving tasks for extended periods ( 11 ). Further, AVT might also lead to driver complacency, as individuals rely on the technology to handle more aspects of driving—and potentially engage in more DDB—and expect the systems to warn them if needed, rather than fully attending to the driving task (cf. 3). Moreover, AVT itself may serve as a distraction, as it brings an increased availability of entertainment, navigation, and communication systems to the vehicle, making it even more challenging for drivers to maintain full attention on the road. The underlying effects of AVT on driver behavior, however, are complex and poorly understood. Different forms of AVT might have different effects on driving behavior.
Individual Factors: Driver Characteristics and Habits
Previous research has identified different internal and external factors associated with the individual that are associated with their likelihood of engaging in DDB.
Age
People of all ages engage in DDB ( 12 – 14 ); some data suggest that middle-aged adults engage in DDB just as frequently as young adults ( 15 ). Younger people were found to drive more distracted than older drivers ( 16 ).
Gender
Males were found engage in DDB more frequently than females; in 2019, male drivers were about three times more likely to be involved in fatal car crashes than female drivers ( 2 , 16 ). Male drivers also reported greater positive affects for risky driving behavior than female drivers, whereas female drivers reported perceiving greater risk in risky driving behavior than male drivers ( 17 ).
Having Children
Parents with children have been reported to be more likely to drive distracted than adults without children ( 18 ), but another study found that individuals were less likely to use mobile phones when children were present in the car compared with driving alone or with other adults ( 19 ). Thus, having children may lead to reduced mobile phone use but potentially more engagement in other DDB.
Residential Environment
Residential environment affects the complexity of the driving task; urban areas with more traffic or places where road systems are more complicated may demand more driver attention, resulting in less DDB.
Risk Attitudes
People’s individual attitudes toward risk may also affect their DDB. General risk attitudes refer to a “chosen response” influenced by an individual’s disposition toward the perception of risks in various situations (cf. 20 ). Risk attitudes can affect decision-making processes and the willingness to engage in potentially distracting activities while driving; they have been shown to be a robust predictor for actual risky driving behaviors ( 21 ).
One aspect that plays a significant role in people’s risk attitudes is their feeling of safety. In the risk literature, there is a safety paradox: When people feel as if things are made “safer,” they tend to increase their risk-taking (cf. 22 ). For example, if people believe that AVT would improve safety for themselves and other road users, the safety paradox would lead them to over-rely on using AVT and to feel safer, which in turn would increase their willingness to take risks when driving (e.g., engaging in more DDB or in DDB more frequently) and decrease their perception of how risky driving is.
This apparent contradiction—when people feel things are safer, they take greater risks—might be explained by other cognitive biases that influence decision making and perception. For example, the optimistic bias operates such that when people make risk judgments and compare themselves to others, they tend to perceive their own risk of harm as below average ( 23 ). The optimistic bias can also be framed such that people feel like their skills are better than average leading to an overconfidence bias (cf. 24 ). In the context of driving, people might overestimate their driving skills and how well they handle risky situations on the road, which in turn leads them to believe they are not risky drivers. This assumption was confirmed by Hill et al. ( 25 ) who found that DDB was highly prevalent among individuals who had overconfidence in their driving skills, making them feel like a safer, or less risky, driver.
Thus, in the context of the current study, we assume that more risk-accepting attitudes should be associated with greater DDB. In particular, we assume that those with a higher willingness to take risks in general, and a lower perception of how risky driving is in general, might be more prone to engage in DDB. On the other hand, individuals with more risk-averse attitudes might be more likely to prioritize minimizing distractions while driving.
Overall, the current study aims to investigate whether the presence of various AVTs is associated with an increased likelihood of DDB, considering different types of AVT, different forms of distraction, and different individual factors of the driver. This analysis will yield a better understanding of the effects of different types of AVT on different forms of DDB, with the ultimate goal of enhancing road safety.
Methods
Sample
The data for this analysis come from a nationally representative survey of the U.S. population that the MIT AgeLab conducted with NORC in 2019 using their AmeriSpeak panel. The questionnaire was fielded online in English between December 11 and 23, 2019. A total of 1,487 individuals completed the questionnaire yielding an interview completion rate of 28.9%. Respondents received a small cash incentive determined and paid by NORC for their participation in the survey. Following data collection and cleaning, sample weights were calculated for the data to ensure that the weighted analysis of the survey data better represented the demographic distribution of the target population ( 26 ). This analysis focuses on respondents who were current licensed drivers, which accounted for 91% (N = 1,352) of the sample.
Survey Measures
The survey contained numerous questions about people’s transportation preferences and practices. Demographic data, including age, gender, and residential location, were also collected, and the data set was augmented with a small set of variables from NORC’s files of existing data on panel participants.
DDBs were captured with a series of 15 items that asked “How often do you do each of the following while driving?” on a Likert scale, ranging from 0 Never to 4 Often. To measure the presence of AVT, people were asked for each of 17 items to “Please indicate whether the vehicle that you drive most frequently has each of the following systems or technologies” (responses were Yes or No). Respondents were provided with a brief description of each technology in case they did not know what a particular technology or feature was called and to ensure that each respondent was working with the same definition.
Risk attitudes were captured from three items. The first item about riskiness as a driver asked “How cautious or risky would you say you are as a driver?” on a Likert scale ranging from 0 Very cautious to 4 Very risky. The second question asked participants about their general risk orientation with: “In general, on a scale of 0 to 10, how willing are you to take risks?” on a Likert scale ranging from 0 Not willing at all to 10 Very willing. Lastly, participants were asked about how risky they thought driving was as an activity: “Please indicate how risky on average you consider each of the following to be: Driving generally” on a Likert scale ranging from 0 Extremely risky to 4 Not at all risky.
Statistical Analysis
The weighted survey data were analyzed using IBM SPSS Statistics version 25.0 and version 27.0 ( 27 ).
Results
Distracted Driving Behaviors
Table 1 displays the frequencies of all DDB. People reported most often eating or drinking non-alcoholic beverages (e.g., coffee, soda, water, etc.), carrying on extensive conversations with other passengers in the vehicle, or using turn-by-turn directions from a phone or vehicle navigation system.
Frequencies of DDB
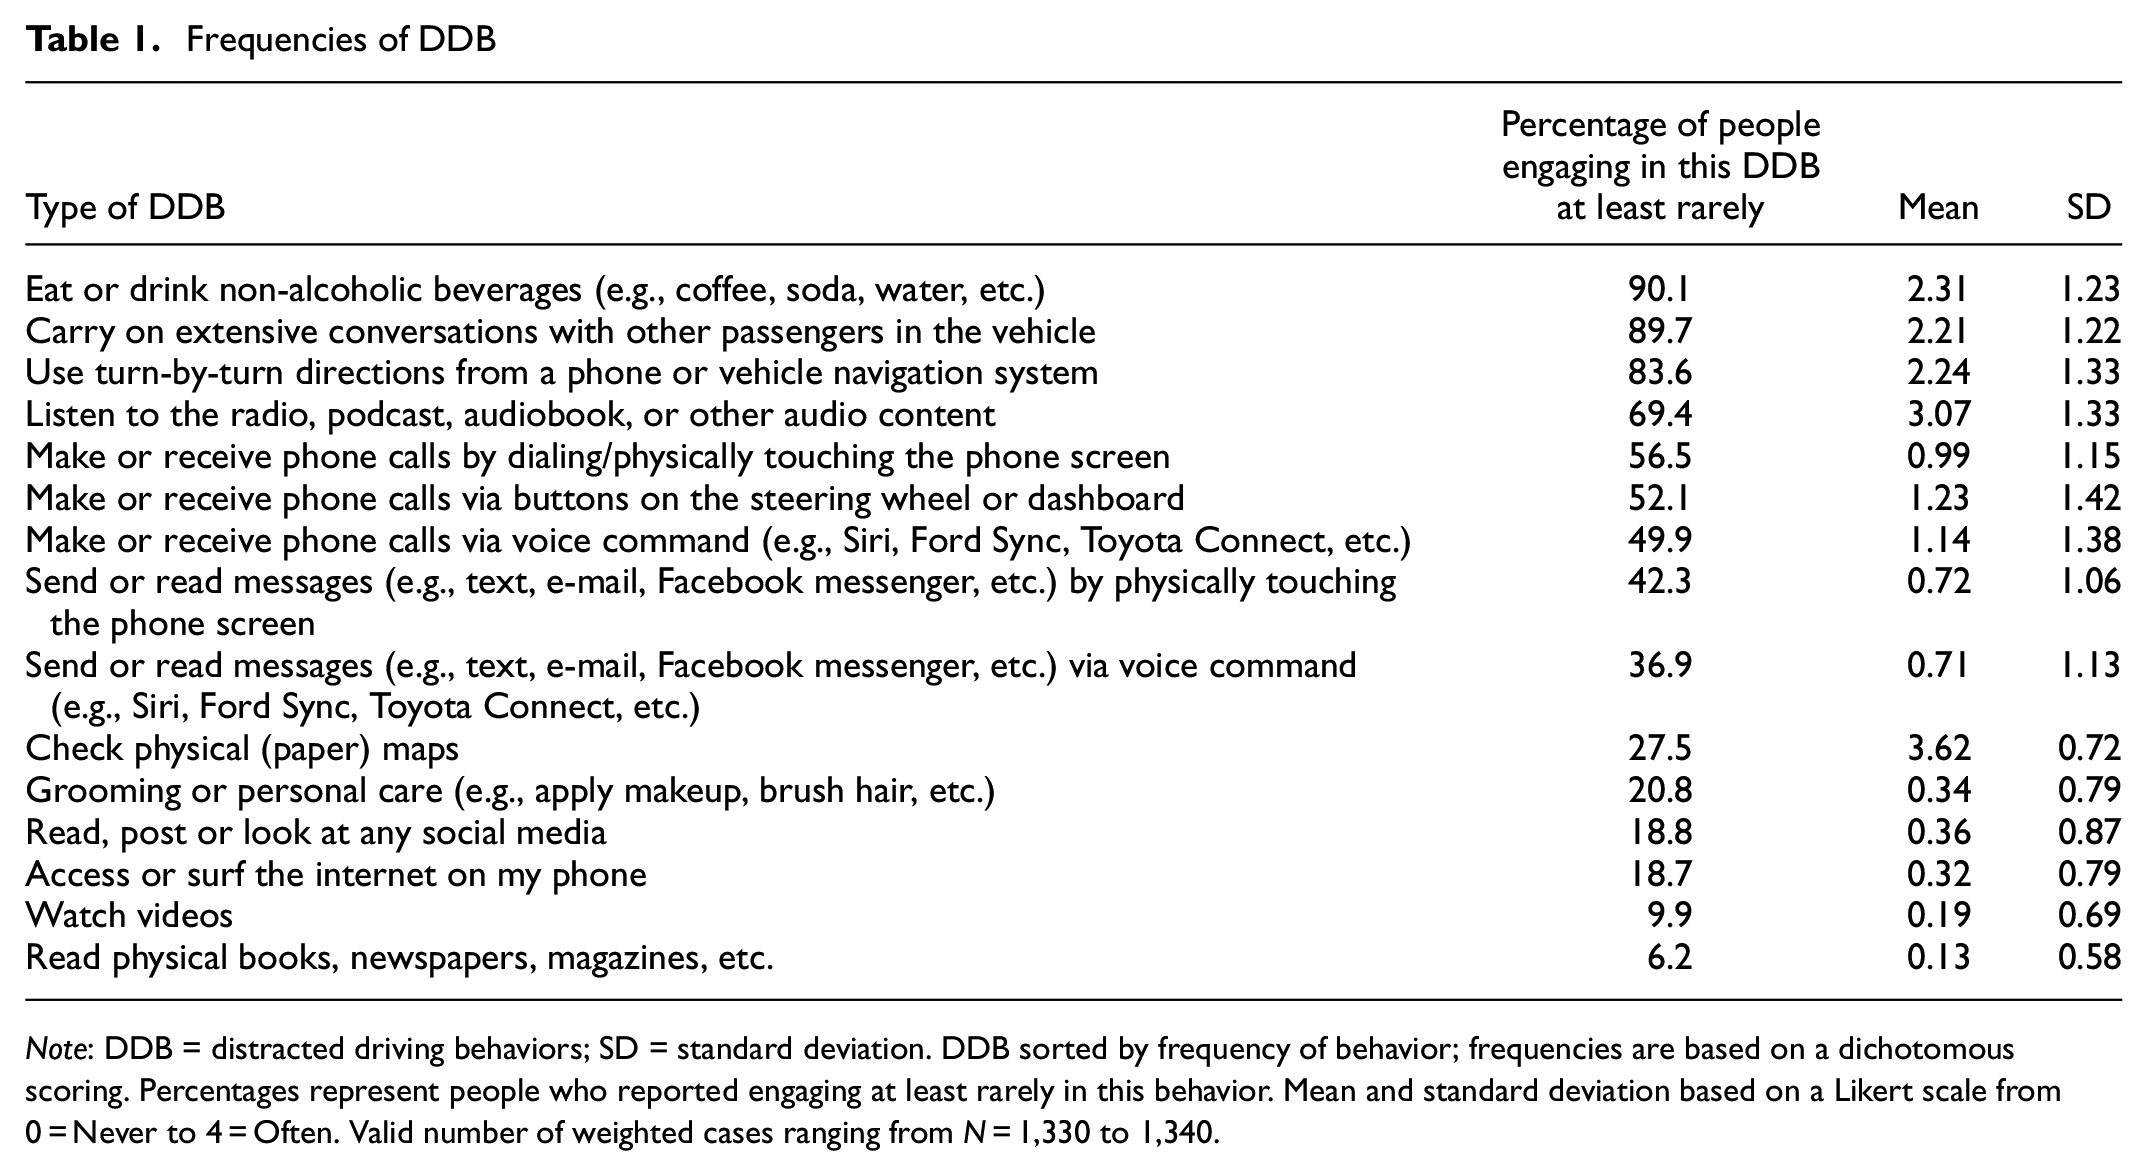
Note: DDB = distracted driving behaviors; SD = standard deviation. DDB sorted by frequency of behavior; frequencies are based on a dichotomous scoring. Percentages represent people who reported engaging at least rarely in this behavior. Mean and standard deviation based on a Likert scale from 0 = Never to 4 = Often. Valid number of weighted cases ranging from N = 1,330 to 1,340.
A count variable of the total number of DDB that people reported engaging in was also created (M = 6.77, SD = 3.01). A mere 0.8% of people reported never driving distracted—never engaging in any of these behaviors while driving. Most people reported engaging in five (13.2%) or six (13.5%) different distracting behaviors while driving, and 17.2% of people reported engaging in 10 or more forms of DDB.
A one-way ANOVA with a Tukey honesty significant difference (HSD) test indicated that the number of DDBs that people reported engaging in differed significantly by age (F(7,1333) = 27.94, p < .001), with older people reporting fewer DDBs on average. On average, people in their 20s reported engaging in 8.13 (SD = 3.58) of 15 behaviors, whereas people in their 80s and older reported showing 4.43 (SD = 1.86). There were no differences in number of DDBs that people reported by gender (t(1,319) = −1.03, p = .302).
An exploratory factor analysis with principal components of the 15 DDB items was conducted to examine how the different behaviors related to each other; the factor loadings are shown in Table 2. Four factors were extracted. Factor 1 (Cronbach’s α = .843) was compromised of five items that were all related to phone use by touching it. Factor 2 included three items (Cronbach’s α = .698) all related to non-technology visual distractions over a longer period of time. Factor 3 was comprised of three items (Cronbach’s α = .758) all related to behaviors involving drivers interacting with voice commands. The fourth factor included three items (Cronbach’s α = .479) with a low reliability score. Looking at the inter-item correlations, all items were low but significantly correlated with each other (between r = .20 and r = .27, p < .001). When looking at the nature of the actions, the item “Eat or drink non-alcoholic beverages (e.g., coffee, soda, water, etc.)” seems to fall out of the pattern. The other two items seem to be connected content-wise as both are related to auditory as well as cognitive distractions (cf. 6). Thus, for further analysis, factor 4 was created from two items and “Eat or drink non-alcoholic beverages (e.g., coffee, soda, water, etc.)” was treated separately, as a fifth factor. One item (“Use turn-by-turn directions from a phone or vehicle navigation system”) did not load on any of the four extracted factors and was excluded from further analysis.
Rotated Factor Matrix of DDB
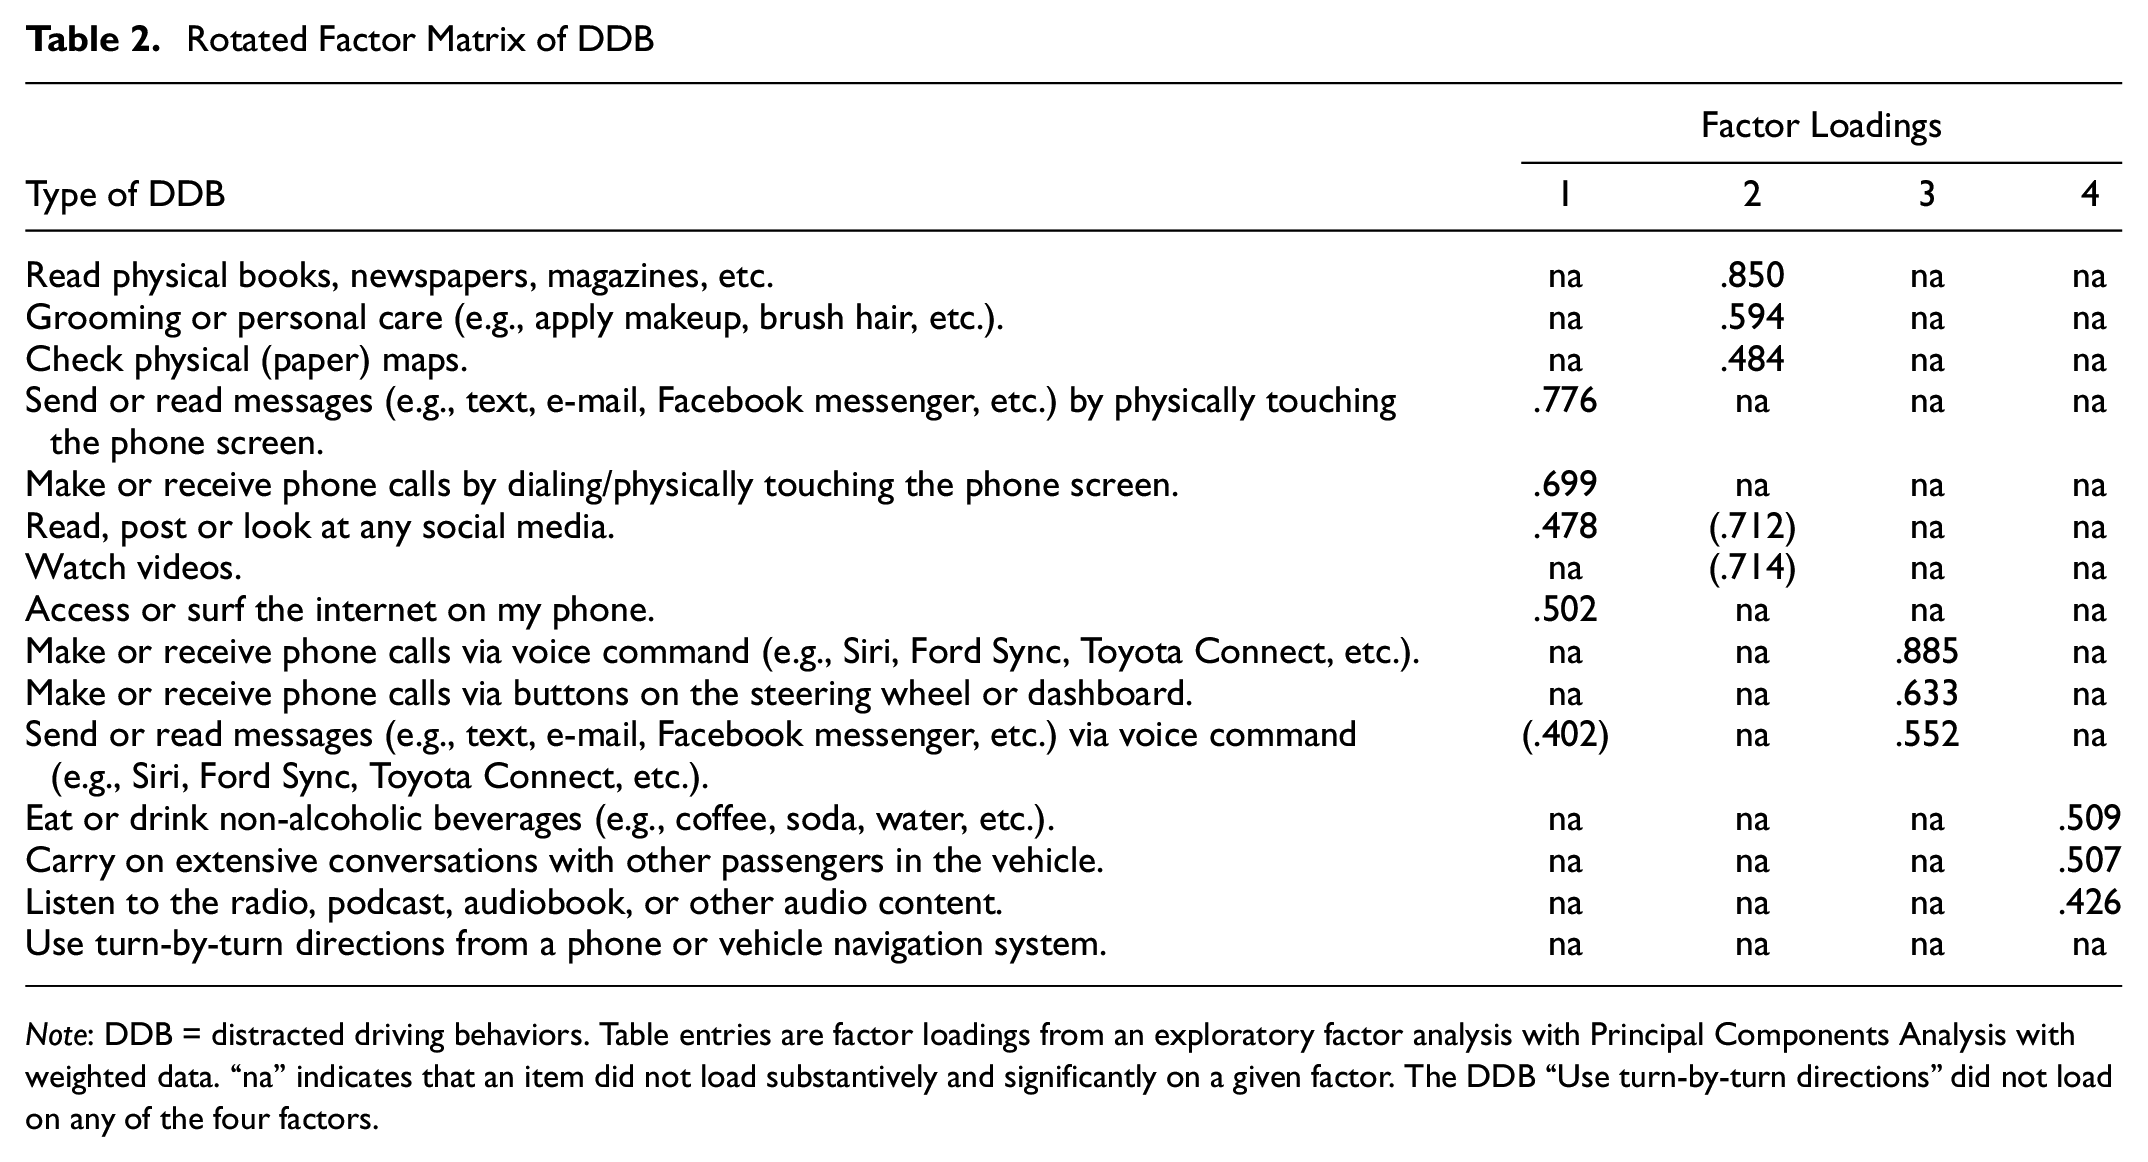
Note: DDB = distracted driving behaviors. Table entries are factor loadings from an exploratory factor analysis with Principal Components Analysis with weighted data. “na” indicates that an item did not load substantively and significantly on a given factor. The DDB “Use turn-by-turn directions” did not load on any of the four factors.
Technologies in the Vehicle
Across the whole sample, people reported that the vehicles they drove most frequently had M = 3.60 (SD = 3.85) of the 17 technologies. As seen in Figure 1, the technologies people were most likely to report having in their vehicles were features related to driver support and convenience. More than half of people reported having Bluetooth in their vehicle (54.3%), followed by adaptive cruise control (35.3%), back-up warning systems (37.8%), and smart headlights (26.5%). Drivers were least likely to report having drowsy driver alerts (5.2%), automatic parallel parking (3.2%), and automated driving technologies (2.8%, found in vehicles such as Teslas).
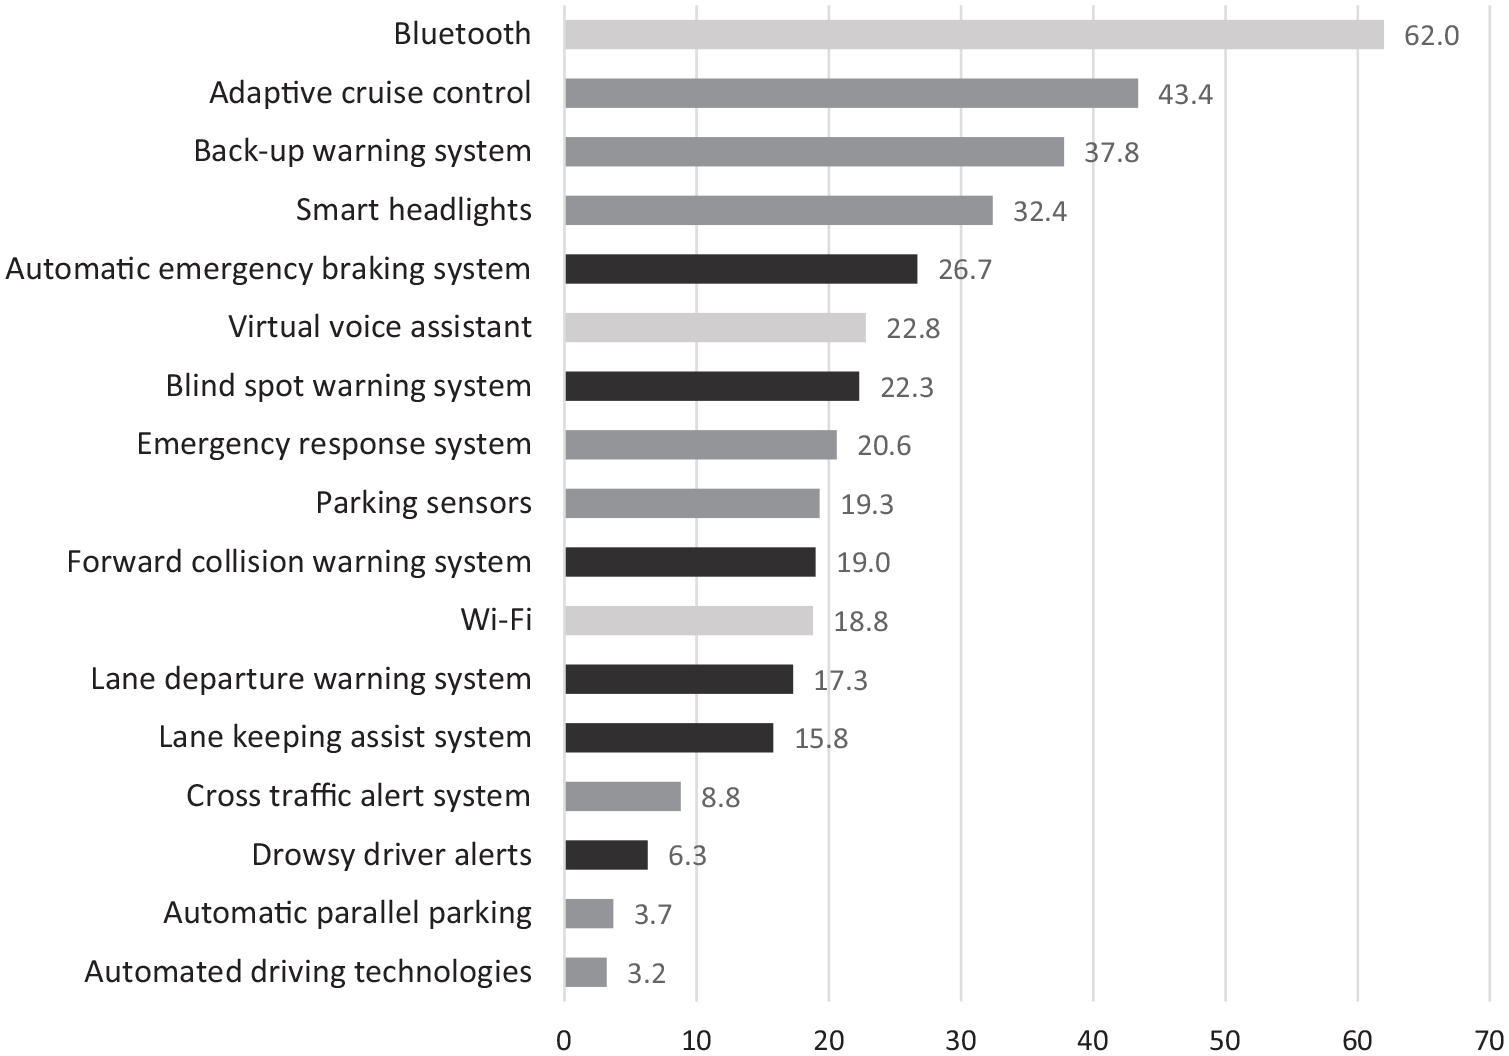
Percentages of people reporting having different advanced vehicle technologies (AVT).
Table 3 shows that about a fifth (20.6%) of the sample reported not having any AVT at all. Roughly the same number of people reported having either one or two, or three to nine, AVT. Only five participants (0.4%) reported having all 17 items. The overall distribution of AVT shows a right-skewed distribution (skewness = 1.25), indicating that the majority of individuals had fewer rather than more AVT items in their vehicle.
Technologies in the Vehicle Driven Most Frequently by Age and Gender
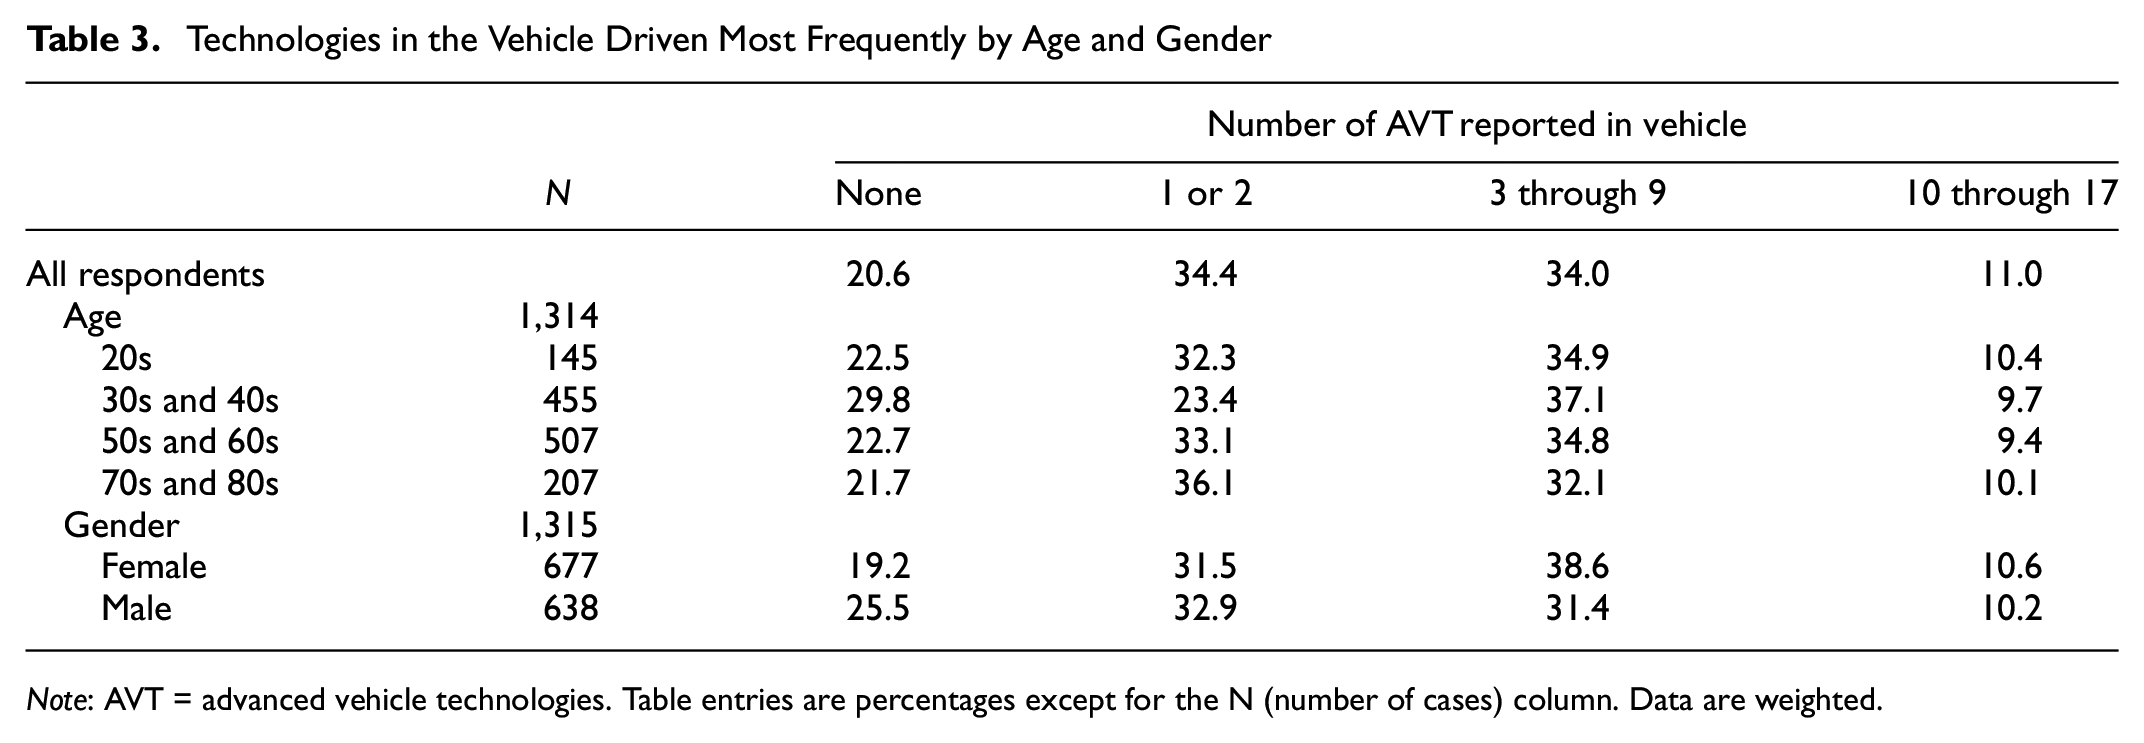
Note: AVT = advanced vehicle technologies. Table entries are percentages except for the N (number of cases) column. Data are weighted.
Three subscales were created for the 17 AVT to represent the driver-assist, safety, and convenience dimensions of the technologies. The driver assistance subscale consisted of eight items (α = .754), the safety subscale of six (α = .882), and the convenience subscale of three items (α = .636). On average, people reported having M = 1.58 (SD = 1.75, skewness = 1.11) of the eight driver-assist technologies, M = 1.02 (SD = 1.69, skewness = 1.67) of the six safety technologies, and M = 1.00 (SD = 0.97, skewness = 0.56) of the three convenience technologies in the vehicle they drove most frequently.
Risk Attitudes
Descriptives and correlations between the risk variables are shown in Table 4. The correlation of self-assessed risky behavior in general and risk perception of driving in general was nonexistent, but self-assessed risky behavior in general was correlated positively with people’s self-assessments of their riskiness as a driver. People’s self-assessment of riskiness as a driver had a very weak negative (but statistically significant, likely given the size of the sample) correlation with their assessment of driving in general. Because of the low correlations of these different risk measures generally, however, each was included in further analysis of DDB.
Correlations among Risk Attitude Items
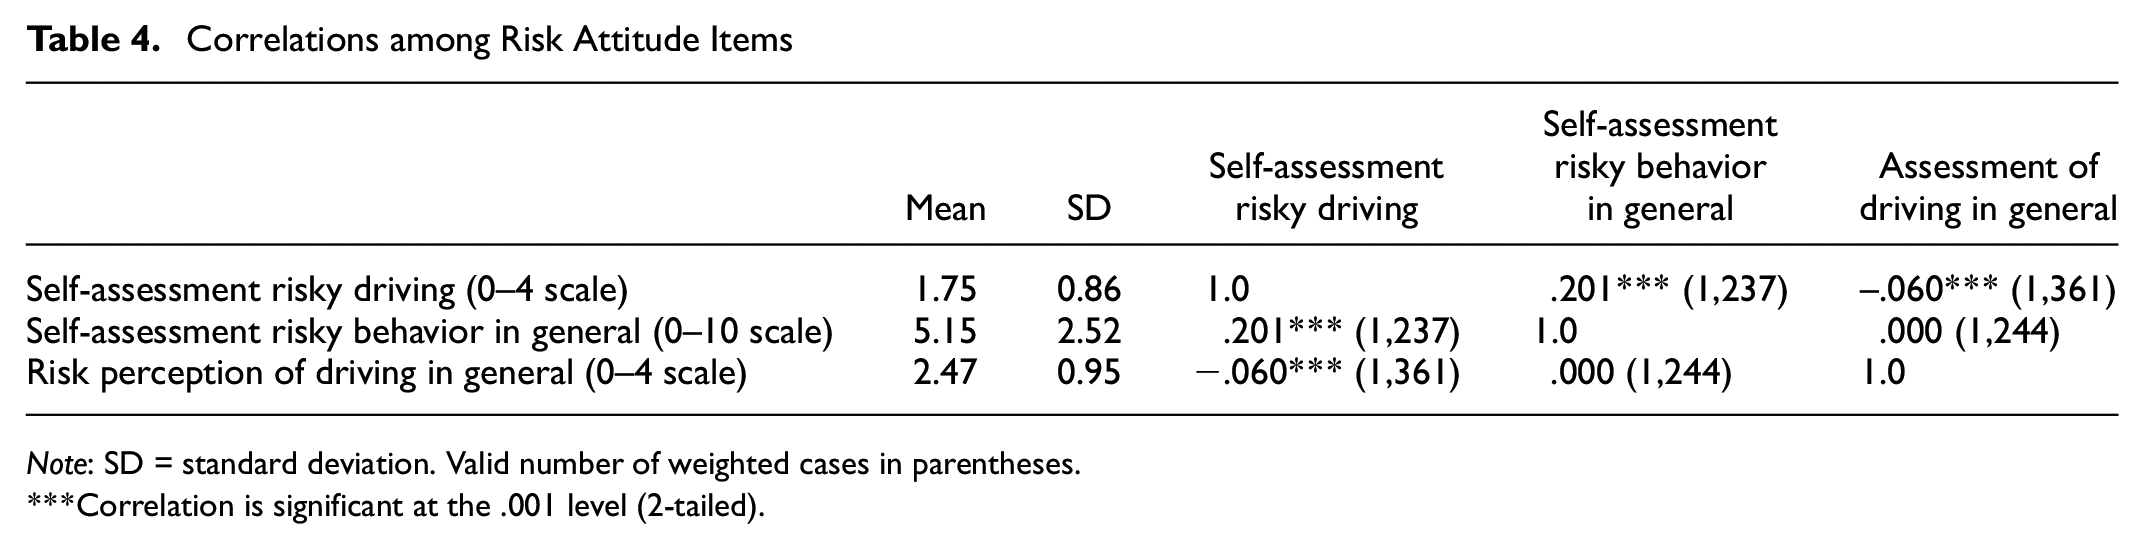
Note: SD = standard deviation. Valid number of weighted cases in parentheses.
Correlation is significant at the .001 level (2-tailed).
Regression Analysis
A linear regression model was conducted to test the effect of AVT factors and risk attitudes on DDB, including environmental and individual factors as control variables. Because of the low correlations among the risk items, we assumed that the risk variables captured different aspects of risk and treated them separately for the regression analysis. The results of the regression analysis, including all variables, are displayed in Table 5.
Linear Regression Analysis of DDB on AVT, Contextual and Individual Factors
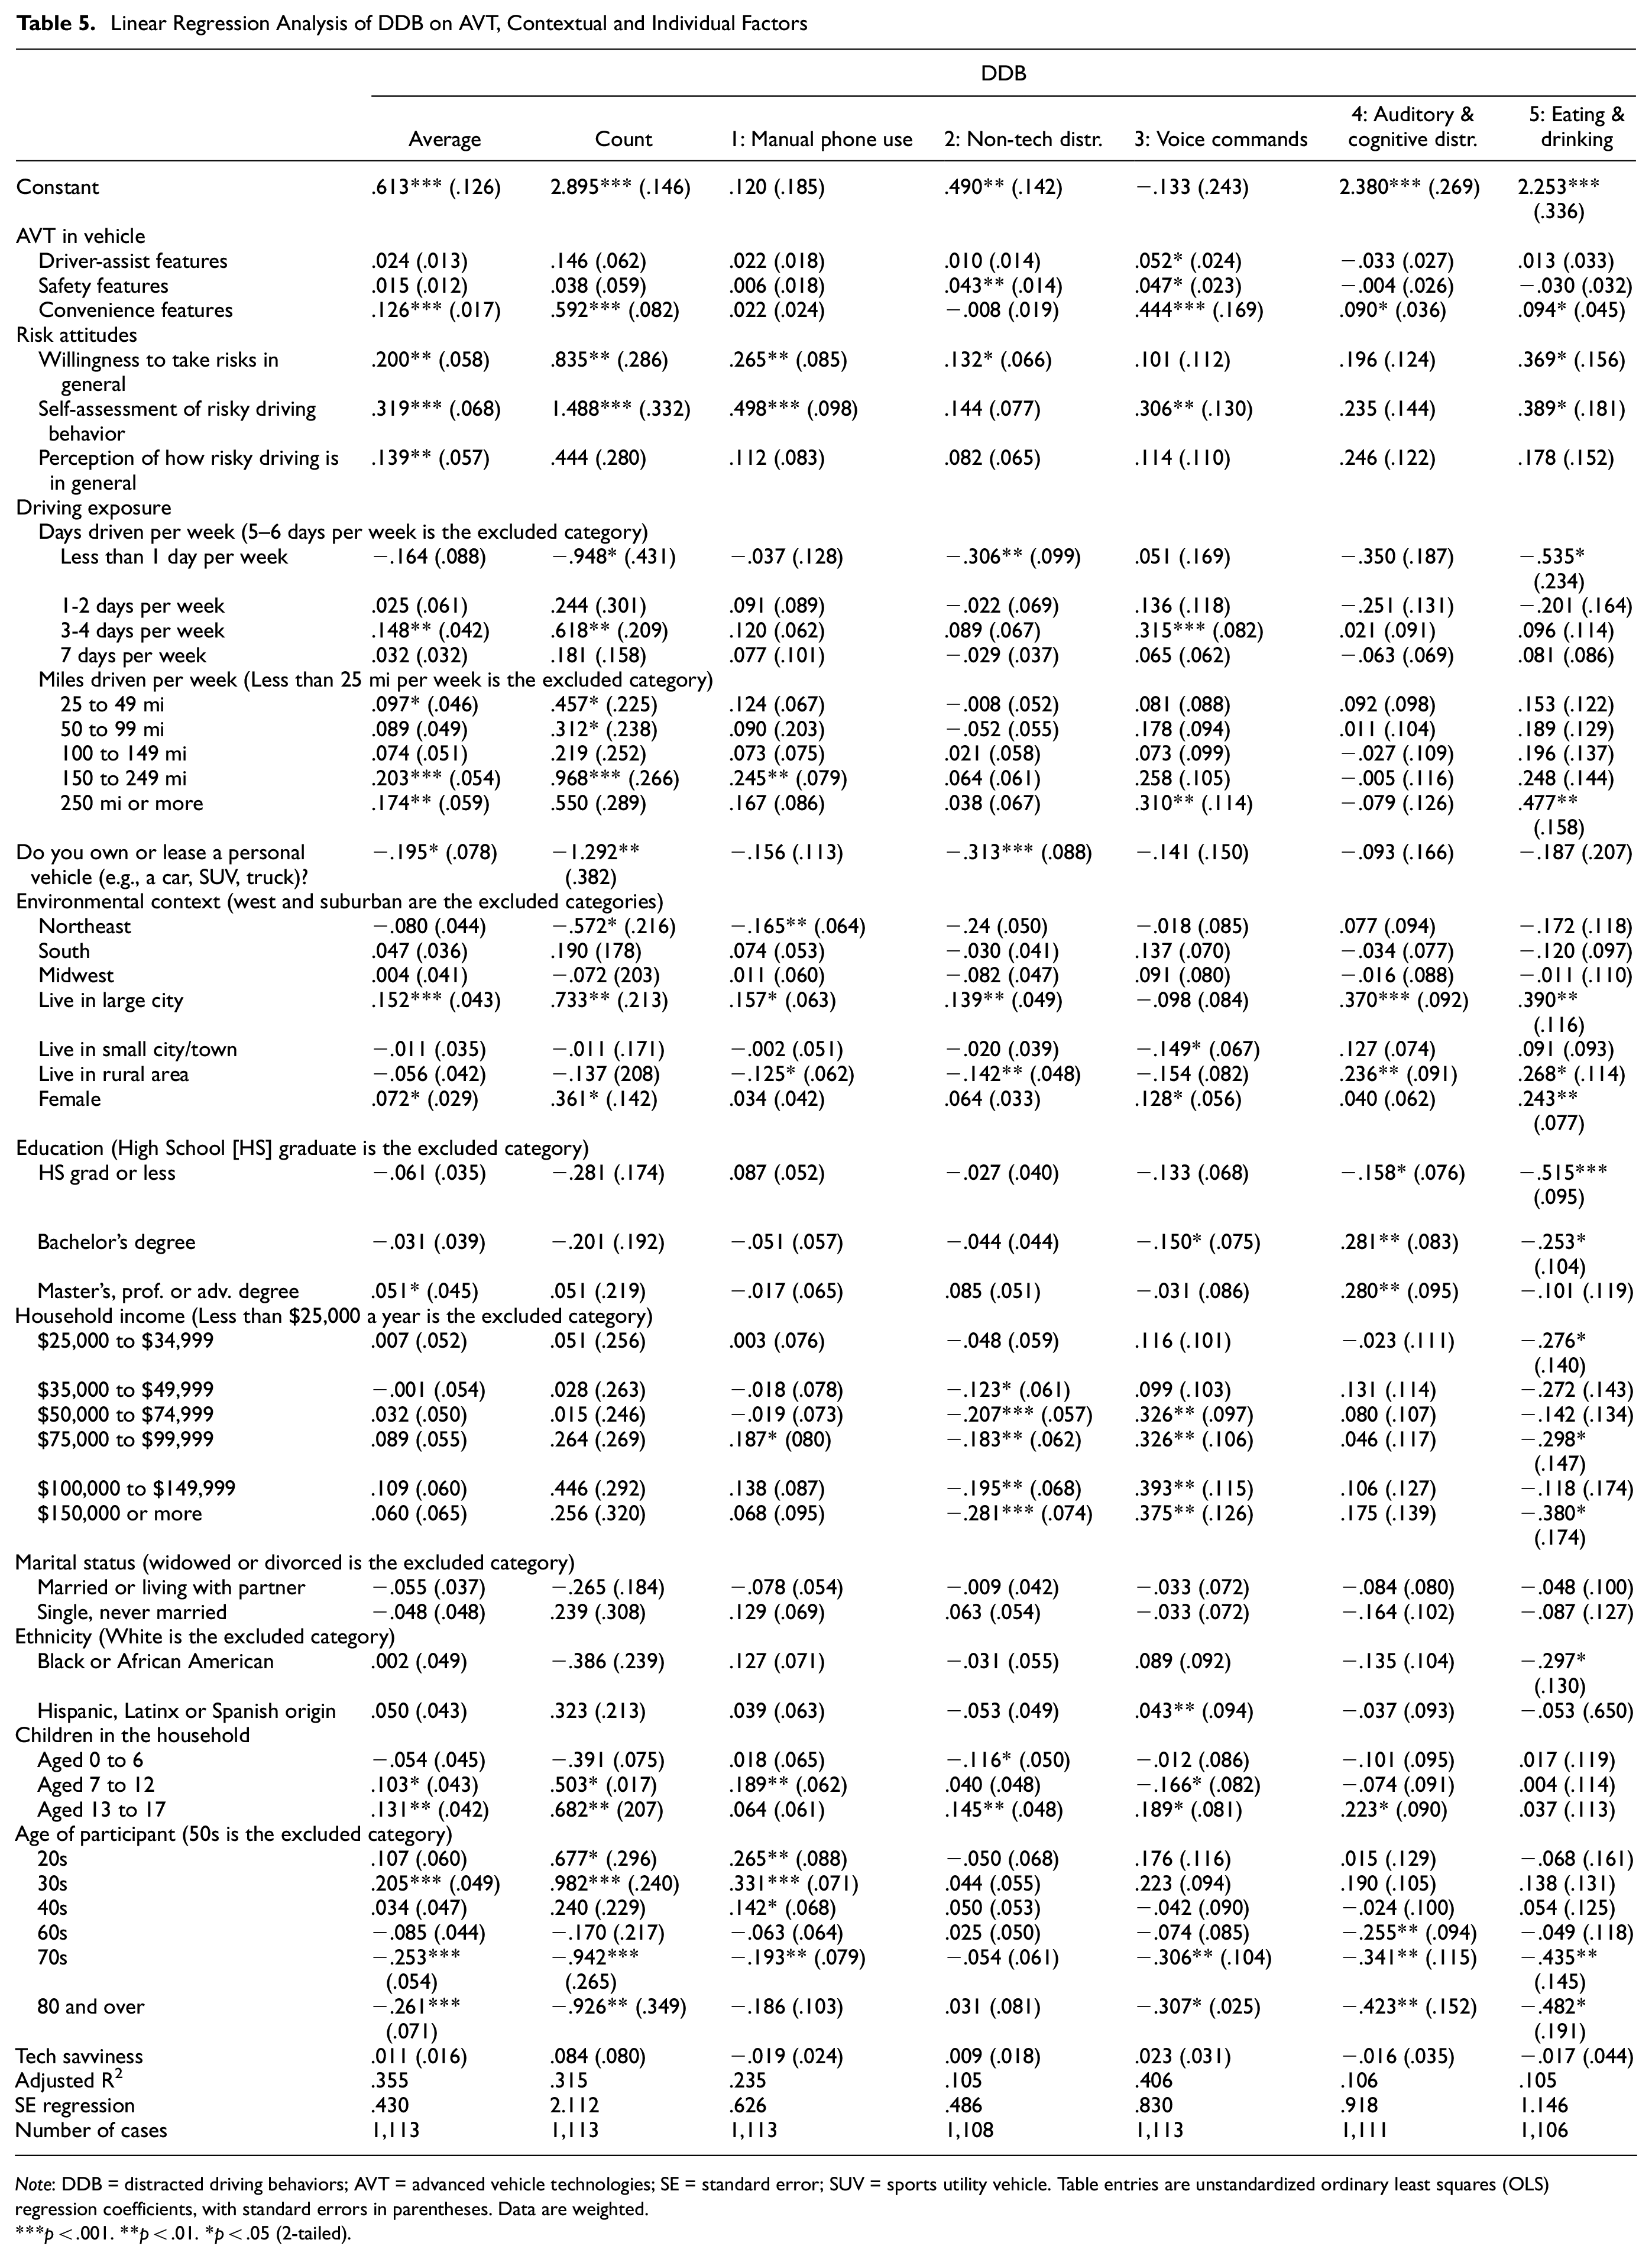
Note: DDB = distracted driving behaviors; AVT = advanced vehicle technologies; SE = standard error; SUV = sports utility vehicle. Table entries are unstandardized ordinary least squares (OLS) regression coefficients, with standard errors in parentheses. Data are weighted.
p < .001. **p < .01. *p < .05 (2-tailed).
Effects of AVT and Risk Attitudes on DDB
The first dependent variable represents the average value of people’s frequency reports across all 15 DDB items. The results indicate that only the presence of AVT convenience features was significantly positively associated with overall DDB frequency. All three risk measures were also positively and significantly related to people’s overall DDB scores.
Turning to the number of DDBs people report engaging in at least rarely, again only the presence of AVT convenience features had a significant positive impact, suggesting that the presence of convenience AVT results not only in higher frequencies of DDB reports but is also associated with people engaging in a wider range of different DDBs. Across the number of different DDBs, people’s general willingness to take risks and their self-assessment of their risky driving behavior were positively associated with a greater number of DDBs, but perceptions of the riskiness of driving generally were not significantly related to the overall number of DDBs that people reported engaging in.
Focusing specifically on manual phone use DDB (1; involving physical interactions with a mobile phone), none of the regression coefficients for different AVT factors were statistically significant. Variables for people’s general willingness to take risks and their self-assessment of their risky driving behavior were positively associated with greater DDB reports around manual use of a mobile phone while driving, but perceptions of the riskiness of driving generally were not significant.
Among the non-technical distractions (2; e.g., reading, physical map use, grooming), only the presence of safety features AVT and people’s willingness to take risks in general were statistically significant predictors of the frequency of these DDBs. For the model for DDB related to the use of voice commands via phone (3), all three forms of AVT—driver-assist, safety, and convenience features—were positive and statistically significant predictors. People’s self-assessment of their risky driving behavior was also positively and significantly related to higher levels of this type of DDB.
In the regression model for auditory and cognitive DDB (4; e.g., radio, conversations, etc.), only convenience AVT features were positively and significantly related to reports of more DDB. None of the risk attitude measures was a significant predictor of these forms of DDB. Finally, reports of eating and drinking DDB frequency were significantly and positively related to the presence of convenience AVT features and to a general willingness to take risks and personal assessments of their risky driving behavior.
Effects of Other Driver Characteristics on DDB
Age
Age appears generally to be inversely related to all of the DDB measures, with younger people reporting engaging in more individual and overall DDB compared with older people. Age effects are statistically associated with impacts on the DDB measures with the exception of (2) non-technical driving distractions (e.g., reading, using physical maps, grooming), where none of the coefficients for the age variables is significant. These results are generally consistent with other research around DDB and age ( 28 , 29 ).
Gender
Controlling for other variables, including all three risk attitudes, women were significantly more likely than men to engage in several forms of DDB, notably: overall average of DDB scores; number of DDB they reported doing at least rarely; using voice commands on a phone (3); and eating and drinking (5).
Having Children in the Household
Having a child six years old or younger in the household was significant only for one model of DDB: engaging in non-technological distractions (2), and the coefficient was negative. This suggests that people who had a very young child were less likely to engage in this form of DDB, controlling for other variables. Having a child aged 7 through 12 was significant for engaging in voice commands DDB (3), but this coefficient was also negative, indicating that having a child of this age in the household was associated with a lower frequency of engaging in this form of DDB. In contrast, the coefficients for having a child aged 7 to 12 were positive for overall mean DDB score, count of number of DDBs the driver at least rarely engaged in, and manual use of a mobile phone DDB (1). As such, having a child age 7 to 12 in the household was associated with a higher average DDB score, a higher number of overall DDB that the driver reported engaging in at least rarely, and frequency of manual use of a phone while driving, controlling for other factors.
In contrast, having a teenager in the household was positively associated with higher levels of some forms of DDB, controlling for other variables. Having a child aged 13 to 17 in the household was associated with a higher overall mean frequency of DDB, count of number of DDBs the driver engaged in at least rarely, frequency of engaging in non-technological driving distractions (2; e.g., reading, physical maps, grooming), the frequency of use of voice commands on a phone (3), and engaging in auditory and cognitive DDB (4; e.g., listening to the radio, talking with a passenger).
Impact of Residential Environment
Compared with participants living in suburban environments, and controlling for other variables, the DDB patterns of people living in small cities or towns were indistinguishable. In contrast, compared with people living in suburban areas, people living in urban areas were more likely to report higher DDB for all measures except for the frequency of use of voice commands on a phone (3). The results for people in rural areas were more distinctive; they were not different from suburban residents around DDB related to overall average DDB, total count of DDB engaged in at least rarely, or the use of voice commands on a phone (3). Rural residents were less likely to engage as frequently in DDB related to manual phone use (1) or non-technological DDB (2); they were more likely to engage more frequently in DDB around auditory and cognitive distractions (4) and eating and drinking (5).
Discussion
The results of the analysis indicate that there are some distinctions in the effects of different AVT factors and risk attitudes on various types of DDB. Specifically, convenience features emerged as the most consistently significant factor, affecting multiple types of DDB, although driver-assist and safety features also had positive impacts on some forms.
There are also effects of individual attitudes on DDB. Notably, the individual risk measures had relatively low correlations with each other, but in the regression model people’s overall risk orientations and their self-assessments of their risky behavior within the driving domain each independently predicted levels of different DDBs. This result highlights the importance of potentially considering multiple measures of people’s orientations toward risk. For example, people may consider risk-taking behavior to encompass broader aspects of their lives or extended time frames, while they may view risky driving as a specific behavior confined to driving situations. Perceived risks that are seen as daunting or unfamiliar are frequently overestimated, whereas risks that are perceived as familiar and within one’s control, such as driving a car, are often underestimated ( 30 ). This disparity in perception could result in people’s different ratings of their own risk behaviors. Regardless, Table 5 indicates that self-assessed risk-taking behavior can predict actual risk-taking behavior (cf. 21 ). Future research should further examine the relationship between these two risk concepts to understand better how general risk orientation is related to self-assessed risky driving.
With respect to other individual characteristics, age had significant impacts on multiple indicators of DDB, with the exception of non-technological DDB (2). Younger drivers generally reported higher levels of DDB relative to older drivers. Somewhat surprisingly, despite women’s lower self-assessment of risky driving behavior and risk-taking in general in comparison to men, controlling for other variables, women were more likely to report engaging in higher levels of DDB overall (mean score and overall number), as well as in the use of voice commands and eating and drinking (DDBs 3 and 5). Some previous research has found few differences between men’s and women’s overall engagement in DDB (e.g., Jazayeri et al. [ 31 ]), but other work has revealed some differences around some forms of DDB, such as women reporting that they engage more in conversations with passengers ( 32 ), or a pattern of women being observed more frequently to be engaged with different forms of electronic device use while driving ( 33 ). Further, there is a distinction between reports of DDBs themselves and crashes resulting from DDB. For example, Jazayeri et al. ( 31 ) found that DDB engagement did not differ by gender, but that “the percentages of crashes associated with distracted driving and its co-occurrences with other behaviors (e.g., driving fast, making an improper turn) are higher for males than females.” Liang and Yang ( 9 ) examined the range of DDB associated with crash events and found that different categories of distractions—defined somewhat differently than in this analysis—were associated differentially with age and gender. In short, simply self-reporting engaging in DDB may not translate to greater risk or overall riskier driving; it may be, for example, that women who are engaging in DDB compensate for this risk in other ways, for example, by driving more slowly. The results here underscore the need for additional research to understand the prevalence of different forms DDB and their co-occurrence with other driving behaviors, including compensatory ones, across different gender and age groups.
Residential environment also was associated with people’s reports of DDB. Notably, living in an urban area was generally associated with more varieties of DDB relative to other living areas, controlling for other variables, despite such areas perhaps representing more complex driving contexts generally that should presumably depress DDB.
Conclusions
Previous research has found that AVT can improve road safety, as measured by vehicle maneuvering or crashes ( 34 ). In this research, the focus was on how the presence of different forms of AVT, as well as individual drivers’ risk attitudes, affected DDBs which have been shown to be associated with greater crash risk ( 28 , 29 ). The results of the analysis suggest that drivers’ use of these AVT may not optimally support safer driving as, in particular, the presence of AVT convenience technologies in the vehicle were typically associated with higher levels of DDB, with the exception of the cases of manual phone use or non-technological DDB (2). Safety AVT were associated with a greater frequency of reports of DDB around non-technological DDB (2) and use of voice commands (3), and driver-assist AVT were positively associated with more frequent reports of voice command use on a phone DDB (3).
Technology alone does not account for people’s DDB, however, drivers’ individual risk attitudes—and willingness to take risks in general or to characterize themselves as engaging in more risky driving behaviors—are positively associated with reports of greater engagement in DDB tasks. While other individual factors, notably age, gender, the presence of teens in the household, and residential location, also affected DDB reports, risk attitudes demonstrated a consistent and expected relationship with reports of greater DDB.
Convenience features may encourage DDB in various ways, as these features enable people to connect to their phones, to the vehicle itself, and to other technologies while they are driving. Such features may indirectly increase drivers’ phone use, as well as enable them to access other distractions more easily (e.g., online content, videos, etc.). Convenience features may even encourage greater multitasking during driving, as greater connectivity may enable people to have their hands available to engage in other DDBs such as grooming or eating and drinking while at the same time carrying on a phone conversation or navigation of the vehicle or phone content. Convenience features are, to some degree, designed to cause distraction from the actual driving task and as well as to serve as distractions themselves, relative to driver-assist and safety features that may more directly offer support to the primary driving task.
Overall, as AVTs continue to evolve and their use within the fleet grows, there is a need for additional research to understand not only how and under what conditions drivers use these technologies, but also how the use of different features may have distinct effects on different patterns of DDB and in turn on drivers’ risk for crashes.
Footnotes
Acknowledgements
The authors thank Dr. Pnina Gershon for her helpful suggestions on this manuscript.
Author Contributions
The authors confirm contribution to the paper as follows: study conception and design: D’Ambrosio, Lee, Coughlin; data collection: D’Ambrosio, Coughlin; analysis and interpretation of results: Schneider, D’Ambrosio, Lee; draft manuscript preparation: Schneider, D’Ambrosio. All authors reviewed the results and approved the final version of the manuscript.
Declaration of Conflicting Interests
The author(s) declared no potential conflicts of interest with respect to the research, authorship, and/or publication of this article.
Funding
The author(s) disclosed receipt of the following financial support for the research, authorship, and/or publication of this article: The MIT AgeLab gratefully acknowledges support from The Hartford for the survey data collection.