
Abstract
The widespread nature of cell phones and connected vehicle navigation systems has led to the development of commercially available probe-based traffic data products. This study assesses the accuracy of annual average daily total traffic, truck traffic, medium-duty truck traffic, and heavy-duty truck traffic volumes obtained using probe-based traffic activity indices from a North American company called StreetLight Data (StL). The probe-based estimates were compared with 2019, 2020, and 2021 volumes at eleven continuous count sites and 2019 volumes at twenty-nine short-duration count (SDC) sites in the Winnipeg Metropolitan Region. The results showed reasonable agreement between the ground truth and probe-based total traffic estimates with mean absolute percent errors (MAPEs) ranging from 8.8% to 22.1% across the study years. The medium-duty truck estimates had larger errors than total traffic with MAPEs of 29.9% to 37.5%. Despite having higher volumes than medium-duty trucks, heavy-duty trucks had the smallest probe data sample and largest errors with MAPEs of 56.6% to 96.4%. Benefiting from its larger sample size, the StL medium-duty truck index was found to be a better predictor of heavy-duty truck traffic than the heavy-duty truck index. Further, the total truck volumes estimated using only the medium-duty index were more accurate than those taken as the sum of the medium and heavy-duty truck volumes obtained using their respective indices. Finally, the percent differences for the 2019 annual average daily total traffic and truck traffic estimates at the SDC sites were comparable when only the medium-duty index was used for truck volume estimation.
The procurement of accurate network-wide traffic volume estimates is a common goal of traffic monitoring programs. Truck volumes are of particular interest as they are a fundamental input for a variety of transportation engineering planning, design, operation, and maintenance applications. Compared with traditional traffic counts, probe-based data have the potential to significantly increase the spatial and temporal coverage of truck traffic volume estimates. As probe-based data are produced by smartphones and on-board devices, the data may be available anywhere vehicles travel. Probe and contextual data are now used by third-party data firms to create traffic volume estimates that users can purchase. These firms have the potential to provide jurisdictions with traffic volume estimates on any roadway with limited effort by users. However, before jurisdictions commit to purchasing and incorporating these third-party data products into their traffic monitoring programs, it is important to evaluate their quality ( 1 ). This study assesses the accuracy of total and truck traffic volume estimates derived from probe data in Manitoba, Canada.
Background
Annual average daily traffic (AADT) and annual average daily truck traffic (AADTT) are fundamental measures of traffic volume at a site. Permanently installed classification count equipment, such as weigh-in-motion (WIM) devices and automatic vehicle classifiers (AVCs), are routinely used to determine the AADTT on roadways. However, it is not feasible to install continuous count equipment on all roads within a network. Traditionally, short-duration counts (SDCs) are conducted to supplement the spatial coverage of continuous count data, but SDCs do not capture the temporal variability of traffic and the number of SDCs that can be conducted is still limited. If the SDCs are conducted using intrusive equipment, the count locations are also limited by safety risks, traffic volumes, and vehicle speeds ( 2 ). In Manitoba, truck traffic on unmonitored road segments has been estimated by transferring volume data and classification distributions from nearby count sites or a group of sites with similar truck traffic characteristics ( 3 ); however, these estimates contain error and their accuracy is unquantified. Boile et al. developed a linear model to estimate truck volumes on unmonitored roads in New Jersey but creating such a model is resource intensive and requires several datasets ( 4 ). Because of these shortcomings, researchers and government agencies have investigated whether non-traditional data sources with greater spatial and temporal coverage, such as probe data, can be used to enhance system-wide truck volume estimation.
Although jurisdictions could use probe data directly to develop models that estimate truck volumes, there are third-party data firms that buy, process, and integrate probe and contextual data to produce proprietary traffic data products that they offer through a subscription procurement model. AADT and AADTT estimates from these firms are now accepted by FHWA for Highway Performance Monitoring System AADT reporting ( 2 ). An investigation by Grande et al. of the correlation between HERE Technologies’ 2018 speed-based probe counts and truck volumes in Manitoba showed promising results ( 5 ); however, HERE Technologies only provides post-processed probe-data, not traffic volume estimates. In contrast, the North American third-party data provider StreetLight Data (StL) uses machine learning algorithms to produce traffic volume estimates from commercial vehicle global positioning system (GPS) data, location-based services (LBS) data, census data, and weather data. Using StL’s online data platform InSight, users can select from nine different analysis types with different output types and metrics. Their outputs include total traffic volume estimates, total traffic activity indices, and truck activity indices. StL’s data source for truck indices is GPS data from connected commercial trucks, whereas the total traffic indices are based on LBS data. StL truck indices represent the relative volume of truck activity on a road and are normalized with continuous count data. In Canada, a continuous count site on Highway 401 east of Toronto is used for normalization and a truck index of 500,000 corresponds to the average daily traffic at this site. Though the StL truck indices are not a direct estimate of truck volume, known truck volumes from local continuous count data can be used to scale the indices into volume estimates. Before the summer of 2022, StL only provided a single index for all trucks in Canada. Since then, the single truck index was removed for all time periods and replaced with separate medium-duty and heavy-duty truck indices. The truck weight classes within their dataset are defined using the following gross vehicle weight ratings (GVWRs):
Medium-duty: 14,001–26,000 lb (6,351–11,793 kg); GVWR class 4–6 (buses and trucks with three or fewer axles)
Heavy-duty: 26,001+ lb (11,794+ kg); GVWR class 7–8 (trucks with four or more axles)
Although axle information is provided with the GVWR classes, weight classes do not directly align with FHWA axle-based classes used by continuous counters ( 6 , 7 ).
StL has been the subject of several recent studies, including a pooled-fund study by FHWA in the United States ( 7 – 14 ). In general, the studies showed that at low volumes (AADT less than approximately 5,000), StL tended to over-estimate with higher percent errors (PEs) ( 7 , 9–13). Table 1 summarizes the general objectives and key findings of these studies.
Findings of Past Studies of StL Traffic Volumes
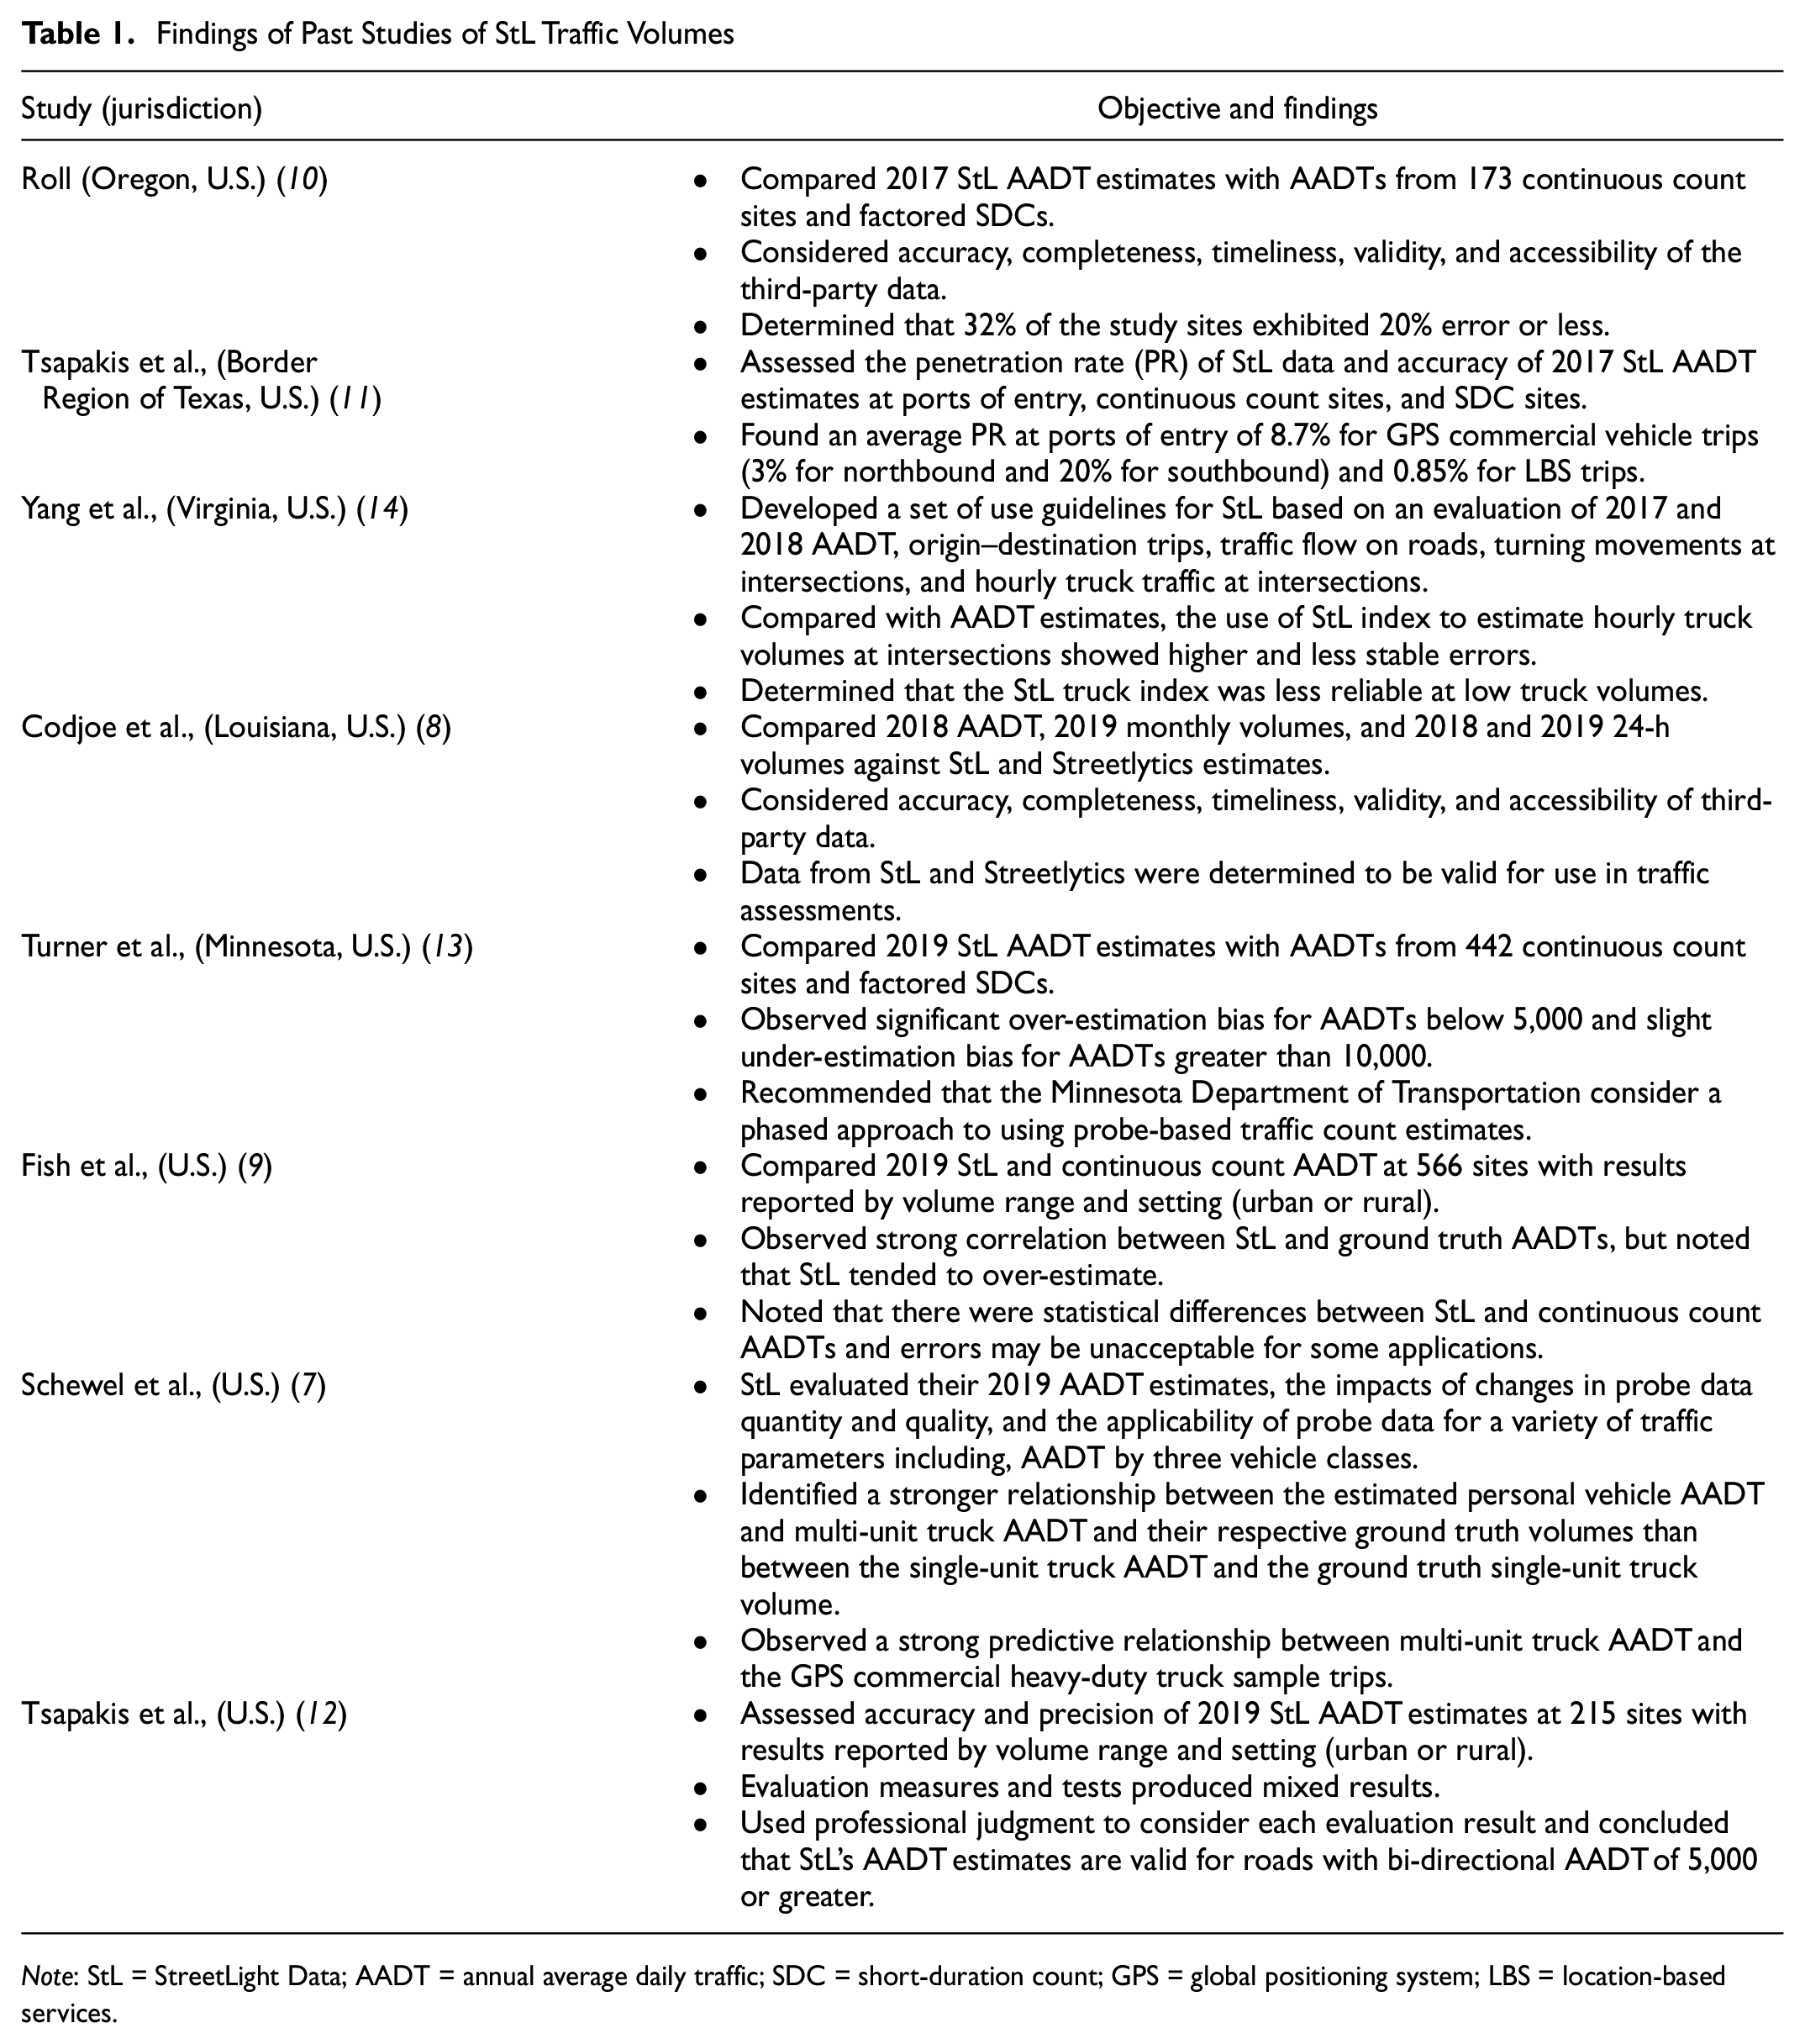
Note: StL = StreetLight Data; AADT = annual average daily traffic; SDC = short-duration count; GPS = global positioning system; LBS = location-based services.
A survey of operations and planning personnel from fourteen transportation agencies in the United States indicated that the most desired output from probe data, besides total traffic volume, was the percentage or volume of heavy truck traffic ( 15 ). Despite the interest in truck volumes, most of the published assessments of StL’s traffic volume estimates focused on total traffic. The research by Yang et al. only assessed hourly truck volume estimates at seventeen intersections within a small area of less than 4 square miles (10 square kilometers) ( 14 ). In addition, the study was conducted when only a combined total truck activity index was provided by StL. The study conducted by StL tested the applicability of StL’s probe data for estimating AADT by vehicle type by creating models with multiple predictors ( 7 ). However, these models are not available to users, and they did not assess the truck traffic products currently provided by StL. Moreover, no publicly available assessments of StL’s total or truck traffic metrics have been conducted in Canada where it is expected that the probe data sample sizes, biases, and representativeness may vary from the United States. Other sources of error within the StL volume estimation process include the handling of erroneous or outlier data, and process of assigning device pings to roads, which is affected by the ping rate and spatial accuracy of pings ( 7 , 16 ).
With third-party data providers now offering paid access to probe-based traffic data products, it is important to investigate whether they can deliver truck traffic estimates of comparable quality to traditional estimation methods. The findings of this study will help traffic monitoring practitioners understand how such products might enhance more traditional methods of obtaining truck volume data.
Research Objectives and Scope
This study evaluates the accuracy of StL truck traffic metrics by comparing them with traffic volumes obtained from permanently installed continuous classification count devices in Manitoba, Canada. Specifically, this study sought to answer the following research questions:
How do AADT estimates produced by scaling StL total traffic activity indices compare with ground truth AADT volumes from continuous count data?
How do AADTT estimates produced by scaling StL medium-duty and heavy-duty truck activity indices compare with ground truth AADTT volumes from continuous count data?
How do the errors of the scaled StL AADTT estimates vary by truck volume?
Can truck volume estimates be improved by manually scaling StL activity indices?
How do the AADT and AADTT estimates produced by scaling StL indices compare with estimates obtained from SDCs?
Geographically, the comparative analysis is limited to primary highways located in the Winnipeg Metropolitan Region in Manitoba, Canada, which covers an area of approximately 3,000 square miles (7,800 square kilometers) ( 17 ). The 2019, 2020, and 2021 data from eleven bi-directional continuous count sites were used as ground truth data for comparison with the scaled estimates from StL.
Methodology
The approach used to conduct this study included two phases: traffic data preparation and StL data analysis.
Traffic Count Data Preparation
In Manitoba, continuous classification count data are collected at sites with permanently installed count equipment (Level 1), total traffic volume data are collected twice per year for 48 h at select SDC sites, and short-duration classification count (SDCC) data are collected at select intersections for 14 h durations. SDC sites on road segments with classification data from an intersection count are classified as Level 2, whereas SDC sites with no classification data are classified as Level 3.
Manitoba Transportation and Infrastructure provided raw hourly classification count data with notes about data quality for the eleven bi-directional continuous count sites (twenty-two site-directions) used in the study. Nine sites had AVCs, one site had WIM devices, and one site had WIM devices in the drive lanes and AVCs in the passing lanes. Following the Manitoba Highway Traffic Information System (MHTIS) data cleaning process, erroneous hourly data were omitted and any days with two or more hours of missing data were removed. The cleaned hourly data were then summed by class for each site-direction to provide daily volumes. Next, FHWA classes 4–6 (buses and trucks with three or fewer axles) and 7–13 (trucks with four or more axles) were summed to give medium-duty and heavy-duty daily truck volumes, respectively. Using the daily volumes, ground truth estimates of AADT, AADTT, annual average daily medium-duty truck traffic (AADMT), and annual average daily heavy-duty truck traffic (AADHT) were calculated using the American Association of State Highway and Transportation Officials (AASHTO) method outlined in the FHWA Traffic Monitoring Guide ( 2 ). The AASHTO AADT method averages daily volumes by day-of-week and month-of-year according to Equation (1).
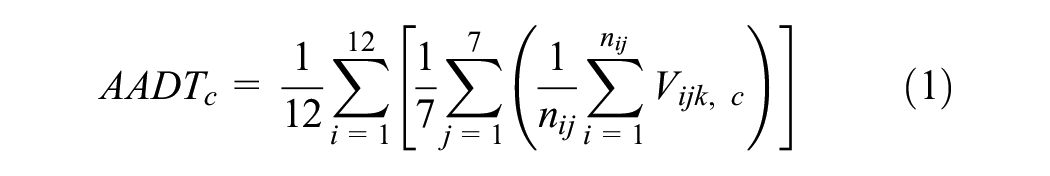
where
The AASHTO AADT formulation requires daily volumes for at least one of each day of the week within each month. If a site-direction met this requirement, it was considered to have sufficient data. Of the twenty-two site-directions, fifteen had sufficient data for both AADT and AADTT calculation in 2019, whereas seventeen had sufficient data for both AADT and AADTT calculation in 2020 and 2021. The continuous count site details, including the counter type, direction of travel, data availability by site-direction, and average percentage of trucks to total traffic by weight class are summarized in Table 2. Figure 1 shows the annual average daily volumes for each direction of travel at the sites.
Level 1 Site Details
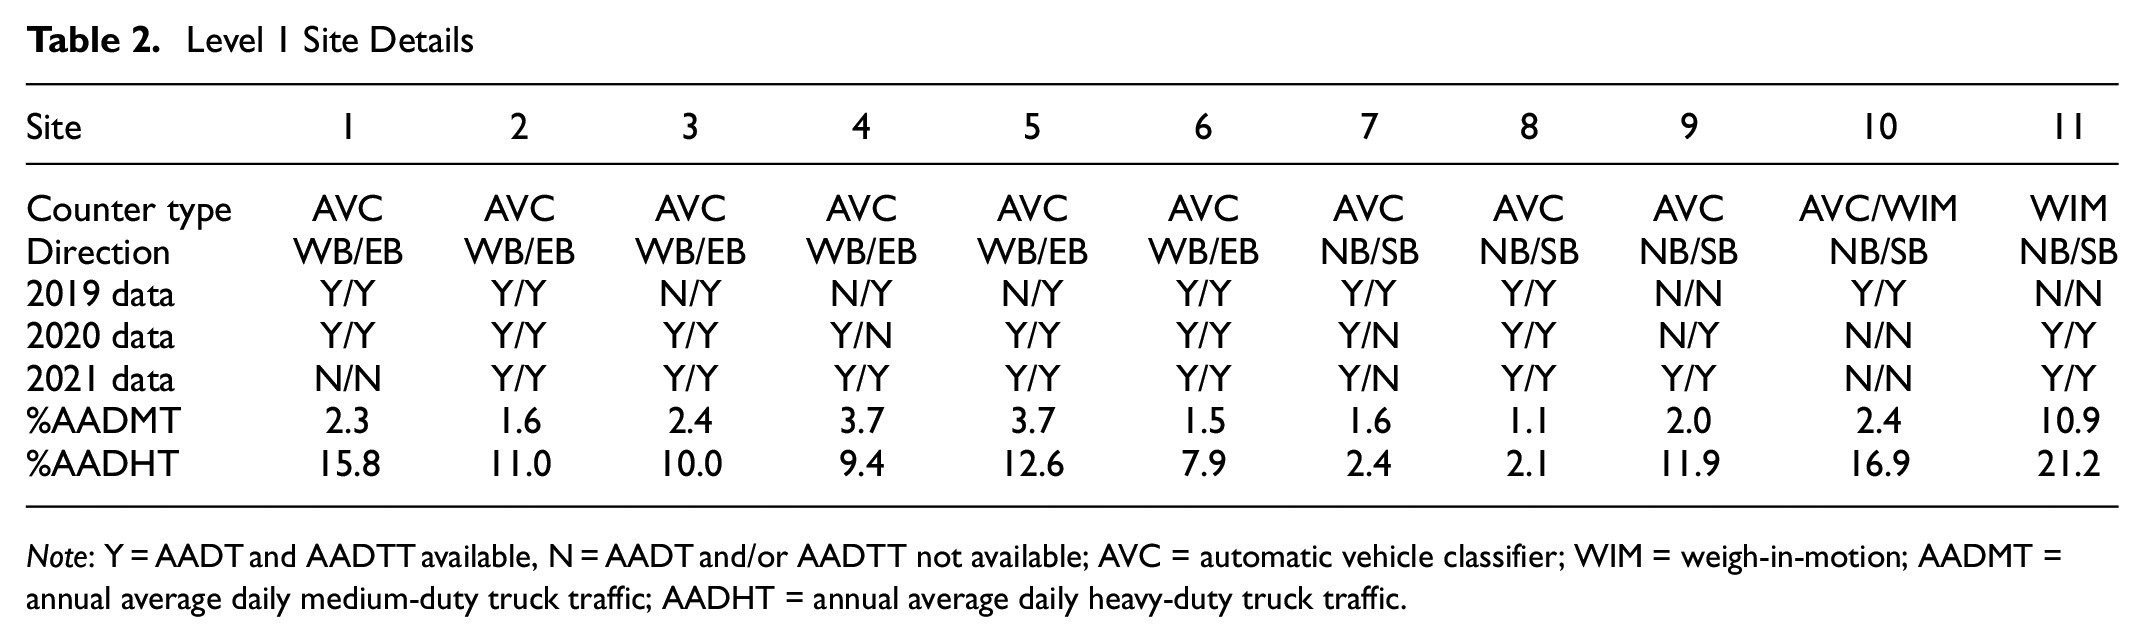
Note: Y = AADT and AADTT available, N = AADT and/or AADTT not available; AVC = automatic vehicle classifier; WIM = weigh-in-motion; AADMT = annual average daily medium-duty truck traffic; AADHT = annual average daily heavy-duty truck traffic.
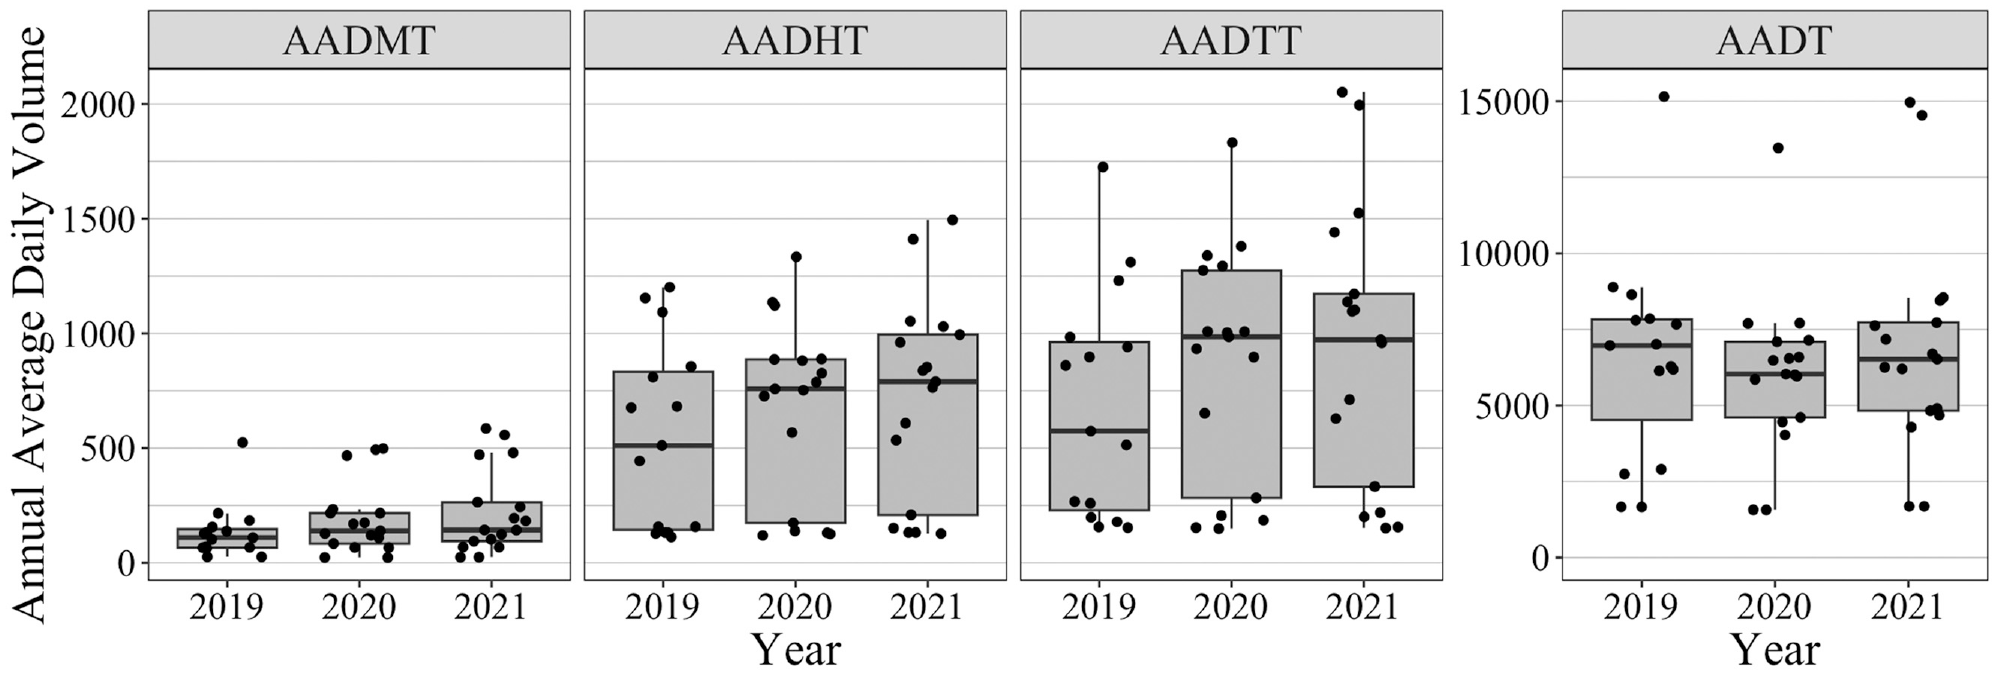
Directional annual average daily volumes for Level 1 sites.Note: AADMT = annual average daily medium-duty truck traffic; AADHT = annual average daily heavy-duty truck traffic; AADTT = annual average daily truck traffic; AADT = annual average daily traffic.
The most recent AADT and AADTT estimates available at the 29 Level 2 and 3 sites included in the study are for 2019. However, the year of the SDC data used to compute the 2019 volume estimates varied across the sites as Manitoba does not collect data at SDC sites on an annual basis. Following a similar methodology to that described in Reimer and Regehr ( 18 ), continuous count sites in Manitoba were grouped into updated truck traffic pattern groups (TTPGs) and truck traffic classification groups (TTCGs) using 2019 data to facilitate the estimation of AADTTs at the Level 2 and 3 sites, respectively. It is known that the AADT and AADTT estimates from SDCs are less accurate than those from the continuous count sites as there are multiple sources of error in the factoring process ( 19 ). As a result, the estimates at the Level 2 and 3 sites are not considered to be ground truth values. Although directional estimates were available at the continuous sites, the AADT and AADTT estimates obtained in 2019 for the Level 2 and 3 sites are bi-directional. A summary of the count site data by level is provided in Table 3, while Figure 2 shows the locations of all sites.
Count Site Summary by Level
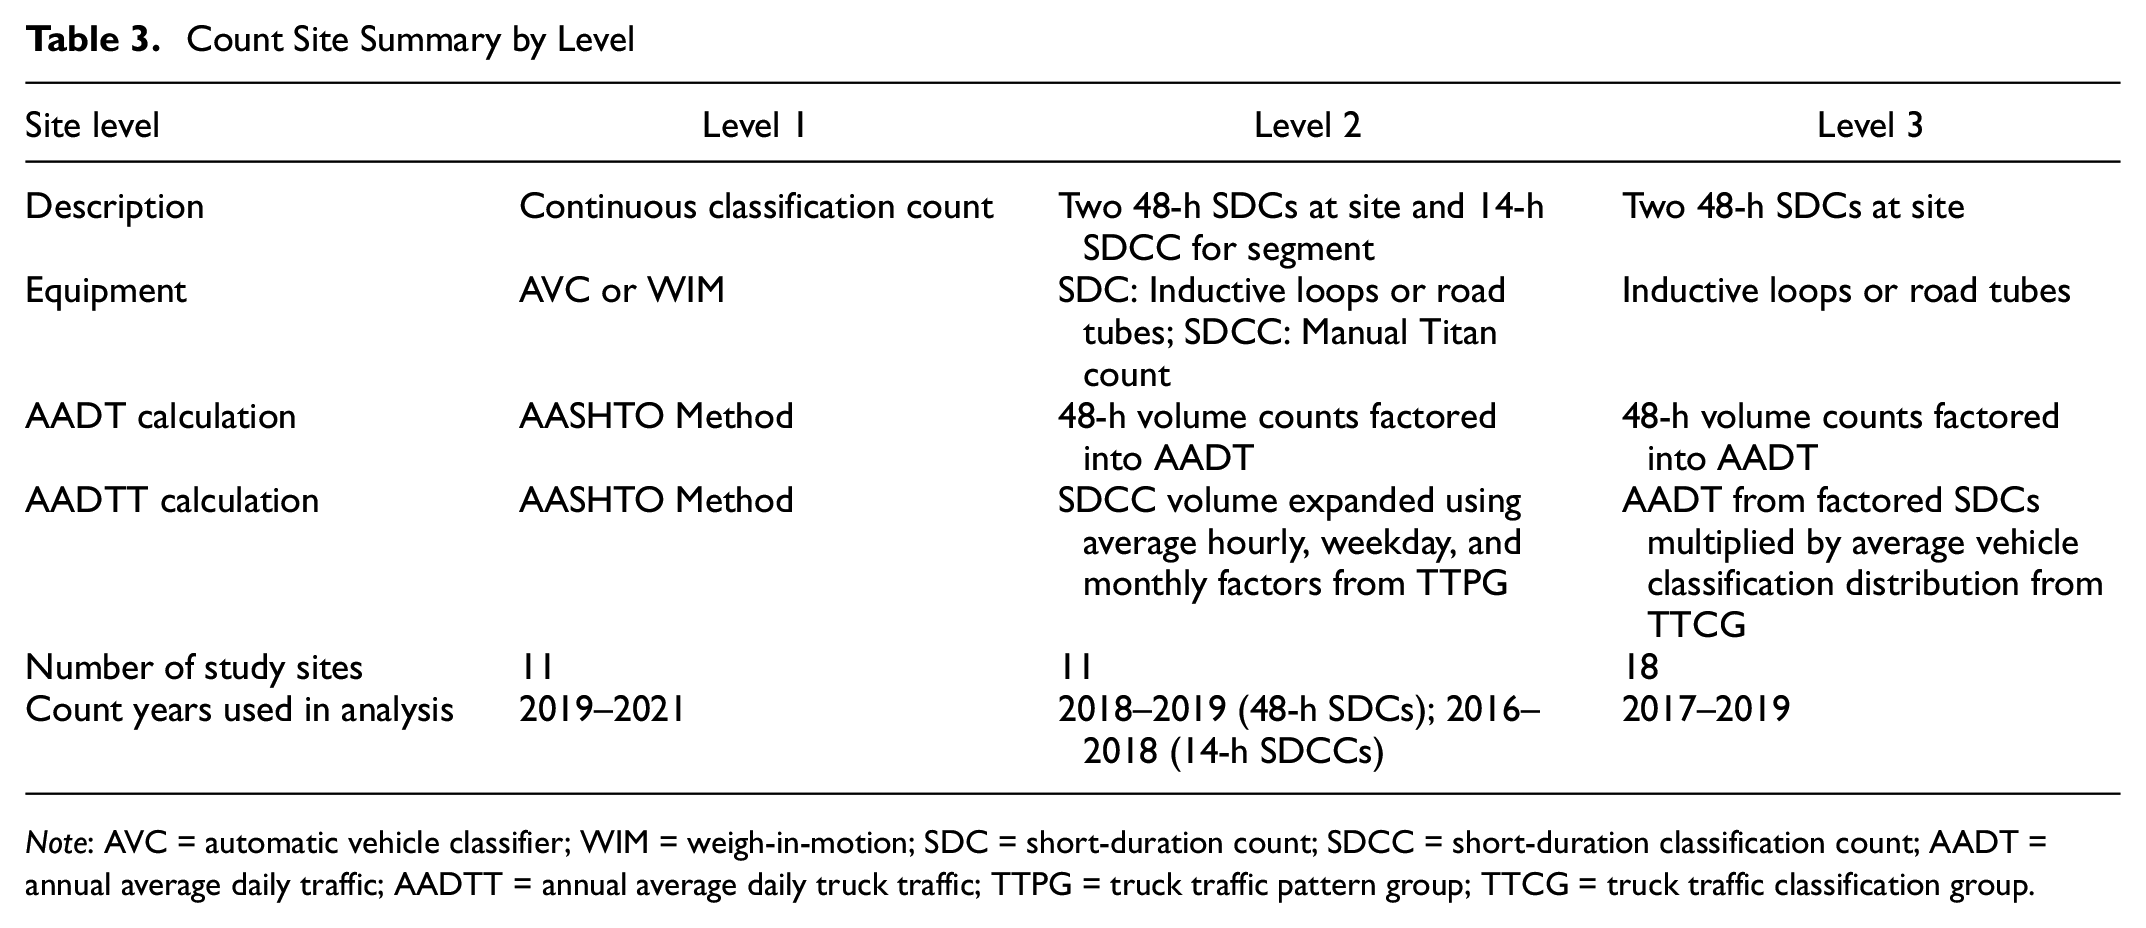
Note: AVC = automatic vehicle classifier; WIM = weigh-in-motion; SDC = short-duration count; SDCC = short-duration classification count; AADT = annual average daily traffic; AADTT = annual average daily truck traffic; TTPG = truck traffic pattern group; TTCG = truck traffic classification group.
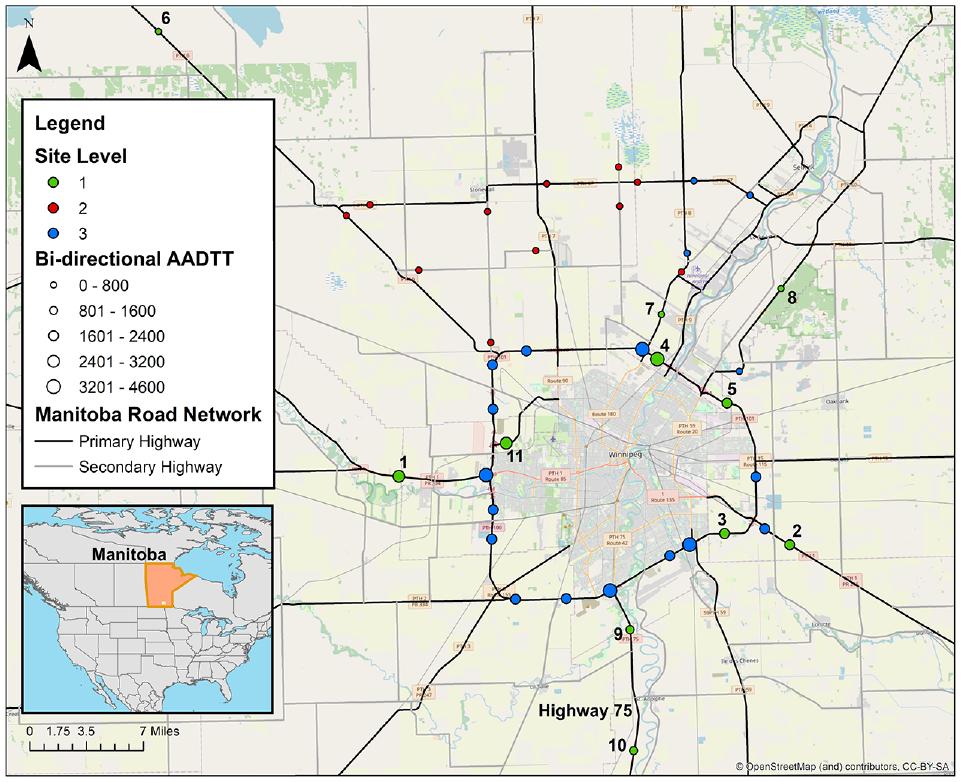
Location of count sites by level.Note: AADTT = annual average daily truck traffic.
StreetLight Data Analysis
StL allows users to create zones that represent the area or road they would like to analyze. Unlike a traditional traffic counter, StL zones can be many shapes and sizes. For each of the forty count sites, an approximately rectangular polygon zone was manually drawn in ArcGIS and uploaded to InSight. Each zone was drawn to capture both sides of the highway without including any adjacent service roads or ramps near the counting device. The zones were set as pass-through, which causes the traffic parameters to be based on trips through the zones. The direction of the roadway was manually added to each zone, and the Level 1 zones were set to uni-directional so that each direction of travel was analyzed separately. The AADT and percentage of medium-duty and heavy-duty trucks obtained from the continuous count data were added to the zones in InSight for each analysis year. StL provides a built-in function called single factor calibration that uses this user-entered ground truth data to scale the StL indices into volumes. StL states that the use of ten to twenty calibration zones is best with a recommended minimum range of six to ten zones. For this study, eight to nine zones were used for calibration in each year. Although increasing the number of calibration zones beyond the recommended minimum does not guarantee an improvement in the accuracy of the StL-based estimates, having more calibration sites would provide the opportunity to group them based on shared characteristics, similar to traditional TTPGs. As disaggregating the eight to nine zones into their TTPGs would result in very small groups, all Level 1 sites were included in the calibration dataset for the Level 2 and 3 sites. For the Level 1 sites, leave-one-out cross-validation was used to scale the StL indices into volumes and evaluate the errors. Using this method, each Level 1 site was left out of the calibration dataset when its indices were scaled into a volume. All three years of medium-duty and heavy-duty data were separately scaled using StL single factor calibration as the indices from different data periods and weight classes cannot be directly compared. The StL single factor calibration process for a single year
The volume factor (VF) is computed as the ratio of the ground truth annual average daily volume to the StL index (SI) for each site-direction

2. Outlier site-directions are removed, leaving
3. The scaling factor (SF) for site

4. The estimated annual average daily volume

Although StL only provides indices for trucks, they have developed Canada-wide AADT models that were trained using continuous count data from multiple provinces. However, to provide a fair comparison between the StL total traffic and truck traffic estimates, the AADTs were estimated by scaling StL total traffic indices using single factor calibration in the same way as trucks. This also kept the methodology consistent across the study years as StL has not developed a Canadian AADT model for 2021. In addition, the use of StL total traffic indices allowed for a completely independent comparison of the StL estimates and Manitoba AADTs, as Manitoba’s 2019 AADTs were included in the training dataset for the 2019 and 2020 StL AADT models.
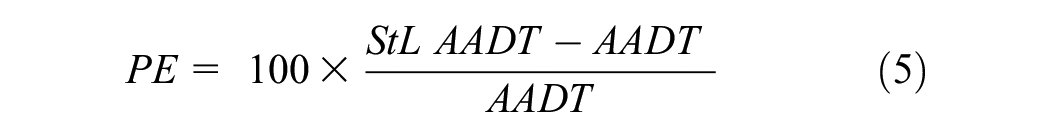
The error metrics used to compare the scaled StL AADTs with the ground truth values at Level 1 sites are PE, median percent error (bias), mean absolute percent error (MAPE), and median absolute percent error (MdAPE). These metrics were selected as they were deemed appropriate for the nature and sample size of the dataset and facilitated comparison with similar studies. The PE for each site-direction was calculated according to Equation (5). The sign of the median PE indicates the direction of any bias, but it is not a good measure of overall accuracy if the error distribution is symmetric ( 9 ). Both MAPE and MdAPE provide an indication of the typical error; however, MdAPE is less sensitive to outliers than MAPE.
Though the same error metrics were used to compare the AADT and AADTT estimates obtained from SDCs and the StL indices, the errors at Level 2 and 3 sites simply represent the differences between the two estimates.
Results and Discussion
The study results are presented and discussed in the following three sections. Research questions 1 through 3 are answered in the first, question 4 is answered in the second section, and question 5 is answered in the third section.
Evaluation of StL Single Factor Calibration at Level 1 Sites
For StL single factor calibration to provide accurate traffic volume estimates, the volume factors must be consistent across the sites used for calibration and the site of volume estimation. When the medium-duty or heavy-duty volume factor at a site is high, it indicates that the penetration rate (PR) of StL’s commercial GPS data sample for that weight class is low. Figure 3 shows the normalized volume factors by ground truth volume by class group. The volume factors for each year and class group were divided by the corresponding mean volume factor to facilitate comparison.
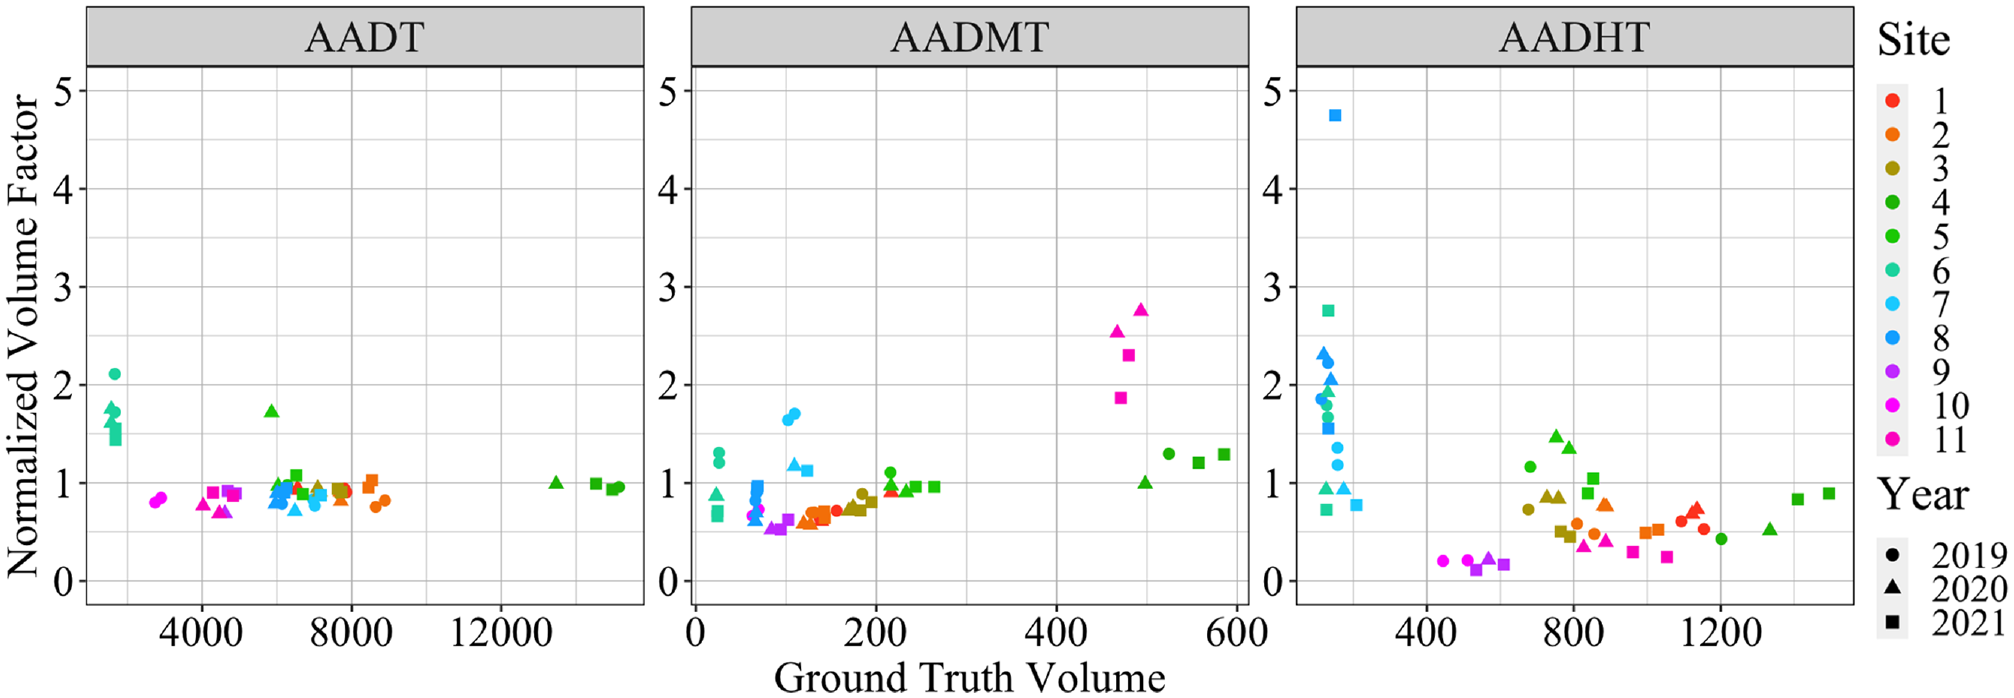
Comparison of normalized volume factors by class group.Note: AADT = annual average daily traffic; AADMT = annual average daily medium-duty truck traffic; AADHT = annual average daily heavy-duty truck traffic.
Figure 3 indicates that the volume factors are more consistent for total traffic than for truck traffic. For Sites 6, 7, and 8, there was a wide range of heavy-duty volume factors at a similar AADHT, which indicates that the StL heavy-duty index has a weak relationship with AADHT at these low volumes. For 2021 in particular, the StL heavy-duty index for the southbound direction was significantly lower than in the northbound direction at Sites 6, 7, and 8, despite the ground truth volumes being approximately the same for both directions. The quality of StL’s truck data sample is affected by the commercial vehicle GPS sample size and any bias in the sample toward certain truck fleets ( 20 ). Although StL does not disclose their data sources, they do state that their truck probe data source is more likely to include commercial trucks that rely on up-to-date fleet management tools than fleets that lag in the adoption of such tools. Trucks with up-to-date technology may not be equally present on roadways with the same volume or classification, which could contribute to the greater variability in StL’s truck sample PR across sites. Sites 9 and 10, which are located on the main link between Winnipeg and the U.S. (Highway 75), had low heavy-duty volume factors, and thus higher heavy-duty truck sample PRs than the other sites. This indicates that StL’s heavy-duty truck sample may also be biased toward fleets that operate in both Canada and the U.S.
As both directions of travel at a site were left out of the calibration dataset when the traffic volume was being estimated there, every site had a unique calibration dataset. Even for the same site, the calibration dataset changed across the study years by reason of varying data availability. As a result, the volume factors that StL identified as outliers and removed from the calibration datasets varied. For AADT, only Site 6 and one site-direction at Site 5 were ever identified as outliers and excluded by StL during single factor calibration. A comparison of ground truth and StL AADTs and corresponding PEs is provided in Figure 4 with the line of perfect agreement shown in black.
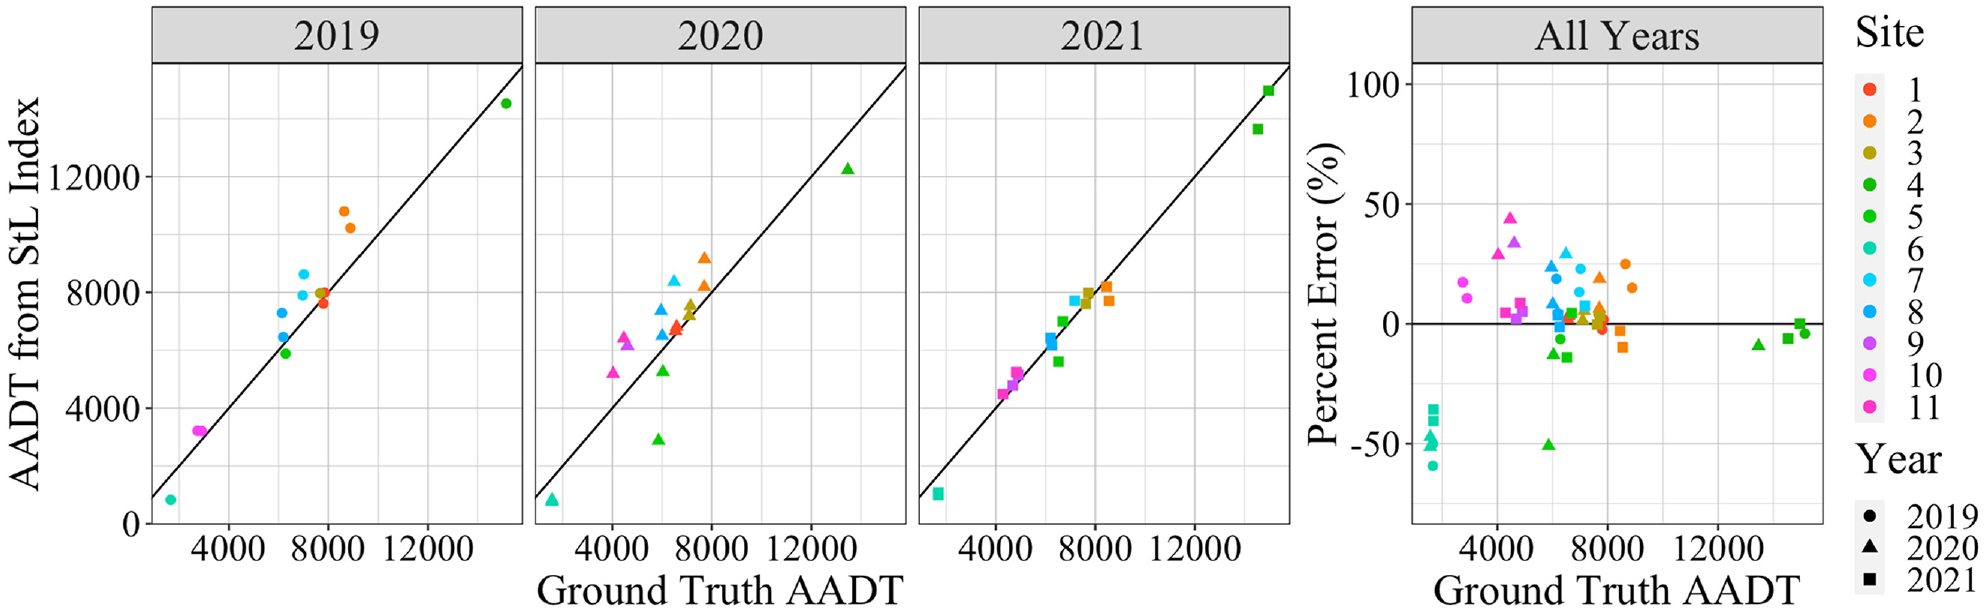
Comparison of ground truth AADT and AADT from StL total traffic index.
Overall, Figure 4 shows that there is reasonable agreement between the StL estimates and ground truth AADTs in each year. When comparing years, the strongest and weakest agreement between StL and ground truth AADTs were observed in 2021 and 2020, respectively. The lowest volume site (Site 6) had considerably larger PEs in 2019 and 2021 than the other sites, which agrees with observations from previous research on StL AADTs. However, several of the previous studies found that StL over-estimated at low volumes, whereas StL under-estimated the volume at Site 6 ( 7 , 9 , 12 , 13 ). In addition to having the lowest AADT, Site 6 is the furthest from the other sites geographically, which could have contributed to the differences in StL’s sample at the site. In 2020, one direction of travel at Site 5 also had a large PE. This large negative error appears to be caused by an issue with StL’s sample data, as the activity index for one direction of travel at Site 5 was nearly twice as large as in the other direction, whereas the ground truth volumes were approximately the same.
Like total traffic, StL medium-duty truck indices were scaled into AADMT estimates using StL single factor calibration. For AADMT, only the high volume factors at Site 7 and 11 were ever classified as outliers by StL’s algorithm and removed from calibration datasets. Figure 5 provides a comparison of ground truth and StL estimated AADMTs and the corresponding PEs.
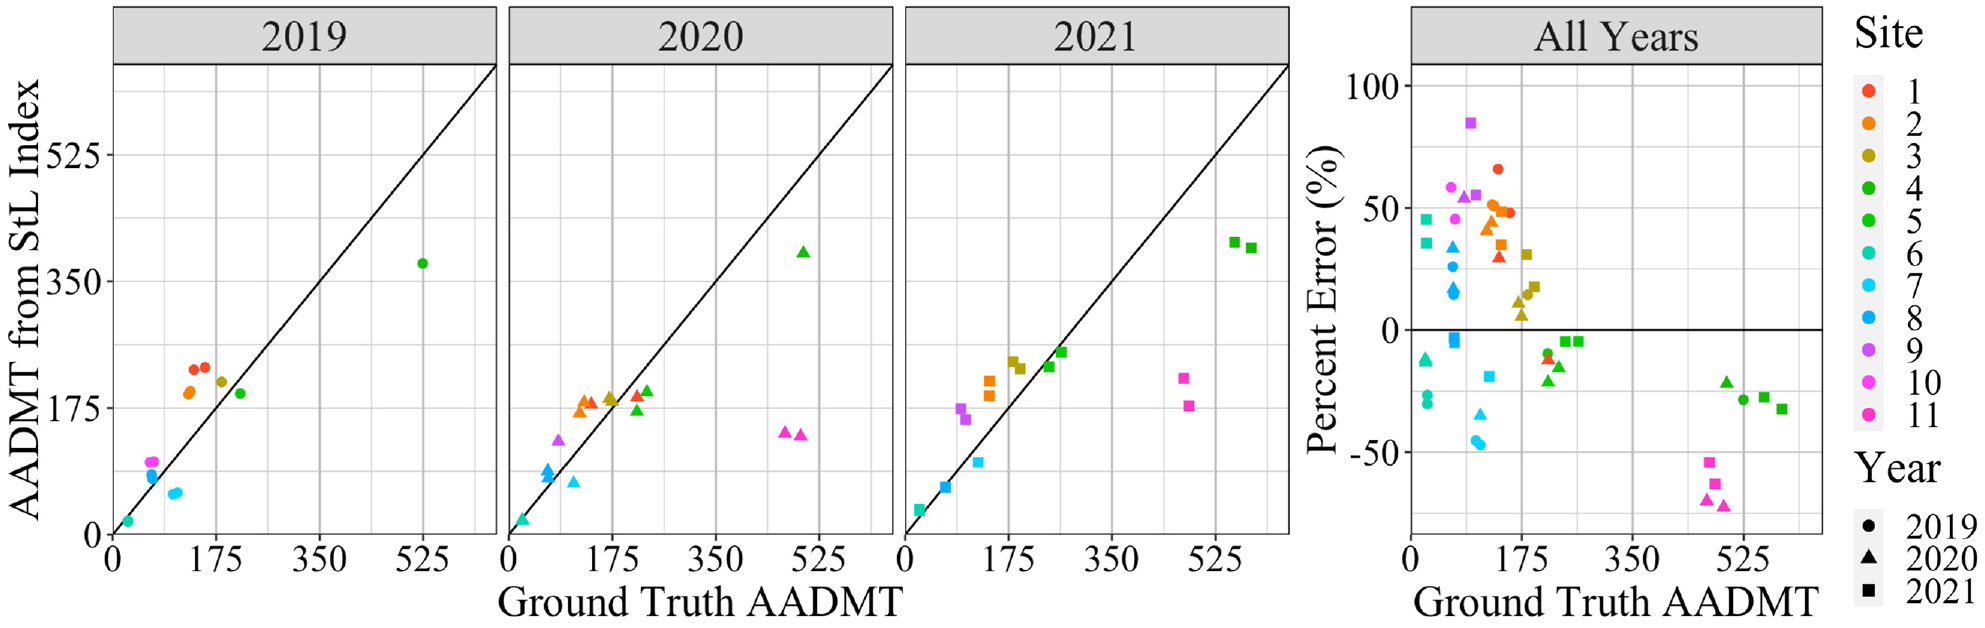
Comparison of ground truth AADMT and AADMT from StL medium-duty index.
As expected, based on the wider range of volume factors in Figure 3, the magnitudes of the minimum and maximum PEs in Figure 5 were higher for medium-duty trucks than total traffic. In addition to biases in StL’s commercial GPS data, it is possible that the discrepancy between the GVWR classes and FHWA class groups is contributing to the error, given that some sites may have more FHWA class 4–6 vehicles classified as heavy-duty than other sites. The most prominent outlier in Figure 5 is Site 11. As presented in Table 2, there was a notably higher percentage of medium-duty trucks at Site 11 compared with the other sites. The additional medium-duty truck traffic at Site 11 could be from a truck fleet not included in StL’s sample that operates more frequently on this highway than the others in the study. Conversely, trucks on Highway 75 appear to be overrepresented in StL’s sample, resulting in over-estimation at Sites 9 and 10. Finally, there was no clear relationship between AADMT and PE nor AADMT and absolute PE.
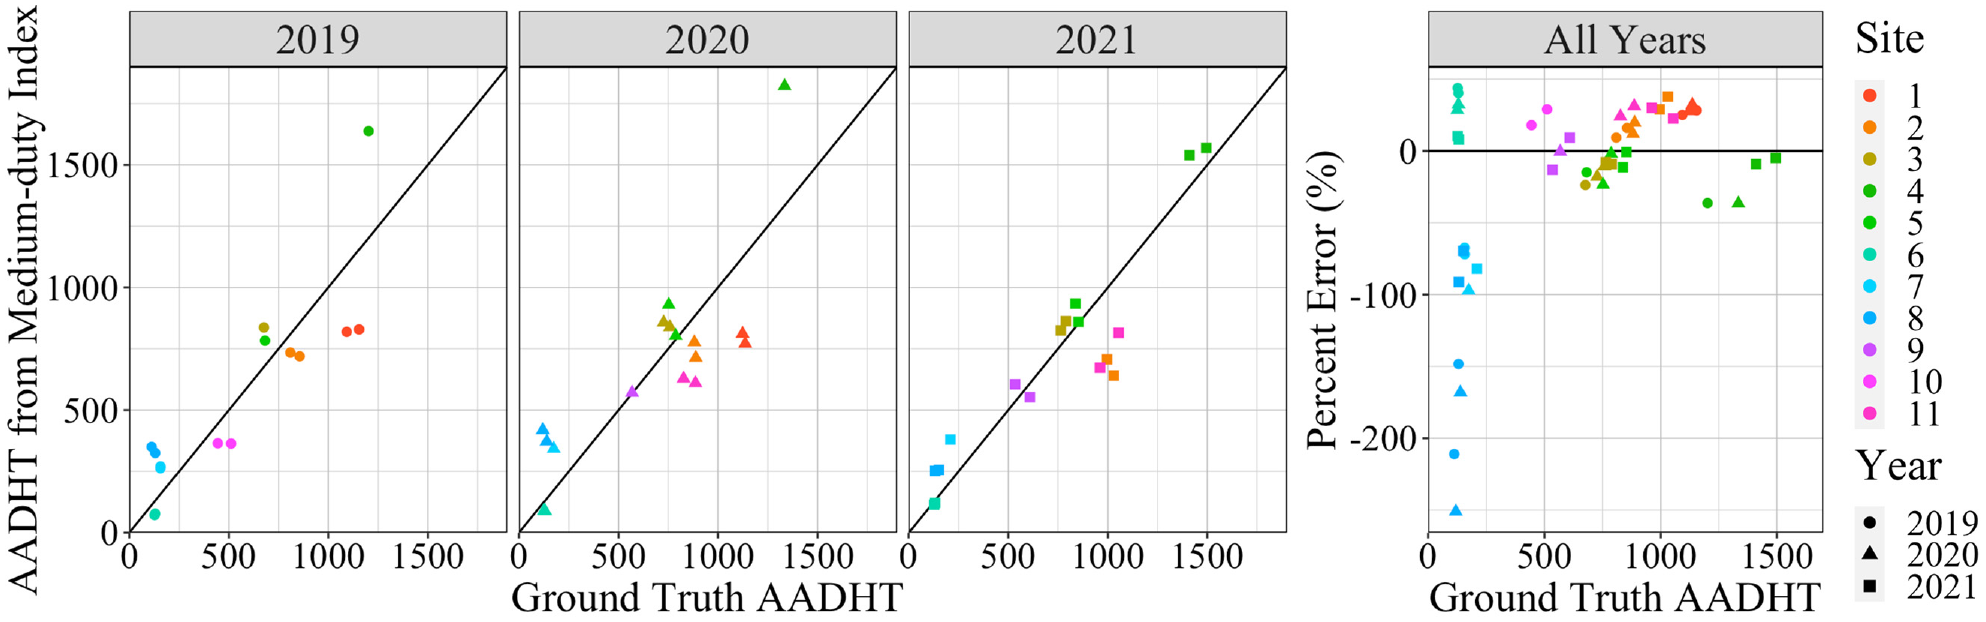
When the AADHTs were estimated from the StL heavy-duty index using single factor calibration, Sites 5, 6, and 8 had volume factors that were identified as outliers by StL. Again, the site-directions excluded from the calibration dataset varied across the sites and years. Figure 6 shows a comparison of the ground truth and StL AADHTs and the corresponding PEs.
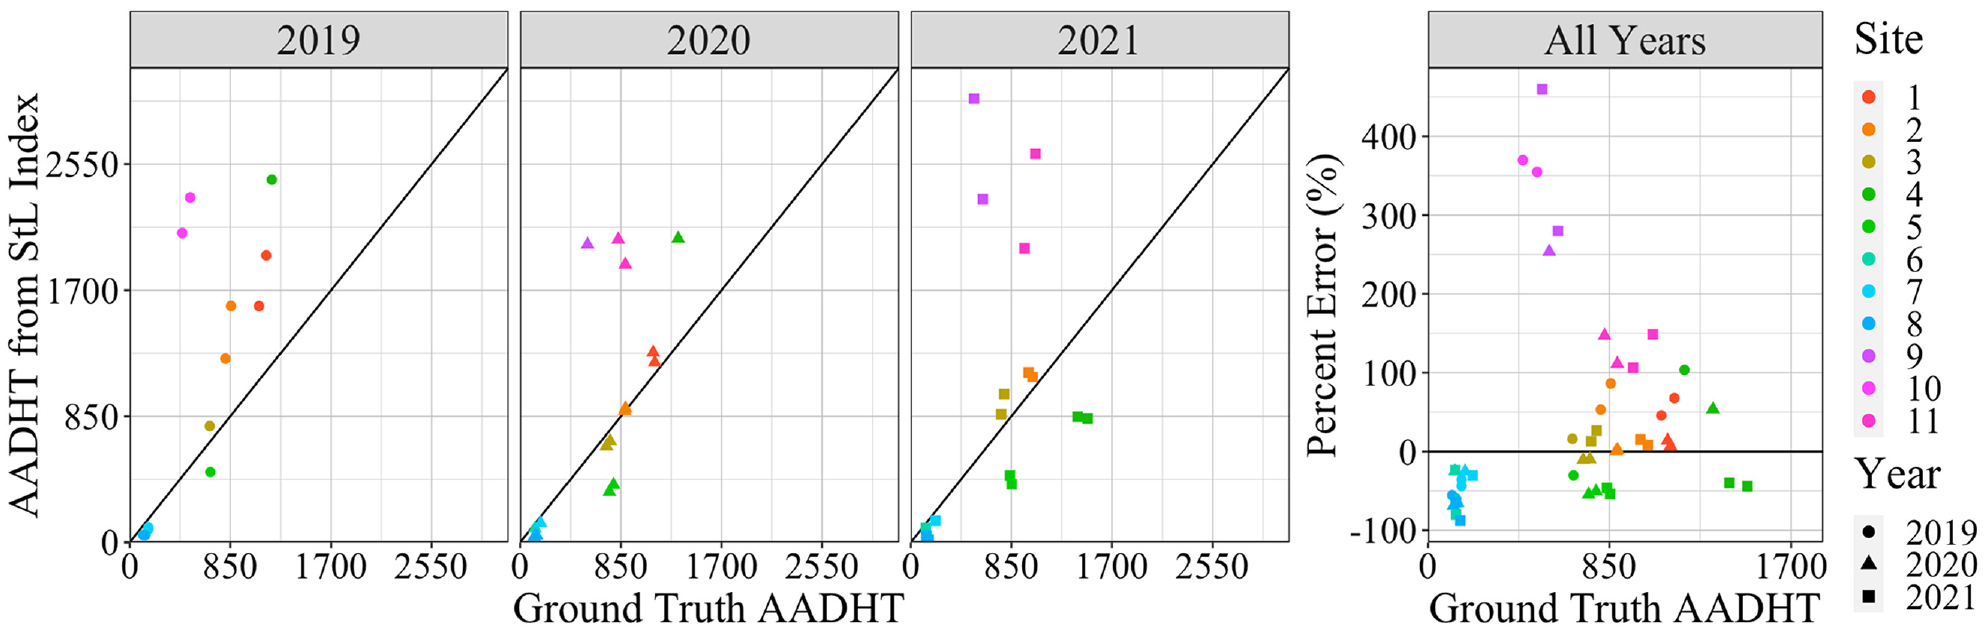
Comparison of ground truth AADHT and AADHT from StL heavy-duty index.
Compared with AADT and AADMT, the AADHT estimates had the largest PEs. As previously discussed, the estimation of AADHT based on the StL heavy-duty index is unreliable at the lowest volume sites. Figure 6 illustrates that there is no discernible relationship between the PE and volume of heavy-duty trucks. On further investigation, there was also no relationship identified between PE and the percentage of heavy-duty trucks to total traffic, percent of heavy-duty trucks to truck traffic, or StL heavy-duty activity index. As before, the large over-estimation at Sites 9 and 10 appears related to bias in StL’s truck data sample.
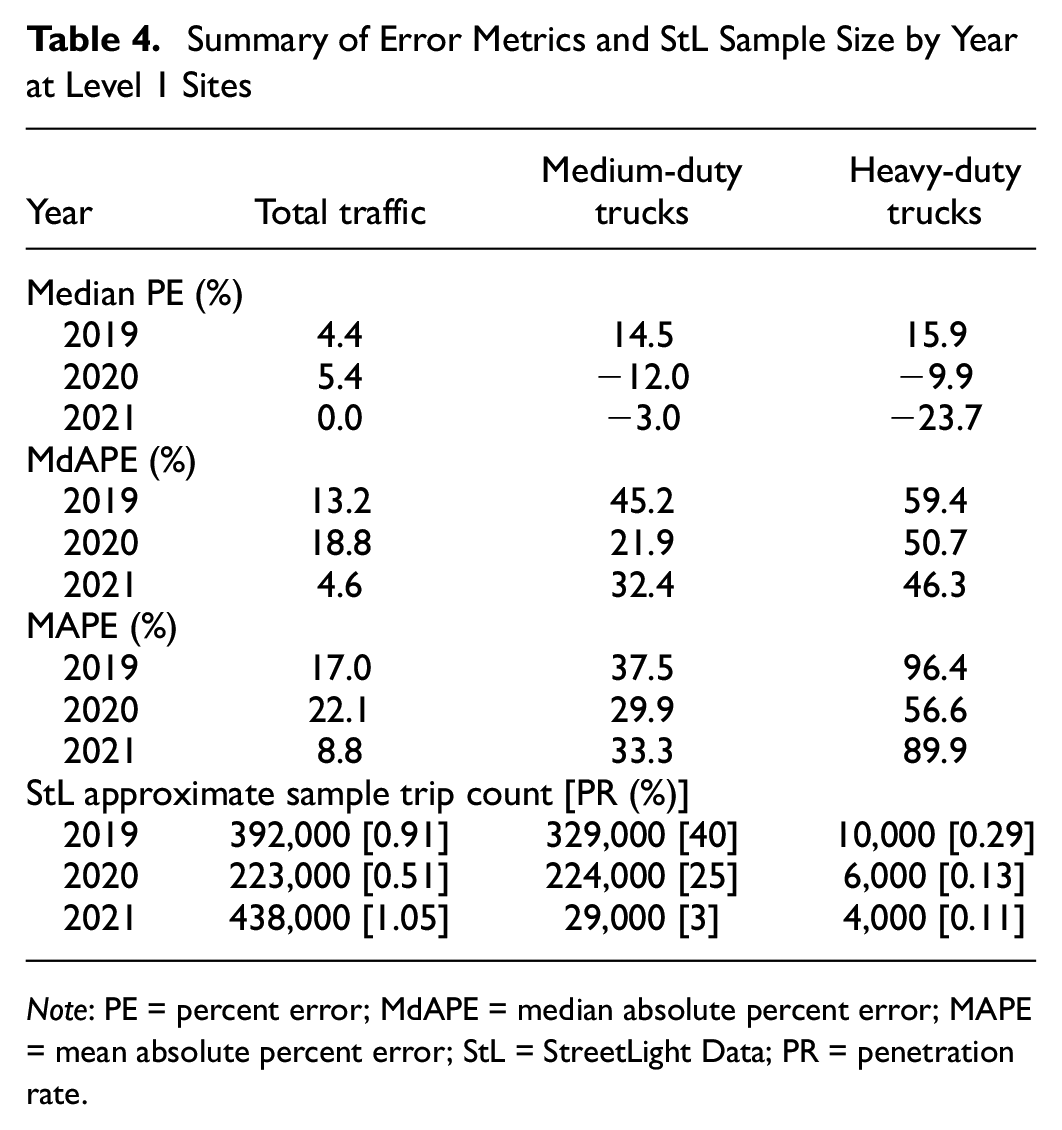
Table 4 provides a summary of the errors, StL sample trip counts, and average PRs by class group and year. The trip count is the total number of sample trips at all eleven sites for the entire year, and the PR for a site is the ratio of the sample trip count to the AADT multiplied by 365. The approximate sample trip counts and PRs were provided by StL.
Summary of Error Metrics and StL Sample Size by Year at Level 1 Sites
Note: PE = percent error; MdAPE = median absolute percent error; MAPE = mean absolute percent error; StL = StreetLight Data; PR = penetration rate.
Table 4 reveals the following:
The PEs had a slight positive bias (approximately 5%) for total traffic in 2019 and 2020, and roughly no bias in 2021. In contrast, medium-duty and heavy-duty truck estimates had both positive and negative biases with larger magnitudes across the three years.
The total traffic MAPE ranged from 8.8% to 22.1%. These MAPEs are comparable to those reported in the studies of StL’s 2019 AADTs in the U.S., and prior work conducted for traditional SDCs in Manitoba by Milligan et al. ( 21 ) and by Grande et al. ( 19 ).
The MAPE and MdAPE for total traffic were the highest in 2020. It is possible that the changes in travel patterns during the COVID-19 pandemic and reduced PRs of StL LBS data contributed to the larger errors in 2020. Overall, the continuous count data showed that passenger car volumes decreased in 2020 whereas truck traffic was the same or higher, which could explain why larger errors were not observed for trucks in 2020.
StL’s LBS data sample increased in 2021 and the commercial GPS sample decreased. Despite the substantial reduction in sample size and average PR for medium-duty trucks in 2021, the MdAPE and MAPE were comparable to those from 2019 and 2020. This indicates that above 3%, a higher PR does not necessarily result in lower errors. It also confirms that the consistency of the PR across the calibration and estimation sites has a larger impact on accuracy than the magnitude of the PR when using StL single factor calibration.
StL recommends a PR for total traffic of 2% or more for calibration zones; however, the results show sufficiently low bias, MdAPE, and MAPE with a PR of just over 1%. Despite the lower PR for total traffic compared with medium-duty trucks, the LBS data used for the StL total traffic indices appear to be more consistent (less biased) across sites, resulting in more consistent PRs and thus more accurate volume estimates. Further, medium-duty trucks account for only 3% of total traffic on average across the sites, so the lower volumes may also be contributing to the higher percent errors compared with total traffic.
The high MdAPE and MAPE for heavy-duty trucks demonstrates that StL single factor calibration does not currently provide reliable AADHT estimates at the study sites. Although medium-duty trucks had lower volumes than heavy-duty trucks at all sites, StL’s data source provides a more consistent and substantially larger sample size for medium-duty trucks, resulting in lower MAPEs and MdAPEs for these trucks.
Evaluation of Manual StL Index Scaling at Level 1 Sites
The results in the previous section were obtained using StL’s built-in single factor calibration. However, there is more flexibility if StL indices are scaled manually. For example, judgment could be used to remove outlier site-directions instead of relying on StL’s unexplained algorithm. In some cases, StL’s algorithm only removed the direction of travel with the highest volume factor at a site, even though it appeared that both directions of travel were outliers. Moreover, an index could be used to predict volumes for other vehicle class groups if there is a strong relationship. As the sample size for medium-duty trucks was significantly larger than that of heavy-duty trucks, the relationship between the medium-duty index and AADHT, and medium-duty index and AADTT was investigated. Overall, it was found that AADHT and AADTT had a stronger relationship with the medium-duty index than the heavy-duty index or the total traffic index. As a result, the quality of AADHT and AADTT estimates obtained by scaling only the medium-duty index was assessed. The medium-duty indices were manually scaled into AADHT volumes using the same method as StL single factor calibration. The only difference was that instead of having AADMT in the numerator of the volume factor, the numerator was the AADHT. No sites were excluded from the manual calibration datasets as none of the volume factors were clear outliers. Figure 7 provides a comparison of the ground truth AADHTs and estimates of AADHT obtained by scaling the medium-duty index.
Comparison of ground truth AADHT and AADHT from medium-duty index.
Except for low-volume Sites 7 and 8, the magnitudes of the PEs of the AADHTs in Figure 7 are lower in all years than the errors of the AADHTs estimated using the heavy-duty index in Figure 6. There were no other significant outliers aside from Sites 7 and 8 and the PEs were relatively consistent between approximately ± 40%.
To obtain AADTT estimates from both truck indices, the AADMTs and AADHTs estimated using StL single factor calibration were summed. To give an alternative estimate of AADTT, the AADMT and AADHT obtained by manually scaling the medium-duty index were summed. A comparison of the errors of the AADHT and AADTT estimates from the two methods are tabulated in Table 5.
Comparison of Error Metrics for AADHT and AADTT by Estimation Method and Year
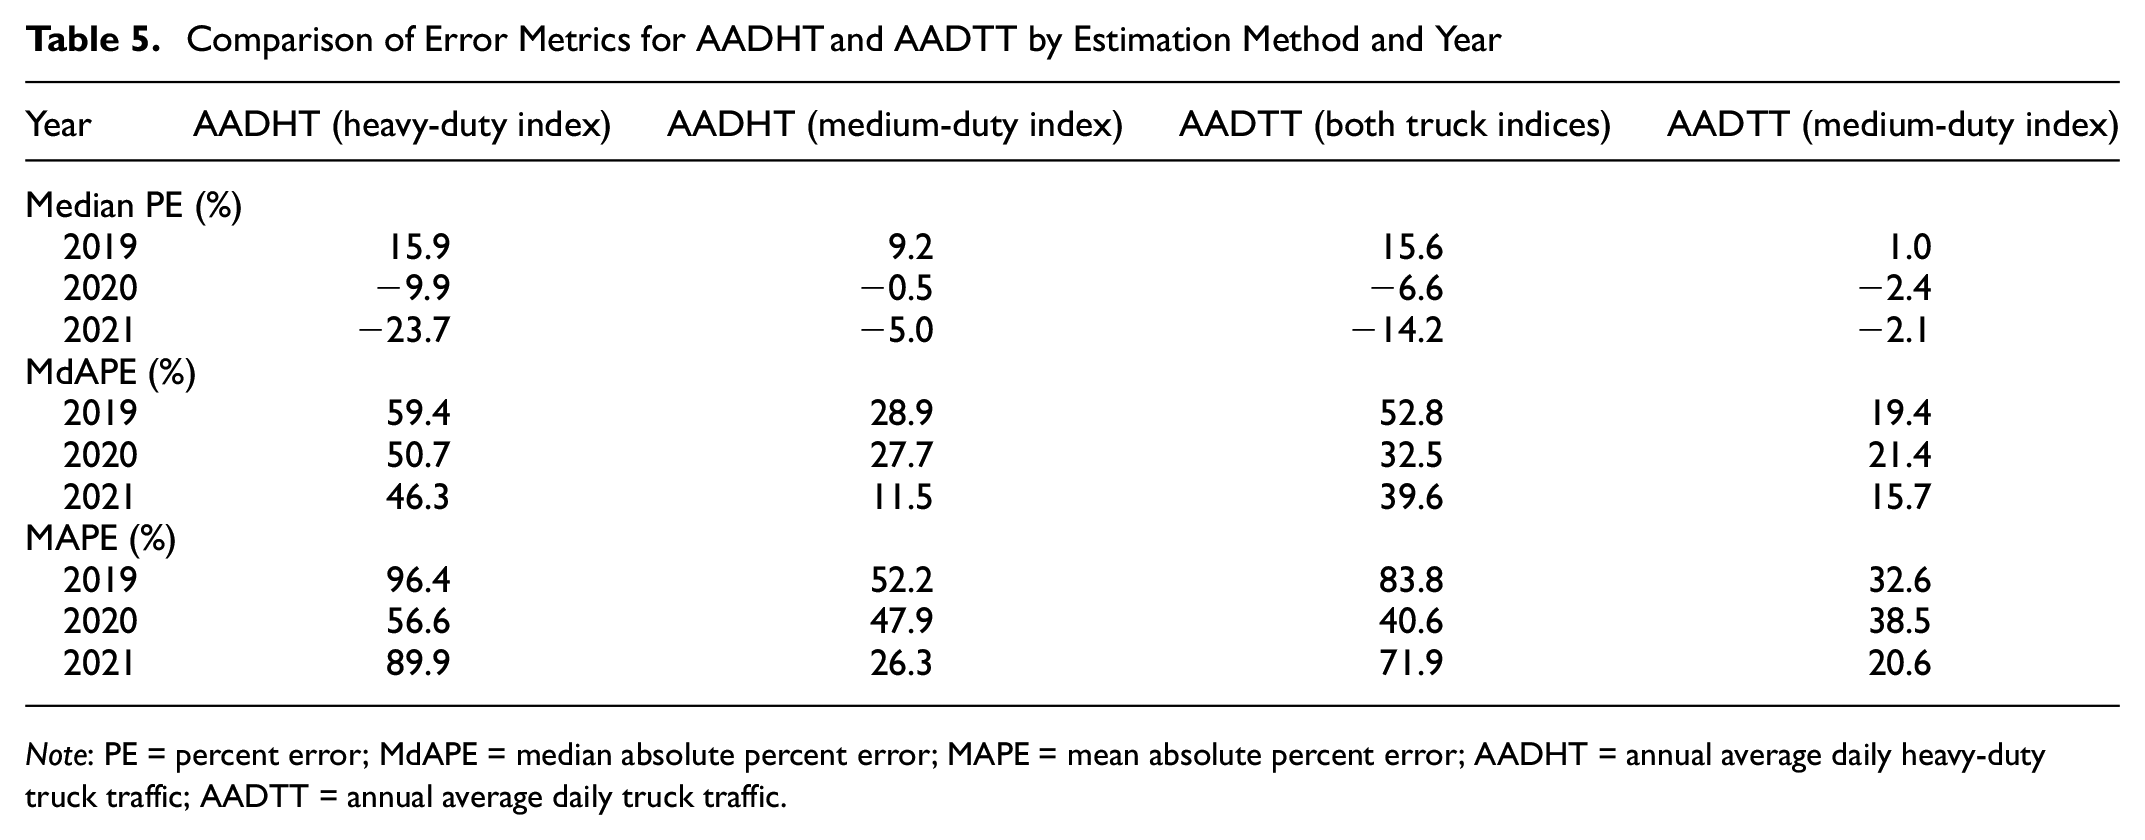
Note: PE = percent error; MdAPE = median absolute percent error; MAPE = mean absolute percent error; AADHT = annual average daily heavy-duty truck traffic; AADTT = annual average daily truck traffic.
Table 5 shows that all three error metrics for AADHT improved substantially when estimated from the medium-duty index. The decrease in MdAPE for AADHT ranged from 23 to 35 percentage points in each year, whereas the decrease in MdAPE for AADTT ranged from 11 to 34 percentage points in each year. The bias for AADHT and AADTT maintained its directionality, but the magnitude of the bias was reduced when the medium-duty index was used. The AADTT from the medium-duty index had lower bias, MdAPE, and MAPE than the AADMT estimates, except for the MAPE in 2020. Similarly, the AADHT from the medium-duty index had bias and MdAPE values lower than or comparable to AADMT. The improvement of the AADHT and AADTT estimates indicates that it is worthwhile to investigate the relationships between the indices and different class groups to best utilize the StL probe-based data, especially if some indices have significantly different sample sizes.
Regardless of the estimation method, there are still limitations when comparing the continuous count and probe-based estimates. The continuous count data were extensively reviewed to remove erroneous data, but the resulting annual average daily volumes are still expected to contain some error. In addition, it is known that the FHWA axle-based class groupings used for the ground truth data do not perfectly correspond to the GVWR classes used in StL’s commercial GPS data.
Comparison of AADT and AADTT at Level 2 and 3 Sites
The most likely application for StL’s probe-based estimates is for road segments that do not have continuous count equipment. As there are no ground truth estimates available at these Level 2 and 3 sites, the AADT and AADTT estimates obtained from SDCs and SDCCs were compared with the estimates obtained using StL indices. Estimates of AADT at the twenty-nine sites were computed using StL single factor calibration with all 2019 Level 1 sites included in the calibration dataset. StL’s algorithm removed one direction of travel at Site 1 from the calibration dataset as it was identified to be an outlier. Figure 8 provides a comparison of the bi-directional AADT estimates obtained from two 48-h SDCs and the StL total traffic index at twenty-nine sites. As both AADTs at each site are estimates, the errors simply represent the differences between the values.
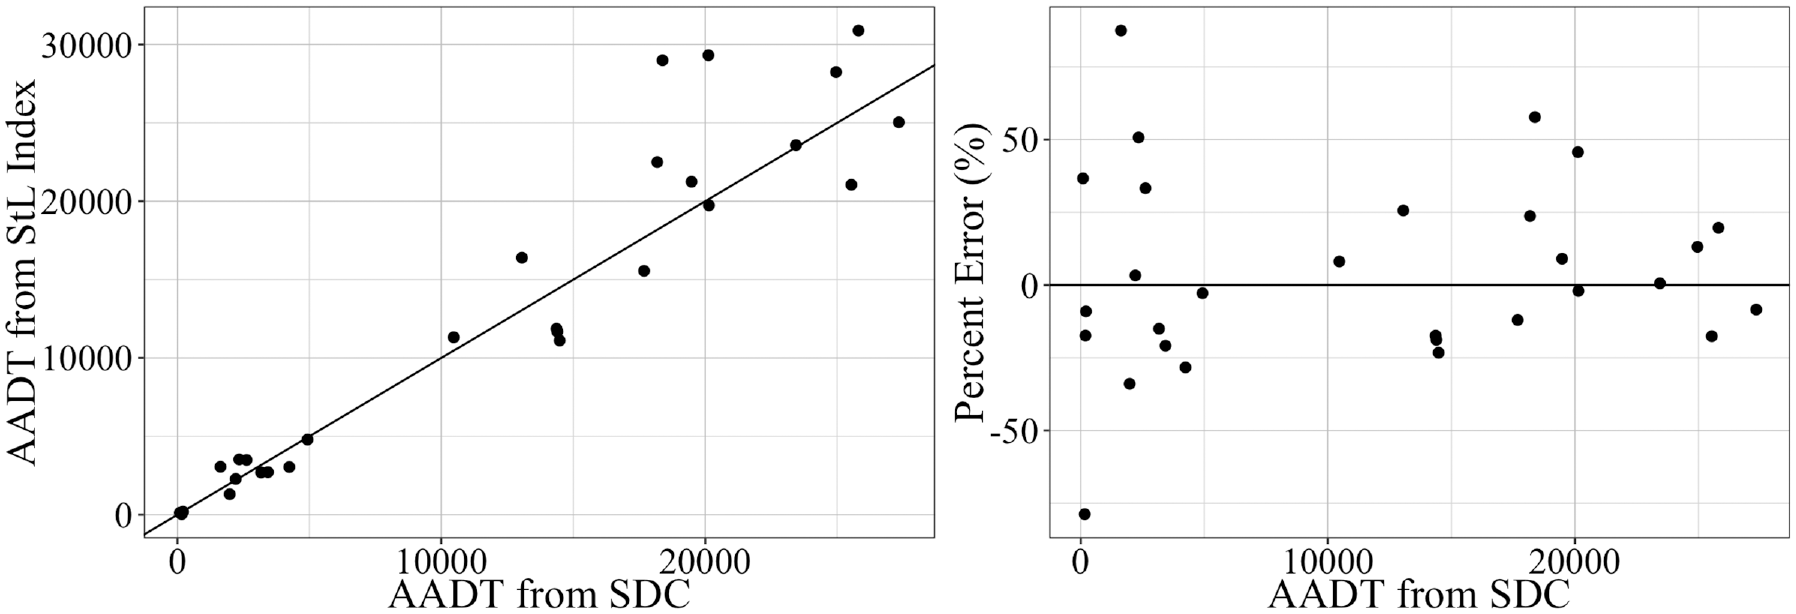
Comparison of AADTs from SDCs and StL total traffic index.
Figure 8 shows that, in general, there is reasonable agreement between the AADT estimates, with a MdAPE and MAPE of 18.8% and 24.8%, respectively. The MdAPE and MAPE for the twenty-nine SDC sites were larger than those of the continuous count sites in 2019 by 5.6 and 7.8 percentage points, respectively. Further, the median APE was −2%, which indicates that neither AADT source consistently over-estimated compared with the other. Although there was no clear trend between the PEs and AADT volume, the largest PEs were observed at lower volumes (bi-directional AADT below 5,000). Above an AADT of 12,000, two sites had larger differences with PEs over 40%. As both the StL and SDC volumes are estimates, the cause of the larger differences at these sites is unknown. However, it may be related that all the other sites with AADTs over 12,000 are located on Winnipeg’s perimeter highway, whereas these two sites are located on the Trans-Canada Highway (Highway 1).
For the same twenty-nine sites, the AADTTs obtained from SDCCs (Level 2) and SDCs (Level 3) were compared with the AADTTs obtained from both StL truck indices using single factor calibration and the medium-duty index only. However, there was no heavy-duty truck index available at the three of the lowest volume Level 2 sites (AADTT below 8) as StL did not capture any heavy-duty truck sample trips at these locations during 2019. Therefore, AADTT estimates at these three sites could only be obtained by scaling the medium-duty index. As before, the 2019 Level 1 sites were used as the calibration dataset for both methods. Figure 9 provides a comparison of the bi-directional AADTTs by estimation method and site level.
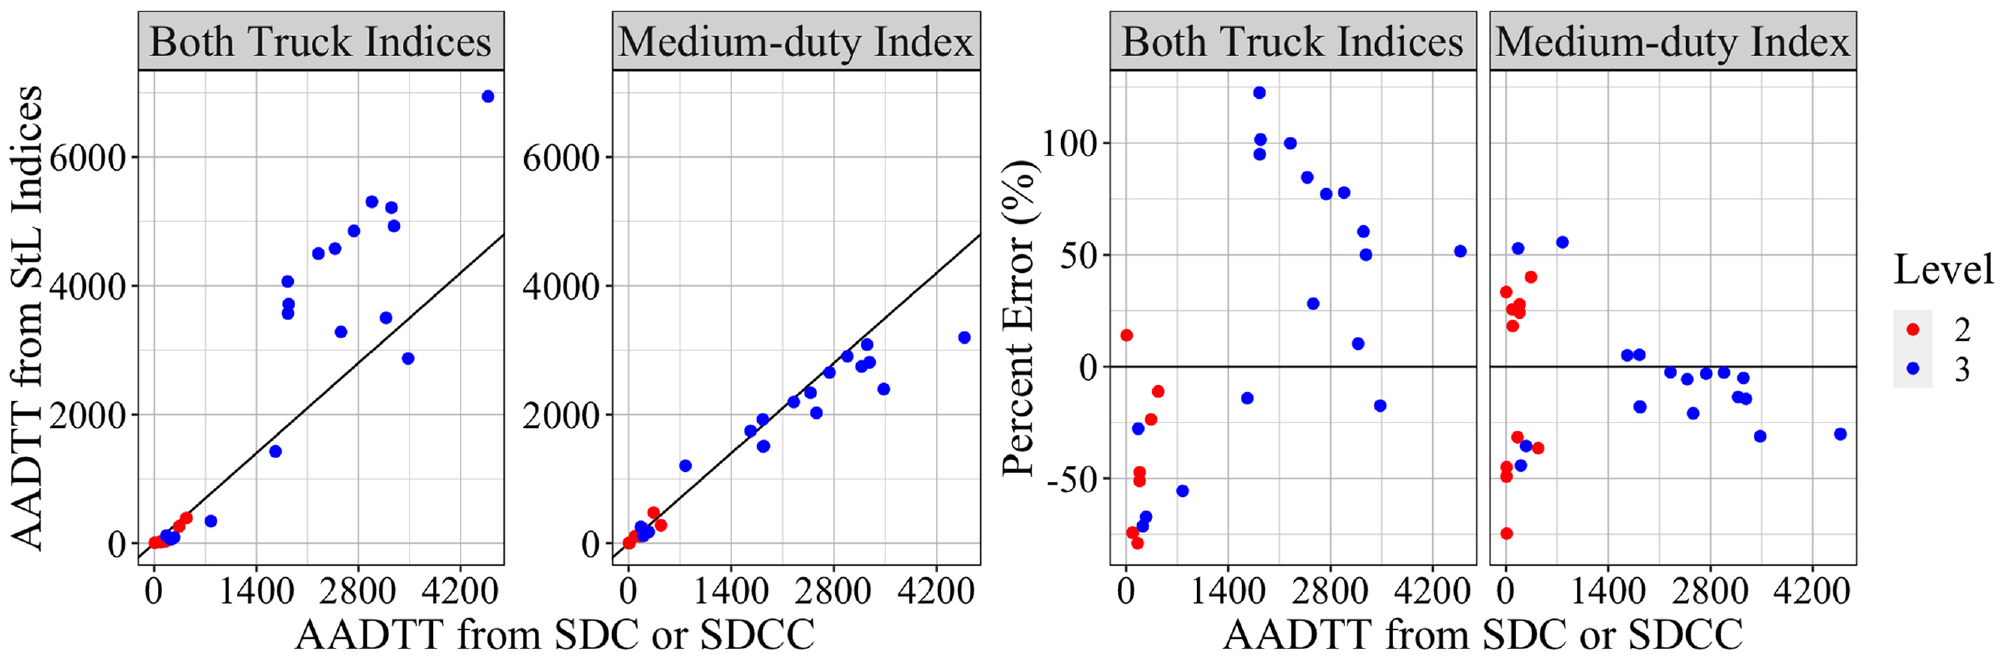
Comparison of AADTTs from SDCs or SDCCs and StL indices.
For both Level 2 and 3 sites, the AADTTs calculated from only the medium-duty index are closer to the estimates obtained from the SDCs and SDCCs. Compared with Level 2 sites, the percent differences between the Level 3 SDC AADTT estimates and the AADTT estimates obtained from the medium-duty index tended to be smaller. AADTTs from Level 3 sites are expected to be less accurate than those from Level 2 sites as Level 2 sites have SDCC data. However, the Level 2 sites are all low volume (bi-directional AADTT below 500), which could contribute to the larger differences between the SDCC and medium-duty index AADTT estimates at these sites. When comparing Level 3 AADTTs from SDCs and the medium-duty index above an AADTT of 1,400, the mean percent difference was only 12.6%. However, the SDC AADTTs tended to be higher than the AADTTs from the medium-duty index above an AADTT of 1,400.
Table 6 summarizes the errors that represent the differences between the 2019 volume estimates from StL indices and SDCs or SDCCs. As previously outlined in Table 3, the count type used to calculate the AADTT at the eleven Level 2 and eighteen Level 3 sites are different. Although the methodology and data source used to estimate the AADT at Level 2 and 3 sites are the same, the results are separated in Table 6 to allow for comparison with the AADTTs at the same sites.
Comparison of Error Metrics for 2019 AADT and AADTT at Level 2 and 3 Sites
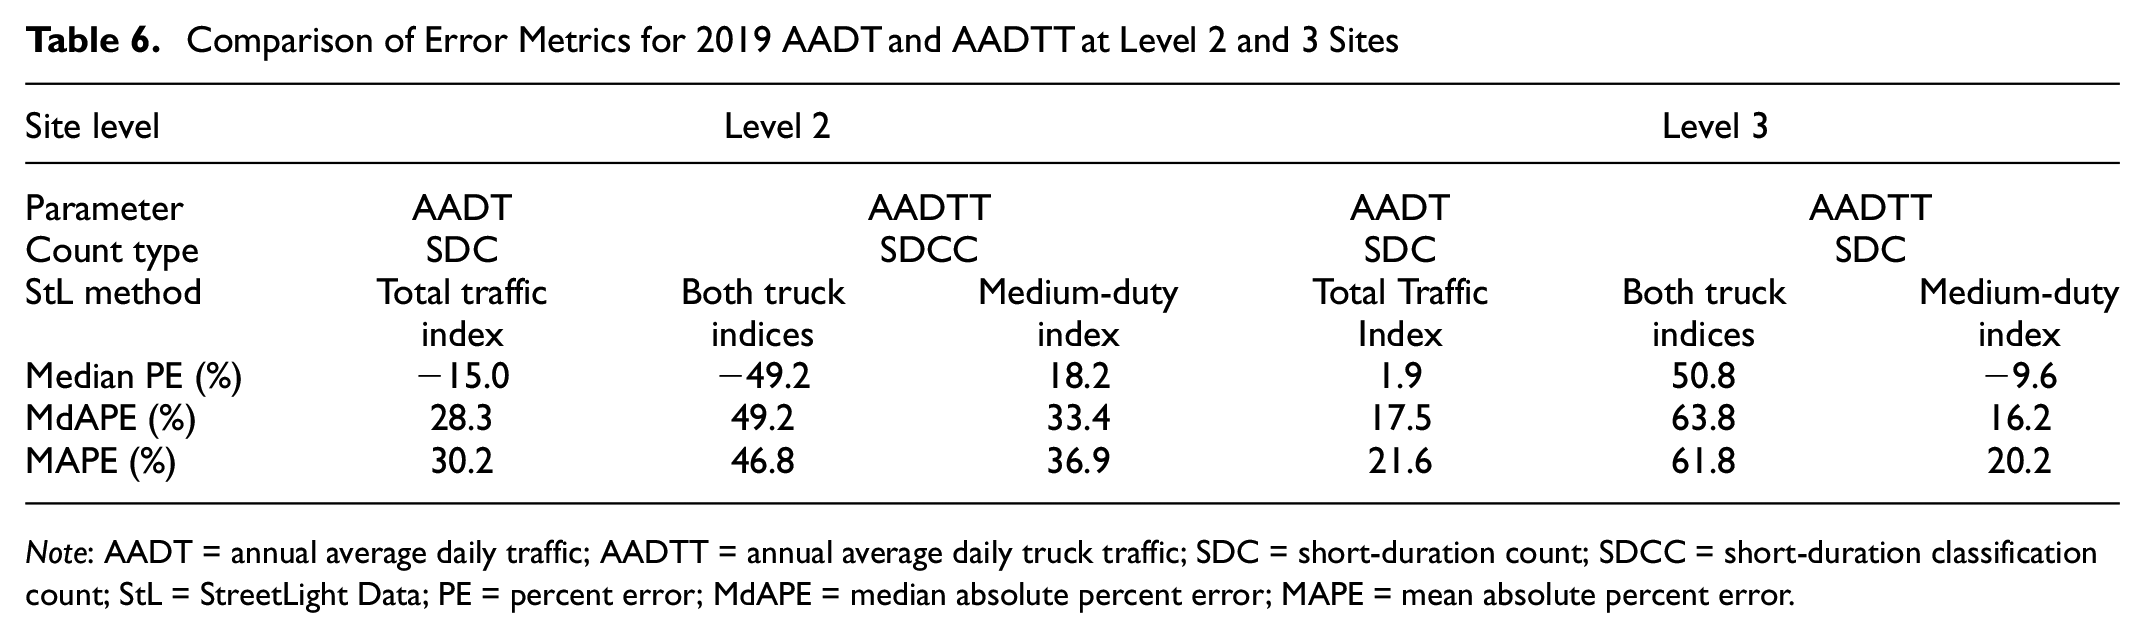
Note: AADT = annual average daily traffic; AADTT = annual average daily truck traffic; SDC = short-duration count; SDCC = short-duration classification count; StL = StreetLight Data; PE = percent error; MdAPE = median absolute percent error; MAPE = mean absolute percent error.
Table 6 shows that the bias, MdAPE, and MAPE for AADTT were all smaller when the AADTT was estimated using only the medium-duty index. Manitoba has higher confidence in their AADT estimates than their AADTT estimates at Level 2 and 3 sites because of the quality and type of data available. Despite this, the MAPE and MdAPE indicate that the percent differences for AADT and AADTT from the medium-duty index were comparable at both Level 2 and 3 sites. When comparing the site levels, it was found that the MdAPE and MAPE were lower at the Level 3 sites than the Level 2 sites for both AADT and AADTT. Although there are better truck data available at Level 2 sites than Level 3 sites, the larger percent differences at Level 2 sites align with expectations as they are lower volume than the Level 3 sites. In addition, most of the Level 1 site-directions used in the StL calibration dataset had AADT and AADTT volumes that were comparable to those at the Level 3 sites and were more geographically proximal to the Level 3 sites, as shown in Figure 2. Knowing this, it is reasonable that the MdAPE and MAPE for the 2019 estimates of AADT at the Level 3 sites were approximately 4.5% higher than the corresponding 2019 values provided in Table 4 for the Level 1 sites.
Conclusion
The use of probe-based data products to estimate traffic volumes has emerged as a promising alternative to traditional continuous and short-term counts that are performed in the field. This study made noteworthy contributions to the literature by being the first to both evaluate StL data products in Canada and assess the accuracy of the StL medium-duty and heavy-duty truck indices in North America. In this study, StL single factor calibration was used to scale StL total traffic, medium-duty, and heavy-duty indices into AADT, AADMT, and AADHT estimates, respectively. Although there were outliers in each class group, the PEs were the lowest for total traffic with MAPEs ranging from 8.8% to 22.1%, and highest for heavy-duty trucks with MAPEs ranging from 56.6% to 96.4%. The higher errors for heavy-duty trucks were likely caused by biases in the heavy-duty truck sample and the relatively small heavy-duty truck sample size. As medium-duty trucks had a significantly larger sample size, the medium-duty indices were manually scaled into AADHT and AADTT volumes as an alternative to StL’s built-in single factor calibration. The results were promising, with AADHT and AADTT MAPEs ranging from 26.3% to 52.2% and 20.6% to 38.5% across the three study years, respectively.
Additional analysis was performed using 2019 data at twenty-nine SDC sites, as jurisdictions are more interested in acquiring accurate volume data at locations without continuous count data. With no known AADT and AADTTs to compare with at these sites, the volumes obtained using traditional SDC or SDCC factoring methods and using StL single factor calibration or manual scaling of StL indices were compared. The mean percent difference between the AADT estimates at the SDC sites was 24.8%, with neither AADT source consistently over-estimating compared with the other. Like the findings at the Level 1 sites, there was greater agreement between the two AADTT estimates when AADTT was estimated using only the medium-duty index as opposed to both truck indices. When the AADTT was estimated using the medium-duty index, the mean percent difference between the estimates at the Level 2 and 3 sites were 36.9% and 20.2%, respectively. Moreover, the AADTT from the SDC tended to over-estimate compared with the AADTT from the medium-duty index at the Level 3 sites. At the Level 2 and 3 sites, the mean percent differences for AADT and AADTT from the medium-duty index were comparable, unlike the Level 1 sites, where the AADT and AADTT estimates had a more pronounced difference in accuracy.
In general, the errors of the medium and heavy-duty truck estimates are likely too high for design applications, but they may be useful for planning applications on unmonitored road segments where truck volume estimates are unavailable or of unknown quality. To limit the impact of bias in StL’s data sample, calibration sites of the same road classification and setting with similar expected truck fleet characteristics should be used when possible. Overall, more work is needed to obtain site-specific medium-duty and heavy-duty truck volume estimates from StL data with similar quality to that of StL’s total traffic estimates or traditional traffic counts. One option for future research is to investigate other ways to manually scale the StL indices into volumes. For example, regression analysis could be used to identify a relationship between the StL indices and ground truth volumes instead of using a single mean volume factor. However, it is important to consider that the advantage to jurisdictions of using traffic volume estimates from third-party data providers decreases when the post-processing needed to obtain accurate traffic volume estimates becomes more complicated and time intensive. In addition, it is challenging to standardize the processing and use of StL’s data, as the sample sizes, data sources, algorithms, and data products are continually changing. Because of the dynamic nature of third-party data providers such as StL, it is important for jurisdictions to maintain in-house expertise that can periodically evaluate the outputs that are being provided. Finally, it is critical for agencies to consider acquisition costs and benefits alongside the implications of relinquishing authority over the algorithms and methodologies, timeliness of data availability, and data governance principles.
Footnotes
Acknowledgements
The authors gratefully acknowledge the financial contributions of the National Research Council Canada, the Natural Sciences and Engineering Research Council of Canada, and the University of Manitoba. We thank Manitoba Transportation and Infrastructure for providing the data used in the study.
Author Contributions
The authors confirm contribution to the paper as follows: study conception and design: C. Zrobek, G. Grande, J.D. Regehr; data collection: C. Zrobek, G. Grande, J.D. Regehr; analysis and interpretation of results: C. Zrobek, G. Grande, J.D. Regehr; draft manuscript preparation: C. Zrobek, J.D. Regehr, B. Mehran. All authors reviewed the results and approved the final version of the manuscript.
Declaration of Conflicting Interests
The author(s) declared no potential conflicts of interest with respect to the research, authorship, and/or publication of this article.
Funding
The author(s) disclosed receipt of the following financial support for the research, authorship, and/or publication of this article: The National Research Council Canada and the Natural Sciences and Engineering Research Council of Canada. Grant number for National Research Council Canada is AI4L - 106 and for NSERC is 5342.
The results and conclusions presented are those of the authors and no official endorsement by Manitoba Transportation and Infrastructure is intended or should be inferred.