
Abstract
Skid resistance of pavements plays a crucial role in ensuring the safety of road users, particularly under wet weather conditions. The standardized method for evaluating the skid resistance of aggregates, AASHTO PP103, requires using a three-wheel polishing device. That test procedure requires significant time for specimen preparation, testing, and monitoring of aggregate stockpiles. This study aims to propose alternative test methods to reduce the time required for the evaluation of skid resistance of aggregates. Two approaches were examined as alternatives to the AASHTO PP103 method. The first approach involved using a micro-deval abrasion device to polish the aggregates before evaluating the skid resistance of the aggregates using a dynamic friction tester. In the second approach, a multiple linear regression equation was proposed that uses conventional mechanical performance test results as independent variables to predict skid resistance. Twenty-one aggregate samples were collected from various sources in Texas for this study. The study results indicate that both approaches can be used as surrogate methods for AASHTO PP103 for rapid screening of the skid resistance of aggregates, which could help manage aggregate quality control and assurance.
Keywords
Skid resistance, one of the crucial long-term functional performance parameters of pavements, has been extensively studied. Numerous studies reveal a linear relationship between the skid resistance of surface mixtures and the occurrence of accidents at a particular location ( 1 , 2 ). Since aggregates are the major constituent of asphalt mixtures, the skid resistance properties and quality of aggregates affect the skid performance of surface asphalt mixtures ( 3 ). Asphalt surface mixtures comprise about 95% aggregates by total mass. The other main component in asphalt mixtures is the binder, which represents about 5% of the total mass and tends to abrade from the surface of aggregates during the initial stages of traffic exposure ( 4 ), playing a minor role in skid resistance performance. Thus, the frictional properties of aggregates substantially determine the skid resistance performance of asphalt pavements.
Skid resistance (a.k.a. frictional resistance and coefficient of friction) refers to the ratio of frictional force developed between the tire and the surface to the normal weight on the tire in the direction of vehicle movement ( 5 ). The evaluation of aggregate skid resistance began in the 20th century with the use of an accelerated aggregate polishing machine (AAPM) along with the British pendulum tester (BPT) ( 6 , 7 ). However, many concerns have been raised in recent decades with respect to the high variability of the BPT test results. As a result, new testing methods have been developed as alternatives to the BPT, aiming to reduce variability and eliminate the human factor in skid resistance measurement. One such alternative is the dynamic friction test (DFT), which uses an automated method to measure surface friction ( 8 , 9 ). The dynamic friction tester consists of a motor, a circular disk with rubber pads, and a water hose for wetting the test surface during measurement. Because of the high repeatability and minimal error associated with human interaction ( 10 – 12 ), the DFT device has gained wide usage in the laboratory for measuring the frictional resistance of aggregates, and in the laboratory and the field for asphalt mixtures. The American Association of State Highway and Transportation Officials (AASHTO) has developed a specification (PP 103 - Standard Practice for Sample Preparation and Polishing of Unbound Aggregates for Dynamic Friction Testing) for evaluating the frictional resistance of aggregates using the DFT after polishing with a three-wheel polishing device (TWPD) ( 13 ).
Several departments of transportation (DOTs), such as the Maryland DOT, have adopted the DFT to assess the frictional resistance of aggregates as part of their aggregate stockpile quality management ( 14 ). Despite the high precision of friction measurement offered by the DFT, the method is time-consuming for evaluating aggregate frictional resistance. As per the AASHTO specification, aggregates must be polished for up to 100,000 (100k) TWPD cycles to obtain a terminal friction value. With a TWPD revolving at 55 ± 5 revolutions per minute (RPM), it takes approximately 30 h to polish aggregates up to 100k TWPD cycles ( 12 ). Considering that several state DOTs administer many aggregate types for asphalt pavement construction, developing alternative approaches for the rapid evaluation of the frictional resistance of aggregates could help DOTs improve the quality monitoring and assurance of aggregate sources and ensure adequate skid resistance.
Some DOTs conduct alternative aggregate tests to assess the mechanical characteristics of aggregates ( 15 ). These tests include the Los Angeles abrasion loss (LAAL), micro-deval abrasion loss (MDAL), soundness magnesium (SM), and acid insoluble residue (AIR) tests. The LAAL test assesses aggregate degradation ( 16 ); the MDAL test indicates the abrasion, weathering, and degradation resistance ( 17 ); the SM test measures the resistance of aggregates to disintegration ( 18 ); and the AIR test provides the insoluble residue content of aggregates ( 19 ). Previous studies have demonstrated some correlations between these tests and the performance of asphalt mixtures. Yu et al. ( 20 ) found that high abrasion loss during mixing adversely affected the asphalt mixture performance. Gao et al. ( 21 ) observed a decrease in asphalt mixture performance when aggregates with abraded shapes were used after subjecting the aggregates for shape degradation to the LAAL test. Similarly, aggregates subjected to the MDAL test exhibited diminished shape characteristics, particularly when composed of low-hardness minerals ( 22 ). Moreover, aggregates with high SM values and low AIR values demonstrated enhanced durability of asphalt mixtures ( 23 , 24 ). Nevertheless, quantifying the frictional resistance of aggregates, which is crucial for producing surface asphalt mixtures with adequate skid resistance, is raising concern among DOTs. Therefore, the scope of this study is to develop rapid alternative approaches for the evaluation of frictional resistance of aggregates.
The polishing resistance of aggregates is highly dependent on the minerals present in them. Generally, aggregates containing high-hardness minerals exhibit better frictional performance, while those with low-hardness minerals perform poorly ( 25 ). During the polishing process using any polishing machine with a tire, the surface of aggregates gradually abrades, leading to a deterioration of frictional resistance over time. In addition, the shape characteristics of aggregates, namely angularity and texture, decline during the polishing process ( 26 ). In summary, analyzing aggregate friction involves simulating real-time scenarios by subjecting the aggregate surface to abrasion using a tire.
In previous studies, the aggregate surfaces were subjected to abrasion using the MDAL test ( 26 , 27 ). The abraded aggregates were then examined for the decay of angularity and texture using digital imaging techniques. The decline in texture and angularity after subjecting aggregates to the MDAL test was considered a decay in frictional resistance, providing a simpler alternative to traditional polishing and friction measurement methods. Unfortunately, neither the final texture nor the angularity values correlated strongly with the friction measurement values ( 28 ). Uz and Gökalp ( 29 ) used the BPT and DFT as an alternative to imaging techniques, after subjecting the aggregates to the MDAL test.
The first objective of this study is to utilize the MDAL test to polish aggregates before determining their frictional performance using the DFT. The correlation between the results from this approach and those from the AASHTO PP 103 methods is examined to demonstrate the potential use of this approach as an alternative test for AASHTO PP 103.
The second objective of this study is to develop a model for predicting the frictional performance of aggregates using conventional aggregate test results as input variables. Since some of these aggregate parameters have shown a correlation with the frictional performance of aggregates, this approach seems feasible. Many DOTs regularly perform tests on aggregates as part of their quality control and assurance programs. Assuming the regression equations perform well in predicting the frictional resistance of aggregates, they can be used for rapidly monitoring and estimating aggregate frictional resistance. As a result, these methods can be potentially used as surrogate test methods for AASHTO PP103 for the evaluation of aggregate frictional resistance.
Methods
Experimental Plan
Table 1 shows the 21 different aggregate sources that were considered in this study. The collected aggregates were evaluated for their mechanical properties, namely, the MDAL, LAAL, SM, and AIR tests. The test results of the mechanical properties are also summarized in Table 1. The collected aggregates were examined for alternative friction test methods in two phases. The first phase involved evaluating the polishing resistance of aggregates according to the AASHTO PP 103 method. The second phase focused on assessing the frictional resistance of aggregates after subjecting them to the micro-deval abrasion test.
List of Aggregates used in this Study
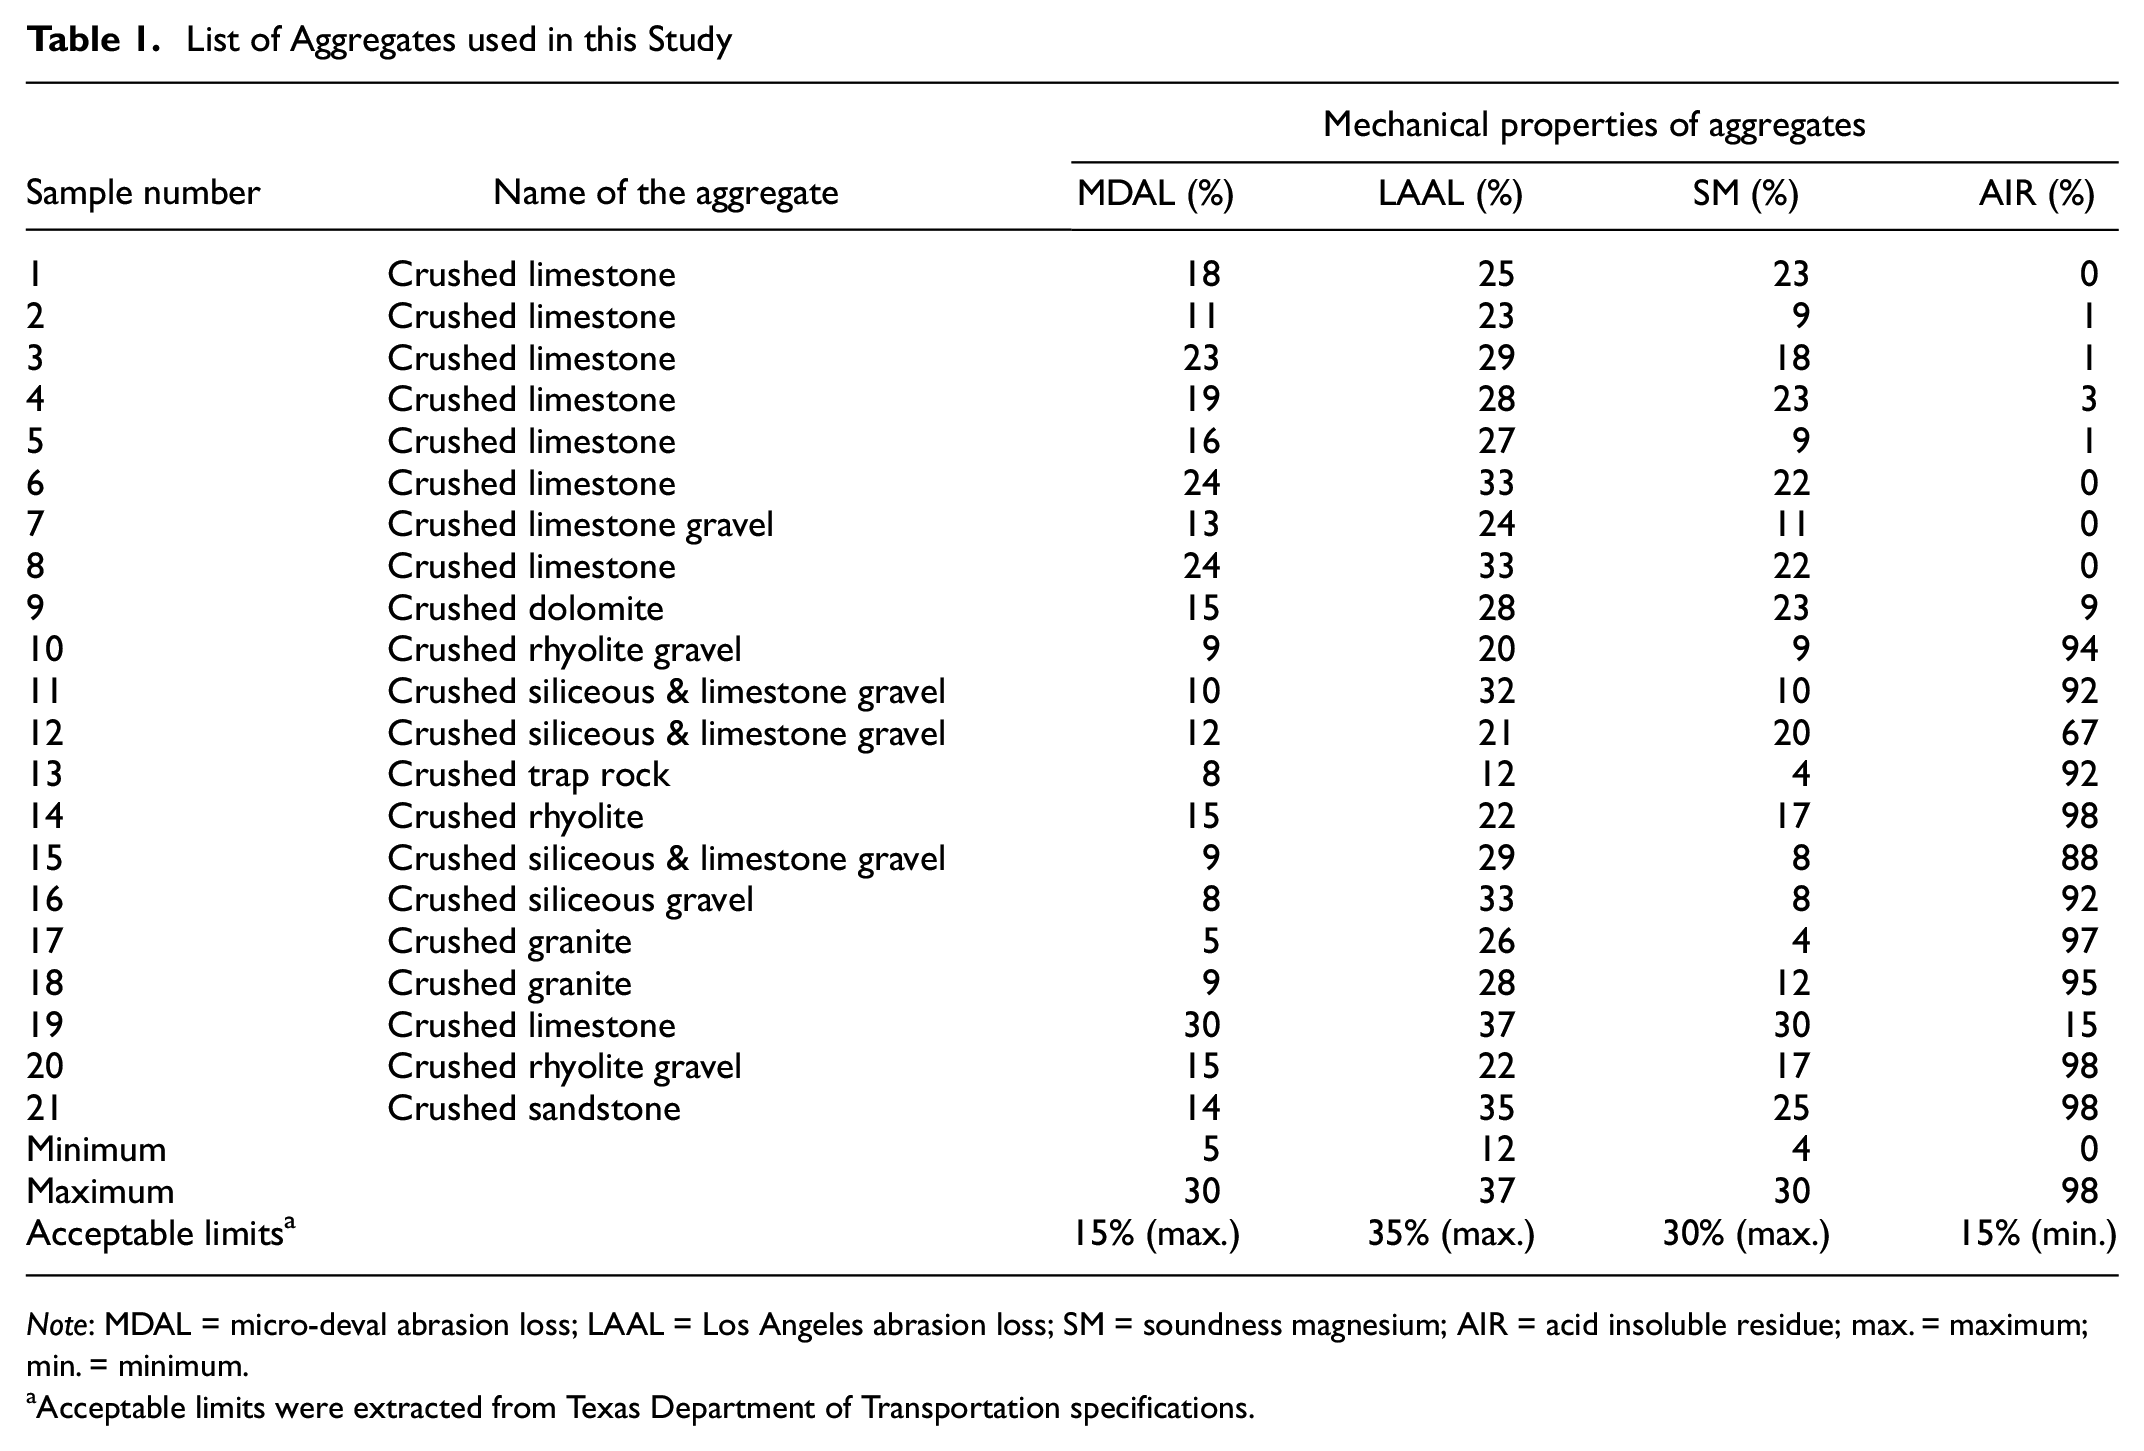
Note: MDAL = micro-deval abrasion loss; LAAL = Los Angeles abrasion loss; SM = soundness magnesium; AIR = acid insoluble residue; max. = maximum; min. = minimum.
Acceptable limits were extracted from Texas Department of Transportation specifications.
Aggregate Ring Preparation Method for Polishing Using the TWPD
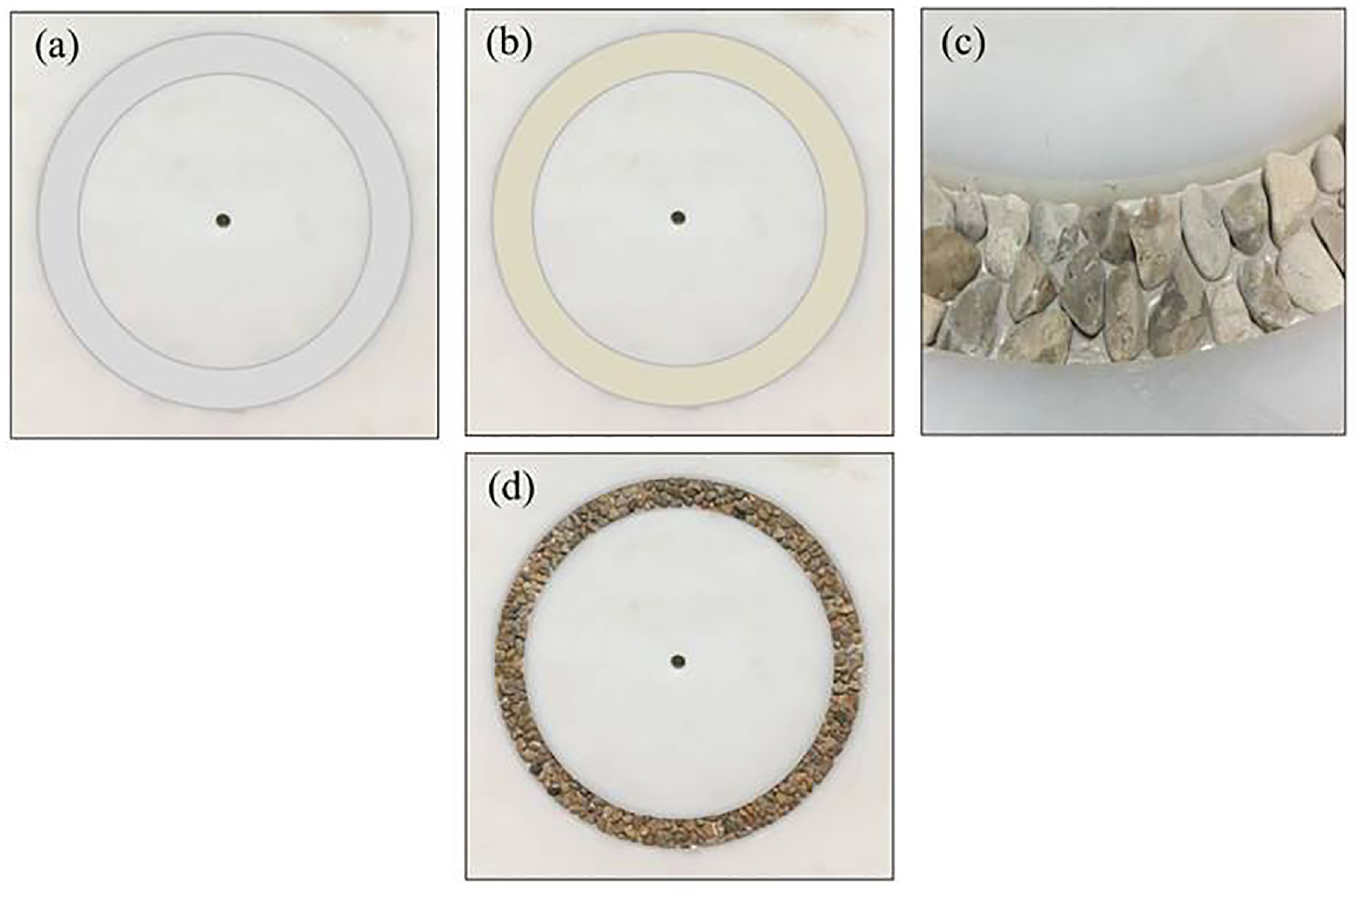
The AASHTO PP 103 method was utilized to prepare aggregate rings and determine their frictional performance. This method involves polishing the aggregate rings using the TWPD and conducting friction tests using the DFT. Aggregates passing a 12.5 mm (1/2 in.) sieve and retained on a 9.5 mm (3/8 in.) sieve were acquired and washed to remove any fine particles adhered to the aggregate surface for the ring preparation. The washed and fines-free aggregates were dried in an oven at 110°C until their weight remained constant, indicating the absence of moisture. Hereafter, the dried aggregates are referred to as standard aggregates. After cooling at room temperature, the aggregates were meticulously placed in a mold to create aggregate rings, as shown in Figure 1, a–c. The aggregate particles were tightly arranged and seated on a flat surface. A binding agent of quick-setting cement was applied to the sample and allowed to cure at room temperature for 5 h to hold the aggregates in place (Figure 1d). Figure 1e shows a TWPD aggregate ring specimen after curing. Figure 2 depicts the aggregate ring in the TWPD during the polishing process. The prepared aggregate rings were polished using the TWPD for up to 100k cycles to evaluate their frictional resistance.
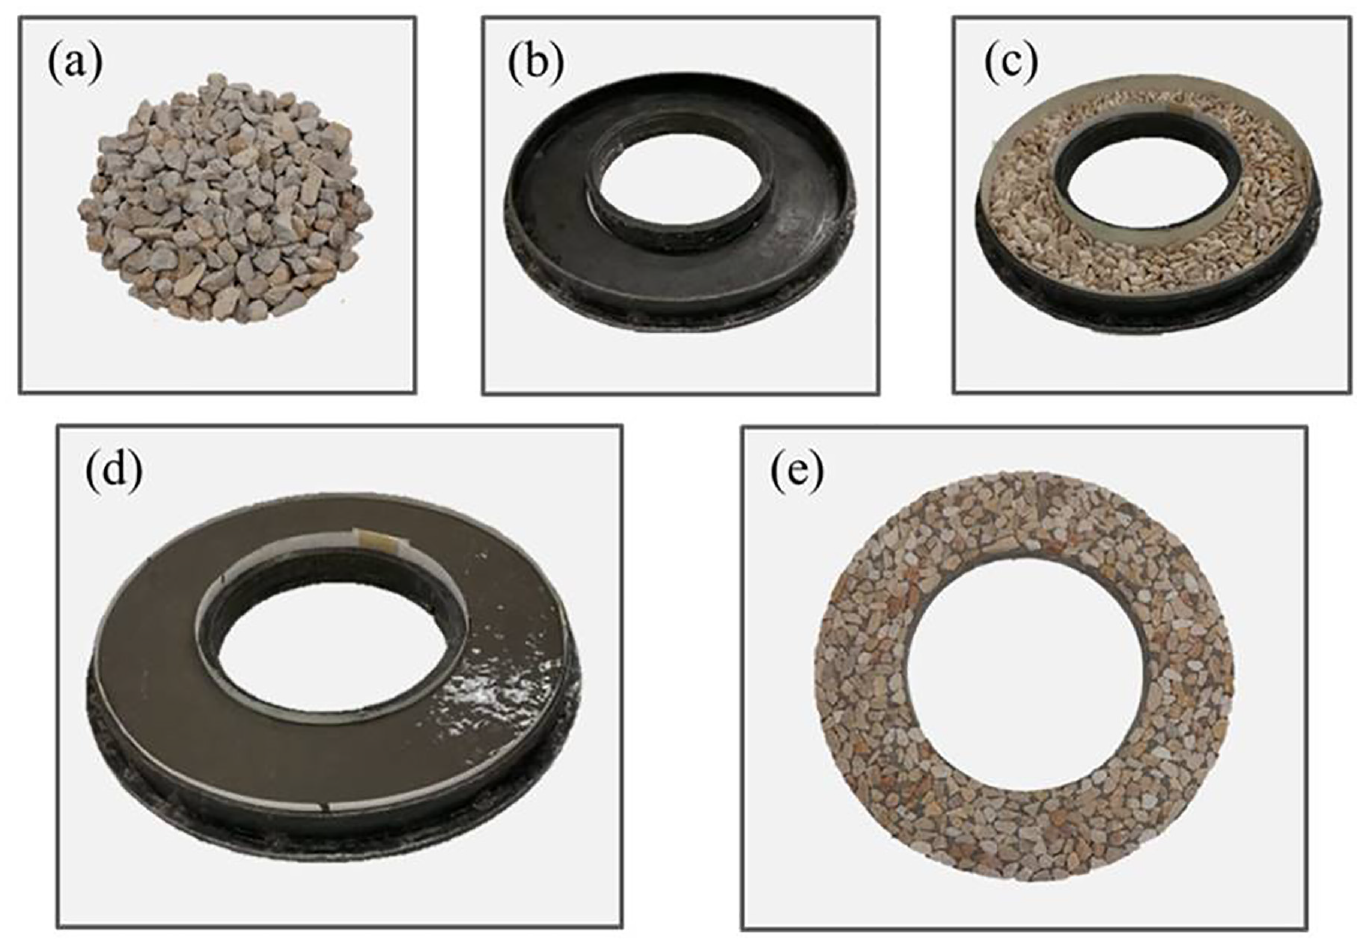
Aggregate ring preparation process: (a) standard aggregates, (b) ring mold, (c) aggregates placed in the mold, (d) quick-setting cement poured into the mold, and (e) aggregate ring after curing.
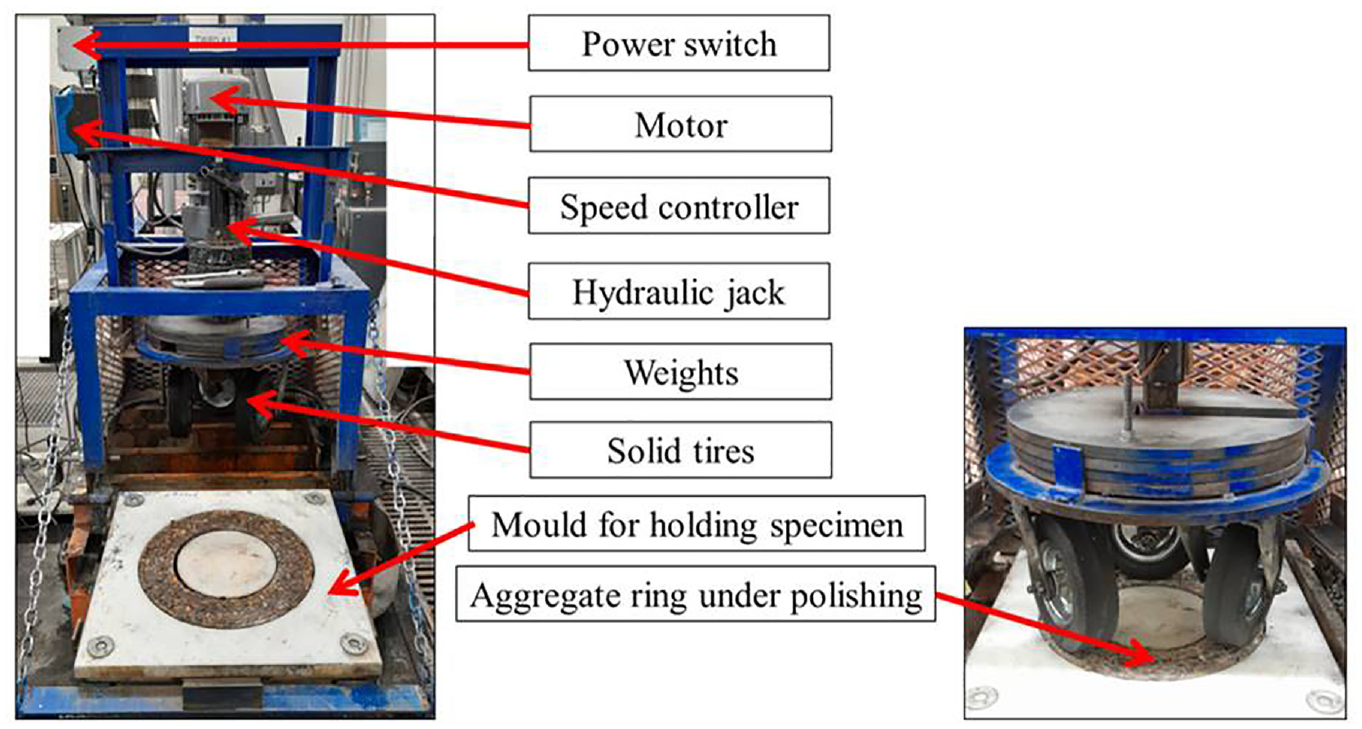
Aggregate ring under polishing using an in-house fabricated three-wheel polishing device.
Micro-Deval Abrasion Loss Test
The standard aggregates were tested using the micro-deval abrasion test, following the ASTM D6928 procedure ( 17 ). According to this method, the aggregates weighing 1500 g were placed in a cylinder along with steel balls weighing 5000 g and measuring 9.5 mm in diameter. In addition, 2 L of water were added to the cylinder. The cylinder was then subjected to 105 min of revolutions at a speed of 100 ± 5 RPM. After the test, the aggregates were wet-sieved, and the material that passed through a 1.18 mm (No. 16) sieve was measured to determine the MDAL value. The MDAL value is calculated as the ratio of the final weight of aggregate retained on the 1.18 mm (No. 16) sieve to the initial weight of the aggregate used in the micro-deval process, which was 1500 g.
Aggregate Ring Preparation After Micro-Deval Aggregates
The aggregates retained on the 1.18 mm (No. 16) sieve after the micro-deval abrasion test were used to prepare aggregate rings for assessing the frictional resistance. The preparation of aggregate rings involved placing the abraded aggregates on Bondo filler and curing them for 5 h. Figure 3 displays the micro-deval abrasion test apparatus and showcases the standard aggregates before and after the micro-deval abrasion test. Figure 4 illustrates the process of preparing aggregate rings after abrading the aggregates using the micro-deval device.
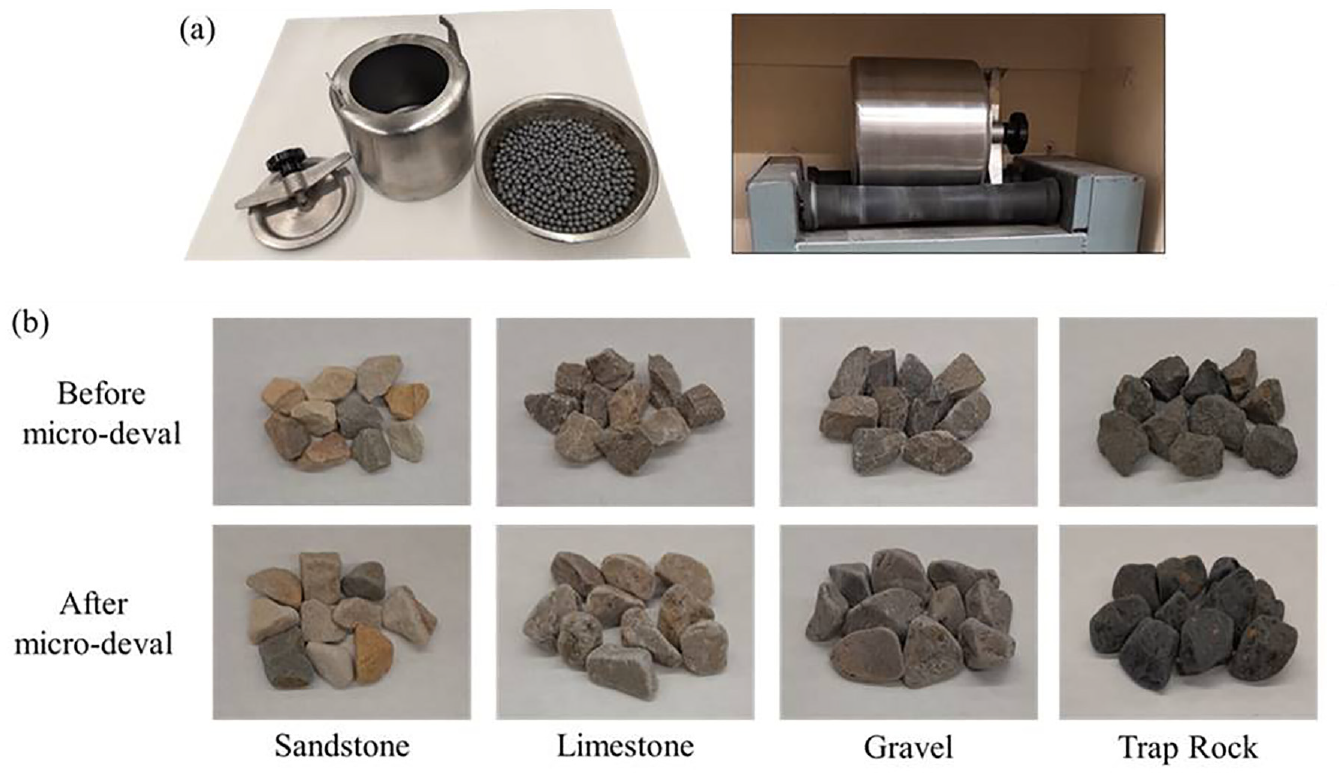
(a) Micro-deval apparatus and (b) standard aggregates before and after abrasion with the micro-deval device.
Aggregate ring preparation process with aggregates after the micro-deval process: (a) mold for aggregate ring preparation, (b) Bondo filler placed in the mold, (c) micro-deval aggregates placed in the mold, and (d) aggregate ring after curing.
Dynamic Friction Test on Aggregate Rings
The frictional resistance of both the TWPD aggregate rings and micro-deval aggregate rings was tested using the DFT following ASTM E1911 ( 9 ) standards. Three trials were performed on each ring type, and the average of the three friction values obtained at a speed of 20 km/h was considered the aggregate’s friction value. The tests were conducted under wet conditions, as the frictional resistance of aggregates is typically lower under wet test conditions compared to dry conditions. Figure 5 illustrates the components of the DFT procedure. The DFT device is placed on top of the aggregate ring before and after polishing.
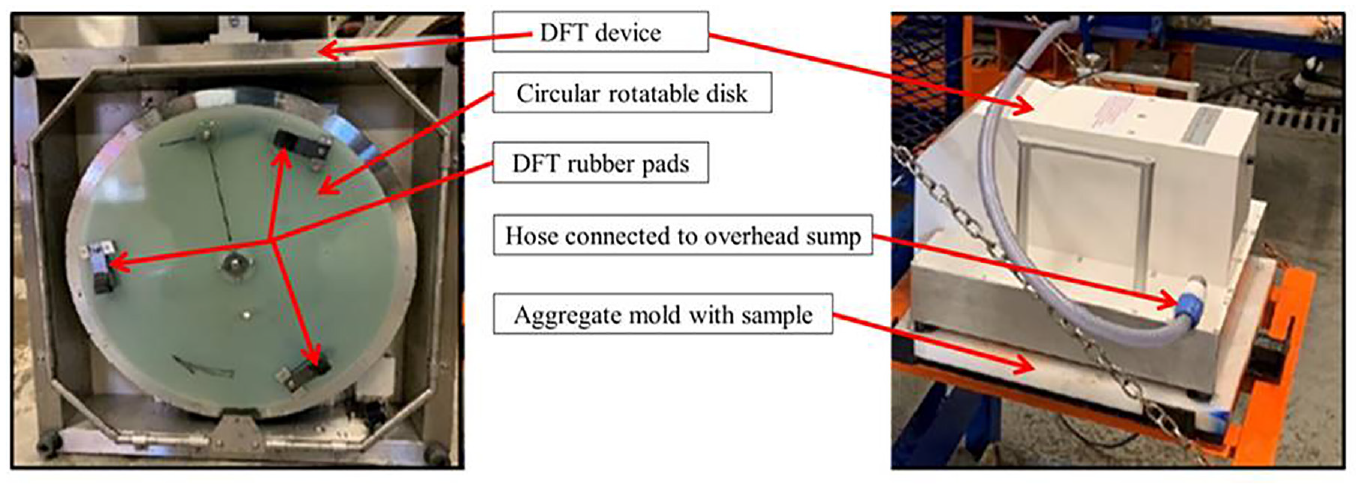
Various components of the dynamic friction test (DFT) device.
Conventional Tests for the Evaluation of the Mechanical Performance of Aggregates
In addition to the MDAL test, other conventional mechanical performance tests were conducted in this study, namely the LAAL, SM, and AIR tests. For the LAAL test, the standard aggregates were added to the drum used for this testing method. Later, the drum was subjected to 500 revolutions, and the LAAL value was calculated following the ASTM C131/C131M procedure. For the SM test, the standard aggregates were tested using the solution prepared using the salt of anhydrous and crystalline hydrate as per ASTM C88/C88M. The AIR test was performed using a concentrated hydrochloric acid (HCl) solution following the test procedure ASTM D3042.
Results and Discussion
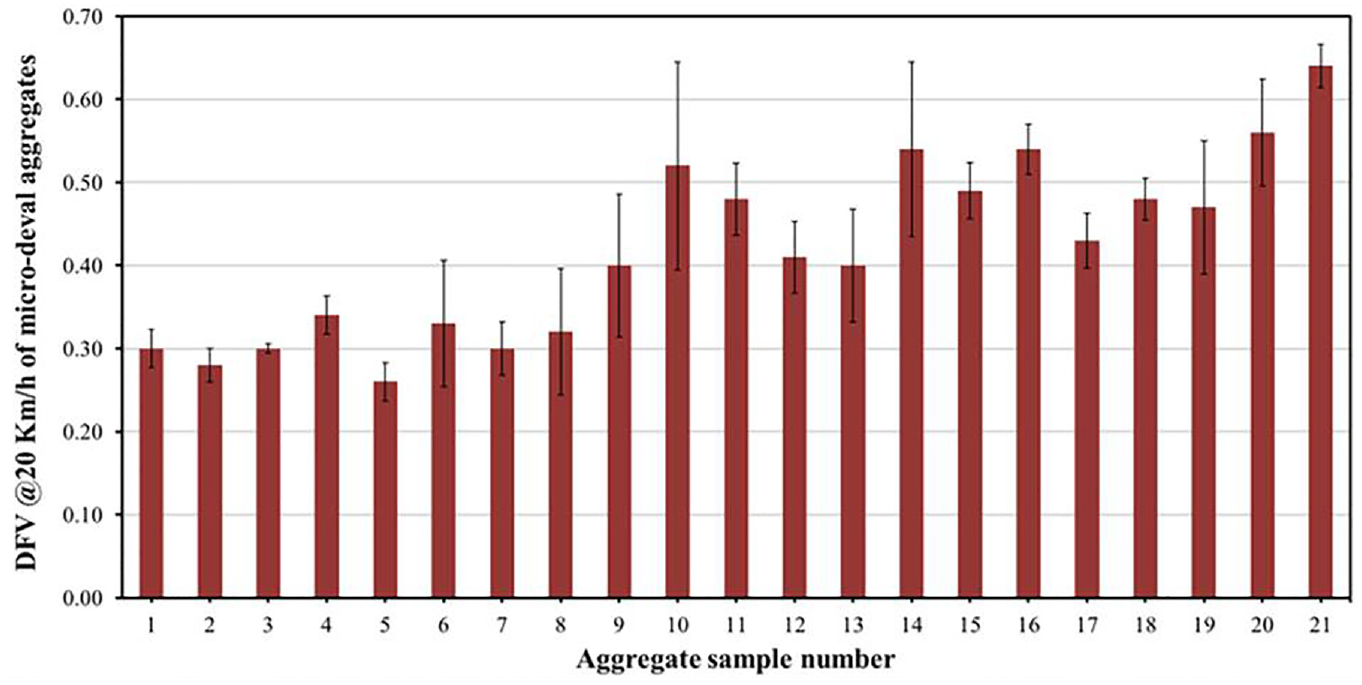
Figure 6 depicts the friction values of the 21 aggregates after 100k TWPD polishing cycles on replicate rings. The average of triplicate trials was reported as the friction value for each test. The error bars for each value represent ±1 standard deviation of the three measured values.
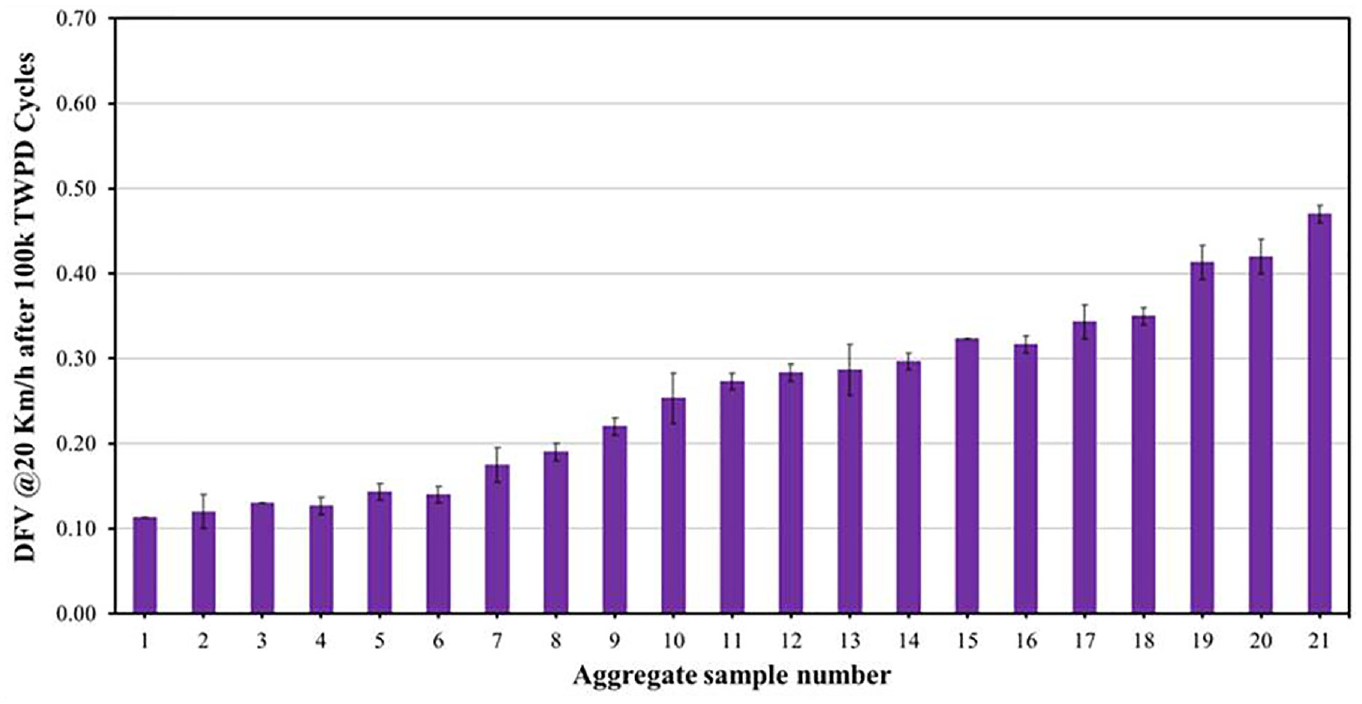
Friction values of 21 aggregates after 100k polishing cycles.
Table 2 presents the distribution of the friction values. The selected aggregates exhibited friction values ranging from 0.10 to 0.50, indicating a wide range of aggregate friction values. The materials selected are biased toward low-friction materials to be representative of the stockpiles available within the region. This study focused solely on the friction values corresponding to 100k TWPD, cycles as numerous studies ( 12 , 30 , 31 ) have suggested that the number of cycles corresponds to the long-term behaviors of the aggregates.
Number of Aggregate Samples within an Interval of 0.10
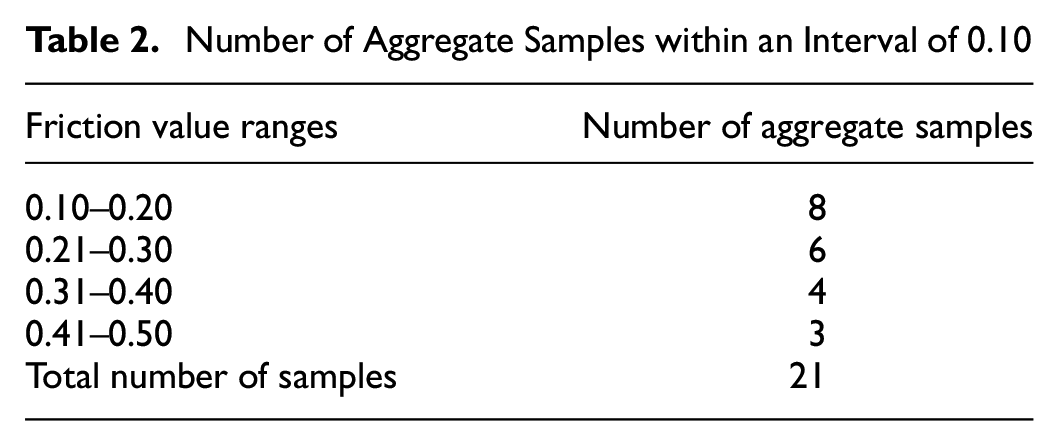
Figure 7 illustrates the friction values with the DFT of the 21 aggregates subjected to micro-deval abrasion before aggregate rings were prepared. Again, the average friction values of the three DFT trials are reported in the graph. As reflected in the error bars, the results are not as repeatable as those shown in Figure 6. One possible reason for the higher variability in the results could be the method of preparation. To reduce the overall test duration, the aggregates were directly placed in the Bondo paste, which might have led to a more uneven surface. Inherently, uneven surfaces pose slightly higher forces on the DFT device rubber pads when compared with an even surface. Further studies are required to elucidate the impact of rough surfaces on the DFT measurement and equipment.
Friction values of micro-deval aggregate rings.
Figure 8 illustrates the correlation between the friction values from the TWPD and micro-deval abrasion methods for the 21 aggregates. The friction values from the two abrasion methods are reasonably well correlated, as judged by an R2 value of 0.78. The friction values of the specimens prepared using the micro-deval abrasion consistently tend to be higher, indicating that the TWPD process abrades the aggregates more severely. Based on the observed correlation between the two methods, it can be concluded that DOTs can perhaps consider the micro-deval abrasion method as a suitable alternative to the AASHTO TWPD method for screening their state-wide inventory of aggregate polishing resistance. The abrasion of aggregates with the micro-deval method can discriminate between aggregates with high and low polishing resistance characteristics reasonably well. By adopting the micro-deval abrasion method as a replacement for the TWPD method, DOTs can significantly reduce the testing time per aggregate source by approximately 20 h, considering the time required for specimen preparation. Equation 1 can be used to estimate the friction value corresponding to the TWPD abrasion method (DFVTWPD) from the specimens prepared using aggregates abraded with the micro-deval device (DFVMD) with a standard error of estimate of 0.05. In that manner, only the materials that yield friction values close to the acceptance limits can be tested using the TWPD:

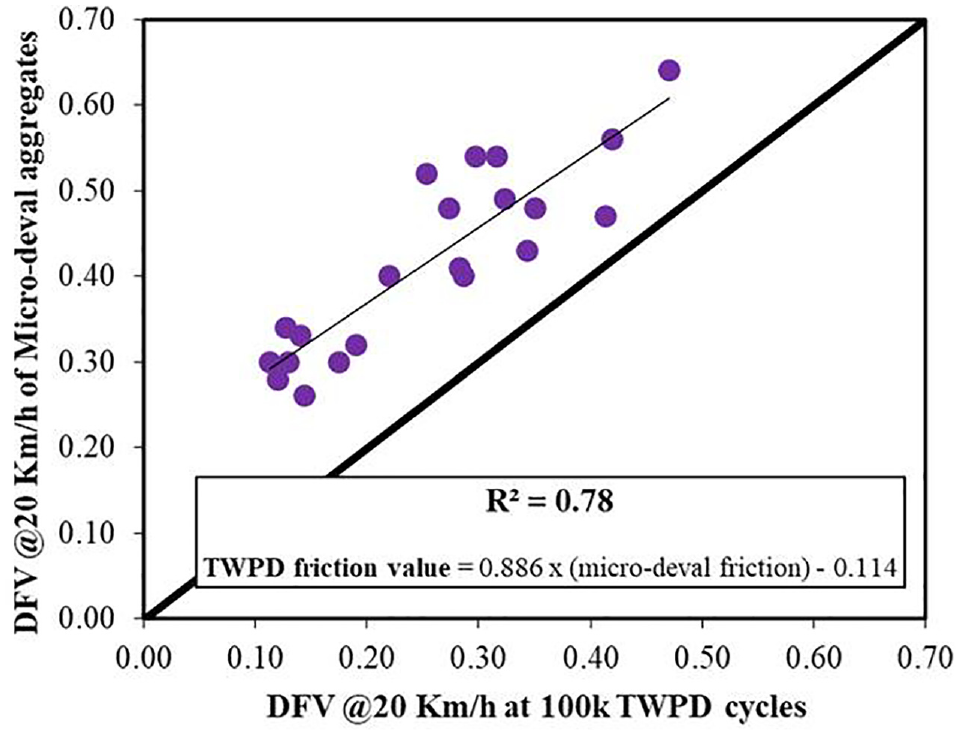
Correlation between the three-wheel polishing device (TWPD) method and the micro-deval method.
Table 3 summarizes the Pearson correlation ( 32 ) between the dependent and independent variables. The MDAL and LAAL tests showed a moderate correlation with the friction value, and the AIR test strongly correlated with the friction value. Since the SM test is weakly related to the TWPD friction measurements, it was excluded from the analysis.
Pearson Correlation between Dynamic Friction Value (DFV) and Independent Variables
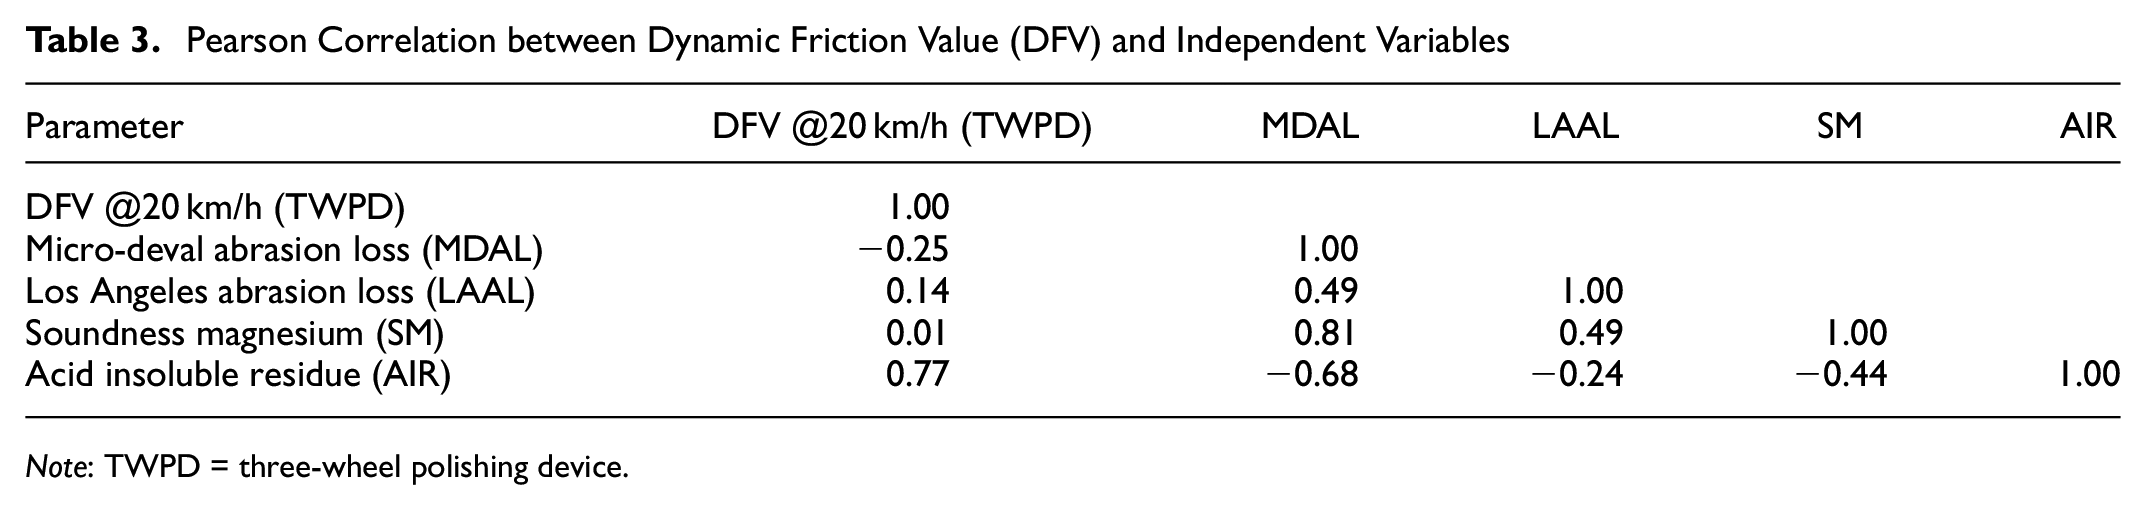
Note: TWPD = three-wheel polishing device.
Out of the 21 aggregates, 15 were randomly selected to develop a multiple linear regression (MLR) equation (training), while the remaining six were set aside to assess the veracity of the formulated equation (testing). Before proposing the MLR equation for predicting the aggregate friction value (DFVTWPD


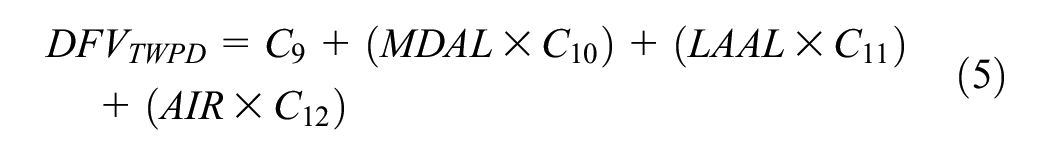
where C1 = 0.1627, C2 = 0.0019, C3 = −0.0237, C4 = 0.0095, C5 = 0.0027, C6 = −0.0536, C7 = 0.0077, C8 = 0.0022, C9 = −0.0958, C10 = 0.0065, C11 = 0.0046, C12 = 0.00226
Different Scenarios and their Prediction Capabilities
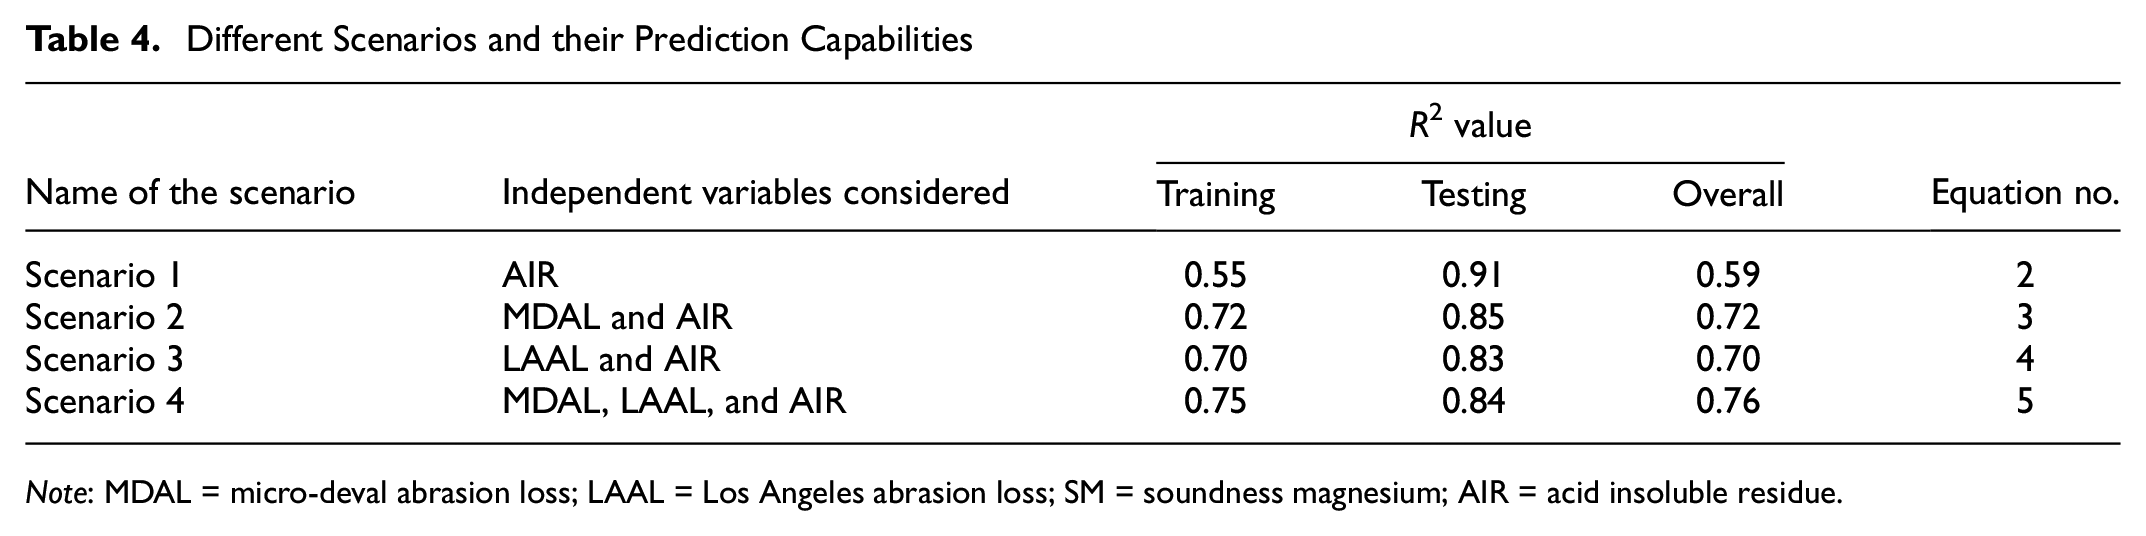
Note: MDAL = micro-deval abrasion loss; LAAL = Los Angeles abrasion loss; SM = soundness magnesium; AIR = acid insoluble residue.
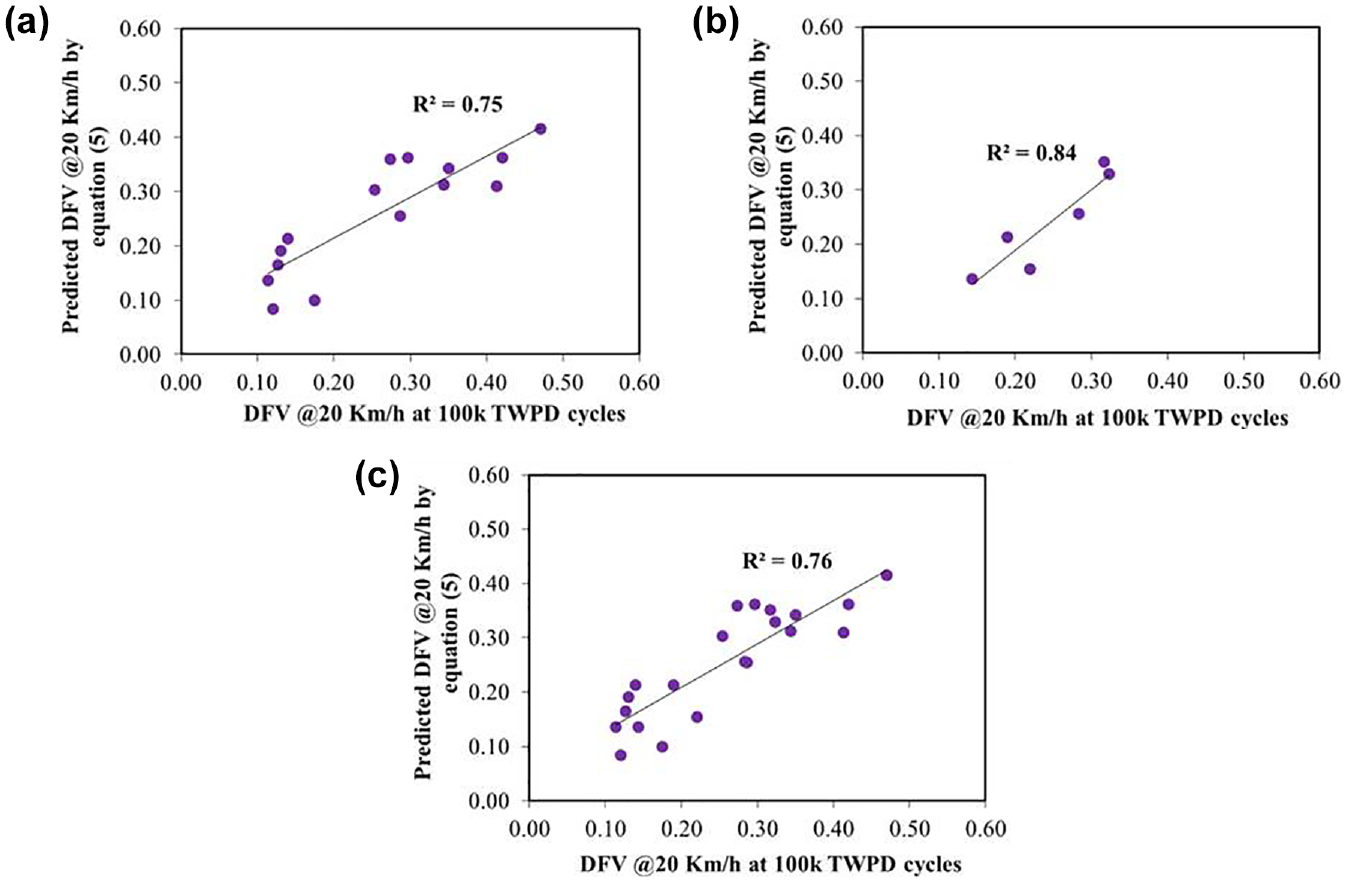
Performance of the multiple linear regression (MLR) equation: (a) training dataset, (b) testing dataset, and (c) overall dataset.
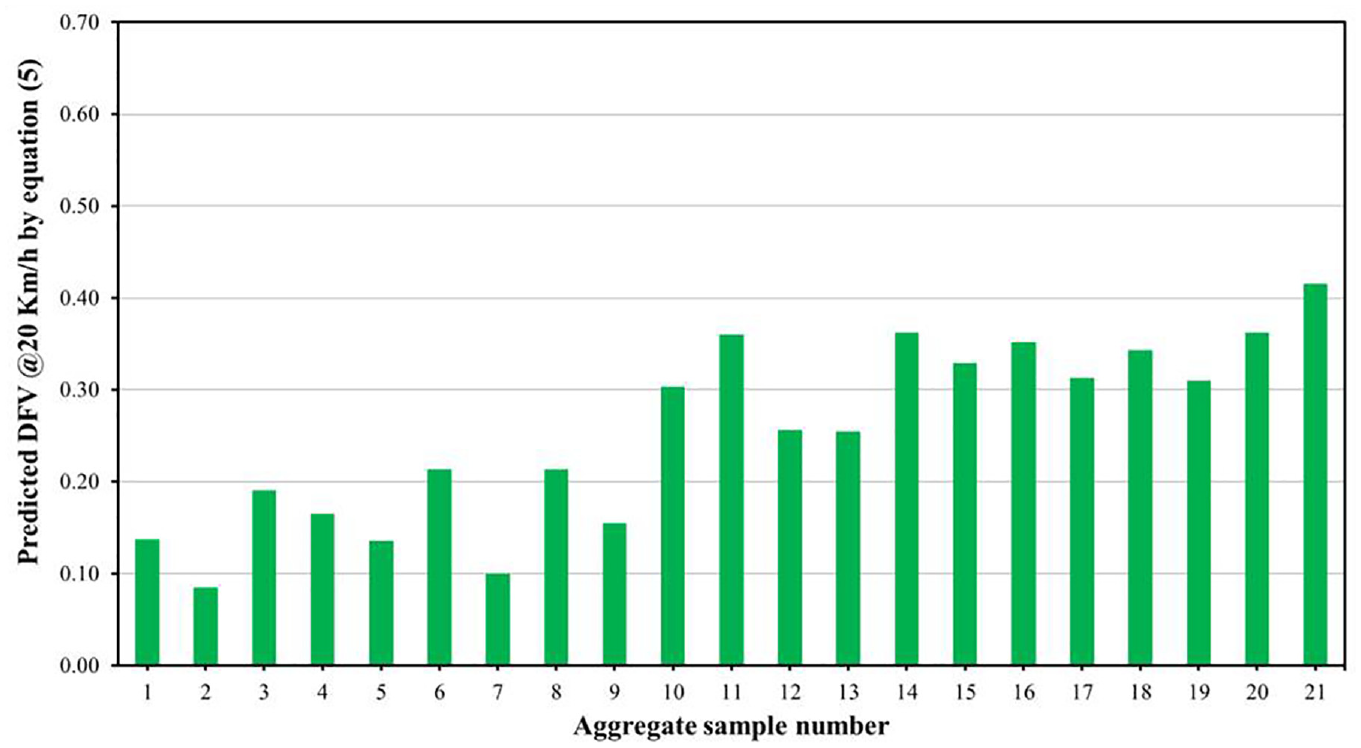
Predicted friction values for 21 aggregates by Equation 5.
Conclusions
This study aimed to explore the feasibility of using rapid alternative methods as surrogates for the AASHTO PP103 method in assessing the frictional resistance of aggregates. Two alternative approaches were examined. The first approach involved abrading the aggregates first using a micro-deval device, followed by evaluating the frictional resistance of the abraded aggregates using the DFT. The second approach utilized conventional aggregate test results as independent variables to predict the frictional resistance of aggregates.
The AASHTO PP103 method requires approximately 30 h from sample preparation to polishing up to 100k cycles using a TWPD, to testing with the DFT. Alternative 1, which utilizes micro-deval abrasion, requires only 8 h for abrasion and friction evaluation. Alternative 2 utilizes conventional aggregate test results (MDAL, LAAL, and AIR).
Both alternative methods exhibited reasonable correlations, with R2 greater than 0.75 and a standard error of estimate of less than 0.06 with the results from the more rigorous AASHTO PP103. These two methods can be used to screen the frictional properties of the aggregates more readily for the quality control and assurance of aggregates state-wide. These approaches could help DOTs assess frictional characteristics when actual testing is impossible, or quickly evaluate aggregate sources when changes to stockpile production occur. Nevertheless, caution should always be exercised to verify the friction characteristics of unsound and random aggregate sources. Further work is on the way to expand the database to over 100 sources so that the proposed relationships can be improved and become more reliable for use by DOTs.
Footnotes
Acknowledgements
The authors would like to express their appreciation to the undergraduate research assistants Hector Garcia, Daren Perez, and Adrian Gonzalez of the Center for Transportation Infrastructure Systems (CTIS) for their dedicated efforts in conducting the aggregate testing. Gratitude is also extended to the staff of the CTIS.
Author Contributions
The authors confirm contribution to the paper as follows: study conception and design: G. Sandeep Reddy, I. Abdallah, S. Nazarian, R. Izzo; data collection: G. Sandeep Reddy; analysis and interpretation of results: G. Sandeep Reddy; draft manuscript preparation: G. Sandeep Reddy, M. Montoya, I. Abdallah, S. Nazarian, R. Izzo. All authors reviewed the results and approved the final version of the manuscript.
Declaration of Conflicting Interests
The author(s) declared no potential conflicts of interest with respect to the research, authorship, and/or publication of this article.
Funding
The author(s) disclosed receipt of the following financial support for the research, authorship, and/or publication of this article: The author(s) received financial support from the Texas Department of Transportation.