
Abstract
Traffic speed deflection devices (TSDDs) have attracted much attention as innovative tools for assessing the structural capacity of highway networks. However, the sensor and operational limitations of these devices in assessing accurately and precisely the pavement structural condition have not been thoroughly established. In this study, the performance of the traffic speed deflectometer (TSD) measurements was evaluated using data from six instrumented pavement sections. The tested sections included different pavement types such as flexible, composite, and rigid pavements with varying overall level of stiffness. Based on the comparison between TSD measurements and the data obtained from field-installed instrumentation, TSD could measure the deflection velocity profiles reliably at flexible pavement sections. The level of noise superimposed on the signal of TSD deflection velocities was highly dependent on the pavement type and stiffness.
Traffic speed deflection devices (TSDDs) are moving measurement platforms that collect surface deflection measurements at or near traffic speeds covering up to 400 mi (640 km) a day without disrupting the normal flow of traffic ( 1 – 3 ). Development of TSDDs started in the 1990s, and the first working prototypes were released in the late 1990s/early 2000s ( 4 , 5 ). Since then, numerous studies have been performed to assess the performance of different devices and how best to interpret and use the data collected by the TSDDs for routine pavement structural evaluation, project-level pavement engineering, and network-level asset management ( 2 , 6–9).
The most popular TSDD is currently the traffic speed deflectometer (TSD). These devices span three generations, with the first-generation device limited to four Doppler lasers and the latest third-generation device equipped with as many as 10 Doppler lasers. Several different research groups have evaluated the applicability of TSDs. Rada and Nazarian ( 6 ) reviewed the state of the technology in continuous deflection devices. They concluded that the TSD had potential for network-level applications. They recommend further research to optimize the interval at which measured parameters are averaged while still giving adequate precision without too much loss of detail. Muller and Roberts ( 10 ) stated that the TSD had the potential to collect measurements of pavement deflection bowls at highway speeds comparable with falling weight deflectometer (FWD) deflection bowl measurements. Flintsch et al. ( 2 ) identified the TSD as a potential device for network-level structural evaluation in support of maintenance and rehabilitation decision making. Katicha et al. ( 11 ) reported that the rate of deterioration of the surface condition was affected by the measured structural condition and that TSD could replace the FWD for network-level applications.
The level of accuracy and precision of TSD measurements and the factors affecting these parameters are of great importance. Rada et al. ( 7 ) evaluated the second-generation TSD on instrumented pavement sections in Minnesota. They stated that although measurements farther from the applied load tended to be less accurate, TSD provided reasonable levels of accuracy for network-level evaluation. Duschlbauer and Lee installed an array of geophones and accelerometers within several pavement sections to compare TSD and geophone deflection velocities. They observed some discrepancies that were smaller than the variation between separate passes over the array. They indicated that the effects of different factors on the accuracy of the TSD data still needed to be investigated more thoroughly ( 12 ).
Several factors can affect the TSD deflection measurements. One of the key factors is the pavement characteristics, including the type of pavement, the type of materials used in the layers, and pavement smoothness (International Roughness Index, IRI). Flintsch et al. ( 2 ) studied the effect of pavement surface types on the laser capabilities and discovered that binder-rich surfaces negatively affected the operation of the TSD Doppler lasers. They also revealed that when measurements were averaged the standard deviation decreased in proportion to the square root of the number of measurements being averaged. Katicha and Flintsch ( 13 ) concluded that most variations in the TSD measurements could be attributed to the structural condition. Rada et al. ( 7 ) found that the spatial coefficients of variation (COVs) associated with the first four TSD sensors decreased as the FWD central deflection increased for the flexible pavements. The closest sensor to the load exhibited higher COVs than the other sensors on rigid pavements. They also found the accuracy of the TSD and COVs of the measured deflection parameters to be affected by the pavement stiffness but not significantly affected by roughness. Elseifi and Zihan ( 14 ) indicated that higher pavement roughness resulted in a higher COV. Levenberg et al. ( 15 ) stated that the TSD results exhibited a larger spread (higher variability) as compared with the FWD-derived results.
Even though some studies can be found in the literature on the effect of different parameters on the variability of TSD data, these are often limited in scope. The level of accuracy and precision of third-generation TSD laser sensors for different pavement types and stiffnesses is investigated in this study. This study used field TSD data collected at every 2 in. (50 mm), which did not appear in almost all previous studies, to more precisely study the accuracy and variability of TSD sensor measurements in a length of road with consistent pavement characteristics. The current study has benefited from TSD test results and instrumentation data at six different sections with a variety of pavement structures.
Objective
The objective of this study was to evaluate the performance of the deflection velocities collected by TSD Doppler laser sensors by assessing the accuracy and variability of the TSD data acquired at several roadway sections. Different pavement types and stiffnesses were covered in this investigation to determine the pavement-related parameters that affect the performance of the TSD measurements.
Methodology
Comprehensive experimental data were collected and analyzed to evaluate the accuracy and precision of the TSD measurements and to investigate the effect of pavement stiffness and type on these two concerns ( 16 ). Data collected in the field included TSD data, FWD data, embedded sensors data, and high-speed videos. Six pavement sections were instrumented to record their precise responses to TSD runs. The details of the field testing and the approach to assessing the impact of the mentioned parameters on TSD-measured data accuracy and precision are provided next.
Field Data Collection
Field experiments were conducted at the MnROAD facility operated by the Minnesota Department of Transportation. The MnROAD facility consists of 45 test sections with live traffic and a closed loop containing 28 sections (https://www.dot.state.mn.us/mnroad/). Six pavement sections that covered flexible and rigid pavements with different levels of stiffness were selected. To ensure the uniformity of the sections, the FWD tests were carried out at 3.3 ft (1 m) spacing. A COV of less than 2% was observed for the central deflection which indicated that the test sections were acceptably uniform and the variability in the data was small. The pavement types, layer thickness, and structural capacity of the six sections are shown in Table 1. These test sections covered a wide range of factors affecting the measurement characteristics, including:
pavement and surface type,
surface layer and total pavement thicknesses, and
structural capacity as determined based on measured SCI12 (the difference between FWD deflections at zero and 12 in. [300 mm] from the center of the load).
These sections were subjectively classified as Weak, Fair, or Strong using the SCI values for further reference in the paper. The SCI values were provided by the MnROAD staff based on the TSD measurements before field tests were carried out for this study. Since the test sections were all tested at about the same time and temperature, the resulting SCIs were deemed appropriate for the selection of the test sites. Sections 1, 2, and 3 were flexible pavements with thin (<4 in., 100 mm) asphalt layers and varying overall stiffness. Section 4 was also a flexible pavement but with higher stiffness and a thicker hot-mix asphalt (HMA) layer than the other flexible pavements. Section 5 was a strong rigid pavement with 9.5 in. (240 mm) of Portland cement concrete (PCC) and Section 6 was a composite pavement section comprised of a 3-in. (75-mm) thick asphalt layer placed over 6 in. (150 mm) of PCC. Both Sections 5 and 6 were considerably stiffer than the rest of the pavement sections.
MnROAD Test Sections Properties
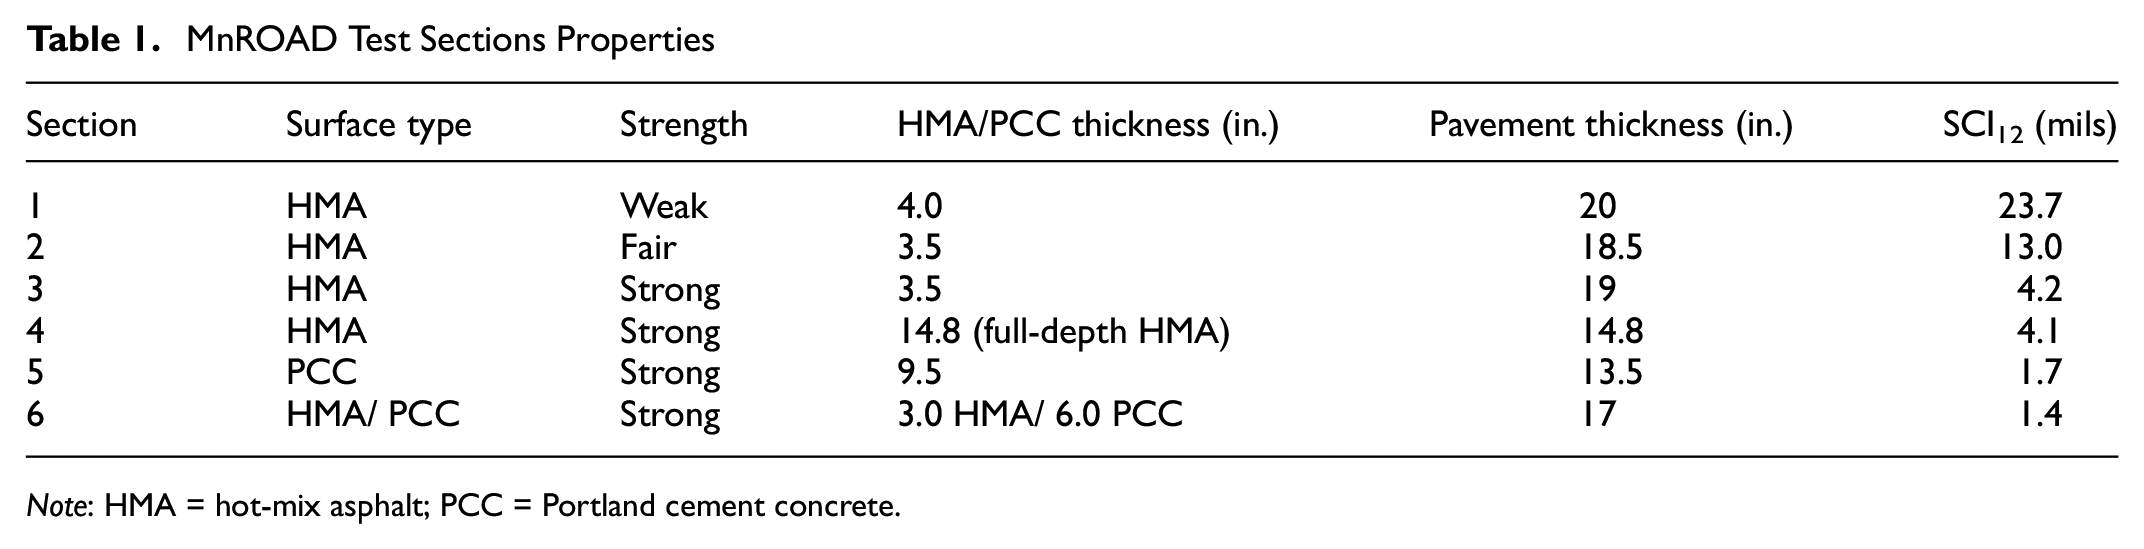
Note: HMA = hot-mix asphalt; PCC = Portland cement concrete.
Instrumentation
As shown in Figure 1, geophones were selected for instrumenting the six MnROAD pavement test sections to measure the surface particle velocity (in TSD terminology deflection velocity) time histories from the TSD transient moving loads. Velarde et al. ( 17 ) thoroughly explain the process of the installation, validation, and testing of geophones for this specific application. Three geophones were embedded in the outer wheel path of each test section spaced nominally 3 ft (1 m) apart along the center of the wheel path (Figure 2). Geophones were deliberately selected since they essentially measure the same parameters as the TSD lasers. The performance of the geophones was verified using FWD test results conducted in each section. For that purpose, one of the FWD sensors was placed directly on top of each embedded sensor. The deflections reported by the FWD were then compared with the corresponding deflections reported by the embedded geophones. The deflections of the FWD and embedded geophones were within about 0.2 mil (5 µm) of one another. Therefore, embedded geophones were considered reliable in assessing TSD accuracy.
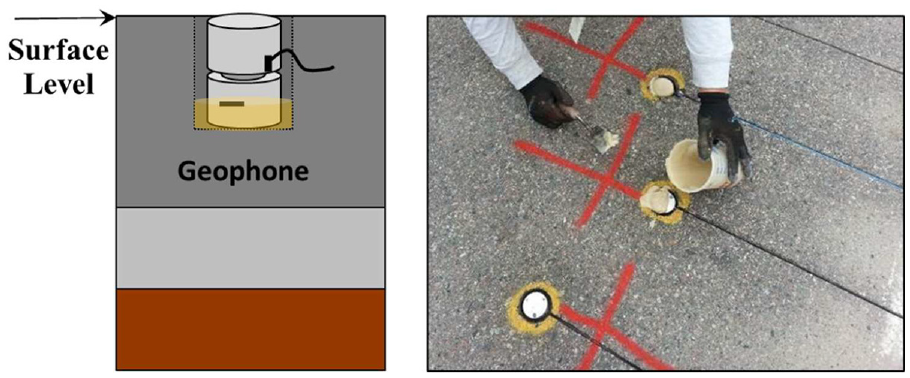
Schematic of geophone installed and installing geophone in the field.
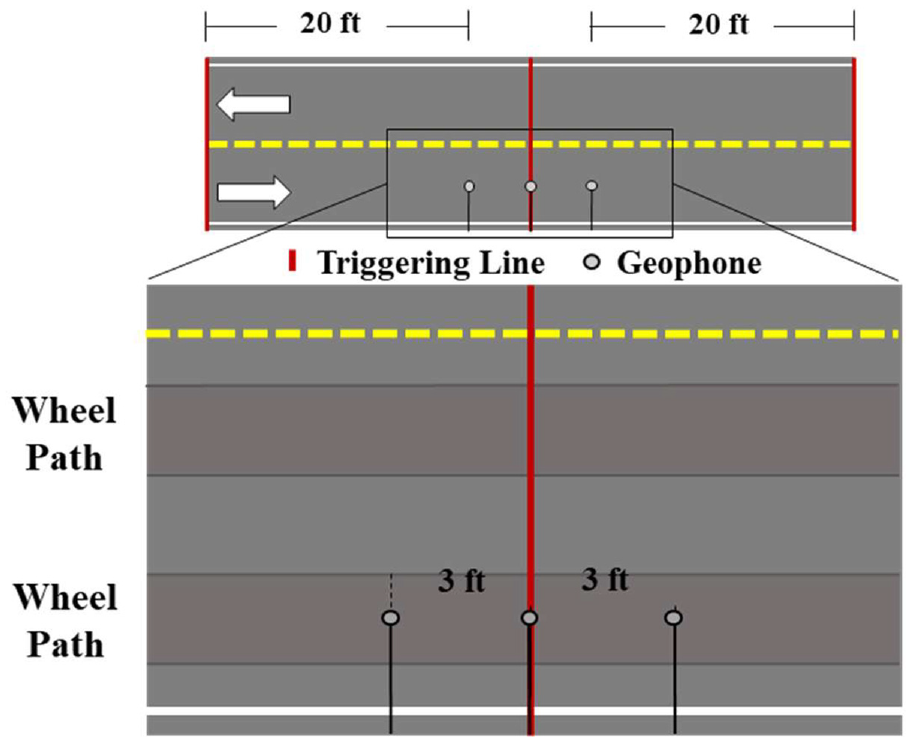
Arrangement of the three geophones embedded in each section.
TSD Tests
At each test section, TSD was operated at different speeds along a length of the pavement that was structurally consistent. The TSD shown in Figure 3 was used in this study to collect the deflection velocity profiles under tire loading. The rear axle consisted of a single axle with dual tires spaced 13 in. (330 mm) apart. Tire pressure of 120 psi (830 kPa) and a nominal load of 5,200 lbs (2,350 kg) per tire were applied by the rear right dual tires. These parameters were verified before actual field testing. The Doppler laser configuration is shown in Figure 4. Three sensors were mounted behind and eight more sensors were located ahead of the tire at the distances shown. Similar to all other TSDs, the device was not equipped with a sensor at the center of the tires.
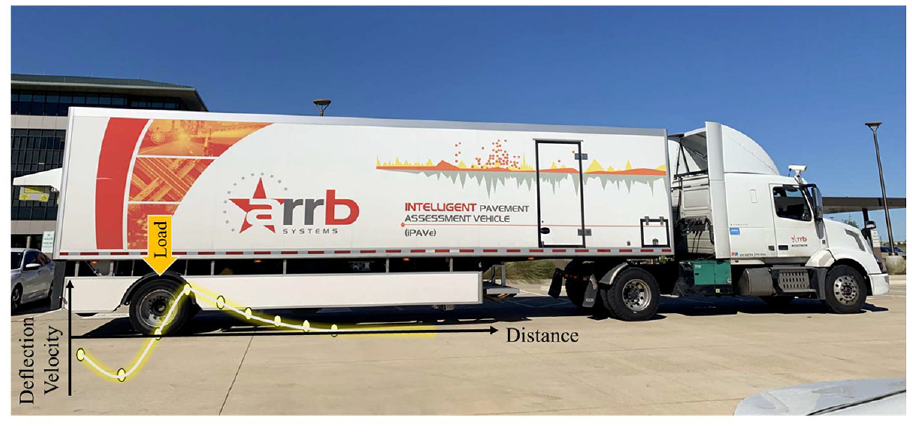
Traffic speed deflectometer used in this study.
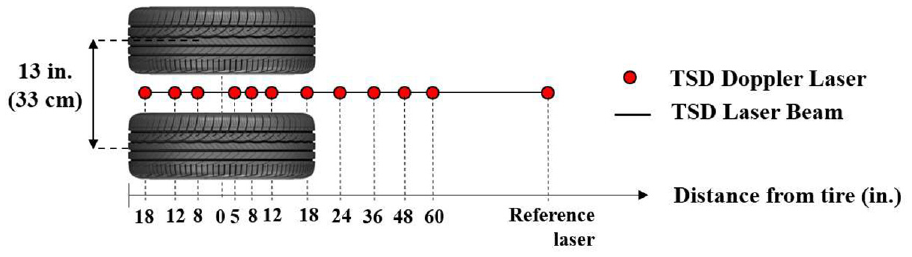
TSD instrumented rear axle dual tires with Doppler laser sensor configuration.
At each test section, the TSD data were nominally recorded every 2 in. (50 mm). The data over a distance of 46 ft (14 m), starting 23 ft (7 m) before the middle geophone and ending 23 ft (7 m) ahead of it, were extracted for this study. For Sections 1, 2, and 3, five or six runs of the TSD at 30 mph (48 km/h) and 45 mph (72 km/h) mph were conducted. For Sections 4, 5, and 6, five or six passes of TSD were conducted at operating speeds of 30 mph, 45 mph, and 60 mph (48 km/h, 72 km/h, and 96 km/h). TSD tests were conducted at different speeds to account for any potential impact of the speed on the measurements.
In the context of this study, the accuracy was evaluated by comparing the TSD particle velocities (a.k.a. deflection velocities) at each test section with the corresponding particle velocities from validated geophones embedded in the pavement sections. The average deflection velocities recorded by each TSD sensor along a 120-in. (3-m) length of each pavement section were calculated. This length in the middle of the section where geophones were embedded was used to further ensure uniformity for the accuracy tests. At each TSD sensor location, the average of the deflection velocities captured by the three embedded geophones was also determined. The two sets of data mentioned above were compared to determine the level of accuracy. The rationale behind the 20% limit comes from the review of the macro- and micro-variability of the raw data collected by the TSD in Minnesota.
For a proper comparison, the TSD laser beam must pass directly on top of the geophones (i.e., the geophones remain between the dual tires where the laser beam stands). To ensure the proper alignment of the tires, a high-speed video camera was mounted in between the TSD tires to record the pavement surface during the TSD operation. Figure 5 shows a sample image frame for the best-aligned pass for Section 1, at a speed of 30 mph (48 km/h). The location of the Doppler laser sensor mounted in the TSD rear axle indicated as a red point within a yellow circle is shown relative to the middle geophone. In the image, two accelerometers are also shown on two sides of the geophone which were not used in this study. For each test section, the best-aligned TSD pass among several passes was identified by reviewing the video frames.
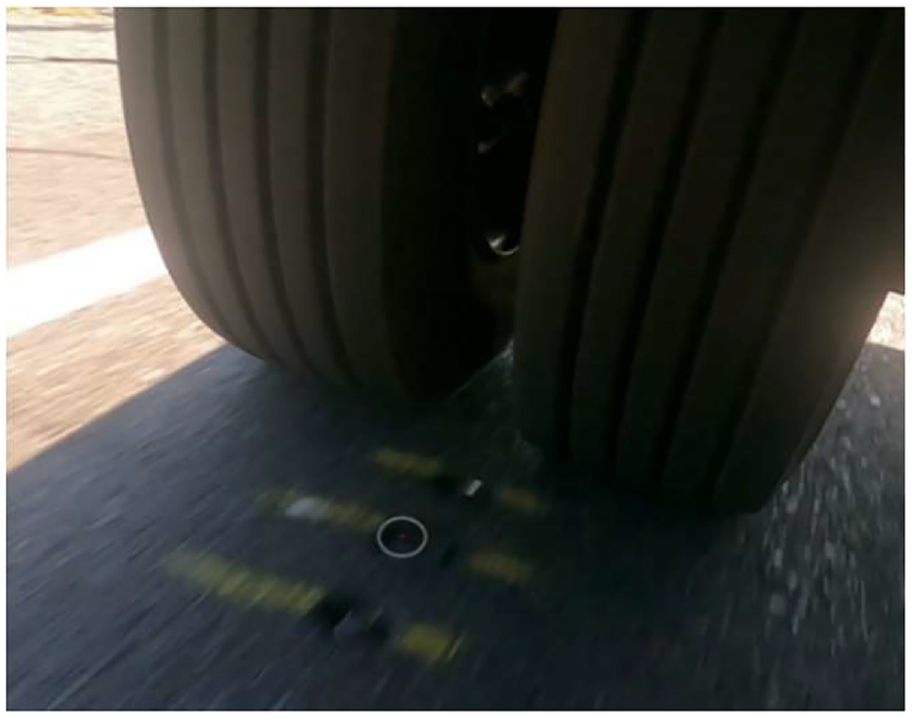
Image frame of the best-aligned TSD pass at Section 1 at a speed of 30 mph.
To examine the precision of the TSD data at each pavement test section, the standard deviation,


where
In this case, the deflection velocities measured at 2 in. (50 mm) for each TSD sensor were averaged over 3.3 ft (1 m) of the pavement section to reduce the variability. The standard deviation of the mentioned data and subsequently the COV were determined. The magnitudes and changes in those parameters were then analyzed to determine the level of precision of the TSD data at different pavement structures, as well as the effect of different factors such as pavement stiffness, pavement type, and vehicle speed on the TSD data precision.
Results and Discussion
To determine the accuracy and precision, the TSD data and those from geophones were collected at different vehicle speeds at the six pavement sections. The variations of deflection velocities associated with the embedded geophones and best-aligned TSD pass at 30 mph (48 km/h) for Section 1 are provided in Figure 6. The data points show the mean TSD deflection velocities of each TSD laser sensor along the test section, as well as the curve showing the variation of the average responses obtained by geophones when TSD has passed over them. The error bars show the standard deviation of the TSD measurements along the test section. The results from the three geophones at the site were within 2% of one another. The TSD and geophone deflection velocities show good agreement.
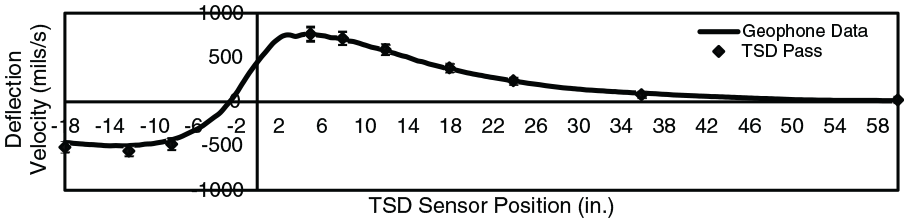
TSD collected data versus geophones obtained data averaged at each TSD sensor position for Section 1 at 30 mph (48 km/h).
Accuracy
The variations of deflection velocities recorded by the installed geophones with those of the TSD sensors using the best-aligned pass at each section are summarized in Figure 7. Symbols represent the mean deflection velocities corresponding to each TSD sensor along a 120-in. (3-m) length of the pavement sections.
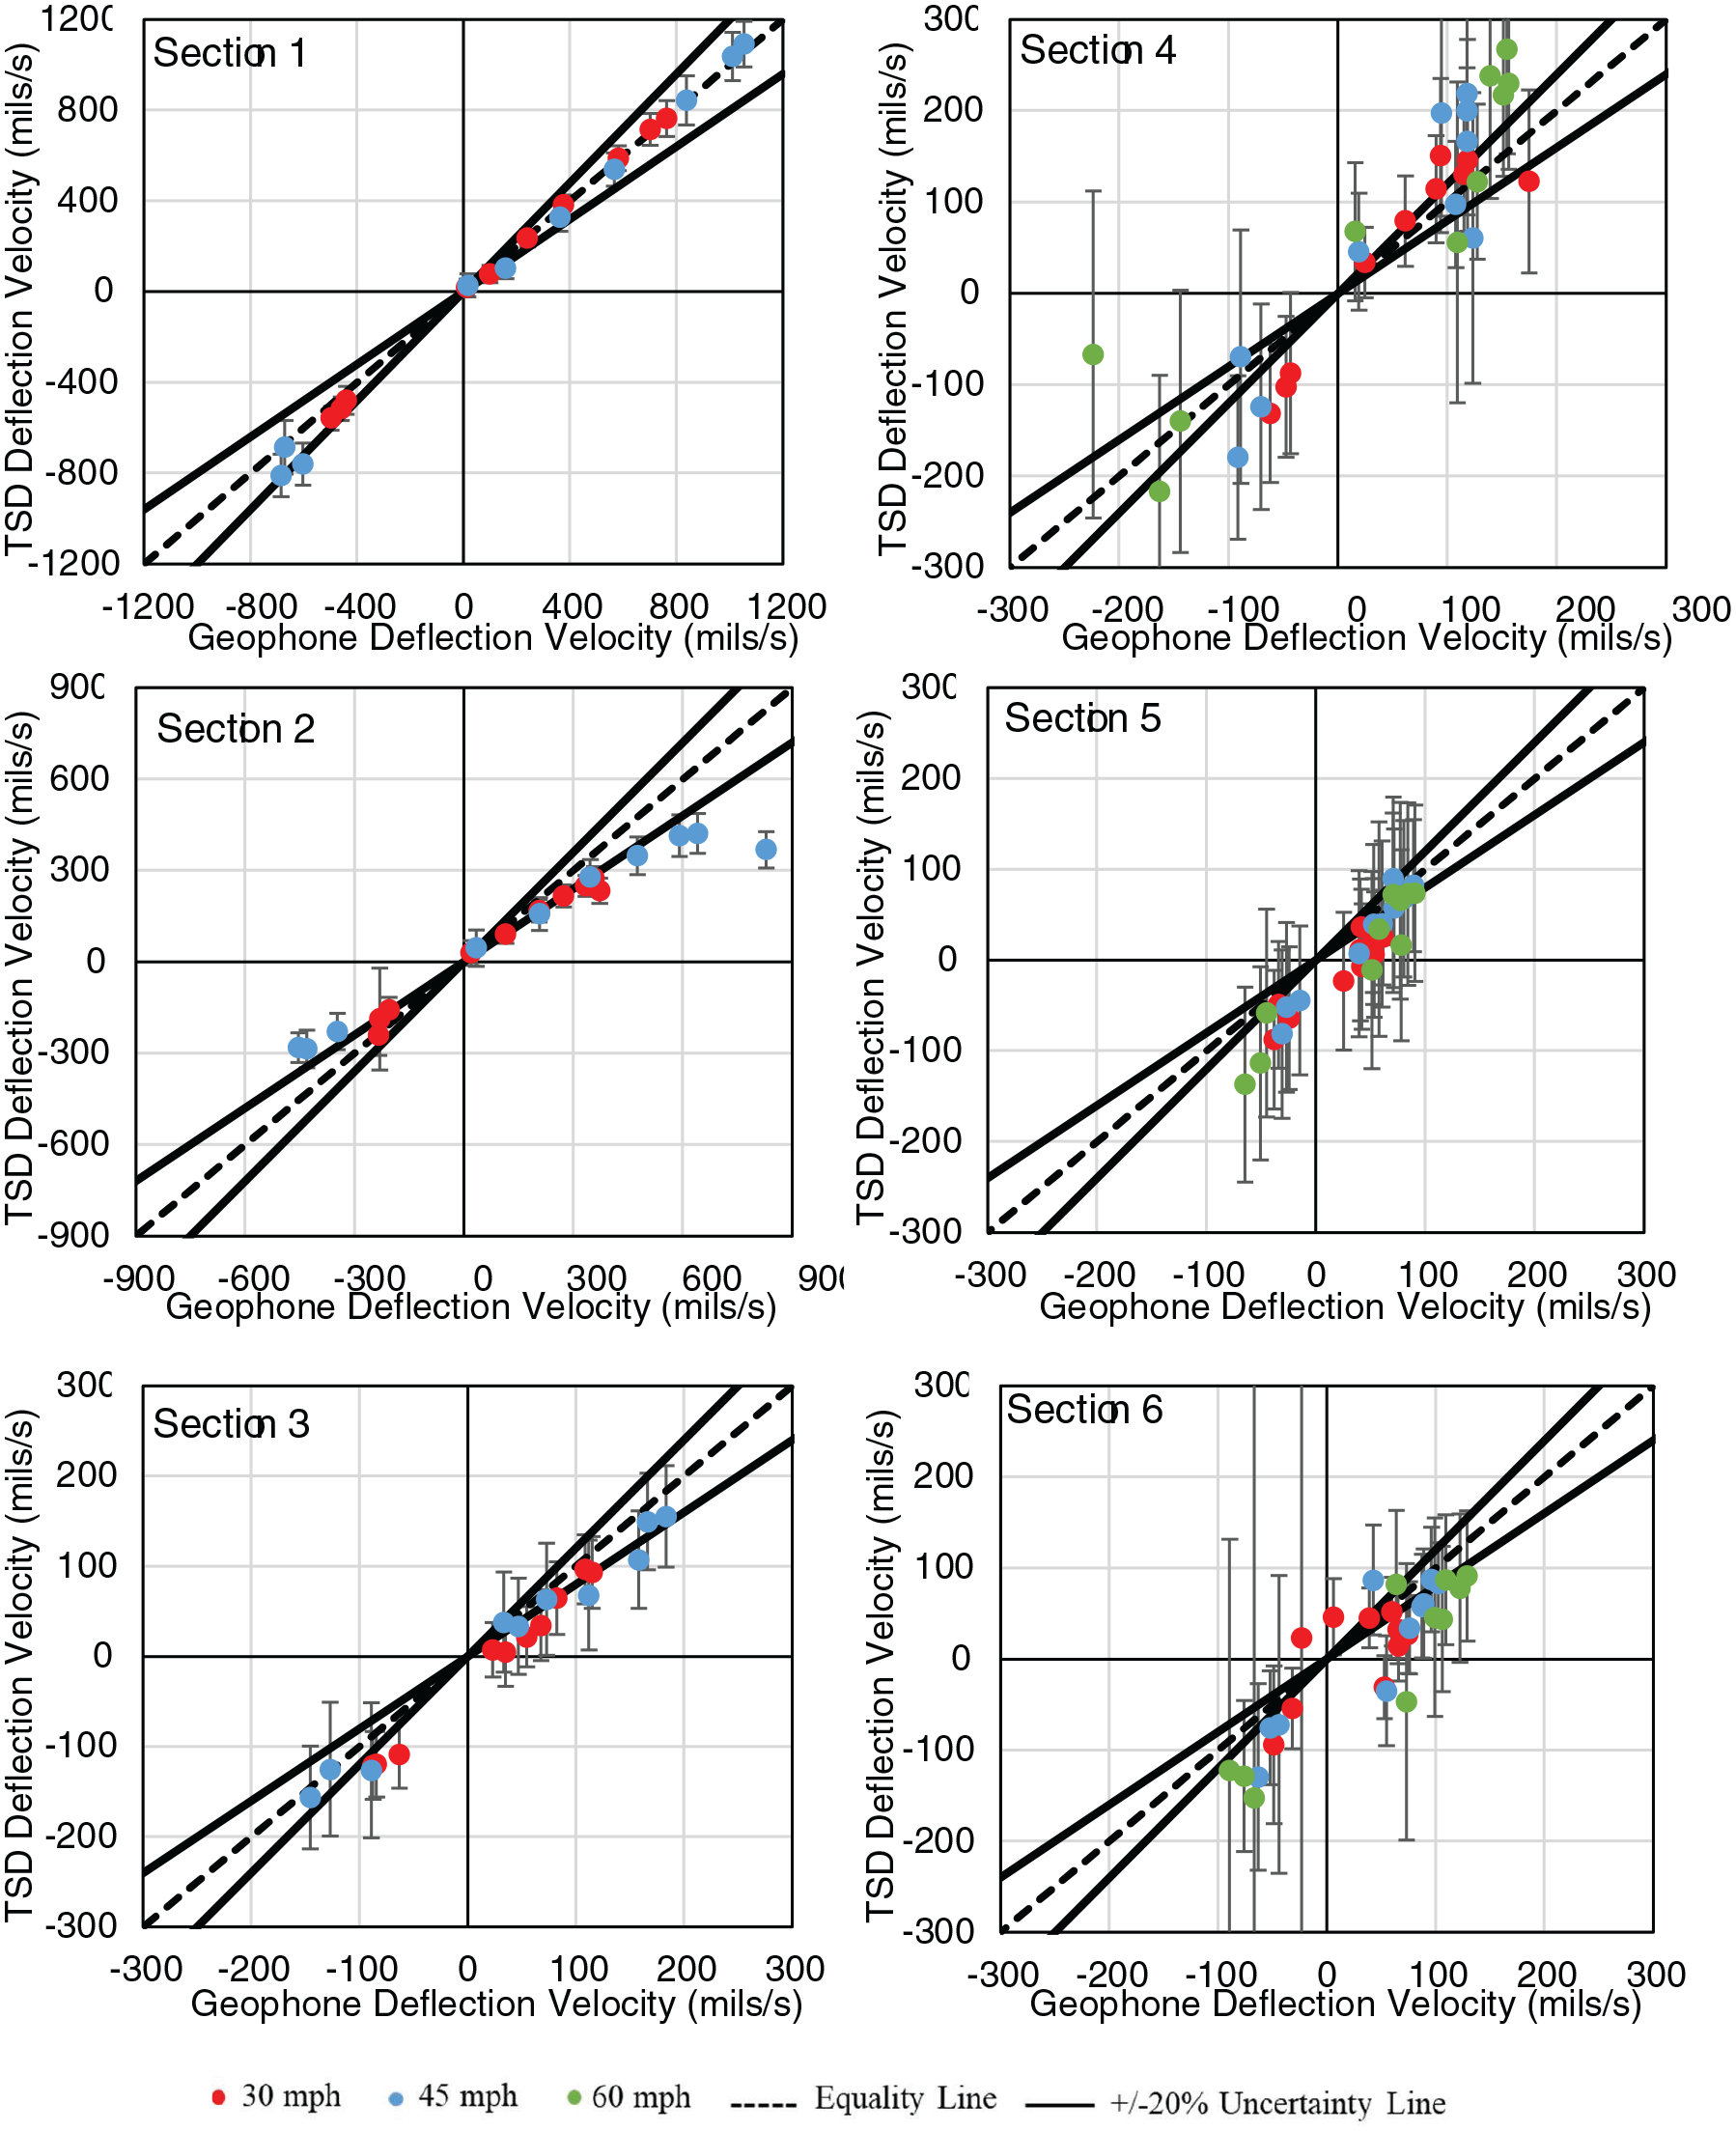
Comparison of TSD deflection velocity averaged over 120 in. (3 m) length and the average deflection velocity from three embedded geophones at the best-aligned pass for each section.
The standard deviations of the TSD collected data are shown by vertical error bars. The standard deviations of the geophone data do not appear because they were small. The mean TSD results are closer to the geophone measurements in Sections 1, 2, and 3 (flexible pavements with thin HMA layers) compared with Sections 4, 5, and 6 (full-depth HMA flexible pavement, composite pavement, and rigid pavement). For Sections 1, 2, and 3 the mean deflection velocities of the majority of the TSD sensors fall within a ±20% uncertainty bound. With an increase in the stiffness of the pavement sections from Sections 1 through 3, the differences between the TSD measurements and the geophones recorded data increase. For the stiffest flexible pavement, composite pavement, and rigid pavement of Sections 4, 5, and 6, the measurements corresponding to the majority of the TSD sensors are positioned outside the ±20% uncertainty bounds at all vehicle speeds. In Sections 5 and 6, TSD underestimated the deflection velocities of the pavement surface particles at many TSD sensors. This observation was not made at four flexible pavement sections in which TSD both underestimated and overestimated the pavement responses at different sensor locations. The large vertical error bars for Sections 4, 5, and 6 signify high standard deviations of the TSD deflection velocities for the stiffest flexible and rigid pavements that were not supported by geophone results.
The TSD speed also seems to affect the accuracy of the deflection velocity measurements. Most of the plots in Figure 7 exhibit a greater overall deviation of the TSD measurements from corresponding geophone velocities at higher speeds compared with 30 mph (48 km/h) speed. In general, TSD seems to collect data that is different from the geophones’ data at stiffer pavements and higher operational speeds.
Precision
The raw deflection velocity measurements collected at 2-in. (50-mm) intervals for a speed of 30 mph (48 km/h) along a length of about 46 ft (14 m) at each test section are shown in Figure 8. The deflection velocities are smaller for Section 3 than for Sections 1 and 2 since Section 3 represents the stiffest flexible pavement among them. Sections 4, 5, and 6, which include the full-depth flexible HMA, and rigid pavements, exhibited lower deflection velocities when compared with the first three sections. The changes in plots for the least stiff section (Section 1) to rigid pavement sections with the highest stiffness (Sections 5 and 6) show that with an increase in stiffness of the test sections, more dispersion is observed in data points of different TSD sensors. Given the dispersion in the data, only the data averaged over a distance of 3.3 ft (1 m) were considered for the determination of the precision.
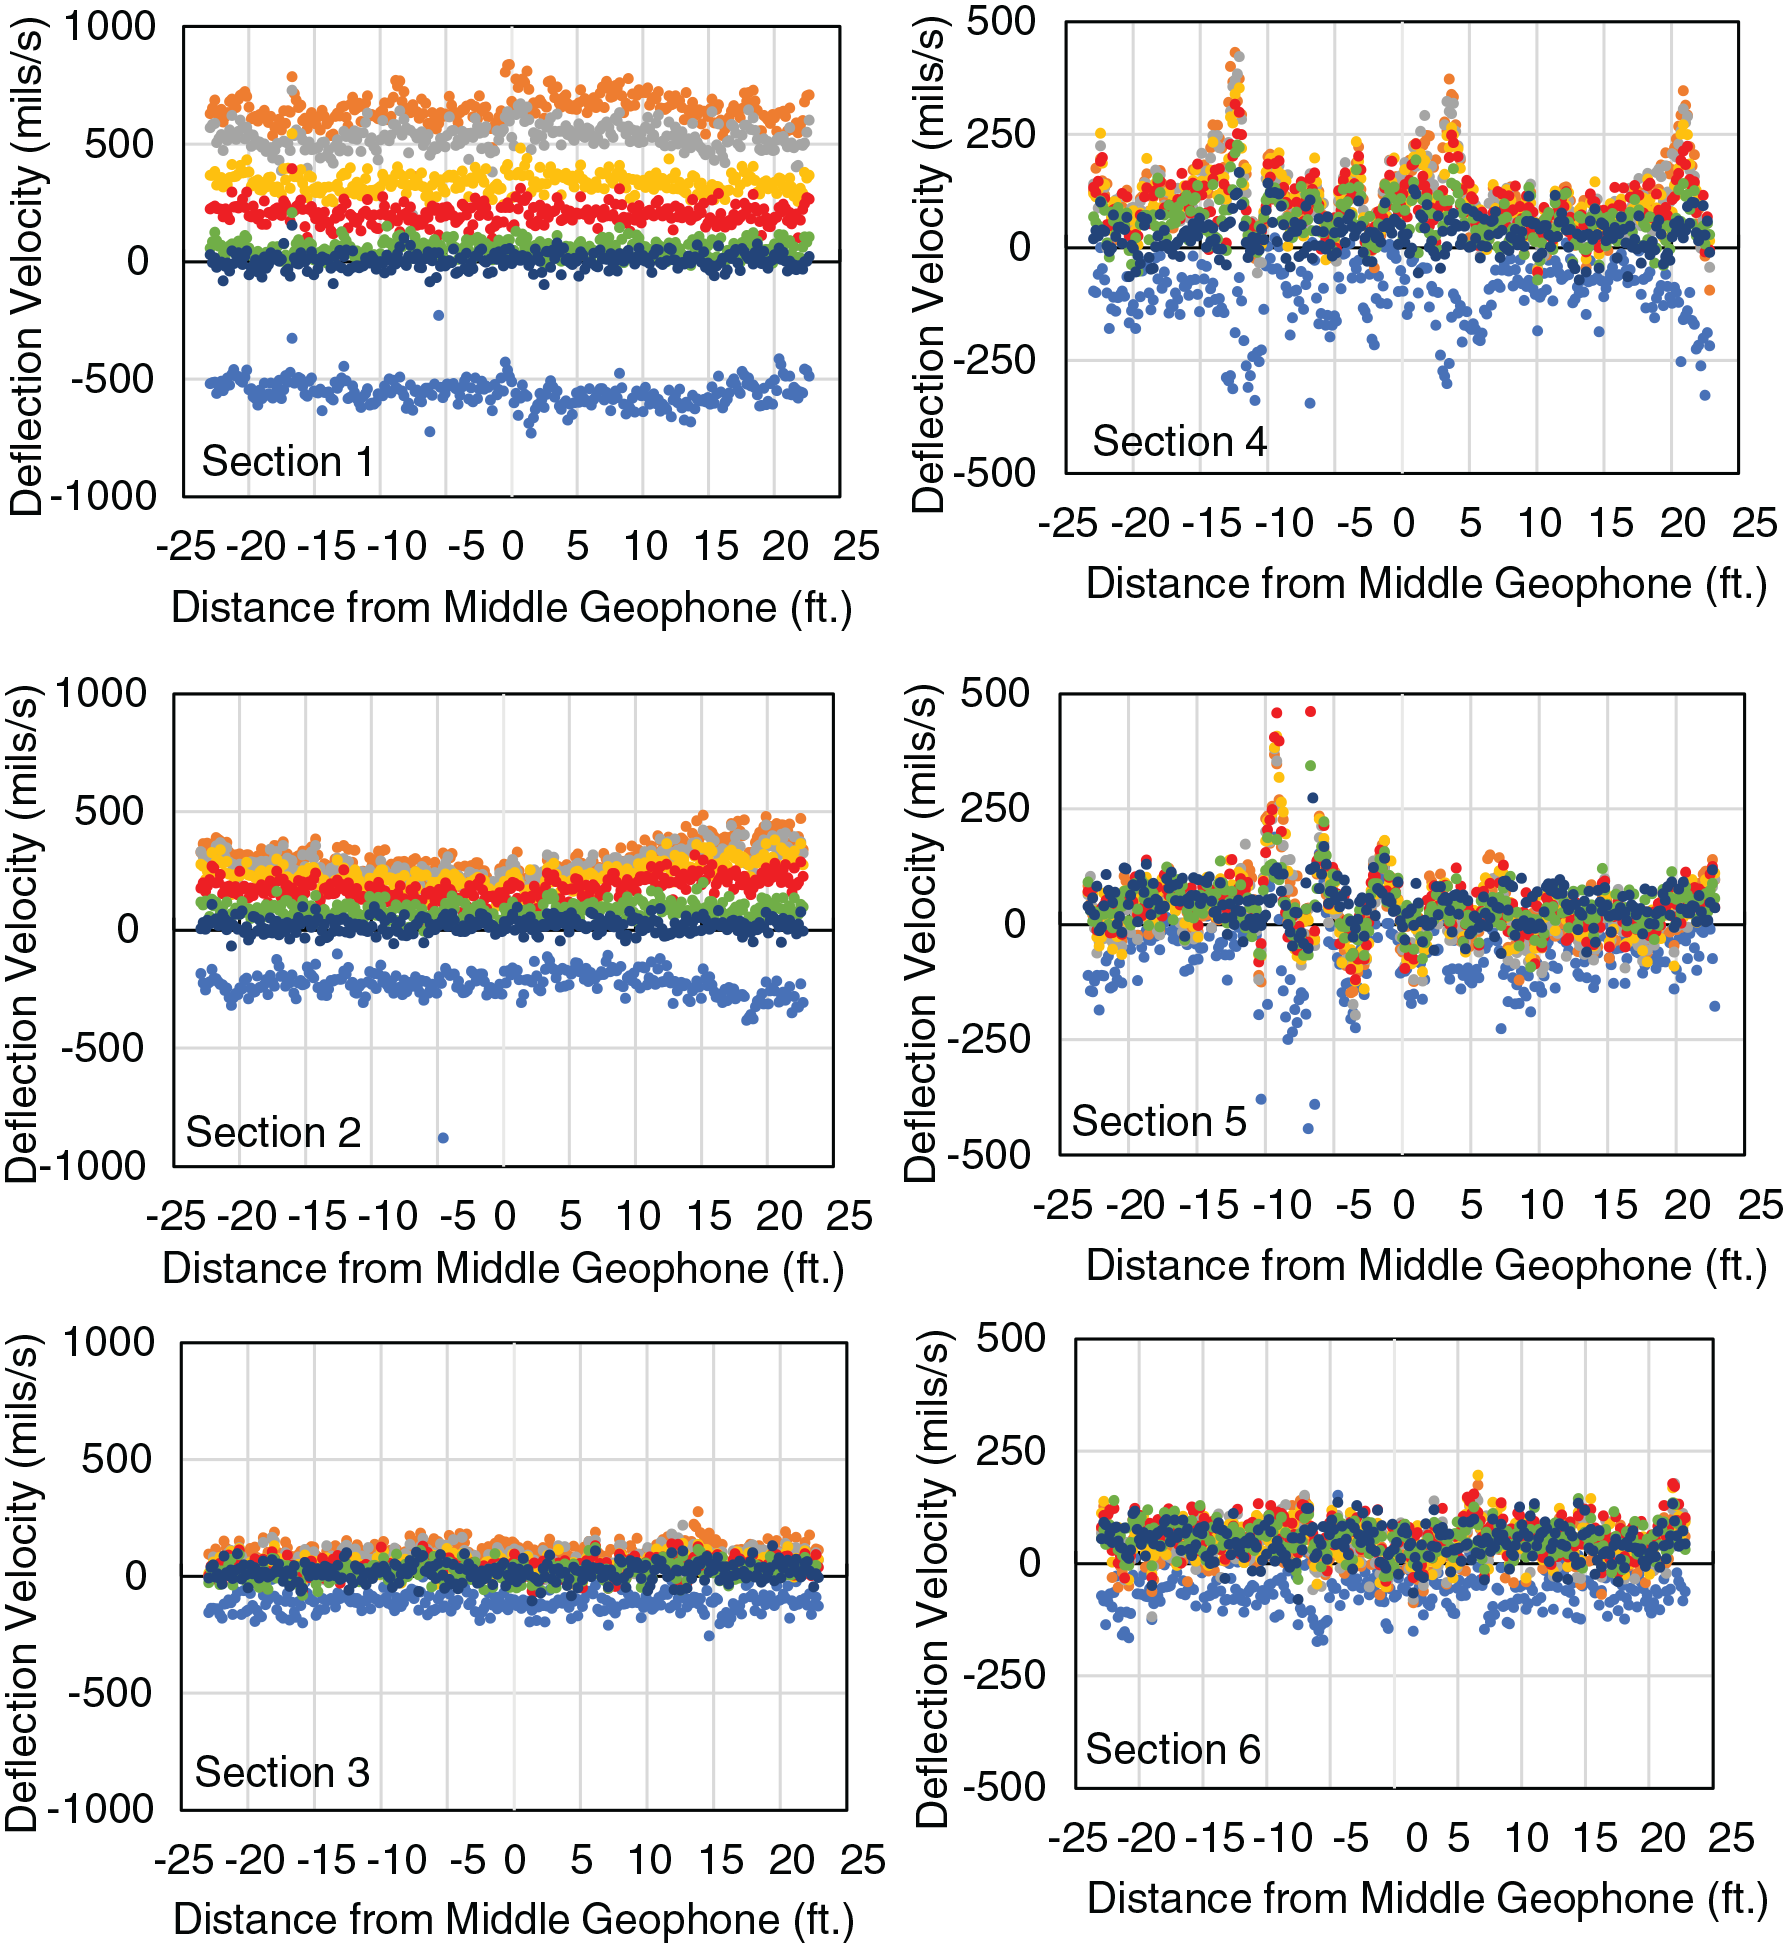
TSD deflection measurements in MnROAD test sections reported at 2-in. (50-mm) intervals.
Statistical information about the deflection velocities obtained by TSD sensors at different speeds is shown in Figure 9 for each of the six test sections. The average deflection velocities from each section from data averaged over 3.3 ft (1 m) are shown as error bars for different TSD sensors. In addition, any data outside the 10% and 90% cumulative distribution were eliminated as outliers. Error bars represent the ±1 standard deviation (σ) range for the deflection velocities of each sensor. For clarity, the corresponding coefficients of variation are shown on top of each bar to document the variability of the measured data. Different colors of bars are related to different operational speeds at which TSD collected the data.
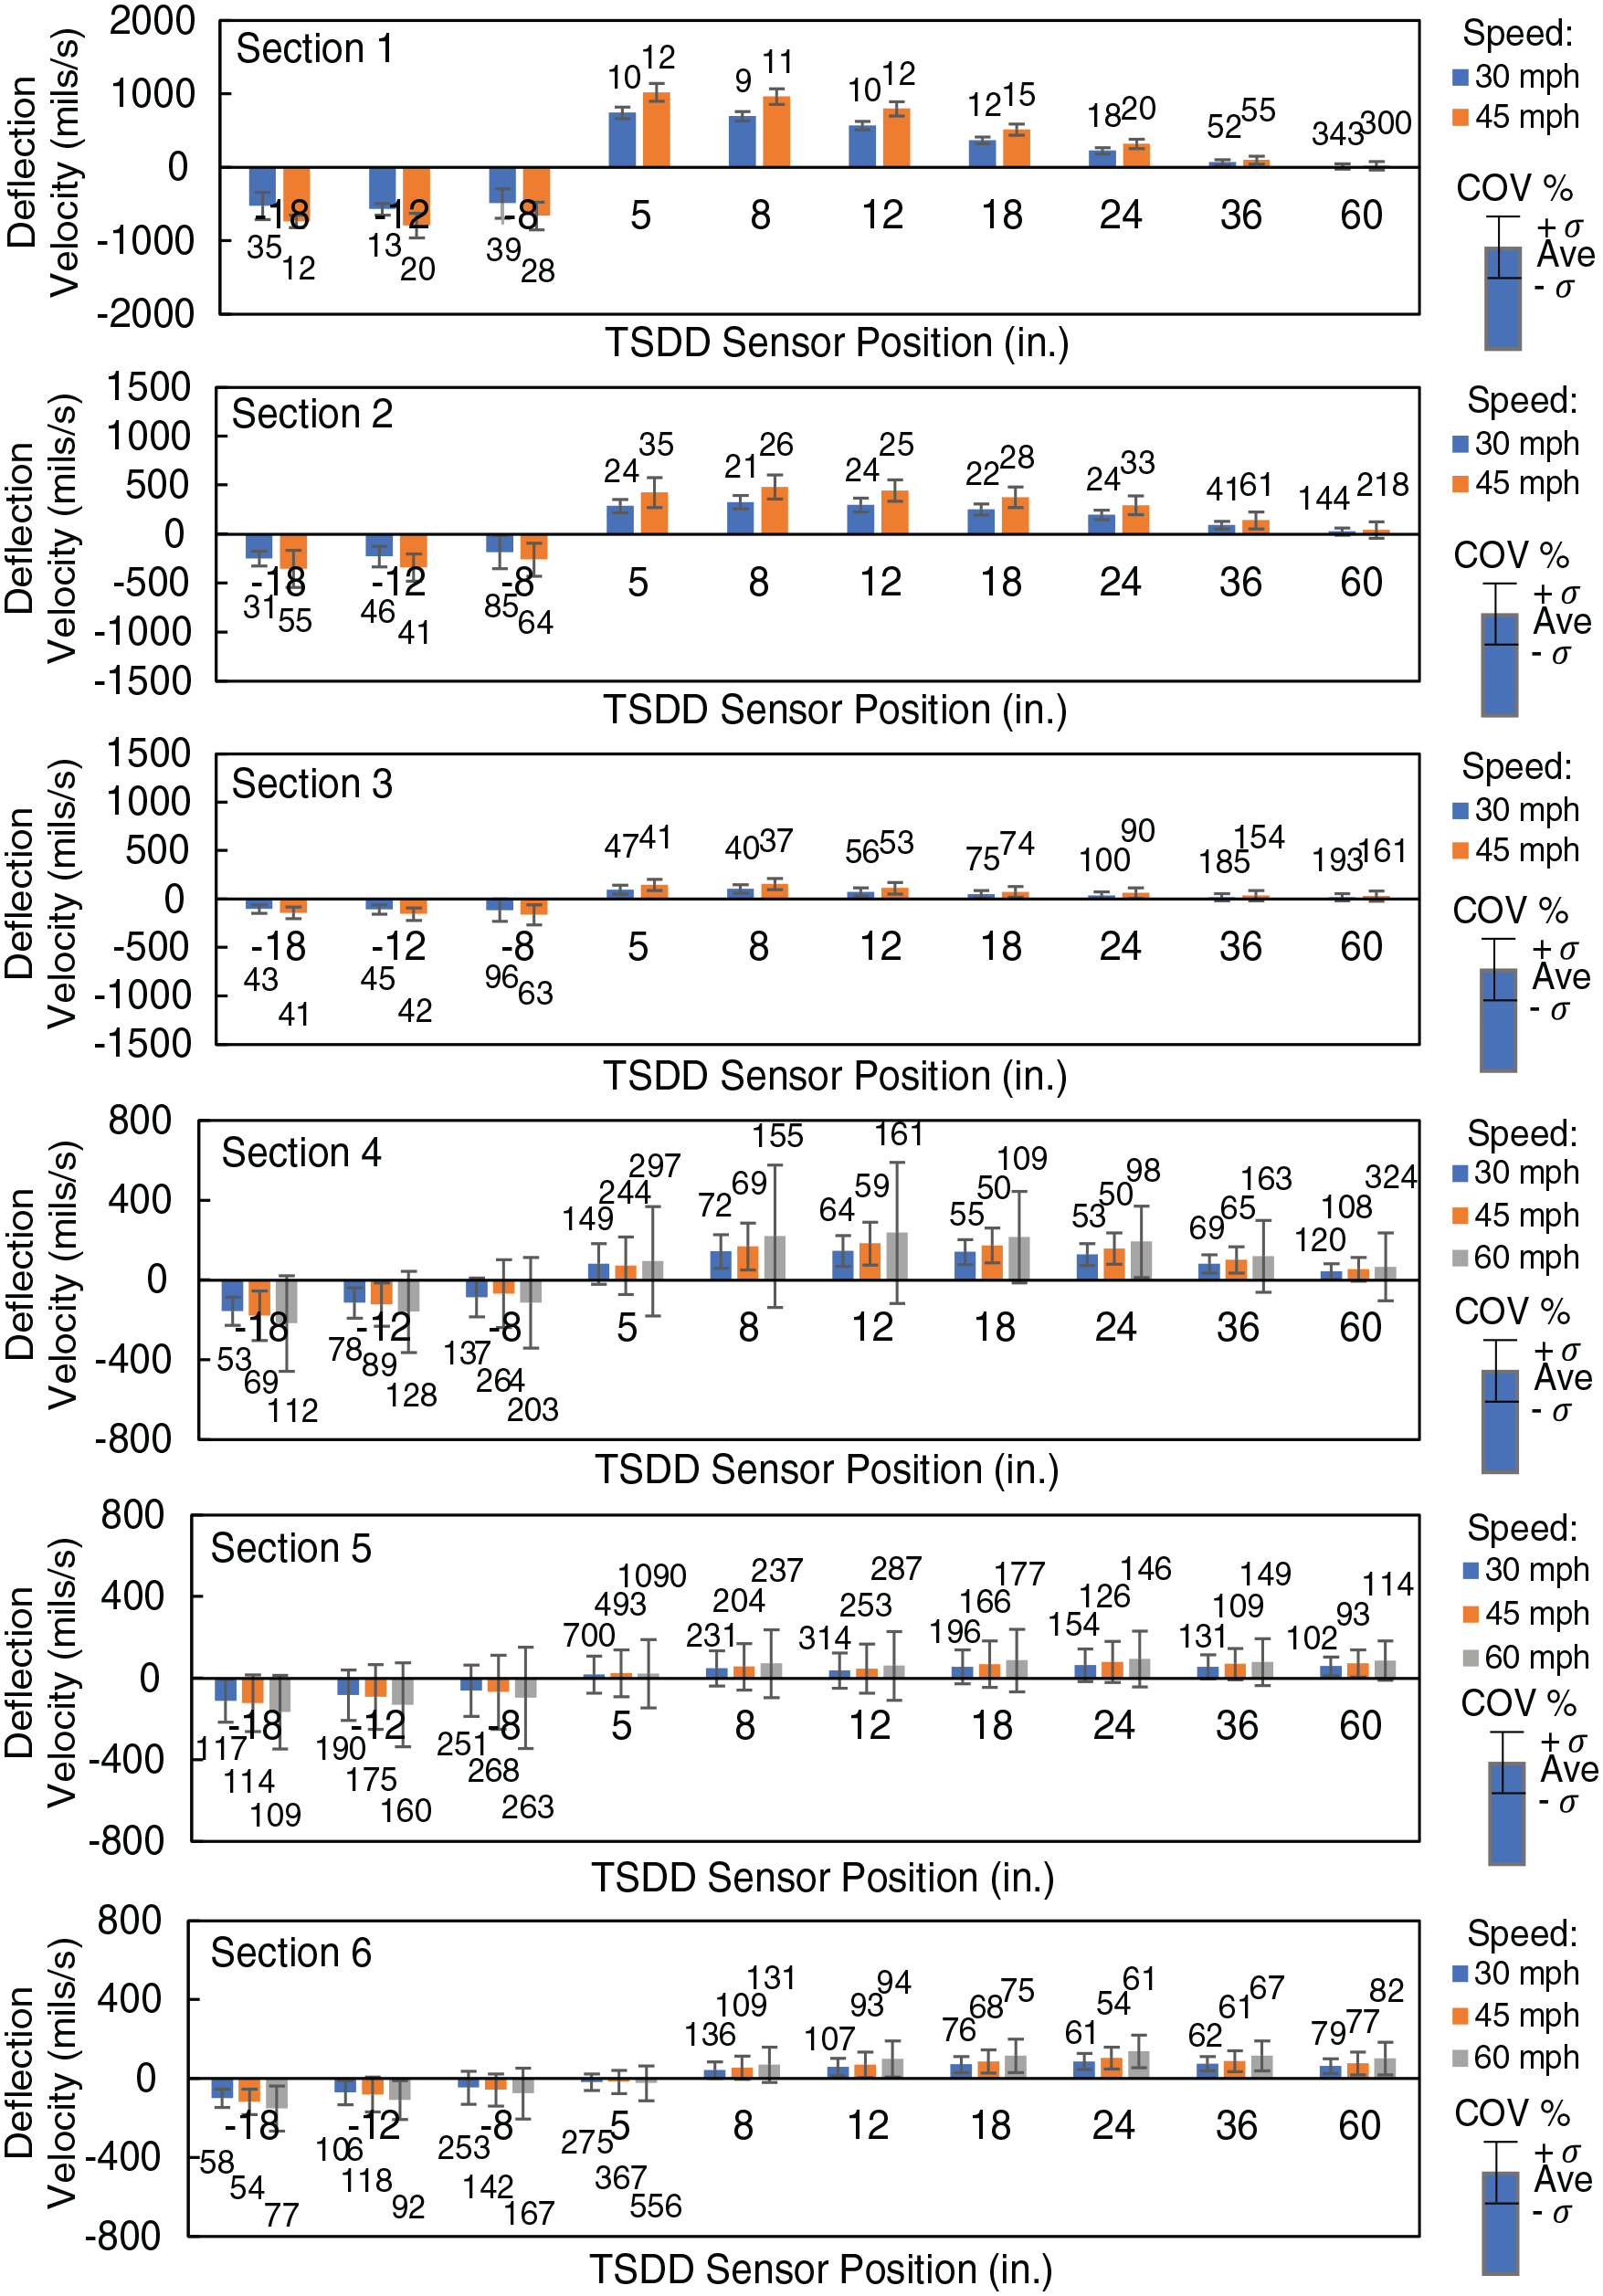
Variability of TSD deflection velocities in MnROAD test sections estimated using TSD data averaged over 3.3 ft (1 m) intervals.
The variability of data varies for different sensor locations and test sections. The COVs of the measurements for the two farthest sensors exceeded 100% for almost all sites. For these sensors, the deflection velocities are too small to be captured precisely by the sensors. In Sections 1, 2, and 3, the COVs of the sensor measurements decreased as the sensors got closer to the tire load. The COVs for different sensors are larger in Section 3 than in Sections 1 and 2, indicating that higher stiffness resulted in higher variability of the deflection velocities measured by TSD sensors. The speed does not generally seem to affect the measurement in the same way for all sensors. Therefore, no trend was observed for the impact of speed in the variability of the TSD data at flexible pavements.
The variability of the deflection velocities expressed as COVs is notably higher for Sections 4, 5, and 6 compared with Sections 1, 2, and 3. The COVs for Sections 4, 5, and 6 exceeded 100% for the majority of the sensors, even those close to the tire load. Overall, the location of the sensor relative to the tire load did not seem to have a specific effect on the TSD measurement variability of Sections 4, 5, and 6 as the COVs did not follow a particular trend when sensors got farther from the loading tires. The change in vehicle speed on the very stiff flexible pavement or rigid pavements affected the variability of the sensors’ data, but the changes did not show a constant trend. A comparison of the statistical parameters of all six test sections indicates that generally, an increase in stiffness in changing pavement type from flexible to rigid or increasing the stiffness in flexible pavements results in higher magnitudes of variability.
The variability of the deflection velocities of all TSD sensors at different speeds for the six test sections obtained after averaging the data along 3.3 ft (1 m) is plotted against their corresponding average deflection velocities in Figure 10. An inverse relationship is observed between the magnitude and COV of deflection velocities. In other words, the smaller the magnitude of defection velocity is, the higher the variability will be. Lower deflection velocities correspond to measurements collected by sensors located farther away from the tire loading or obtained at sections with stiffer pavements. Variability in measurements seems to increase with the vehicle speed as well. It is difficult to comment on the source of the variability aside from the random errors related to the Doppler laser sensor assembly until the minimum threshold for the sensor assembly (not the sensors) measurements are studied thoroughly.
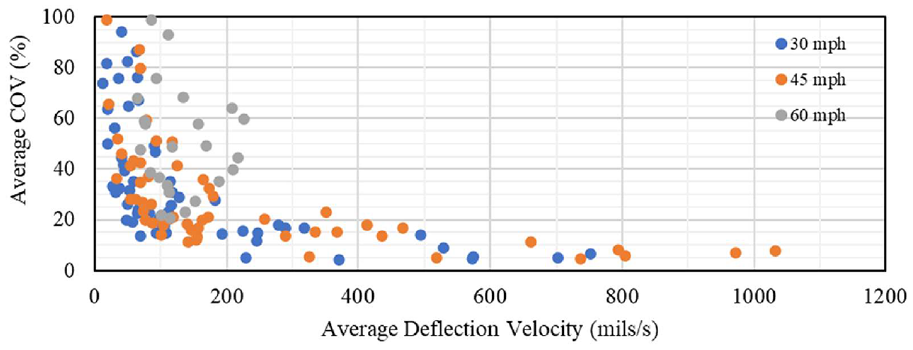
Variations of COV obtained from data averaged over 3.3 ft (1 m) with magnitude of deflection velocity.
The COV of less than 20% corresponded to deflection velocities greater than about 200 mils/s (5 mm/s). In other words, a COV of 20% allows deflection velocity measurements of greater than 200 mils/sec, which are typical values for flexible pavements on an unbound granular base.
To eliminate the effects of vehicle speed on the measurements, the deflection velocities were converted to deflection slopes by dividing the magnitudes of deflection velocity by the corresponding TSD vehicle speed. As shown in Figure 11, the variability increases as the deflection slope decreases. To maintain measurements within a 20% variability, the deflection slopes should be greater than 4 mils/ft (0.33 mm/m).
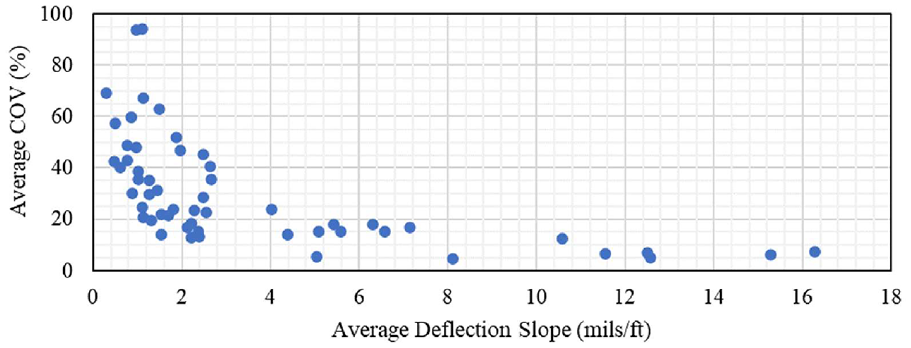
Variations of COV obtained from data averaged over 3.3 ft (1 m) with magnitude of deflection slope.
Conclusion
In this study, the performance of the deflection velocities collected by TSD Doppler laser sensors was evaluated by assessing the accuracy and variability of the TSD data collected at several pavement sections with different structural properties and at different operational speeds.
The accuracy of the TSD data was evaluated by comparing the TSD deflection velocities with the corresponding data obtained by validated geophones embedded in each pavement section. The best-aligned TSD pass was selected at each vehicle speed based on the high-speed video. At less stiff sections, the mean deflection velocities were within ±20% of the embedded geophones data for the majority of the TSD sensors. With an increase in the stiffness of the pavement sections, the differences between the TSD measurements and the geophone-recorded data increased. For very stiff pavements, the measurements corresponding to the majority of the TSD sensors deviated from the geophone data by more than ±20%. Also, the overall deviation of the TSD measurements from the geophone velocities was greater at higher speeds compared with the 30 mph (48 km/h) speed.
The precision of the TSD data was examined by analysis of the variability-related statistical parameters such as the COVs and standard deviations of each sensor’s data caused by repeated runs at different operational speeds. The variability of the deflection velocities in COVs was higher in stiffer sections. Stiffer sections correspond to rigid pavements or stiffer flexible pavements. An inverse relationship was observed between the magnitude and COVs of the collected deflection velocities. Variability in measurements seemed to increase with the vehicle speed as well.
Footnotes
Acknowledgements
The information provided here was gathered as part of the National Cooperative Highway Research Program (NCHRP) 10-105 project. The authors also acknowledge the outstanding support they received from the staff of MnROAD and the ARRB system during the collection of the field data. The technical collaboration and feedback received from Dr. Gerardo Flintsch and Samer Katicha are also appreciated.
Author Contributions
The authors confirm contribution to the paper as follows: study conception and design: S. Nazarian, G. Rada, C. Tirado, and M. Beizaei; data collection: S. Rocha, S. Nazarian, G. Rada; analysis and interpretation of results: M. Beizaei, C. Tirado, S. Rocha, S. Nazarian, G. Rada; draft manuscript preparation: M. Beizaei, C. Tirado, S. Nazarian. All authors reviewed the results and approved the final version of the manuscript.
Declaration of Conflicting Interests
The author(s) declared no potential conflicts of interest with respect to the research, authorship, and/or publication of this article.
Funding
The author(s) disclosed receipt of the following financial support for the research, authorship, and/or publication of this article: This research is part of the NCHRP project 10-105, which is part of the National Cooperative Highway Research Program (NCHRP). NCHRP is administered by the Transportation Research Board (TRB) and funded by participating member states of the American Association of State Highway and Transportation Officials (AASHTO). NCHRP also receives critical technical support from the Federal Highway Administration (FHWA), United States Department of Transportation.
The contents of this paper reflect the view of the authors who are responsible for the facts and the accuracy of the data presented here. The contents do not necessarily reflect the official views or policies of the NCHRP or the Federal Highway Administration. This paper does not constitute a standard, a specification, or a regulation.