
Abstract
This study intends to compare deflections obtained from traffic speed deflection devices (TSDDs) with the deflections of the falling weight deflectometer (FWD). For this purpose, deflections were measured on five sections of three roads in the Norwegian road network using traffic speed deflectometer (TSD) and rapid pavement tester (Raptor). Deflections were also measured using FWD at three different temperatures and the curves of FWD deflections versus temperature (FWD temperature-dependent deflection curves) were obtained. These curves were used to correct the effect of temperature difference. It was shown that both TSD and Raptor have the potential to detect structural deficiencies; however, TSD had better consistency with FWD with regard to deflection values and deflection basin parameters. A refinement was then made to make the Raptor data more consistent with FWD data. Calculating bearing capacity before and after refinement revealed that refining Raptor data can substantially increase the consistency between Raptor and FWD.
Keywords
The falling weight deflectometer (FWD) has been the standard equipment for structural evaluation of pavements for more than 40 years. As an impulse deflection device, it drops a stationary load from a certain height to the pavement, and measures deflections at different radial distances from the load center. By using the deflection basin obtained from the FWD as well as the pavement layer thicknesses, the elastic moduli of the layers can be calculated through a back-calculation process ( 1 ). There are some challenges with regard to the utilization of the FWD. Firstly, it provides discrete measurements commonly at 25 or 50 m intervals. As a result, weak spots between two consecutive drop sites might not be detected. Secondly, the lane must be closed to traffic when the FWD operates. This may induce problems related to traffic congestion and can also be dangerous for the operators. Thirdly, the dropping weight of the FWD does not seem to accurately simulate continuous traffic loads. And finally, the FWD is slow and not efficient for network-level applications ( 2 – 4 ).
Traffic speed deflection devices (TSDDs) are state-of-the-art equipment for the structural evaluation of pavements. TSDDs have several advantages over FWD. Providing continuous measurements, moving at traffic speed, not needing road closure, and applying the load in a manner to better resemble the service condition of roads are some advantages of using TSDDs over FWD. Two current types of TSDDs include traffic speed deflectometer (TSD) and rapid pavement tester (Raptor), as shown in Figure 1.
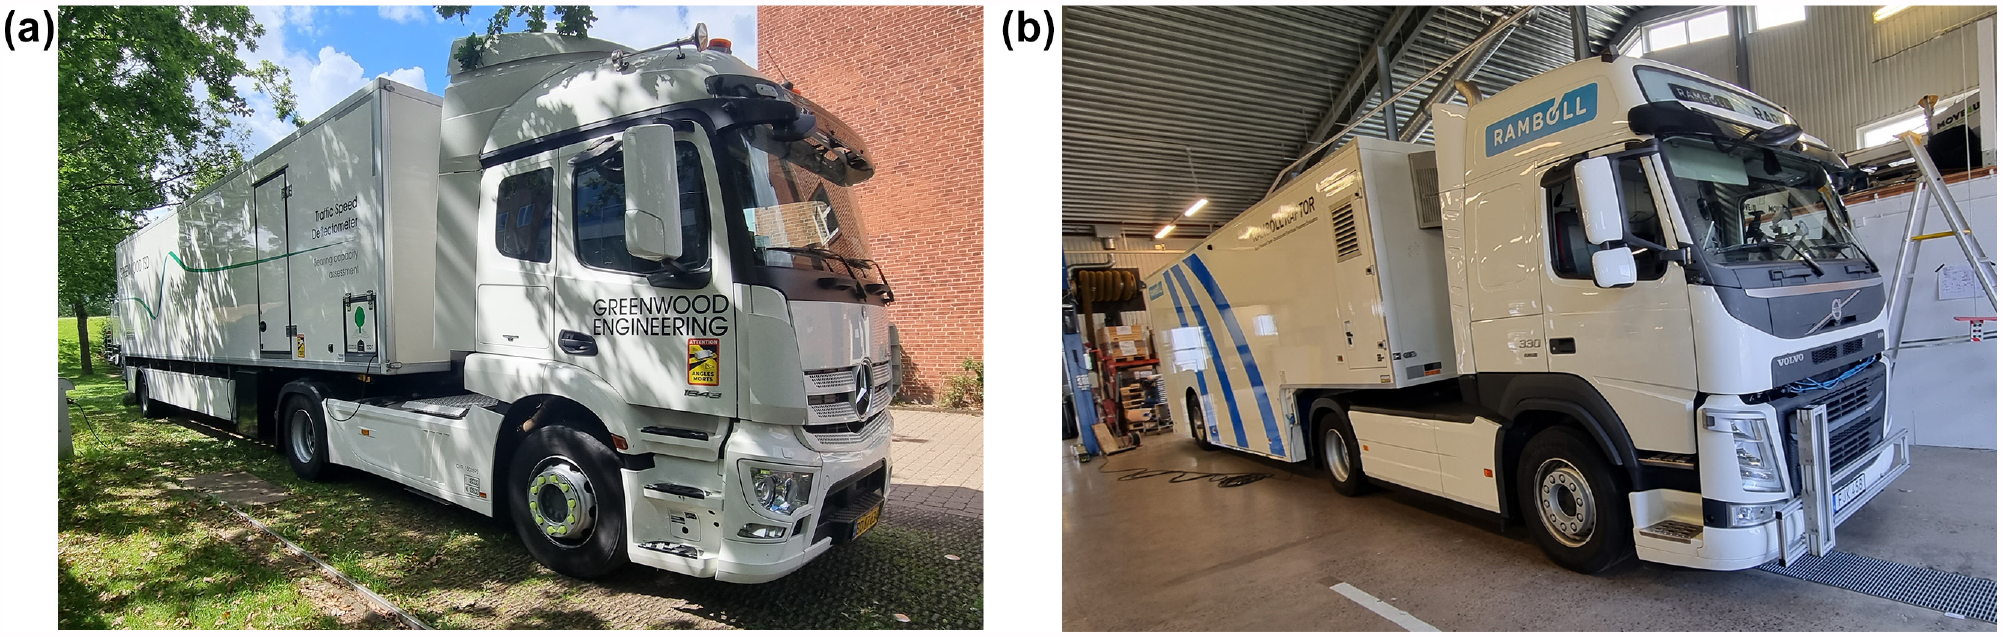
Two current types of traffic speed deflection devices: (a) traffic speed deflectometer and (b) rapid pavement tester.
Traffic Speed Deflectometer
The TSD is manufactured by Greenwood Engineering as of 2004. In the TSD trailer, dozens of Doppler laser sensors are mounted on a rigid beam, measuring the deflection velocity of the pavement. A 100 kN loading is applied through dual tires of a rear axle to the pavement surface. However, it should be noted that whatever the TSD actually measures is affected by all truck axles. By dividing deflection velocity by the instantaneous horizontal speed of the vehicle, deflection slopes are obtained ( 5 ). Deflection values at any arbitrary point can then be calculated by employing computational methods such as the area under the curve (AUTC) method and the Euler–Bernoulli (EB) method ( 6 ). TSD is the most widely used TSDD, and many studies related to its applicability are found in the literature. To date, TSD has been on missions in many countries including Denmark, Great Britain, Australia, Italy, Poland, South Africa, USA, China, Norway, and Germany ( 7 ). From Greenwood’s perspective, the main advantages of using the TSD include:
The potential of measuring at both project and network levels.
Providing high-resolution continuous data and detailed information about discontinuities.
The possibility of measuring at various load levels, as the ballast load is replaceable.
The possibility of using two measuring beams to inspect at both wheel paths.
The possibility of integrating sub-systems like surface imaging systems with artificial intelligence (AI) automated crack detection, ground-penetrating radar (GPR), right-of-way imaging cameras, and road profiler to the TSD.
The potential of finding the strength of concrete joints and detecting cracked plates.
A long service life for the vehicle.
Rapid Pavement Tester
The Raptor was designed by Dynatest in 2018. In 2020, Ramböll acquired the Raptor project from Dynatest ( 8 ). The measuring beam of Raptor is placed in a semi-trailer and equipped with twelve line laser sensors for measuring distances. This beam, made of fiber, is adjacent to the rear axle single wheel, and for countries in which right-side driving is practiced, it is placed on the right-hand side of the vehicle. The sensors measure more than 1,280 points along a 200 mm line transversal to the moving direction of the vehicle ( 9 ). An image recognition technique is then used to locate the position of the laser sensors. As a result, Raptor deflection indices (RDIs) are determined. These indices can be ultimately converted to deflection values through a back-calculation procedure. Raptor is gaining worldwide acceptance, and it has been used in several countries including Norway, Switzerland, Italy, Lithuania, Finland, Sweden, Denmark, the Netherlands, USA, Austria, Belgium, and France so far. According to Ramböll, there are several advantages in using Raptor including:
A fast onboard calibration system, to determine the position and alignment of the lasers with respect to each other.
Fast and simple loading and unloading of ballast.
Scanning the entire deflection bowl, not only discrete points.
The measuring beam material is carbon fiber, providing superb stiffness and temperature stability.
Has the potential to inspect between 150 and 400 lane-kilometers of road network per day.
Is equipped with twelve laser sensors, which is more than enough for covering the deflection bowl, and even if one of the sensors fails, the vehicle is still operational.
Literature Review
Despite the advantages of using TSDDs, the FWD can provide accurate deflection measurements and has been in service for many years ( 10 , 11 ). To date, no standard protocol has been provided for incorporating deflection data from TSDDs into pavement management systems. One reasonable doubt might be about the consistency between TSDDs and FWD. Although TSDDs are different from FWD in loading characteristics and measuring principles, any emerging technology for structural evaluation must be able to detect pavement sections with different resilient responses. Therefore, it would be beneficial to investigate levels of agreement between these devices in determining pavement structural characteristics.
Elseifi and Zihan compared TSD and FWD for a road in Louisiana State, USA. They observed that deflection values are statistically different, and that surface roughness might be an influential factor in TSD measurements. They developed an Artificial Neural Network model to predict corresponding FWD deflections from TSD deflections (
10
). Morovatdar et al. compared TSD and FWD measurements on a state highway in Wisconsin, and concluded that deflection basin indices obtained from TSD and FWD are in good agreement; however, FWD deflections are generally 12 to 37% higher than TSD deflections for the same positions of the road (
12
). Nielsen and Jensen used TSD for the structural evaluation of two runways at Copenhagen Airport. They compared the measurements of TSD with those of a heavy weight deflectometer (HWD). They also obtained the surface curvature index (
Importance of the Study
There are fundamental differences between TSDDs and FWD in loading mechanisms, load-transferring materials and measuring principles. However, a comparative study can still be beneficial for the following reasons:
1- Any emerging technology for structural evaluation of pavements must be able to differentiate between pavement sections with different resilient responses. For using data obtained from pavement structural evaluation in the pavement management system, different sections should be prioritized based on a structural index (such as structural number). The FWD has been used for more than 40 years for this purpose and has shown promising results. Therefore, the data produced by a new device must in some degree be consistent with the FWD data. As was mentioned, Raptor is a new technology manufactured in 2018, and few studies about its applicability are found in the literature. Without conducting a comparative study, it is impossible to comment on the practicality of the new technologies. Yet, regardless of fundamental differences, consistent and comparable values from a TSDD hold promise for practical use, potentially replacing FWD as the standard equipment of pavement evaluation for many years. This is the reason why the initial studies on Raptor at the NCAT testing facility in Auburn ( 8 ) were focused on comparing its measurements with FWD deflections.
2- The bearing capacity is a structural index that is traditionally used in Norway to prioritize different pavement sections based on their structural stiffness. In 2020, the Norwegian Public Roads Administration (NPRA) considered the possibility of using Raptor for deflection measurements at the network level. However, thousands of kilometers of roads had previously been measured with FWD. It was of great interest to NPRA to check if the bearing capacity values produced using Raptor deflections are comparable with FWD deflections, or if any revisions should be made to Raptor data. Also, it was uncertain if the temperature correction factor that was in use for correcting FWD deflections was also applicable to Raptor deflections. Moreover, NPRA aimed to assess whether TSD or Raptor provides better consistency with FWD, adding TSD to deepen the understanding and facilitate advanced research in pavement evaluation methodologies.
3- There are generally two methods for pavement layers' moduli from TSDD data: First, using comparison measurements under various different conditions and finding a correlation between TSDDs and FWD, and then using traditional back-calculation computer programs (that were initially developed based on FWD deflections) to obtain elastic moduli of pavement layers; second, developing new procedures for analyzing TSDD data, for example, a viscoelastic back-calculation procedure. However, a significant amount of time and effort is required for this purpose, and it might not be as practical as the first method. The correlations between TSDDs and FWD are not generic, and depend on various factors such as pavement structure, temperature, and vehicle speed. However, difficulties in developing methodologies specific to analyzing TSDD data underlie the importance of finding a consistency between deflections obtained from TSDDs and FWD.
Research Objectives
TSDDs are sophisticated and expensive tools compared with the FWD, requiring careful evaluation of their cost-effectiveness for pavement management systems. Selecting a reliable TSDD technology is of interest to road administrations and practitioners. As a means to study their application for Norway’s conditions, the NPRA conducted field tests using TSD and Raptor measurements, along with FWD measurements at different temperatures. The curves of FWD deflections versus temperature (that are called FWD temperature-dependent deflection curves in this study) were obtained for temperature correction, and GPR was used for layer thickness data. Graphical, statistical, and structural comparisons were performed between FWD and TSDDs. A proposed refinement aimed to enhance the consistency of Raptor data with FWD in determining bearing capacity. The significance of the study lies in addressing the need for reliable and cost-effective alternatives to FWD for pavement structural evaluation. By investigating the repeatability of TSDDs and evaluating their consistency with FWD, this study aims to contribute valuable insights into the applicability and potential integration of TSDDs into pavement management systems. Considering the aforementioned reasons, it would be beneficial to check levels of consistency between TSDDs and FWD.
The main objectives of this study can be summarized below:
Investigating the repeatability of TSDD measurements.
Comparing deflections obtained from TSDDs and FWD.
Obtaining a temperature correction factor in determining bearing capacity based on FWD data.
Proposing a refinement to Raptor data to make the bearing capacity obtained from Raptor and FWD comparable.
Experimental Design
Measurements were performed at five sections of three roads in the Norwegian road network using TSD, Raptor, FWD, and GPR. The roads were in a dry condition during the measurements. The FWD measurements were conducted on June 29, July 4, and July 5, 2022. The model of the FWD equipment was Dynatest 8012-044, and it measured at 25 or 50 m intervals (see Table 1). The air and surface temperatures were also recorded point by point at the same intervals during the FWD measurements. The FWD sensors were placed at nine radial distances, namely 0, 20, 30, 45, 60, 90, 120, 150 and 180 cm from the center of the load. The applied load was 50 kN and the plate diameter was 300 mm. Table 1 summarizes the name of the selected roads, locations, measured lanes, average surface temperature (
Summary of Falling Weight Deflectometer measurements
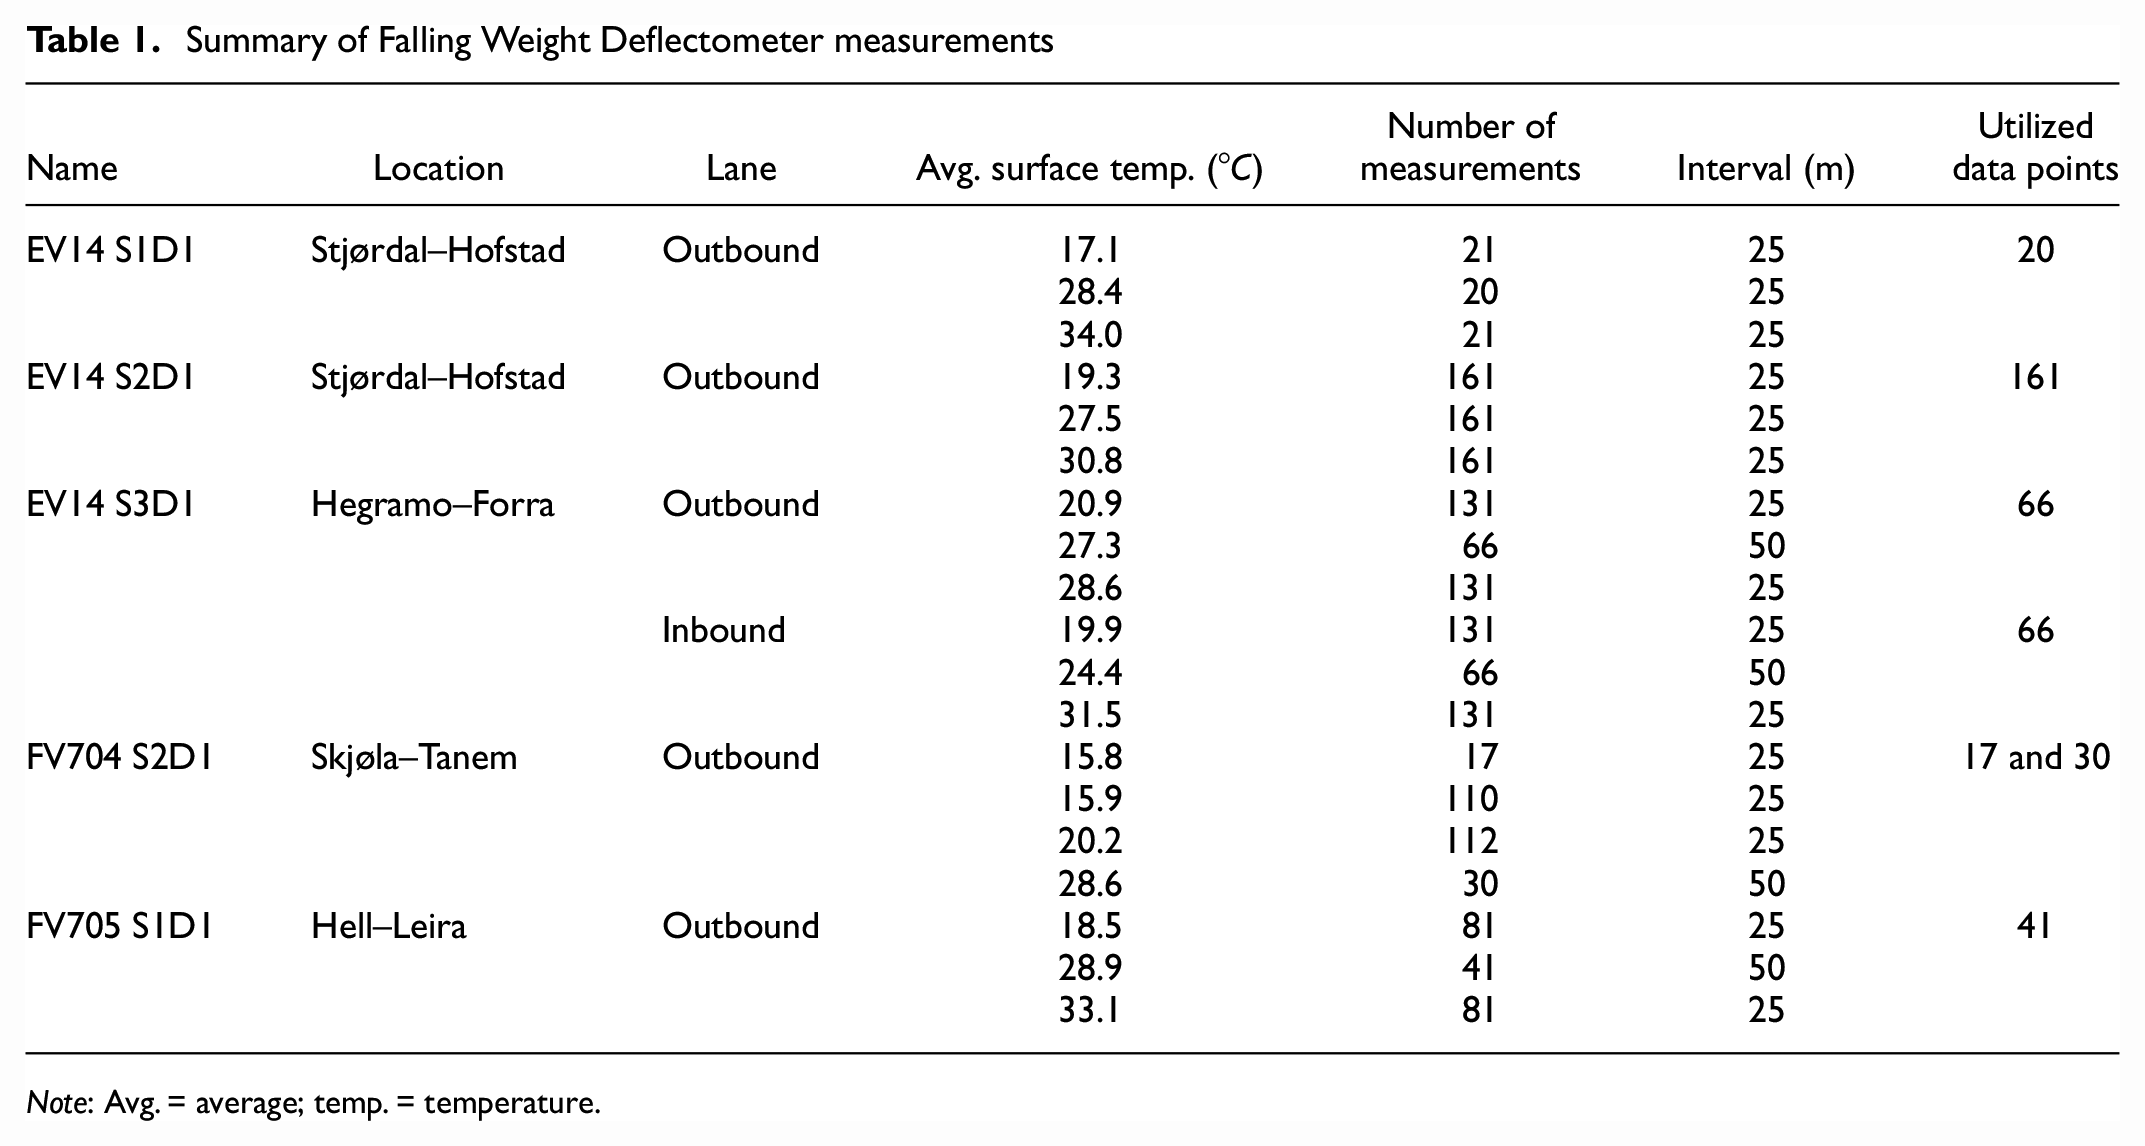
Note: Avg. = average; temp. = temperature.
Raptor measurements were conducted in two directions on the same roads (see Table 2) on June 29, 2022. The equipment was Ramböll’s Raptor (serial No. 9100-002), and the normalized averaging length was set to 10 m. The air and surface temperatures were recorded continuously, and normalized at the same 10 m intervals. The average surface temperature was between 21.6 and 22.5
Summary of measurements conducted by Falling Weight Deflectometer (FWD), Rapid Pavement Tester (Raptor), Traffic Speed Deflectometer (TSD) and Ground-penetrating Radar (GPR)
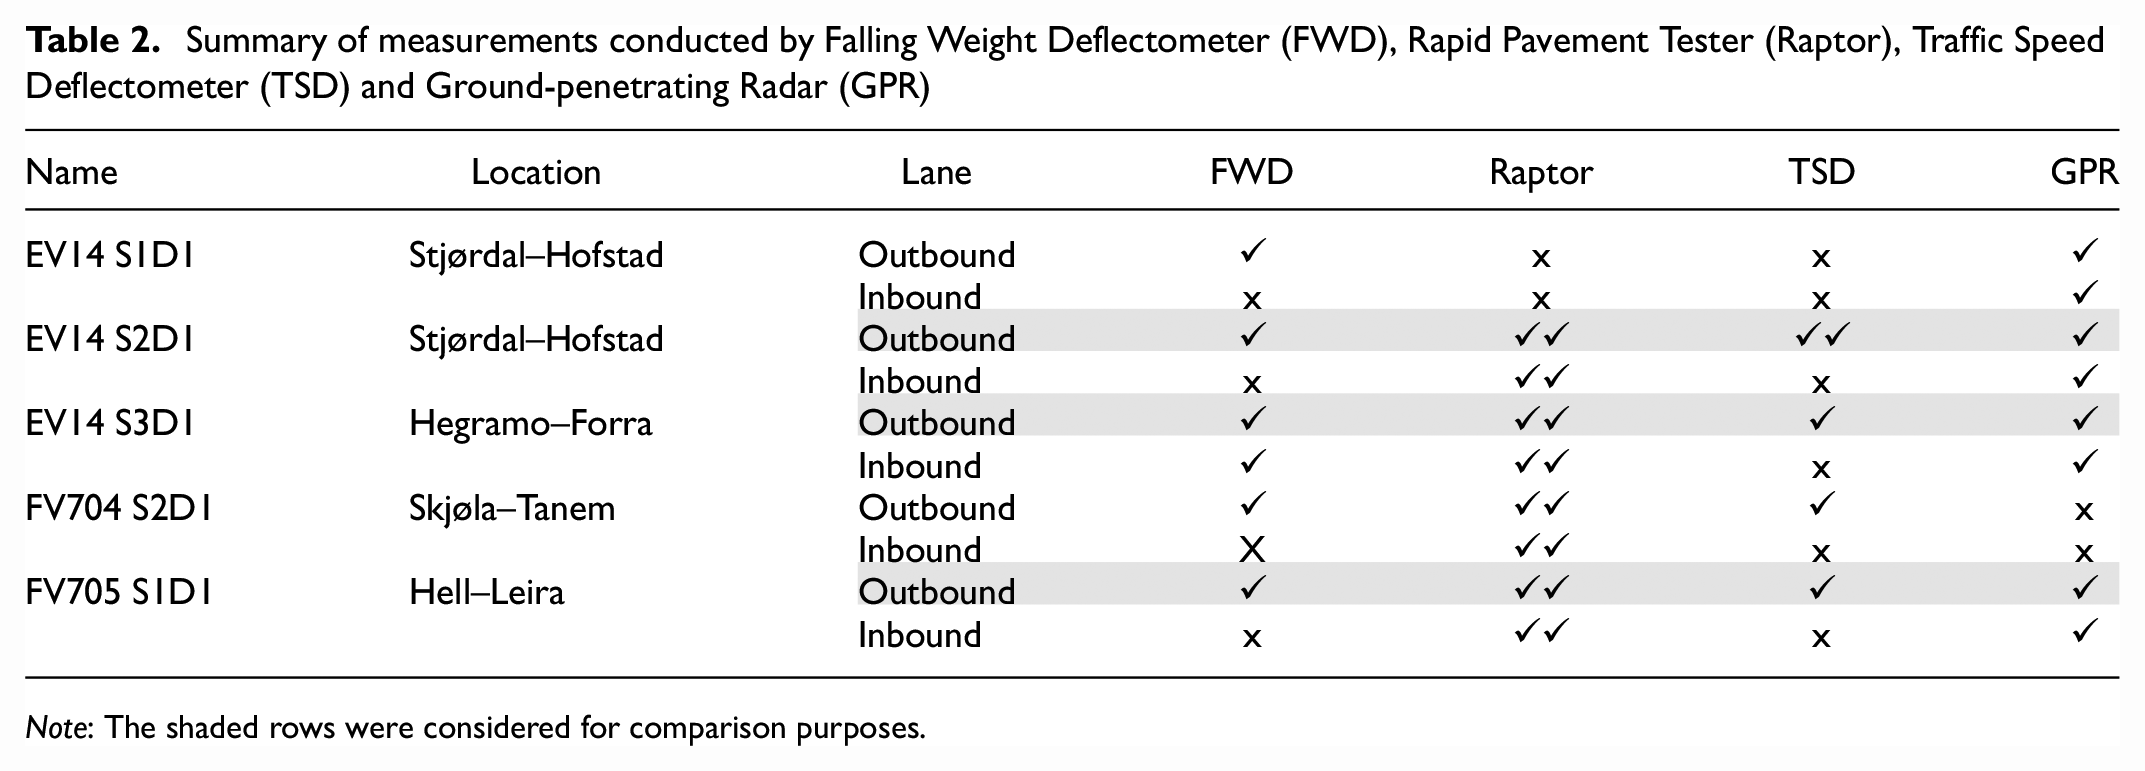
Note: The shaded rows were considered for comparison purposes.
With reference to Table 2, data obtained from three sections have all four measurements (i.e., FWD, Raptor, TSD, and GPR), and they were chosen for comparison purposes. Data points for EV14 S1D1 were used as part of the data for developing a temperature correction factor based on FWD data, which will be discussed later. Also, data points of the inbound lane of EV14 S2D1, the inbound and outbound lanes of FV704 S2D1, and the inbound lane of FV705 S1D1, which were absent in the comparative study, were usable for evaluating the repeatability of Raptor data. A map showing the location of the three sections for the comparative study is shown in Figure 2. These include:
Dataset 1: EV14 S2D1, between Stjørdal and Hofstad, outbound lane, 4 km total length, 25 m intervals for FWD data, 161 data points for comparison.
Dataset 2: FV705 S1D1, between Hell and Leira, outbound lane, 2 km total length, 50 m intervals for FWD data, 41 data points for comparison.
Dataset 3: EV14 S3D1, between Hegramo and Forra, outbound lane, 3.2 km total length, 50 m intervals for FWD data, 66 data points for comparison.
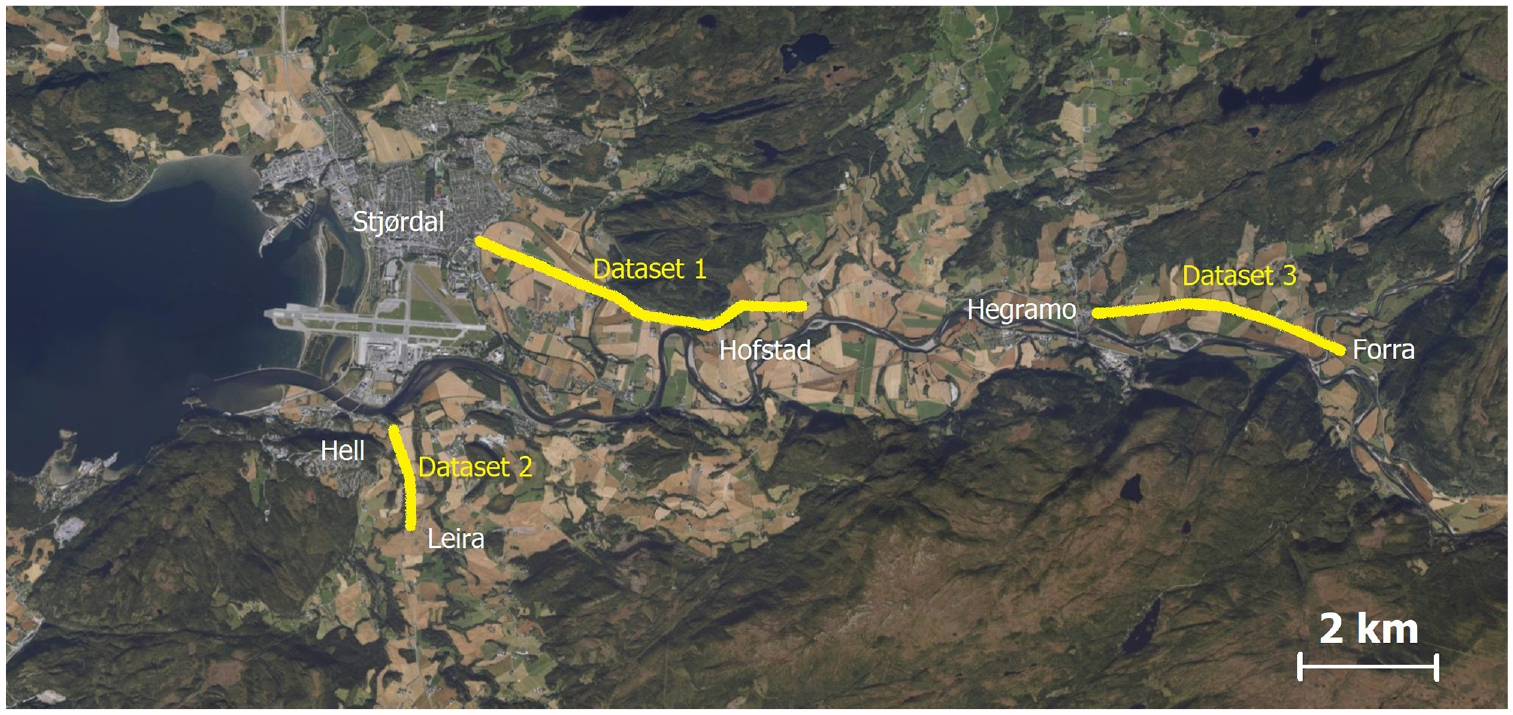
Location of road sections considered in this study for comparing traffic speed deflection devices with falling weight deflectometer.
Method
Temperature Correction
To accurately compare deflections of TSDDs with FWD, the effect of temperature should be considered first. Different methods for correcting this effect have been employed by researchers (
9
, 22–24). Correcting
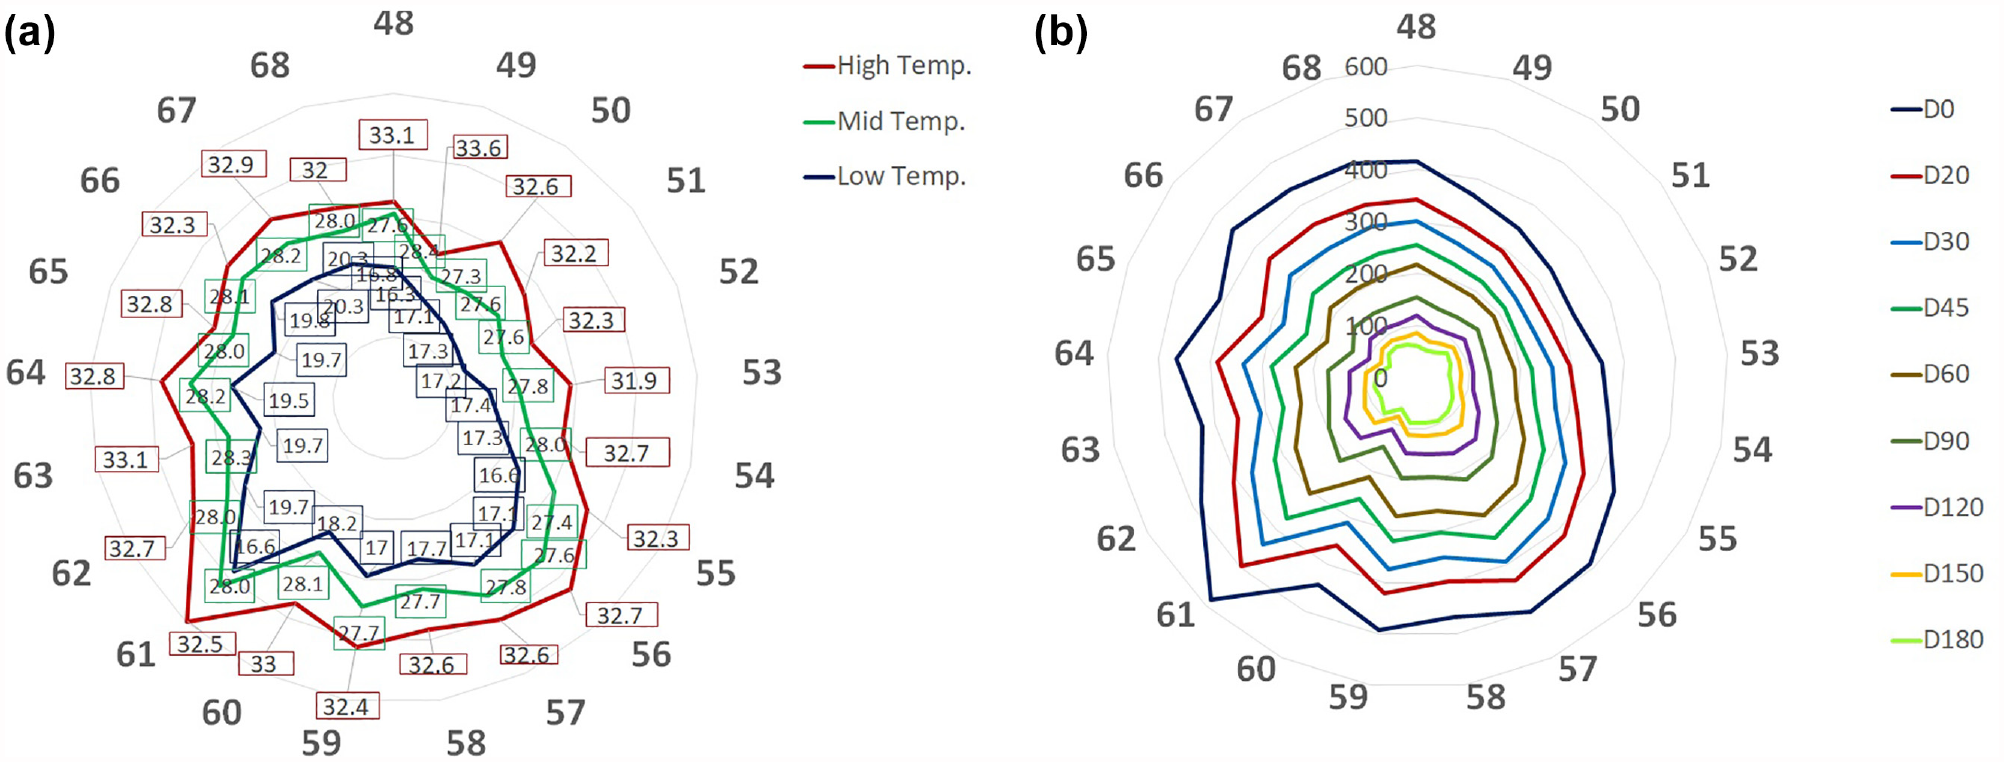
Falling weight deflectometer deflections (micrometer) for point numbers 48–68 at EV14 S1D1: (a)
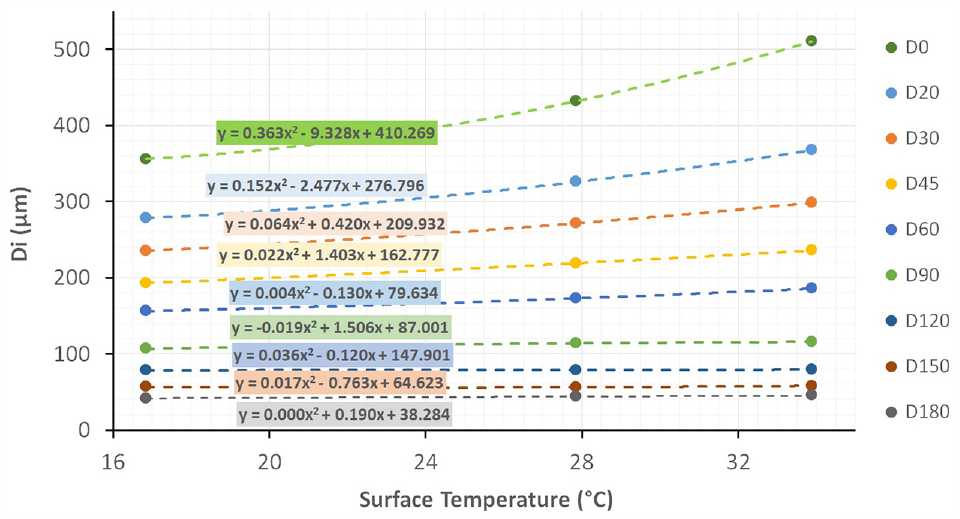
Figure 4 represents the schematic of the nine FWD temperature-dependent deflection curves (corresponding to nine radial distances) for each data point. As a result, deflections at any arbitrary temperature can be obtained using interpolation or extrapolation. As the surface temperature is recorded during TSDD measurements, the surface temperature of a corresponding data point from TSDDs can be replaced in the FWD temperature-dependent deflection curves of the same point. As a result, the equivalent FWD measurements at that point can be calculated. These equivalent deflections can now be compared with the measured TSDD deflections. It is worth mentioning that in this process, TSD data cannot be compared directly with Raptor data; however, both can be compared with their equivalent FWD data at the same temperature as for the TSDDs.
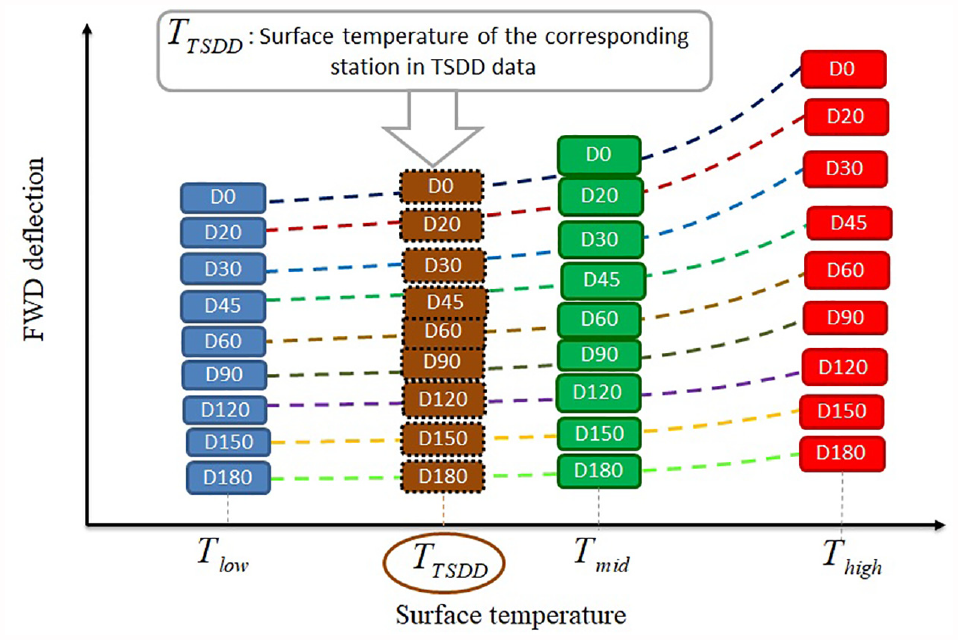
Schematic falling weight deflectometer (FWD) temperature-dependent deflection curves for each data point, and finding equivalent FWD deflections for traffic speed deflection devices (TSDDs).
To obtain the FWD temperature-dependent deflection curves, polynomial second-degree models were used (Equation 1). For each data point, values of regression coefficients X
i
,
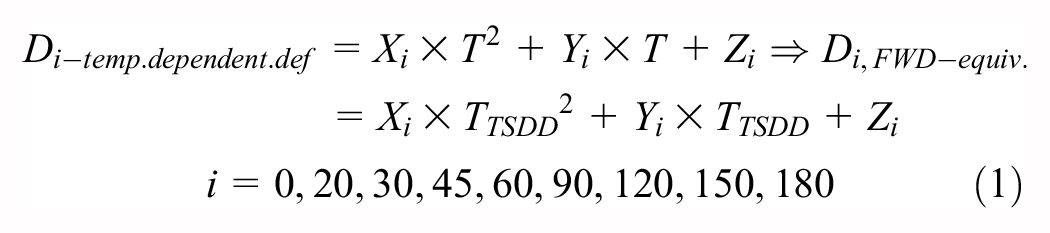
where T is the surface temperature (
Deflection Basin Indices and Structural Parameters
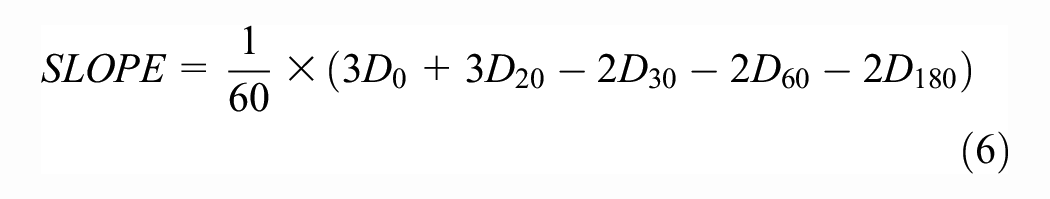
As there might be a correlation between the structural capacity of a pavement section and deflection basin indices calculated from the measured deflections at that section, it would be beneficial to consider them for comparing FWD and TSDDs. Rada et al. list 77 indices related to the deflection bowl ( 25 ). In this study, a set of five indices was considered for comparison. The formulas for determining these indices are provided in Equations 2 to 6:


The
Also, two structural parameters, namely bearing capacity (BC) and structural factor (SF) were additionally defined.
Bearing Capacity
In the Norwegian pavement design standard, BC is used as a traditional indicator of how heavy vehicles affect a road. More precisely, BC is a structural index representing the largest axle load a road can carry over a period of time, without inducing excessive damage or necessitating major maintenance measures ( 26 ). BC is obtained according to Equation 7:

where BC is the bearing capacity (tons),

where
Structural Factor
A new parameter called the structural factor (
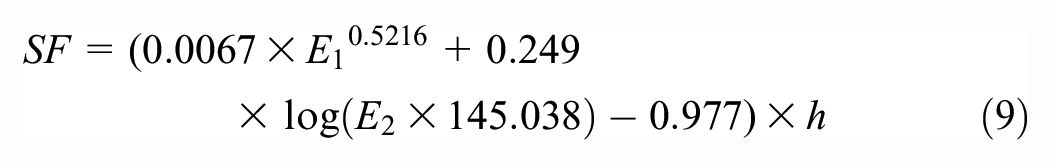
where SF is the structural factor (dimensionless),
Results and Discussion
Considering a total number of 268 FWD data points (in Datasets 1, 2, and 3) and nine radial distances, 2,412 FWD temperature-dependent deflection curves were developed. A programming code in Python 3.9 was used to facilitate the process of finding model coefficients. Deflection measurements and corresponding surface temperatures were entered as input files in .txt format, and the coefficients of the models (Equation 1) were obtained.
Ramböll uses a post-processing software system to obtain deflections from RDIs ( 8 , 9 ), and can report deflections at any arbitrary distance. This software system was developed on the basis of studies conducted by Madsen and Pedersen ( 20 , 21 ). In this study, Ramböll was asked to provide deflection values at the same nine radial distances as for the FWD. To obtain deflections from TSD data, four methods are found in the literature including the EB beam method ( 29 ), AUTC method ( 30 ), the Weibull fit method ( 31 ), and Greenwood’s method. Among these, only the latter is capable of detecting the lag distance between the point below the loading axle and the point sustaining the maximum deflection. Greenwood’s method was originally developed by Pedersen ( 32 ). This method uses a parametrized synthetic model, and the model coefficients are obtained using optimization techniques. More precisely, simulated deflection slope curves are initially developed using a finite element method and Laplace transform. The obtained simulated data are then validated using the ViscoRoute software. Finally, the Gaussian and Stable distribution functions are utilized to fit the deflection slopes ( 33 ). It is worth noting that a fifth method has been recently introduced, which is based on fitting critical damping curves to the deflection slopes of the TSD ( 34 ). In the current study, Greenwood Engineering was asked to provide deflections at the same radial distances as the FWD sensors.
Deflections of TSDDs were normalized at 10 m, and the intervals for FWD deflections were 25 or 50 m. So, FWD data points were considered as reference points. Then, the geographical coordinates of points for the TSDDs were checked one by one and compared with the coordinates of the FWD data points, to select the corresponding points as close as possible to each other. In the second repetition of TSD for Dataset 1, problems in measuring surface temperatures were reported. For this reason, only one repetition of TSD and two repetitions of Raptor were compared with their equivalent FWD deflections.
FWD Temperature-dependent Deflection Curves
Figure 5 shows the FWD temperature-dependent deflection curves for a sample point in Dataset 1. As shown, the effect of temperature on the deflections is more pronounced for the inner radial distances, and temperature correction does not have a significant effect on the deflections of the outer radial distances (say
Falling weight deflectometer temperature-dependent deflection curves for a sample data point in Dataset 1 considering second-degree polynomial regressions.
Repeatability of TSDDs
The repeatability of TSDDs was evaluated for Dataset 1. In this evaluation, the effect of temperature and/or speed was not normalized. As mentioned, the surface temperature was not recorded correctly for the second repetition of TSD. However, as these two TSD runs were conducted immediately after each other, they were compared with each other for deflections at different radial distances. Figure 6 shows two repetitions on the same chart for four radial distances of Raptor and TSD.
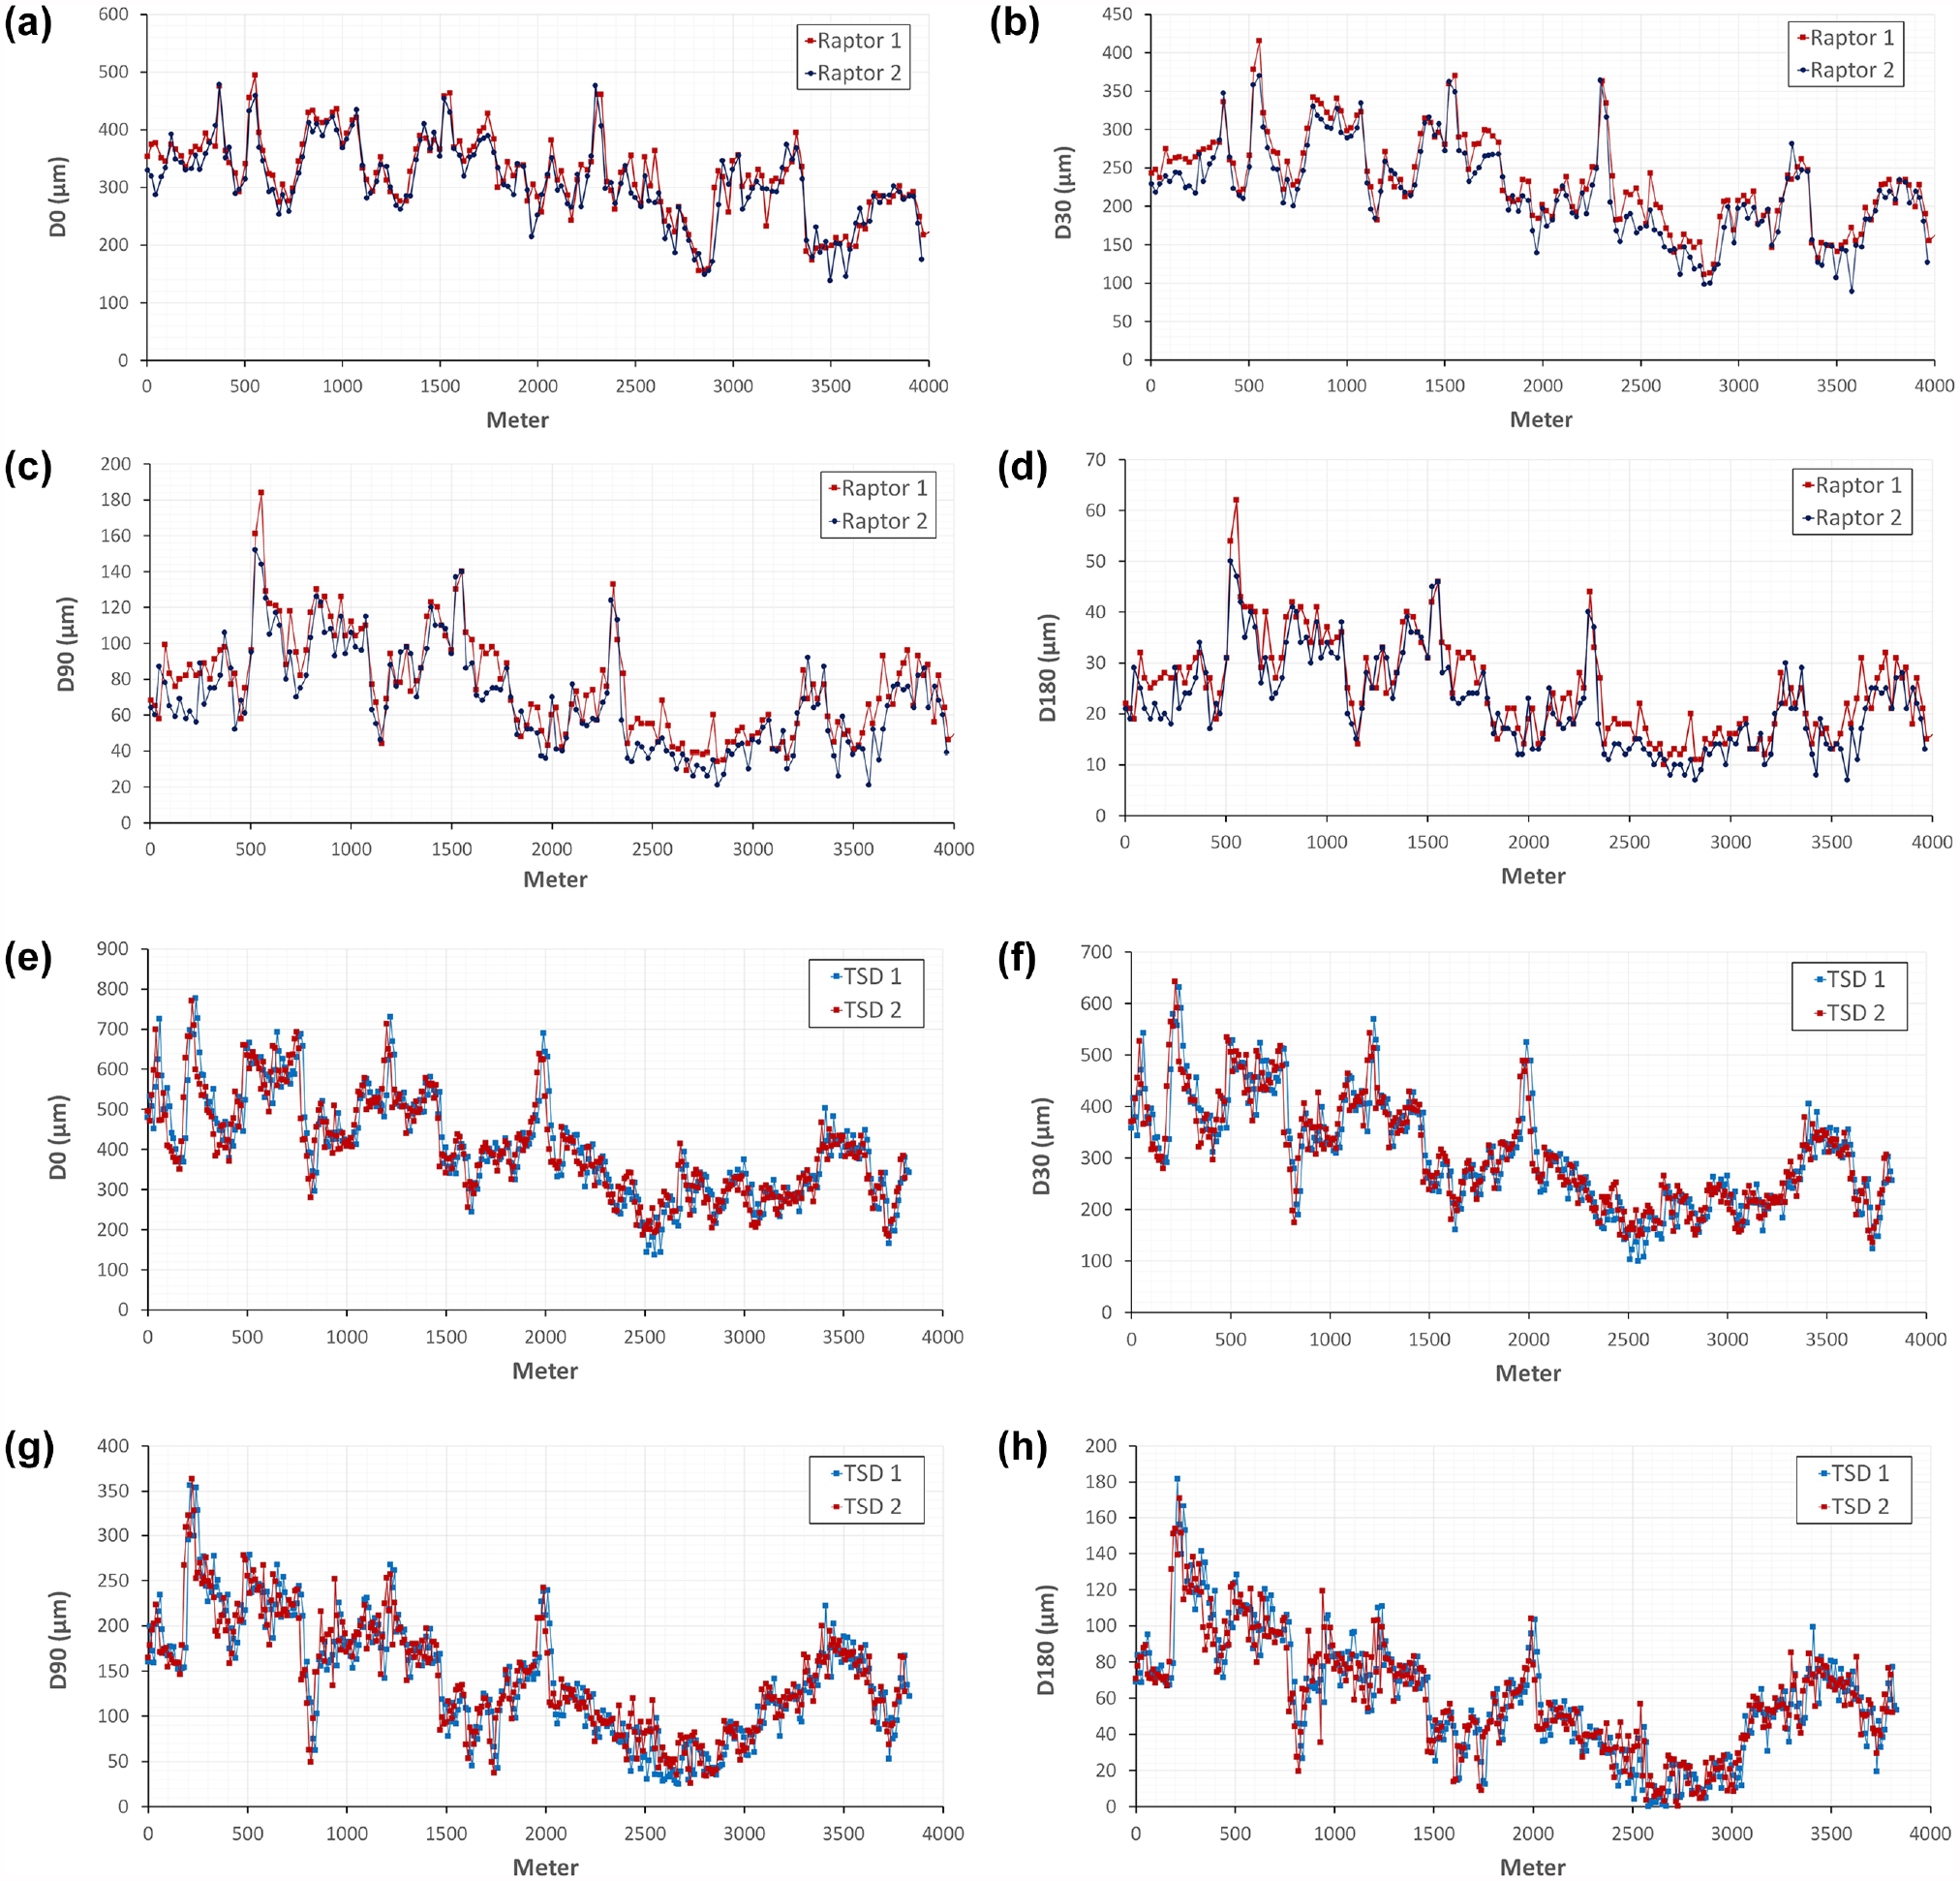
Repeatability of traffic speed deflection devices in relation to similarity in measuring deflections for two short-term repetitions: (a)
The graphical comparison shows that both TSD and Raptor show repeatable results, and Raptor deflections are closer to each other at inner radial distances than the outer ones. For a statistical evaluation, Pearson’s correlation coefficient was calculated according to Equation 10:
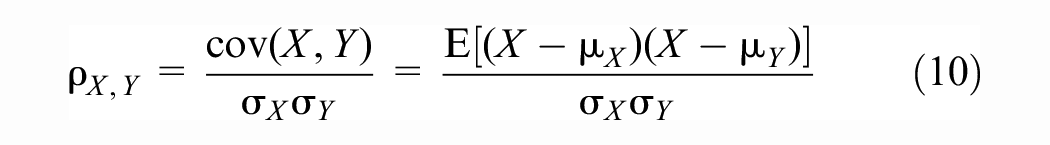
where
Comparing Deflection Values
Deflection basins were compared for some random data points. As shown in Figure 7, Raptor 1 and Raptor 2 are the two repetitions of Raptor, TSD shows the TSD deflections, FWD-R1 and FWD-R2 denote the equivalent FWD deflections at the temperatures of the first and second rounds of Raptor, respectively, and FWD-T denotes the equivalent FWD deflections at the temperature of the TSD measurements. With regard to deflection values, it is evident that TSD generally shows more consistency with FWD compared with Raptor. Also, the consistency between FWD and TSDDs is more pronounced at the inner radial distances. The average relative error in predicting the equivalent FWD deflections for different radial distances is also determined for TSD and the two repetitions of Raptor. The results are shown in Figure 8 for each dataset separately. As shown, the relative error in determining equivalent FWD deflections is lower for TSD measurements, especially for the inner radial distances.
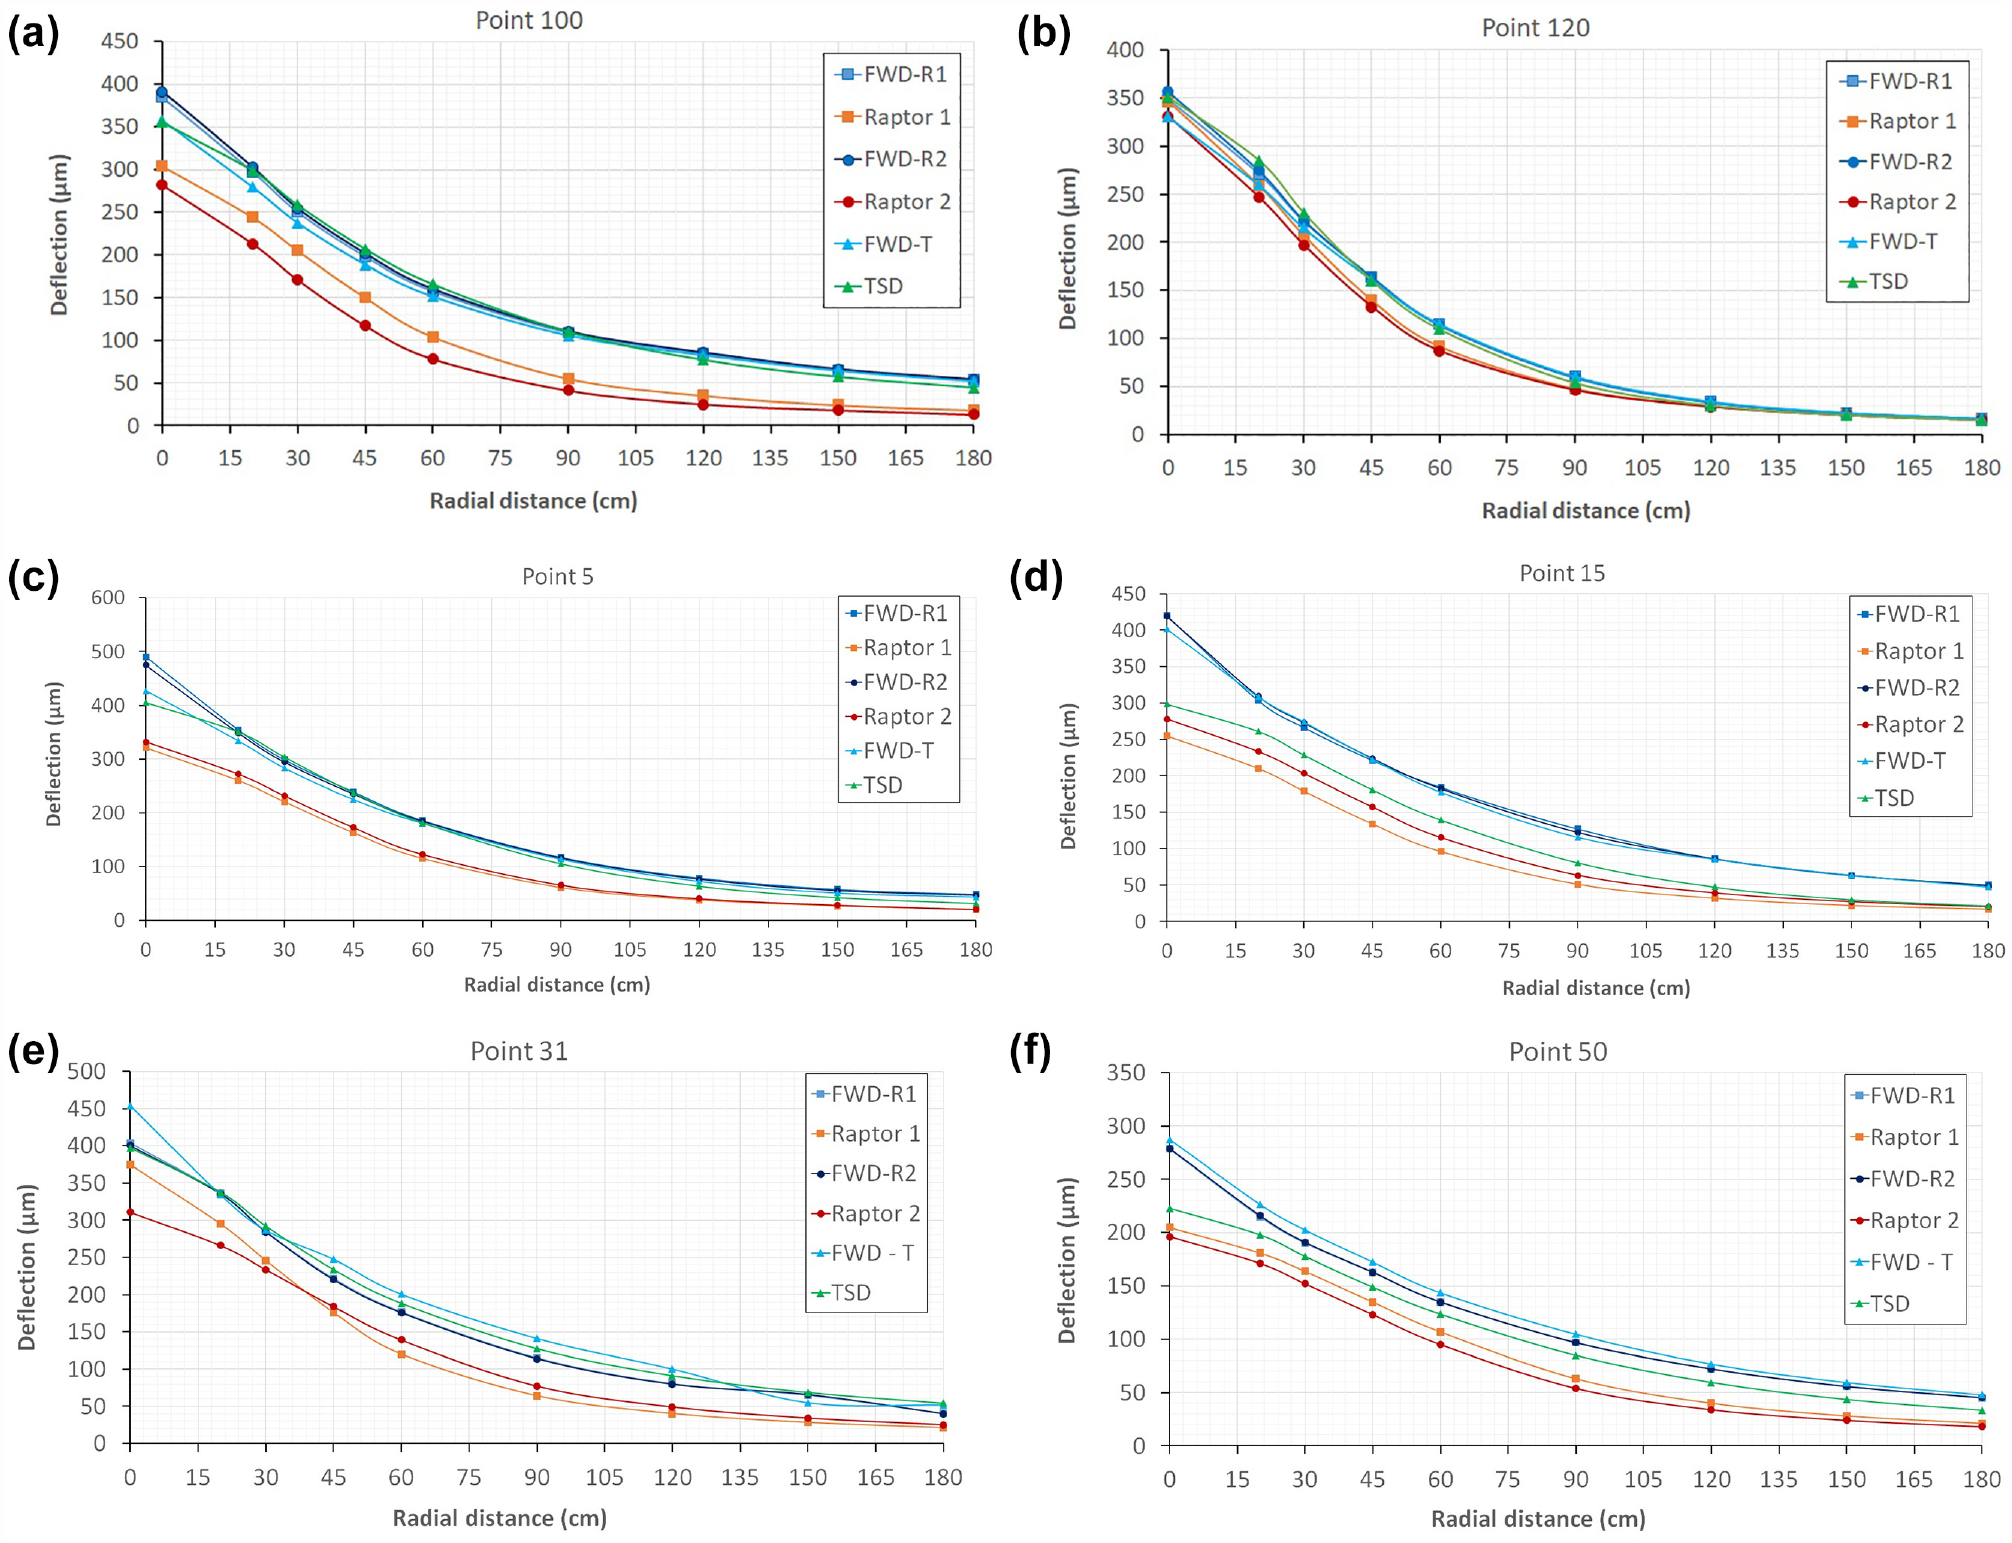
Deflection basin comparisons for sample points for: (a) Point 100 (Dataset 1), (b) Point 120 (Dataset 1), (c) Point 5 (Dataset 2), (d) Point 15 (Dataset 2), (e) Point 31 (Dataset 3) and (f) Point 50 (Dataset 3).
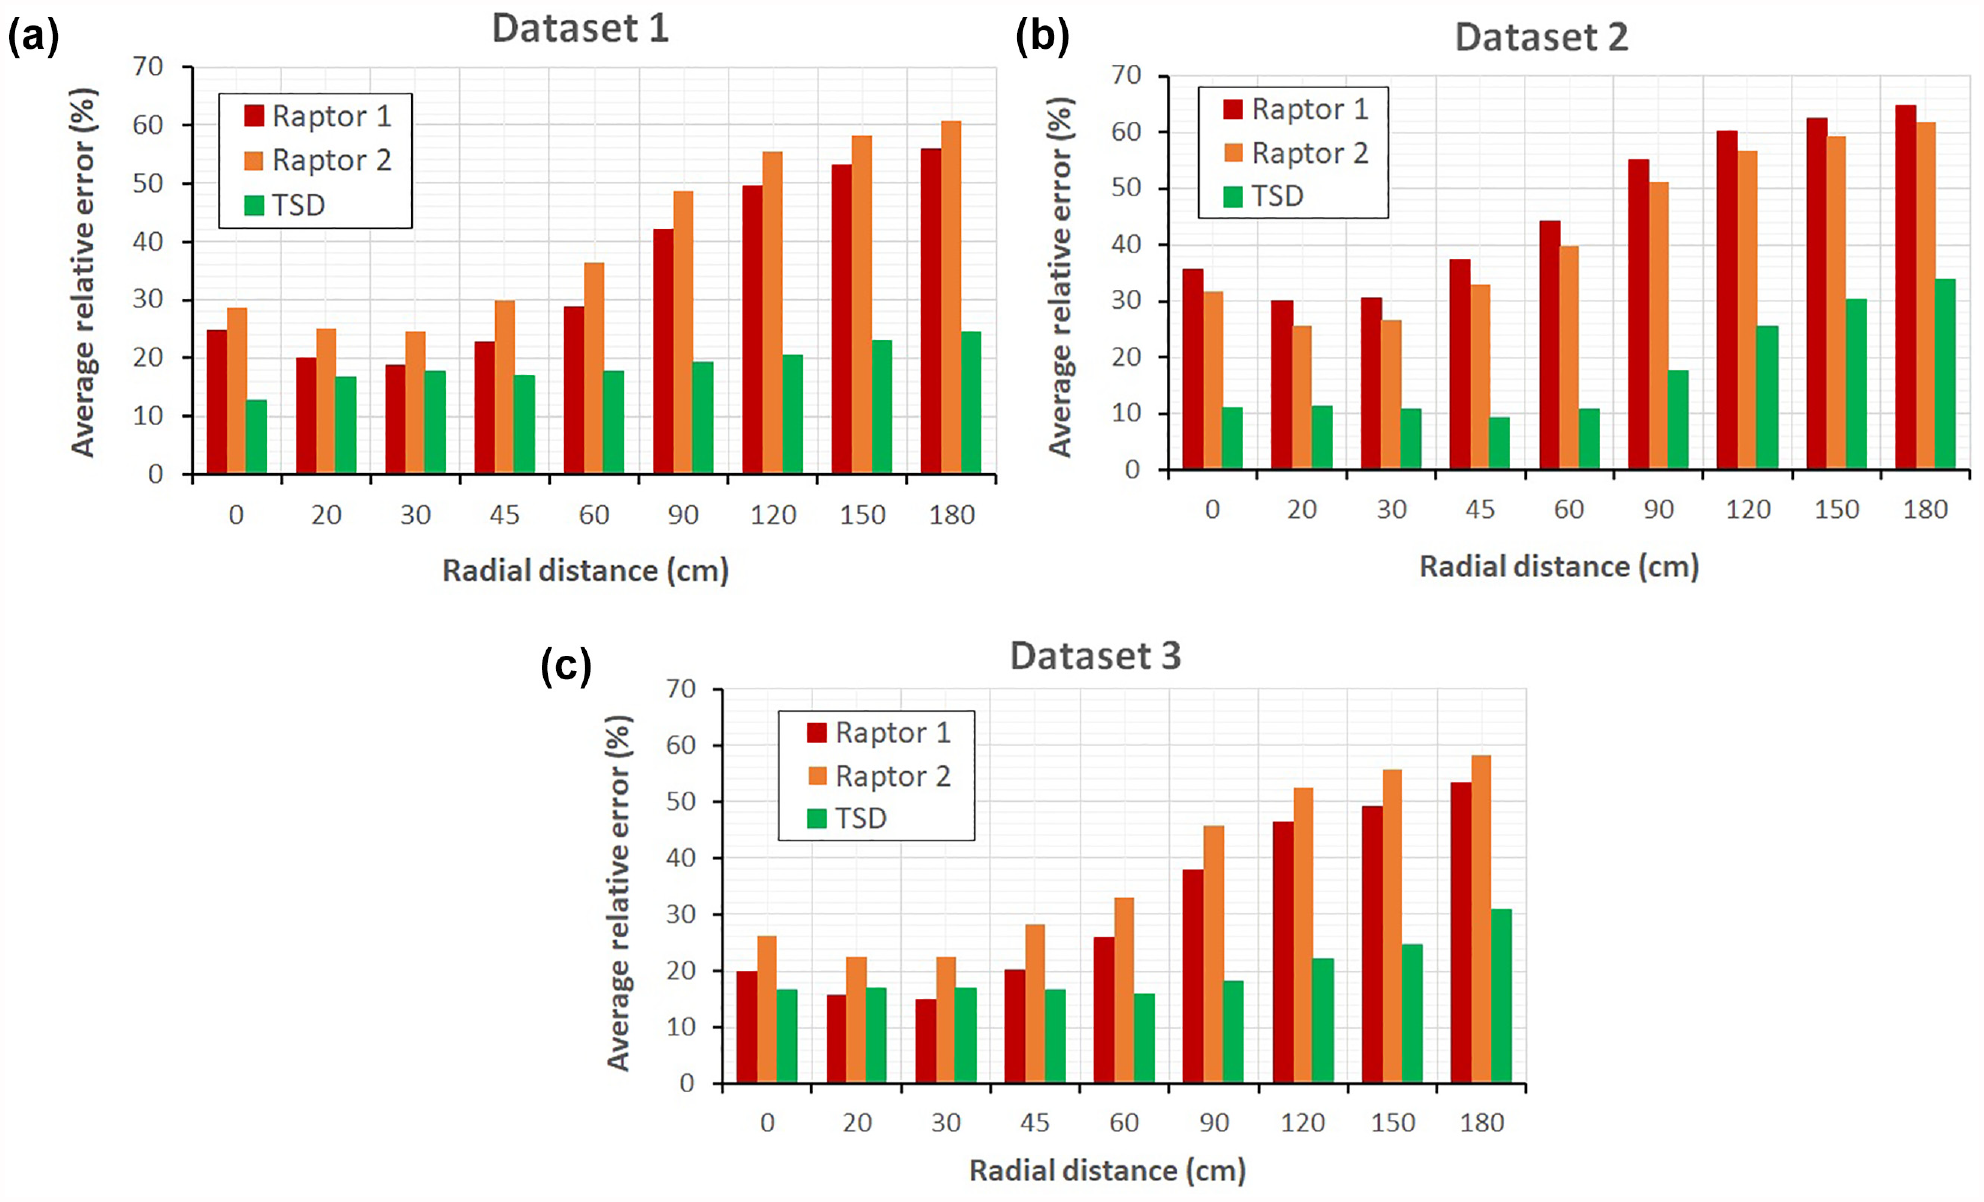
Average relative error of deflection values for traffic speed deflection devices and their equivalent falling weight deflectometer deflections for: (a) Dataset 1, (b) Dataset 2, and (c) Dataset 3.
Mixing data from three data sets in a single chart (Figure 9) and using statistical comparison approves again the higher levels of consistency between TSD and the equivalent FWD than for Raptor. At inner radial distances, this consistency is even higher. Also, TSD data points are seemingly more dispersed than Raptor data points. It is also shown that the two repetitions of Raptor produce comparable results, and at outer radial distances, the difference between Raptor and equivalent FWD deflections is more considerable.
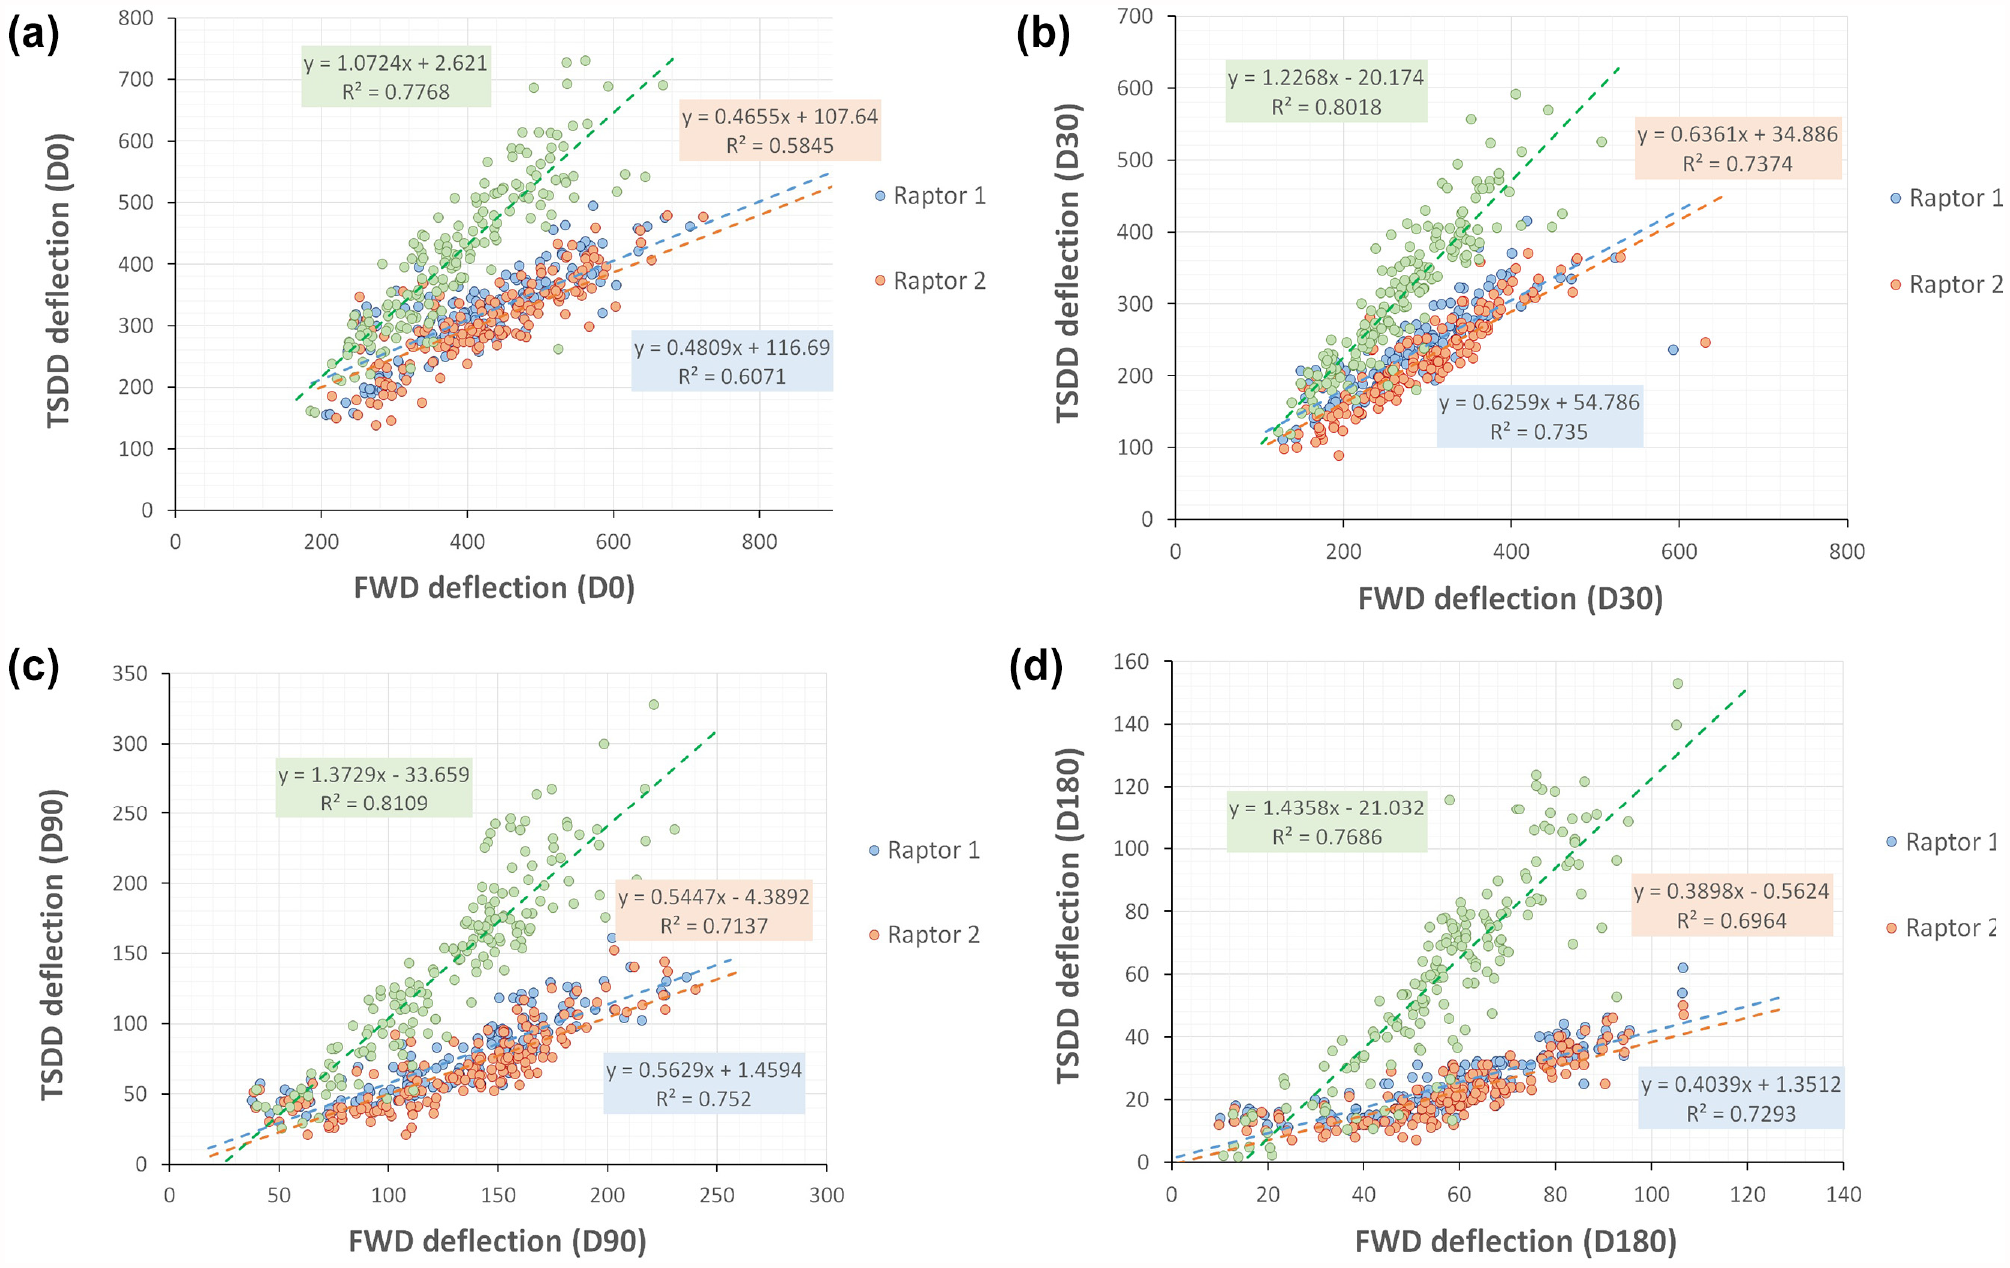
Comparing deflection values for traffic speed deflection devices (TSDDs) and their equivalent falling weight deflectometer (FWD) deflections for four different radial distances: (a)
Comparing Deflection Indices
Deflection basin parameters including
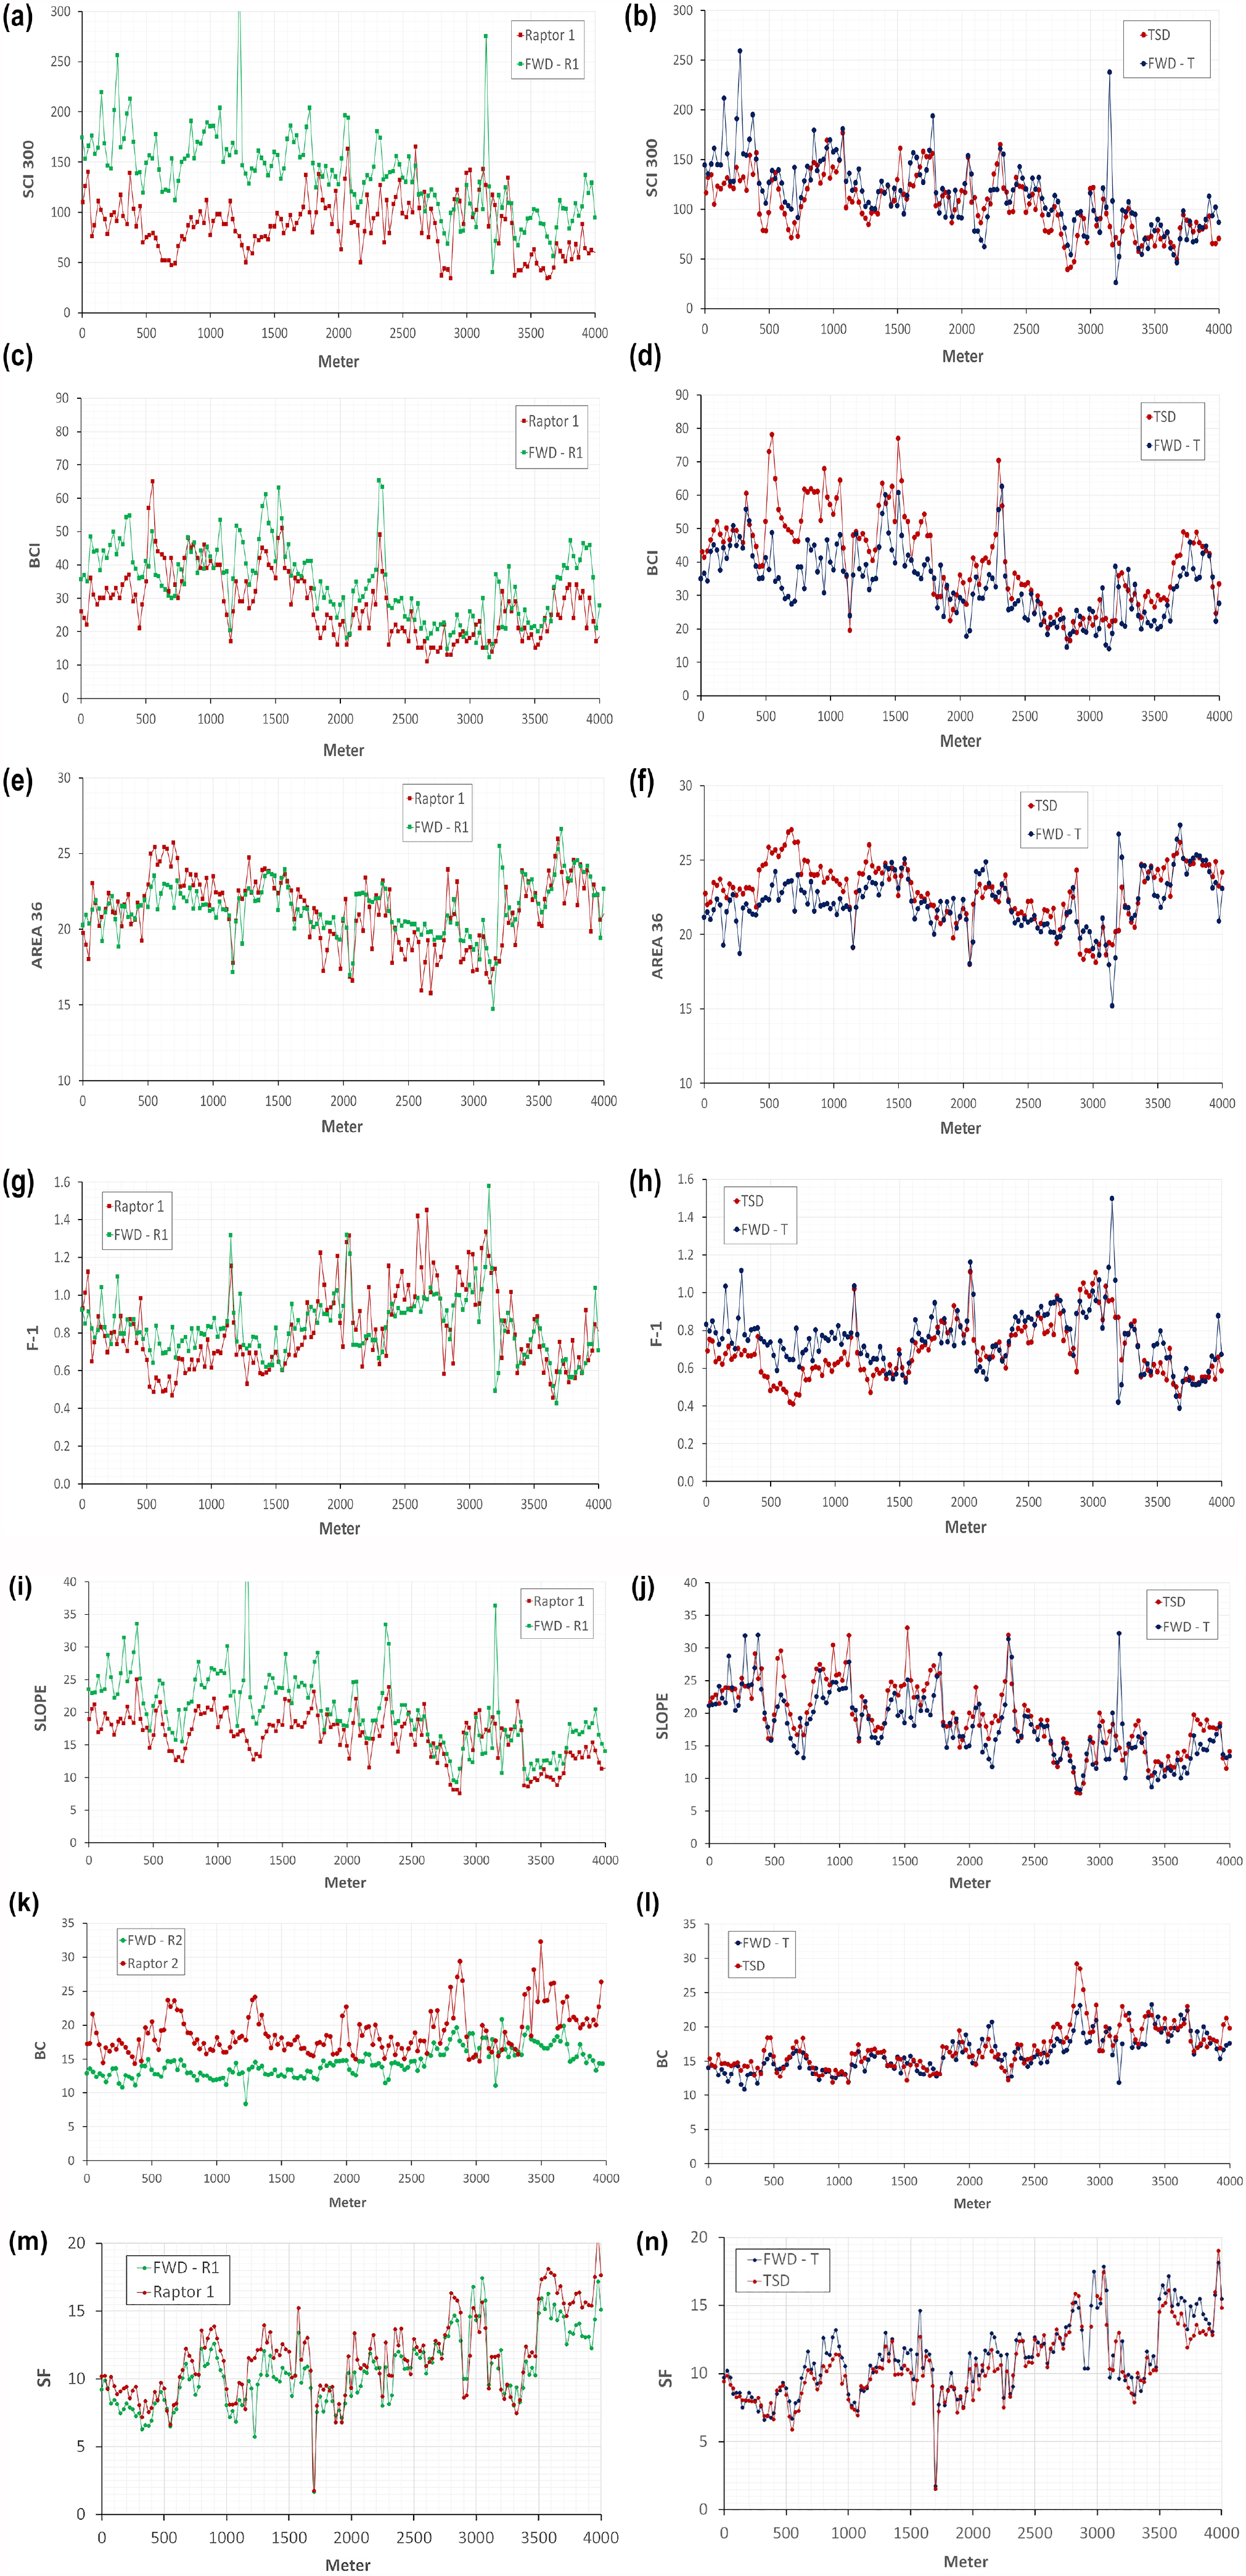
Comparison of traffic speed deflectometer devices and the equivalent falling weight deflectometer (FWD) deflections for deflection basin parameters and structural indices: (a)
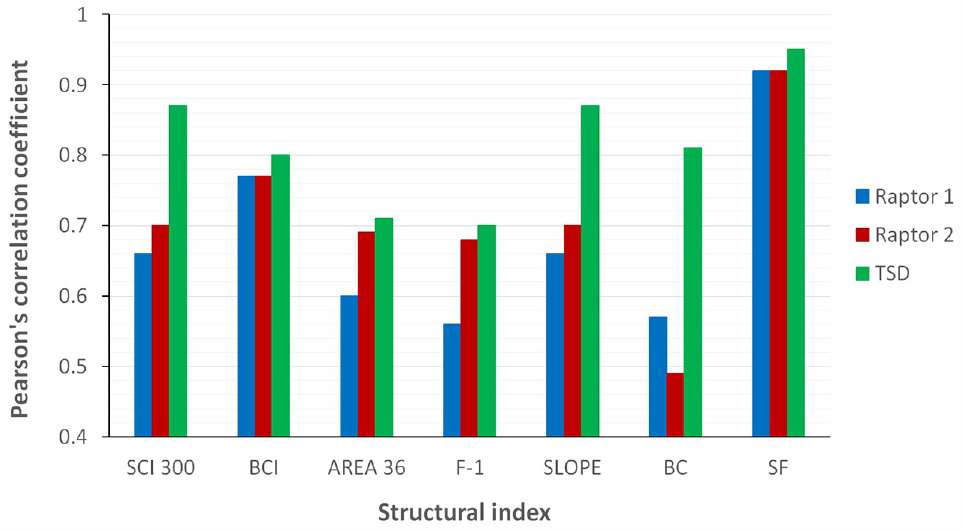
Pearson’s correlation coefficients for rapid pavement tester and traffic speed deflectometer for different structural indices.
According to Figures 10 and 11, the following conclusions can be made with regard to each structural index:
To summarize,
Correcting Bearing Capacity Values
One of the side objectives of this study was to evaluate the possibility of using Raptor data for determining bearing capacity according to the Norwegian definition. According to Figure 10k and 10l, BC values obtained from Raptor are significantly higher than BC values obtained from the FWD. In other words, because Raptor underestimates FWD deflections (Figures 7 and 9), it overestimates the bearing capacity. However, a closer look at deflections obtained from Raptor and its equivalent FWD deflections suggests that there might be a shift between FWD and Raptor data, and Raptor deflections might possibly be converted to FWD deflections. In this part, a temperature correction factor was obtained for BC values based on FWD measurements. Then, Raptor data were modified, and a temperature correction factor was also defined based on Raptor measurements.
Temperature Correction Factor Based on the FWD
For FWD deflections, a factor for correcting the effect of temperature on BC can be defined according to Equation 11:
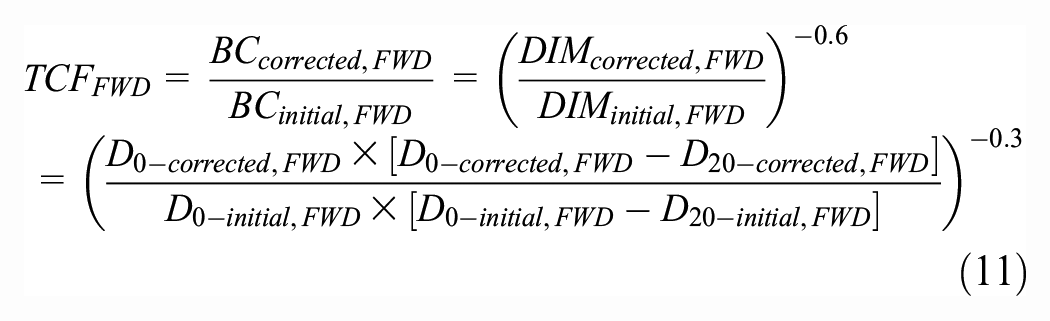
where
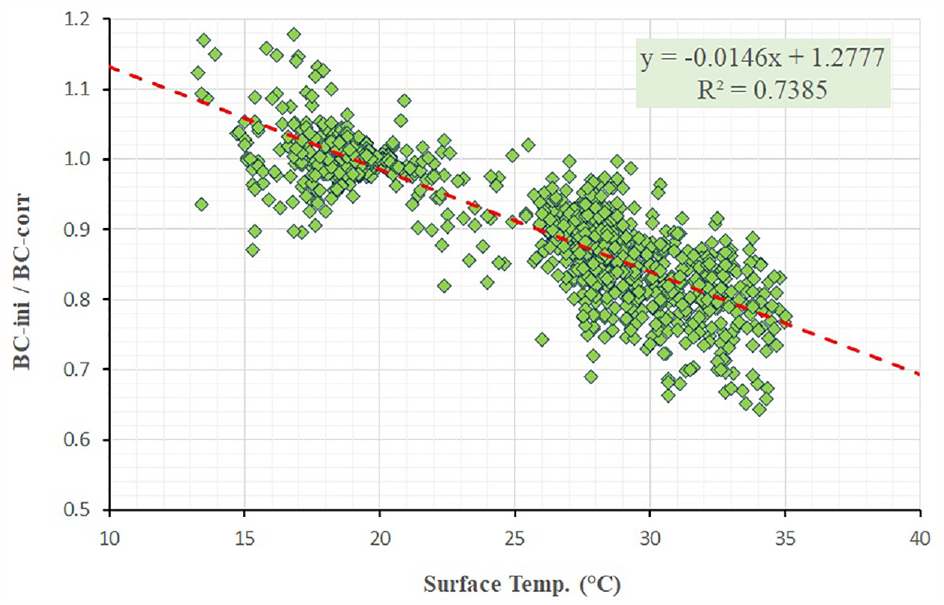
Temperature correction of bearing capacity (BC) for falling weight deflectometer deflections.
As shown in Figure 12, considering a linear regression model results in a coefficient of determination as high as 0.74, justifying a linear relationship between the variables. As a result, Equation 12 is obtained for correcting the values of BC:
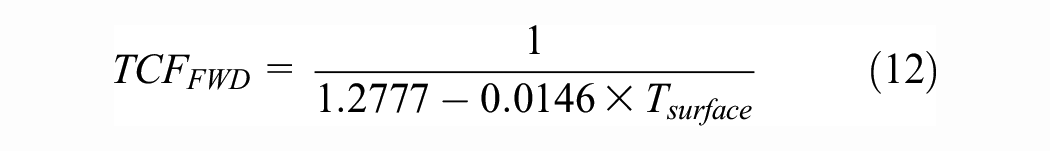
where
Temperature Correction Factor Based on the Raptor
Similarly, the temperature correction factor for BC values based on Raptor deflections can be obtained according to Equation 13:
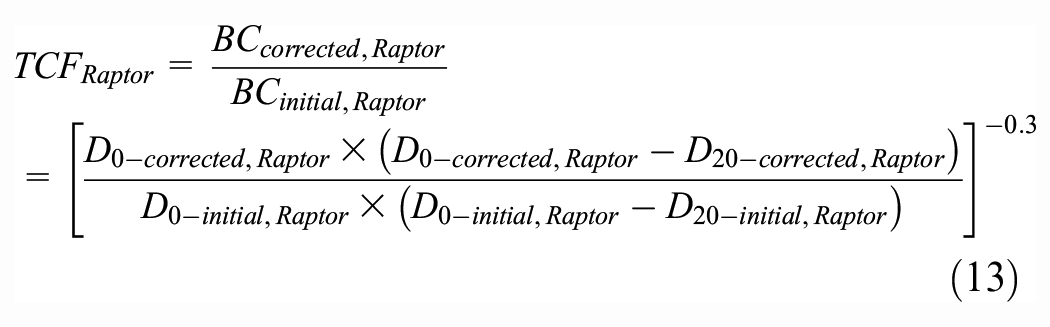
To find
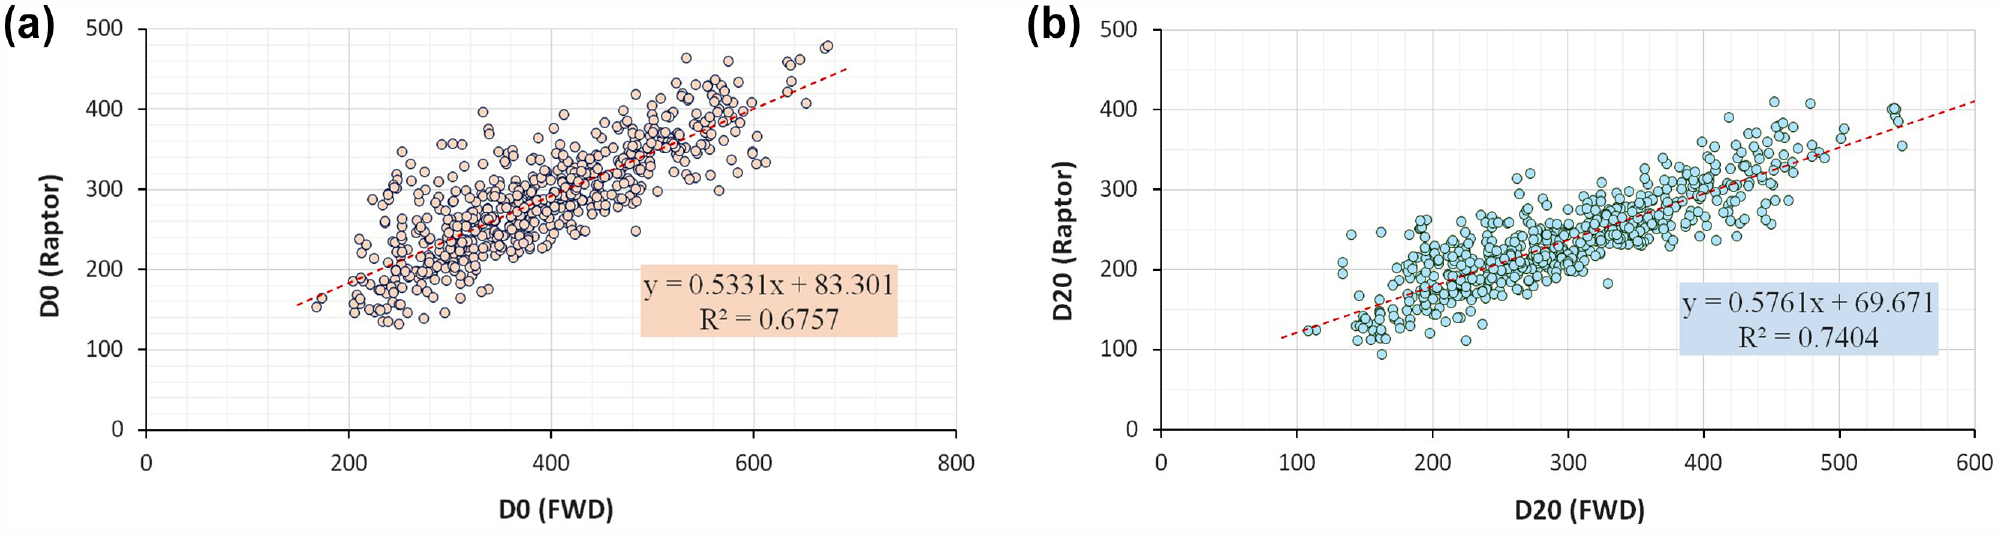
Linear regression models between rapid pavement tester and falling weight deflectometer deflections for: (a)


Values of
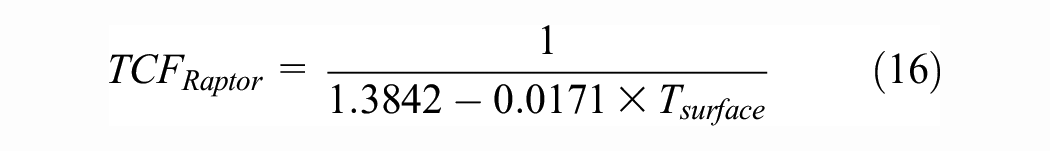
where
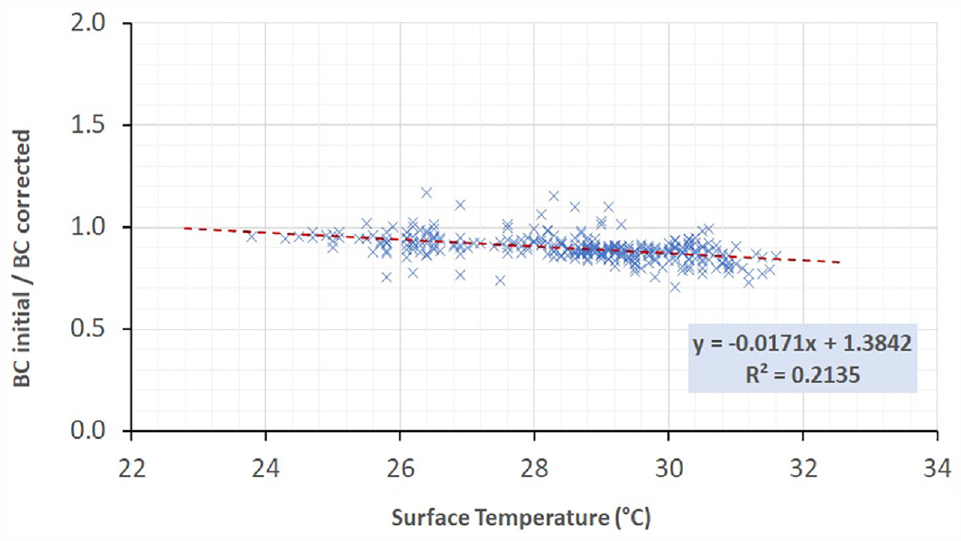
Temperature correction of bearing capacity (BC) for Raptor deflections.
Figure 15 shows the BC values for a sample of forty-five random points before and after applying the temperature correction factor to the Raptor data. Applying the correction factor can substantially increase the consistency between FWD and Raptor in determining BC by decreasing the relative error from 30% to around 10%.
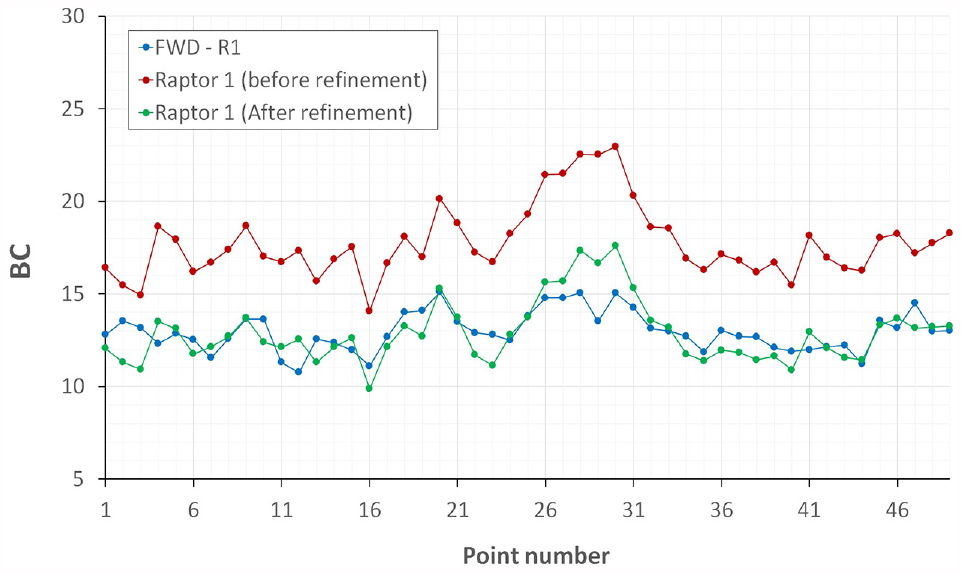
Bearing capacity (BC) before and after refining Raptor deflections.
Summary and Conclusions
This study provides a comparison between TSDDs (i.e., TSD and Raptor) with regard to the consistency with their equivalent FWD deflections. For this purpose, measurements were carried out on some roads in the middle part of Norway using FWD, TSD, Raptor, and GPR. FWD measurements were conducted at three different temperatures, and FWD temperature-dependent deflection curves were obtained to correct the effect of temperature. The main findings of this study are as follows:
Both Raptor and TSD provide repeatable deflections, especially in determining deflections at inner radial distances.
From a graphical and statistical viewpoint, the consistency between TSD and FWD is higher than the consistency between Raptor and FWD.
For three structural indices, namely
Both TSD and Raptor are capable of detecting sections with low resilient responses.
A correction for Raptor data was proposed. Applying this correction enhances the consistency between Raptor and FWD in determining bearing capacity.
TSDDs do have many advantages over FWD, which promotes interest in using them for network-level structural evaluation. This study showed that between TSD and Raptor, the TSD shows higher levels of consistency with FWD, and Raptor deflections should be refined to correlate better with FWD deflections. However, there are fundamental differences between TSDDs and FWD that should certainly be considered. TSD determines the pavement response under the maximum load, Raptor uses the measured distance between deflected and undeflected conditions of roads, and FWD measures the maximum deflection for different time histories of loading. Besides, FWD applies an impact load on a circular plate, and the TSDDs apply a dynamic load by single (in the case of Raptor) or dual (in the case of TSD) tire loadings. Another remark is concerning the symmetry of the deflection basin. Whereas the FWD deflection basin is symmetrical around the loading center, the deflection basin obtained from a moving device is not symmetrical, and the maximum deflection occurs behind the loading axle ( 34 ). As the measuring principles and loading mechanisms are different, they should not necessarily produce similar deflection values.
The TSD has been studied for more than 10 years, and now it can be incorporated into pavement management systems. On the other hand, Raptor represents a new technology, and conducting more research studies on Raptor is recommended by the authors. However, both TSD and Raptor seem to have the potential to distinguish between sections with different resilient responses. Finally, although the findings of this study verify that there is a correlation between TSDDs and FWD, the regression models developed here were based on a limited number of data points.
Limitations of the Study
There are several limitations in the current study. To obtain deflections from TSDDs, this study relies on models developed by the device manufacturers. Although the engagements with industry experts in the manufacturers’ companies suggest ongoing methodological refinements, the reliability of deflections provided by manufacturers is a valid concern. As another limitation, the structural indices discussed in this study need improvements, as they are unable to reflect the effect of moisture in the granular layers. With regard to the temperature correction factor of bearing capacity, it should be recognized that local conditions, such as soil type, moisture content, and temperature, can significantly influence deflection measurements and consequently, bearing capacity. The selected roads in this study were chosen to be most representative of the Norwegian climate, road and pavement structure, traffic loading and patterns, and geological conditions. This careful selection ensures that the developed relationships for deflections are highly relevant and accurate for the local context. However, it is essential to acknowledge that there are limitations when applying this methodology to other countries with different parameters. To generalize the findings of this study to other roads with different geographical locations, a more comprehensive study needs to be conducted. Another issue concerns the effect of pavement roughness on TSDD measurements. It is believed that pavement irregularities might affect data measured by TSDDs. The effect of highway geometry on TSDD measurements is another issue that needs to be elaborated in a separate study.
Future Perspective
Although this study provides pretty accurate comparisons of deflection measurement between different deflection devices, the treatment selection algorithms for pavement maintenance have much lower levels of sensitivity to variations in the input data than direct correlations. Future research could focus on predicting the maintenance regimes for the same section of roads using the results from the three devices. In this regard, the NPRA has employed the Raptor for the entire national road network of Norway. There are also FWD data for most of the national road network. These data, collected over several years, are processed, and are usable now in an internal GIS-based template called ‘Baereevne_raadata_Dashboard’ (dashboard for bearing capacity data). Among a variety of possibilities in this dashboard such as checking the bearing capacity data determined by Raptor, one can assess the condition of the roads using the calculated surface curvature index, base curvature index, and the available classifications in the Norwegian road manuals. The GIS-dashboard also enables the detection and determination of road stretches classified as “weak” (with low bearing capacity values, shown in red), facilitating the planning of appropriate treatments. The dashboard is available for the internal use only, but data can be found in the National Road Data Bank (NVDB) or via vegkart.no.
To find a generalized formula for correlating TSDDs and FWD, a more comprehensive research study considering different variables (including different pavement structures, weather conditions, soil types, vehicle speeds, etc.) should be conducted. Developing new analysis methods for TSDDs independent of FWD, defining new structural parameters reflecting the structural integrity of pavements, calibration, and validation of these new indices, proposing new protocols for data collection, and more in-depth research on temperature correction procedures of TSDDs are some other research topics that can be pursued in future studies.
Footnotes
Acknowledgements
The authors thank Stine Skov Madsen, Martin Wiström, and Søren Rasmussen from Ramböll (Malmö Office), and Marshall Arokia, Nikolaj Ravn, and Karsten Jensen from Greenwood Engineering (Copenhagen Head Office) for their sincere help in organizing technical meetings about TSDDs.
Author Contributions
The authors confirm contribution to the paper as follows: study conception and design: A. Hamidi, A. F. Mirhosseini, K. R. B. Grannes, P. O. Aursand; data collection: A. F. Mirhosseini, K. R. B. Grannes, P. O. Aursand; analysis and interpretation of results: A. Hamidi, A. F. Mirhosseini, I. Hoff, H. Mork; draft manuscript preparation: A. Hamidi, I. Hoff, H. Mork, A. F. Mirhosseini. All authors reviewed the results and approved the final version of the manuscript.
Declaration of Conflicting Interests
The author(s) declared no potential conflicts of interest with respect to the research, authorship, and/or publication of this article.
Funding
The author(s) disclosed receipt of the following financial support for the research, authorship, and/or publication of this article: This research was funded by the Norwegian University of Science and Technology (NTNU) and the Norwegian Public Roads Administration (NPRA).
Data Accessibility Statement
Data utilized in this study are confidential and cannot be shared. The programming code can be provided on request.