
Abstract
This study investigates the spatial and temporal patterns of greenhouse gas (GHG) emissions from transportation network companies (TNCs) in Toronto, Canada. TNC services primarily consist of short-distance trips in the central business district. Deadheading—driving without passengers—contributes 40% of TNC GHG emissions, and part-time drivers had a higher deadheading proportion than full-time drivers. Pooled TNC trips account for 10% of total trips, and just 27% of pooled trips resulted in multiple passengers sharing a vehicle on the same route. The GHG implications of pooled trips were compared with other TNC services and with a consumer driving their own private vehicle, through the estimation of median trip emission intensities of each TNC service in grams of CO2eq per passenger-km, while accounting for deadheading. Non-pooled internal combustion engine (ICE) ride-hailing trips have a median emission intensity 61% higher than that of a single-occupancy private vehicle. The median emission intensity for a pooled ICE ride-hailing trip is 20% higher than that of driving one’s own vehicle. Vehicle electrification provides a 91% daily GHG emission reduction for this fleet. This reduction is mainly achieved through full-time drivers, who, on average, achieve three times as much GHG savings per electrified vehicle compared with part-time drivers.
Keywords
The use of transportation network companies (TNCs) has proliferated over the past decade. TNCs have benefited from tremendous growth because of network effects that have exponentially increased their usage. While it took 6 years for Uber to accumulate their first billion rides, they needed only 6 months to accumulate the following billion rides ( 1 ). TNCs offer on-demand ride services where consumers order a ride through an app that connects them with a driver who is often a private individual driving their personal vehicle. The TNC receives a portion of the fee paid by the user. In the City of Toronto, Canada, TNC trips experienced rapid growth between 2016 and 2020, reaching a plateau around 200,000 daily trips in November, 2019. The COVID-19 pandemic resulted in a significant drop in daily rides, with the most recent available estimate of around 85,000 daily trips in July, 2021 ( 2 ). TNC trips are expected to continue growing, and various jurisdictions, including the City of Toronto, are exploring regulatory approaches to reduce the greenhouse gas (GHG) emissions associated with the sector.
Up until the 2020 COVID-19 pandemic, TNCs offered ride-pooling services that allowed passengers to share their ride with other passengers for a reduced fee. These pooling services were halted during the pandemic and have resumed in some Canadian cities, including Toronto, since February, 2023. Pooled trips can reduce GHGs by maximizing vehicle occupancy, encouraging trip chaining for drivers, and reducing the overall distance traveled by drivers. Zhu and Mo conducted simulations of the potential of ride-pooling using detailed ride railing data from a leading TNC provider, Didi, in Haikou, China ( 3 ). The authors captured a reduction in aggregate vehicle kilometers traveled (VKT) of 8.21% with a delay buffer time for users of 60 s. A sensitivity analysis also showed that the VKT reduction potential of ride-pooling is very sensitive to the delay buffer attributed to users and the time of day. Cai et al. similarly used 1 month of detailed ride-hailing data from 12,083 vehicles (18% of the fleet) in Beijing, China, to assess the potential VKT reduction that can be achieved with pooling under different time delay tolerance levels ( 4 ). The study demonstrated that, with a delay tolerance level of 10 min, ride-pooling can reduce the fleet’s VKT by 33%, which translates into large GHG reductions. Existing studies in the literature evaluate the GHG reduction potential of ride-pooling based on simulations conducted using the trajectories of non-pooled trips. Efforts have yet to be made to quantify the emissions associated with existing pooled trips, comparing them with other TNC services and private autos.
Despite potential emission savings through ride-pooling, ride-hailing with a single passenger can increase emissions because of two main factors ( 5 ). First, studies have shown that ride-hailing services are not only replacing trips conducted by a personal vehicle, but also public transit and active transportation trips, thereby generating new automobile trips ( 6 , 7 ). Second, a ride-hailing trip can be more polluting than a personal trip because of the additional distance traveled between rides, often called “deadheading.” Wenzel et al. used detailed ride-hailing data from the American TNC provider RideAustin in Austin, Texas, to quantify deadheading miles traveled by TNC drivers ( 1 ). The authors estimated that 19% and 26% of total ride-sourcing VKT are attributed, respectively, to drivers’ commutes to and from their service areas, and to distance traveled between ride requests. Their results show a net increase in energy use of 41%–90% with ride-hailing relative to personal travel. Henao and Marshall also analyzed the impacts of ride-hailing in Denver, Colorado, in relation to deadheading, vehicle occupancy, mode replacement, and VKT ( 8 ). The authors analyzed 416 ride-hailing trips conducted by a single driver on local TNCs Uber and Lyft and estimated a percentage of deadheading of 40.8%, of which 25% corresponded to driver availability on the platform or dispatched to reach a passenger, and 15.8% to commuting from their service areas. While both studies attempt to estimate the contribution of deadheading in ride-hailing, the findings are limited by the small sample size of the trips evaluated, or the lack of data on the time spent by drivers on other TNC platforms. There is a need to assess the overall contribution of deadheading to total daily distance traveled and GHG emissions by TNC drivers across multiple platforms in urban areas.
Pooled trips and deadheading kilometers reduction are key approaches promoted by jurisdictions to limit the GHG emissions associated with TNCs. Recent cost-reduction developments in battery technology have also increased the viability of vehicle electrification as a potentially effective technological solution to limit GHG emissions associated with the internal combustion engine (ICE) ride-hailing sector, particularly in countries with a low-emitting electricity grid such as Canada ( 9 ). In this context, several jurisdictions across the globe have adopted regulations and policy measures, such as preferential vehicle access and financial incentives, to promote electrification of the ride-hailing sector ( 10 ). Jenn examined the emission benefits of battery electric vehicles (BEVs) in the California context using high-resolution data from local TNCs, Uber and Lyft ( 11 ). The author used detailed travel data from a subset of over 1,000 ride-hailing drivers using BEVs that are known to be full-time drivers on multiple TNC platforms and estimated that the potential environmental and emission reduction benefits are approximately three times higher for BEVs used in ride-hailing compared with those of regular vehicle usage. The analysis, however, does not distinguish the daily distance traveled between part-time and full-time drivers and is only focused on a subset of the TNC driver fleet. Zhao et al. similarly used 1 day of real-world GPS data from 500 ride-hailing vehicles on the Chinese TNC, Didi, in Beijing to assess the economic and environmental impacts of ride-hailing electrification ( 12 ). The authors identified daily distances traveled of 32, 134, and 249 km for hitch-ride, part-time, and full-time drivers, respectively. Fleet electrification for full-time drivers was estimated to reduce GHG emissions from 37.8% to 74.9%, based on different scenarios of electric vehicle efficiency and charging infrastructure conditions.
Prior research has investigated how deadheading affects the total distance traveled by TNC drivers as well as the potential reduction in GHG emissions that could result from electrifying the fleet. These studies were conducted using data from various TNCs, but were constrained either by focusing solely on trips taken within a single TNC platform—restricting the scope of vehicle-level analysis—or by using a subset of GPS-tracked vehicles and failing to encompass the entirety of the urban fleet. This study encompasses a driver-level analysis of all trips conducted across all TNC platforms in the City of Toronto for a full week (1,324,948 trips).
The study uses detailed data collected from TNCs under the municipal licensing regulations of the City of Toronto to evaluate their contribution to GHG emissions for the week of February 3–9, 2020. The paper first explores the temporal and spatial trends of TNC emissions, followed by an empirical exploration of three initiatives typically proposed to limit emissions associated with the TNC industry namely: deadheading reduction, vehicle electrification, and increase in pooled trips. Deadheading is evaluated by quantifying the contribution of deadheading emissions to daily emissions from TNC drivers. The proportion of “available on platform” GHG emissions relative to distance traveled with a passenger on-board is compared for drivers that are active for more than 4 h on a given day (full-time) and drivers that are active less than 4 h (part-time). The potential GHG emission savings achieved with electrification are also estimated, with results evaluated based on the number of hours of activity on a given day. Lastly, the GHG emission implications of pooled trips are compared with other services offered by TNCs compared with a consumer driving their own private vehicle. The comparison is conducted through the estimation of median trip emission intensities of each TNC service in grams of CO2eq per passenger-km based on real-world data, while accounting for deadheading. Overall, the analysis quantifies the GHG emissions of TNC services and identifies trends that will inform GHG emission reduction policies for this sector.
Methods
Transportation Network Company (TNC) Data
TNC data used in this study were collected from TNCs under the municipal licensing regulations of the City of Toronto. The analysis is focused on the week of February 3–9, 2020, before the pandemic. The analysis is focused on a single week for data availability and privacy reasons. This week is representative of pre-pandemic conditions while conservatively accounting for energy consumption fluctuations associated with Canadian winters when assessing the GHG savings associated with electrification. The data are segmented into the following three different periods that are the standard categories in which TNC companies collect their data: the “available on platform” period (p1) when a driver is logged into the app and is eligible to accept a trip request; the “dispatch platform” period (p2) which starts when a driver accepts a trip and ends when they arrive at the passenger destination; and the “passenger platform” period (p3) consisting of the actual trip with a passenger on-board (Figure 1). The p1, p2, and p3 naming approach follows the naming convention for TNC data set by the City of Seattle ( 13 ).
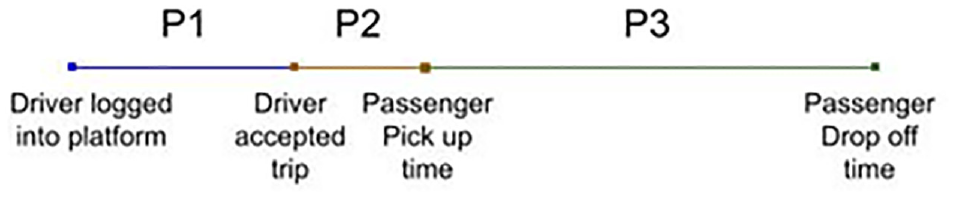
Transportation network companies (TNC) trip segmentation.
The data format allows the identification of each trip start and end time and total distance traveled, as well as the associated driver. It is spatially limited to trips starting or ending in the City of Toronto boundary, which covers an area of 630 km2. Trip origins and destinations that fall outside the city boundary are not available. Furthermore, driver location outside the period in which they are logged onto a platform is not available, with no information on driver home location. In other words, daily distances per driver analyzed in this study often do not include the distances driven before starting or after a shift.
P1 data is provided by TNCs separately from the p2 and p3 periods. Under its raw format, p1 data overestimates the kilometers driven by drivers without a passenger on-board, as some drivers indicate availability to accept trips on multiple platforms simultaneously, resulting in double counting of kilometers traveled. A deduplication process was conducted using the p1 raw data. The p1 deduplication process was conducted by only keeping the p1 events associated with the TNC platform the driver is using the most on each deduplicated day of the February 3–9, 2020, week. This deduplication approach ensures that p1 kilometers are not double counted while waiting for a trip (because of activity on multiple platforms). A summary of TNC data used is presented in the supplemental material (Table S1).
In addition to the analysis of the TNC data across the full week for each of the p1, p2, and p3 periods, the identification number of each vehicle was used to also conduct a vehicle-level analysis based on the trips conducted by individual drivers on each day. Full-time drivers are designated as drivers that are active for more than 4 distinct hours on each evaluated day based on the assumption that part-time drivers work a maximum of 4 h per day. Given that the number of active drivers varies for each day of the week, the vehicle-level analysis was focused on a single day (Thursday February 6, 2020) and observed results were replicated for the remaining days of the week to verify consistency. A total of 10,411 full-time and 10,937 part-time drivers were estimated on February 6, 2020. For each vehicle, p1, p2, and p3 events were aggregated over the full day. The vehicle-level analysis was used to assess the contribution of p1 emissions relative to the p3 distance traveled, and the electrification GHG emission reduction potential of vehicles for part-time and full-time drivers.
Internal Combustion Engine (ICE) Emission Estimation
Emission estimation was conducted at the trip level using emission factors extracted from the Motor Vehicle Emissions Simulator (MOVES). MOVES3 is the latest U.S Environmental Protection Agency (EPA) emission modeling tool that can be used to develop emission factors at various spatial scales ( 14 ). A database of emissions factors consisting of 14 speed bins ranging from 4 km/h (2.5 mph) to 108.6 km/h (67.5 mph) was generated based on an urban restricted road type representative of City of Toronto driving conditions. These emission factors were developed based on average meteorological conditions and the passenger age distribution of the province of Ontario extracted from the vehicle registry data of the Ministry of Transportation of Ontario ( 15 ).
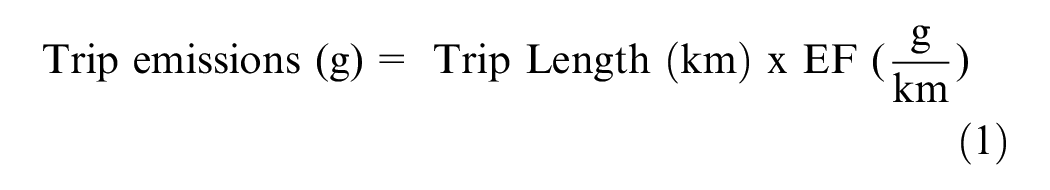
For each trip, the trip average speed was estimated using the trip start and end time, and distance covered. A trip specific emission factor (g/km) was then extracted by interpolation between speed bins of the emission factor database for each pollutant based on the average speed of individual trips. Emissions associated with each trip were subsequently estimated as the product of the trip length and the interpolated emission factor based on Equation 1.
Battery Electric Vehicle (BEV) Emission Estimation
Vehicle Energy Consumption
BEV energy consumption can vary based on multiple factors, including ambient temperature, auxiliary systems usage, and driving behavior. Studies focused on the Nissan Leaf BEV model show increases in energy consumption of up to 70% under extreme cold temperatures ( 16 , 17 ). In this study, energy consumption was estimated based on an −4.2°C average temperature during the month of February in Toronto using the multiple linear regression energy consumption model developed by Yuksel and Michalek ( 17 ). The energy consumption model was developed based on real-world data collected from Nissan Leaf drivers over more than 7,000 trips across North America. The model estimates energy intensities in kW-h per mile based on ambient temperature in °C. An energy intensity of 0.22 kW-h per kilometer was estimated for the month of February and multiplied by the distance of each trip to estimate energy consumption in kW-h. While the model accounts for the relative change in energy intensity across seasons, the energy consumption estimation approach based on a Nissan Leaf does not represent the broader range of vehicles within the TNC fleet, potentially serving as a slightly conservative estimate relative to the heavier and higher-consuming vehicles.
Emission Factors for Electricity Generation
GHG emissions associated with the operations of BEVs were estimated based on the emission intensity of the province of Ontario electricity generation grid. The emission intensity of an electricity grid can be estimated using average or marginal emission factors ( 18 , 19 ). Average emission factors represent the weighted average of GHG intensity of all generating sources of electricity in a region over a period of time ( 20 , 21 ). However, electricity generation sources are, in practice, sequentially activated based on the demand load for each period of the day. Marginal emission factors account for this sequential activation by only focusing on the variable and marginal electricity sources ( 9 , 22 ). In this context, seasonal and yearly marginal emission factors were developed by The Atmospheric Fund to account for the sequential activation of generation sources based on different sizes of electricity demand increases. In this study, an annual marginal emission factor of 123 g CO2eq/kW-h was used for the year 2020 based on the size of the potential electricity demand increase associated with the TNC industry in Toronto ( 23 ). It was developed using a multivariate linear regression approach that takes into account variations in system load, load change rates, and monthly temporal patterns. The emission intensity of the Ontario grid (123 g CO2eq/kW-h) is significantly lower than other regions in Canada such as Alberta where the average emission intensity is of 760 g CO2eq/kW-h because of the more extensive use of coal and natural gas ( 9 ). Ontario’s electricity generation is composed of 34% nuclear, 23% hydro, 13% wind, and 27% natural gas sources. It is important to note that the annual marginal emission factor for electricity production used in this study, encompassing all generation sources, may rise as a result of increased natural gas use depending on the rate of electrification of the TNC fleet and other on-road vehicles.
Quantification of the GHG Intensity of TNC Services
The emissions of TNC services were compared with those of using a private vehicle by estimating the median trip emission intensities of each service in grams of CO2eq per passenger-km. The median is preferred over the mean in this comparison because it is less sensitive to extreme values, ensuring that individual exceptionally high- or low-emission trips do not disproportionately affect the results. This choice allows for a more accurate representation of the typical emissions associated with each service, making the comparison more reliable for decision-making and policy formulation. Emission intensities of each trip were estimated by dividing the total emissions associated with a service by the distance traveled for a trip with the passenger(s) on-board. The services evaluated include non-pooled ICE ride-hailing trips, pooled ICE ride-hailing trips, non-pooled BEV ride-hailing trips and pooled BEV ride-hailing trips.
To compare with the emission intensity of driving a private vehicle, private vehicle passenger emission intensities were estimated by dividing the GHG emissions associated with the portion of a ride-hailing p3 trip by the distance of the trip.
Available on Platform (p1) Emissions in Pooled and Non-Pooled Rides
P1 events cannot be directly linked to individual trips, as drivers do not necessarily accept a trip when they indicate their availability on a TNC platform, resulting in multiple p1 events that are not directly linked to single a trip. The p1 period was therefore explored at the vehicle level by aggregating p1 and p3 events for the evaluated week and estimating an emission factor for GHG emitted from p1 periods per kilometer of p3 distance traveled.
Emission factors for GHGs emitted from p1 periods per kilometer of p3 distance traveled were estimated for all active vehicles in the week of February 3–9, 2020, and showed a mean and median of 196.6 and 144.9 g CO2eq/km for ICEs, and 15.7 and 10.9 g CO2eq/km for BEVs, respectively.
The ratio of GHGs emitted from p1 periods per kilometer of p3 distance traveled was further explored by distinguishing drivers that conduct pooled trips from drivers that do not, to establish whether drivers that conduct pooled trips have a lower proportion of p1 emissions. No distinction could be observed when segmenting drivers that conduct pooled trips from drivers that do not. This is likely because of the limited number of pooled trips conducted by drivers that do pool. In other words, drivers that accept pooled trips and do conduct pooled trips are not more efficient in reducing their p1 events compared with drivers that do not conduct pooled trips because the proportion of pooled trips is small (not enough demand). They do not receive sufficient trip requests that would allow them to chain their trips while a passenger is on-board. Figure 2 presents the distribution of rides that were pooled for drivers that did pool in the week February 3–9, 2020. Overall, 71% of drivers that did conduct at least one pooled trip had less than 20% of their trips consisting of pooled trips.
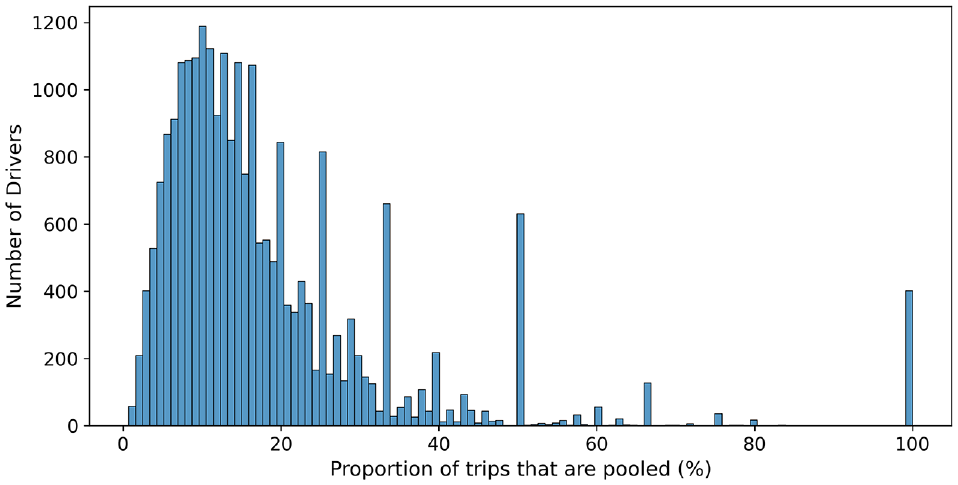
Proportion of trips that are pooled for drivers that conducted at least one pooled trip on the week of February 3–9, 2020 (drivers that are willing to accept pooled trips).
P1 emissions associated with a TNC trip (pooled and non-pooled) were therefore estimated by multiplying the distance of each p3 trip by the median GHG emission factor emitted from p1 periods per p3 kilometer traveled estimated for all drivers. Pooled and non-pooled trips were not distinguished. It is expected that an increase in the penetration of pooled trips would result in a lower ratio being used for drivers that conduct pooled trips versus drivers that do not, because of trip chaining allowing a lower contribution of p1 emissions.
The median GHG emission factor emitted from p1 periods per p3 kilometer traveled is 144.9 g CO2eq/km for ICEs and 10.9 g CO2eq/km for BEVs. The contribution of p1 events to each pooled and non-pooled trip was estimated by multiplying the factor by the p3 trip distance.
GHG Emissions for Non-Pooled Trips
Trip GHG emissions were estimated for non pooled trips by assuming that the p2 GHG emissions, which consist of the emissions emitted between the time a driver accepts a trip and arrives to pick up a passenger, are also attributed to the trip. In other words, emissions attributed to non-pooled travel were estimated as the sum of p2 and p3 GHG emissions for each trip. A GHG emission intensity for the passenger portion of non-pooled trips was estimated by dividing emissions attributed to non-pooled passenger travel by the distance of a p3 trip. The estimated passenger GHG emission intensities were subsequently compared with the emission intensities of the trips including p1 periods by estimating emission intensities that include p1 periods through the addition of the contribution of p1 emissions to each trip and similarly dividing the total by the distance of a p3 trip.
Pooled Ride Passenger GHG Emissions
Passenger GHG emissions were estimated for pooled trips by normalizing emissions based on the number of passengers in a trip. Pooled trips vary based on the order in which passengers are picked up. Figure 3 presents the two options in which pooled trips can occur for a two-passenger pooled trip. The analysis is focused on two-passenger pooled trips, as 79% of pooled trips that end up serving more than a single passenger during the week of February 3–9 are two-passenger pooled trips.
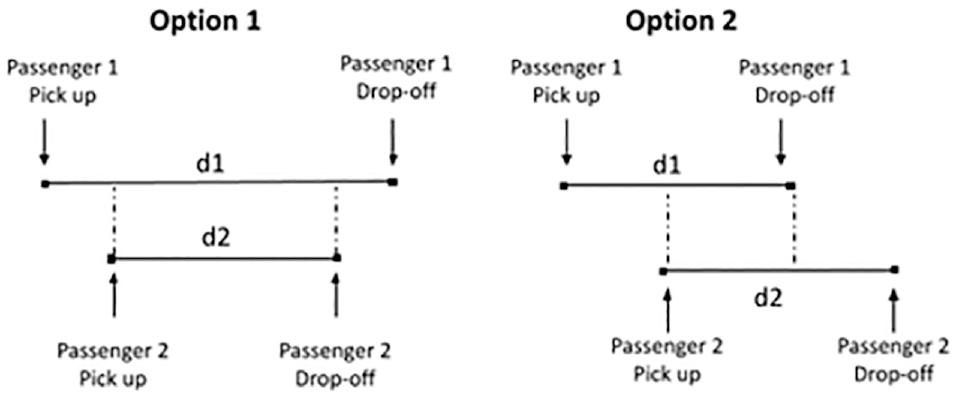
Structure for a two-passenger pooled trip.
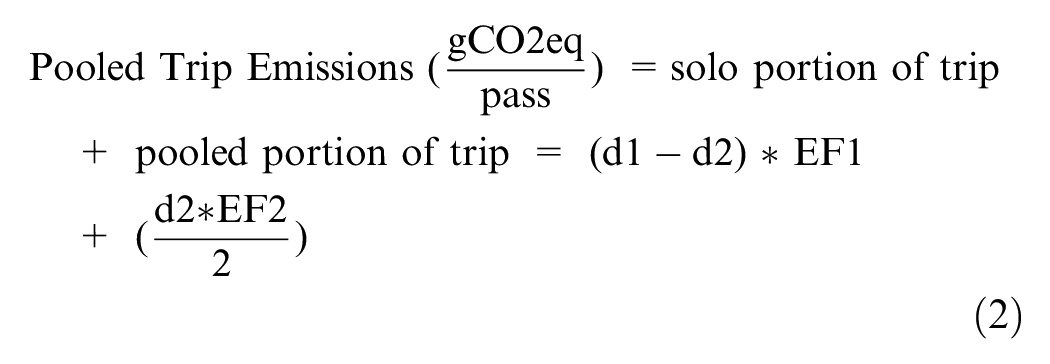
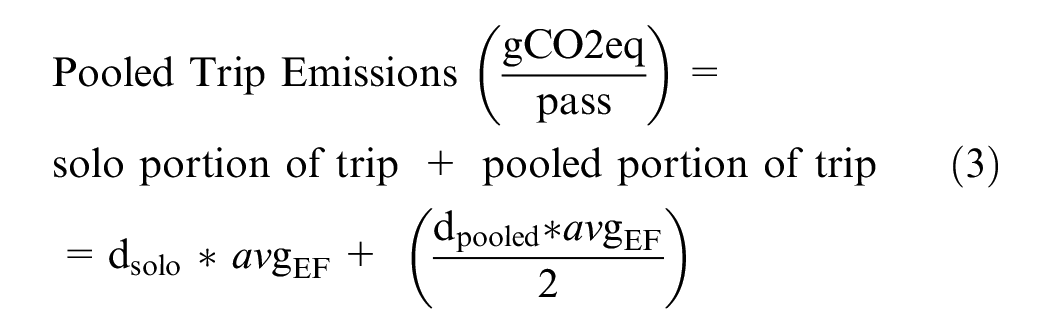
For trips in which a passenger is picked up and dropped off while the other passenger is in the vehicle, pooled trip GHG emissions were estimated based on Equation 2. For trips in which a passenger picks up another passenger but is dropped off before the last boarded passenger, pooled trip GHG emissions were estimated based on Equation 2 by estimating the distance traveled with more than one passenger on-board based on the average speed of the pooled trip.
where
d1 = trip distance of 1st passenger,
d2 = trip distance of 2nd passenger,
EF1 = emission factor associated with 1st passenger trip, and
EF2 = emission factor associated with 2nd passenger trip.
where
d1 = trip distance of 1st passenger,
d2 = trip distance of 2nd passenger,
t1 = trip duration of 1st passenger,
t2 = trip duration of 2nd passenger,
avg_speed_ps1 = d1/t1,
avg_speed_ps2 = d2/t2,
avg_speed_combined = (avg_speed_ps1 + avg_speed_ps2)/2,
t_pooled = t_p1_dropoff – t_p2_pickup,
d_pooled = t_pooled × avg_speed_combined,
d1_solo = d1 − d_pooled,
d2_solo = d2 − d_pooled,
d_solo = d1_solo + d2_solo,
EF1 = emission factor associated with 1st passenger trip,
EF2 = emission factor associated with 2nd passenger trip, and
A GHG emission intensity for the passenger portion of pooled trips was estimated by dividing the total emissions of each trip by the distance of the pooled trip with passengers on-board, which consists of d1 for Equation 2 and (d_solo + d_pooled) for Equation 3. The estimated passenger GHG emission intensities were subsequently compared with emission intensities of trips including p1 periods by adding the contribution of p1 emissions to passenger GHG emissions of each pooled trip and similarly dividing the total by the distance of a pooled trip with passengers on-board, which consists of d1 for Equation 2 and (d_solo + d_pooled) for Equation 3.
Results and Discussion
Trip-Level GHG Emissions
GHG emissions for TNC services were estimated at the trip level for each of the p1, p2, and p3 periods. Additionally, emissions intensities in units of gram CO2eq per kilometer were estimated based on the emissions associated with both the p2 and p3 periods divided by the distance of the p3 period, indicating that the emission intensity of a trip accounts for both the distance with a passenger and the empty distance traveled to reach a passenger (the passenger is “responsible” for the emissions generated while in the vehicle and the emissions generated to reach them).
Figure 4 presents the GHG emissions associated with each portion of a trip segmented by weekdays and weekends. We do not observe significant differences when comparing weekdays and weekends, indicating similar trip characteristics across the week. A total of 50% of p3 trips emit between 1,000 and 2,800 g CO2eq, 25% of p3 trips emit between 2,800 and 5,000 g CO2eq, and the other 25% of p3 trips emit between 100 and 1,000 g CO2eq, indicating significant variability across trip lengths. A focus on distance traveled in kilometers shows that 50% of p3 trips are below 5 km. Encouraging consumers to opt for active or public transportation for these trips is crucial for mitigating GHG emissions associated with the ride-hailing sector in the City of Toronto. Research has been conducted to identify the alternative modes that individuals would have used for these trips in the absence of ride-hailing services ( 24 ).
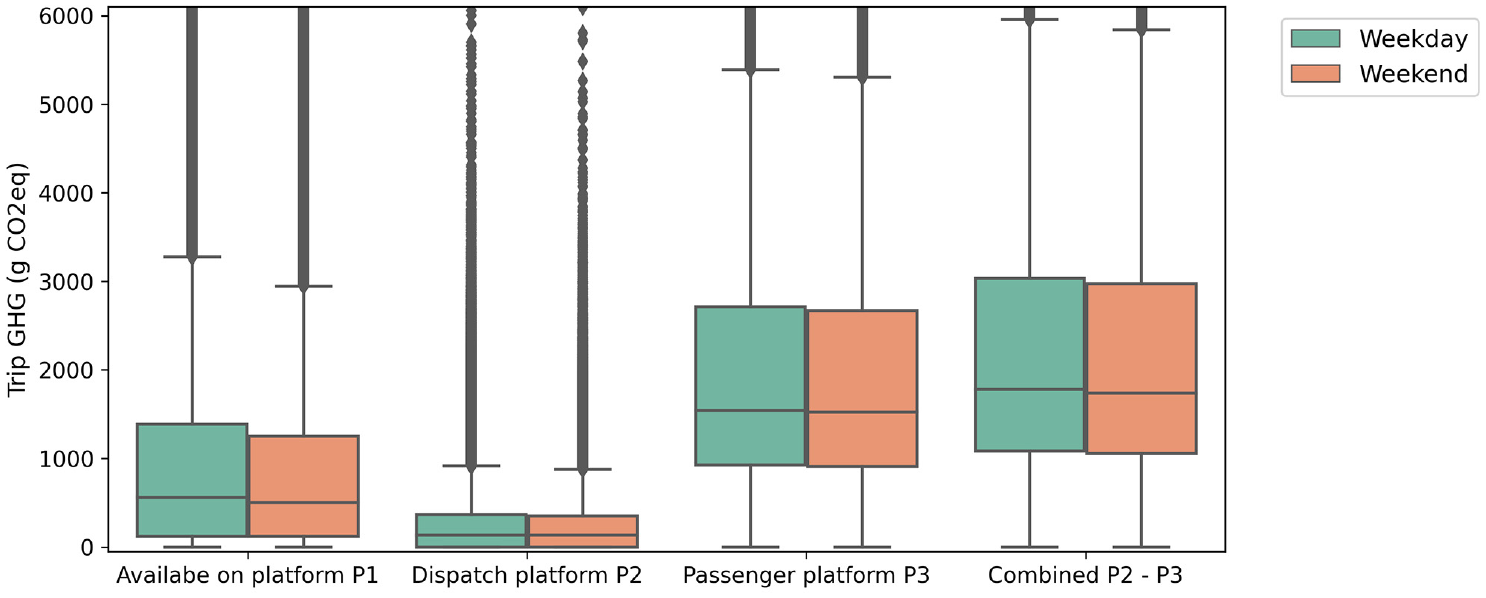
Greenhouse gas (GHG) emissions of trips segmented by portion and weekday/weekend.
The range of emissions associated with the p2 period, which consists of the distance traveled by a driver to reach a passenger after accepting a trip, is smaller than other trip periods, indicating that most drivers do not travel long distances to reach passengers once they accept a request. On the other hand, the p1 events, which consist of the driver active on the app waiting to receive and accept a trip request, show higher variability. While some p1 events are very low-emitting, indicating that the drivers indicate availability and accept a trip request shortly after, other p1 events are longer: 25% of p1 events emit between 1,200 and 3,200 g CO2eq. These are events with GHG emissions that are comparable with p3 trips. Urban emission reduction initiatives in the TNC sector should be focused on minimizing these p1 events.
Figure 5 presents the GHG emissions per kilometer associated with each portion of a trip segmented by weekday and weekend. A trend of slightly higher p2 and p3 GHG emissions emitted per kilometer can be observed during weekdays relative to weekends. This trend can be explained by more-congested traffic conditions during weekdays that result in higher emissions per kilometer. P1 events show higher variability in emissions per kilometer relative to p2 and p3, with emissions per kilometer for 75% of p1 events varying between 320 and 610 g CO2eq per kilometer. These findings can be explained by the emission estimation method used that relies on the total distance associated with a p1 event to estimate trip average speed. If a driver spends a significant amount of time waiting for a trip and travels a short distance during that time, our emission estimation method assumes the driver is driving at a very low (idling) speed for the duration of the p1 period. However, the driver could be parked for half the period and driving slightly faster for the rest of the period. This would result in lower emissions associated with these p1 events, but that can only be captured with higher speed granularity. Lastly, the combined p2–p3 emission intensity shows a median that is around 300 g/km for TNC trips on weekdays and weekends.
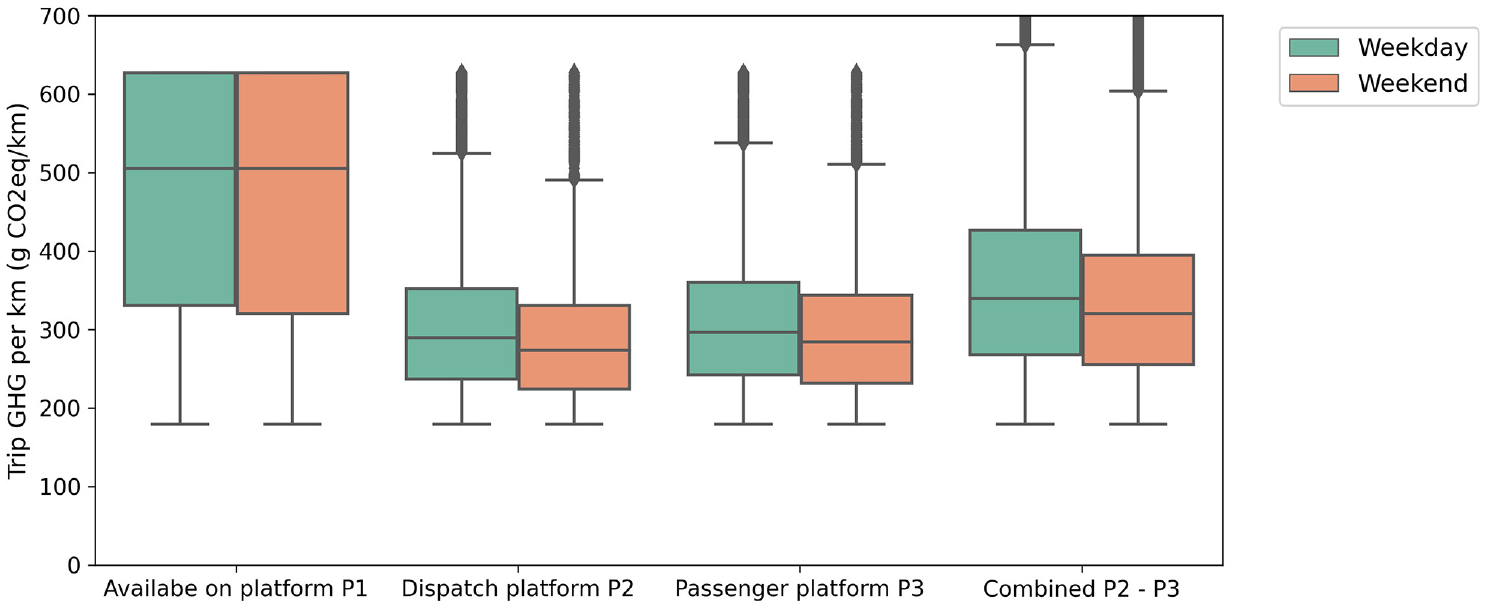
Greenhouse gas (GHG) emissions intensities segmented by portion and weekday/weekend.
Diurnal Trends
Figure 6 presents the GHG emissions per kilometer associated with combined p2–p3 trips segmented by time of day and distinguishing weekdays and weekends. Significantly higher emissions per kilometer are observed during the 7–9 a.m. morning period on weekdays relative to weekends. This can be explained by congestion resulting in higher emissions per kilometer during peak periods. A similar, less pronounced trend is observed in the afternoon 4–6 p.m. period.
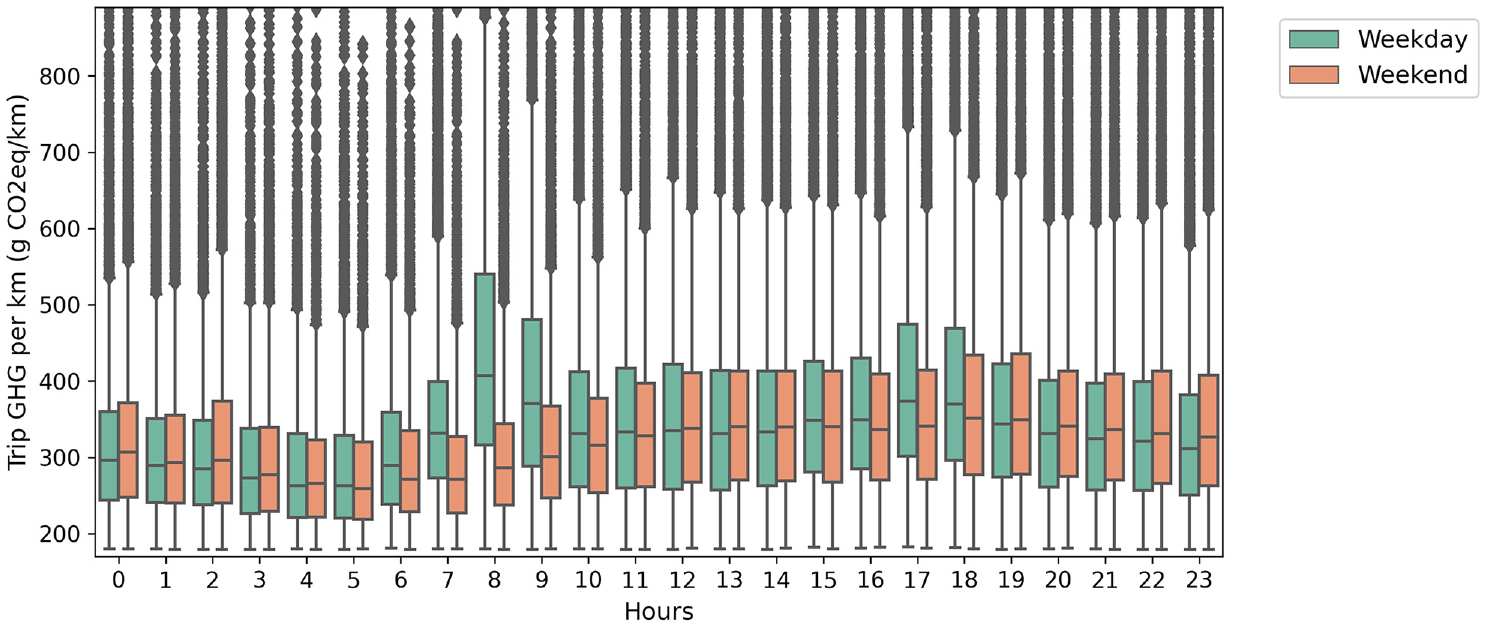
Combined p2–p3 greenhouse gas (GHG) emission intensities by time of day and weekday/weekend.
Figure 7 presents the hourly total GHG emissions from combined p2–p3 trips by day of the week. Total hourly emissions for weekdays follow a similar trend, while higher variability across days can be observed on the weekend. A similar trend of emissions can be observed between midnight and 2 p.m. for weekdays (Monday–Friday) with around 30 tonnes of CO2eq emitted at 8 a.m. A less pronounced emissions peak of around 22 tonnes is observed in the afternoon peak from Monday to Thursday, relative to the 35 tonnes Friday night peak. The impact of leisure trips on the weekend can be observed with around 30 tonnes CO2eq emissions occurring in the early hours of Saturday and Sunday. Hourly GHG emissions on Saturday increase in the evening period, reaching the peak of the Friday evening. On the other hand, Sunday hourly GHG emissions are relatively uniform across the day.
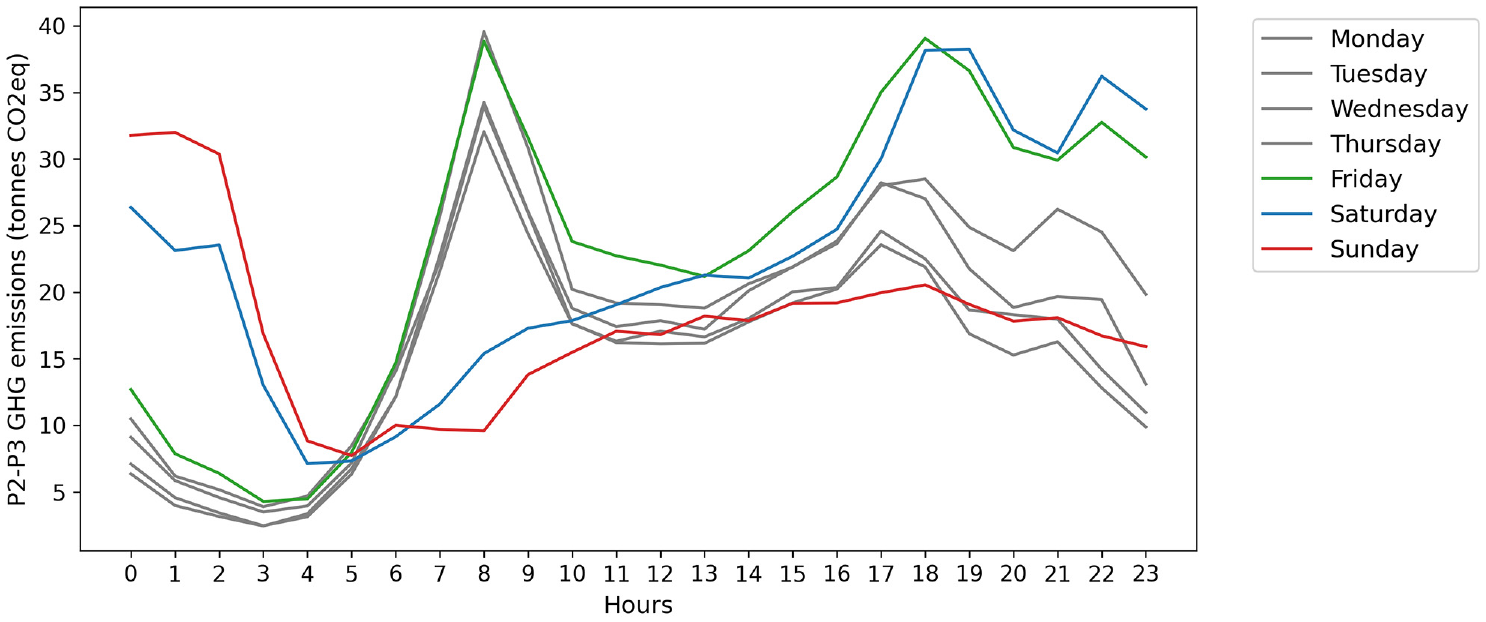
Hourly total greenhouse gas (GHG) emissions from combined p2–p3 trips segmented by day of the week.
Spatial Trends
Figure 8 presents the total emissions associated with trips that (a) originate and (b) are destined to each of the 25 wards in the City of Toronto during the morning 6–10 a.m. period for February 6, 2020 (Thursday). Figure 8a illustrates that most trips start in the downtown core during the morning period with the highest GHG emissions (12 tonnes CO2eq) attributed to the Spadina-Fort York ward, followed by the Toronto Centre and University-Rosedale wards (8 tonnes CO2eq). Figure 8b shows that most trips are also destined to the downtown core during the morning period with the highest GHG emissions (16 tonnes) also attributed to the Spadina-Fort York ward, followed by the Toronto Centre and University-Rosedale wards (11 tonnes). A similar trend is observed for the rest of the week.

Total greenhouse gas (GHG) emissions from trips that originate from (a) and are destined to (b) different wards between 6 and 10 AM on February 6, 2020.
These three wards house a multitude of businesses, corporate headquarters, government offices, and educational institutions, attracting many commuters and professionals who rely on TNC services for their daily transportation needs. The Toronto subway system serves these wards through two lines in the north-south direction and a single east-west line that goes trough the University–Rosedale ward. Other public transit usage in these wards is mainly focused on a network of light rail and buses. Young et al. examined TNC trips in Toronto by segmenting them based on their travel time difference with transit ( 25 ). The authors observed that 26.9% of trips have poor transit-based alternatives, but 30.6% of trips have transit alternatives of similar duration. Loa et al. further explored the factors that influence substitution of public transit for TNC services in Toronto and found that older and wealthier respondents were more likely to select TNC services ( 6 ).
Overall, we observe that most TNC trips start and end in the downtown core during the morning peak period, with an additional portion of trips destined to the downtown core wards from other outer wards. Additional analysis on the average GHG emissions and intensity of trips originating from each ward can be found in the supplemental material (Figure S1 and S2). These findings are in line with those of other studies on TNCs that show that most TNC trips in North American urban areas consist of short-distance trips in the central business district with a similar pattern across different times of day and days of the week ( 26 , 27 ). Policy initiatives should target the lowest-distance trips occurring in the central business district to promote active and public transportation, particularly for TNC trips that have public transit alternatives of similar duration. For trips that cannot be replaced, municipal jurisdictions can put in place credit requirements for TNCs that require that a growing portion of their rides are trips that connect to transit stations, encouraging the role of TNC services as a travel mode within multi-mode travel that includes public transit.
The Role of Deadheading on GHG Emissions
Deadheading across Full Week
Figure 9 presents the contribution of each TNC trip period to VKT, vehicle hours traveled (VHT), and GHG during the week of February 3–9, 2020. P1, p2, and p3 periods contribute 33%, 7%, and 60% of GHG emissions, respectively. Additionally, while TNC drivers spend close to 50% of their time available on platform, p1 events contribute 26% of weekly kilometers traveled, indicating that drivers do attempt to minimize distance traveled while deadheading to avoid extra fuel costs. The geospatial distribution of the average distance of p1 events is presented in the supplemental material (Figure S3).
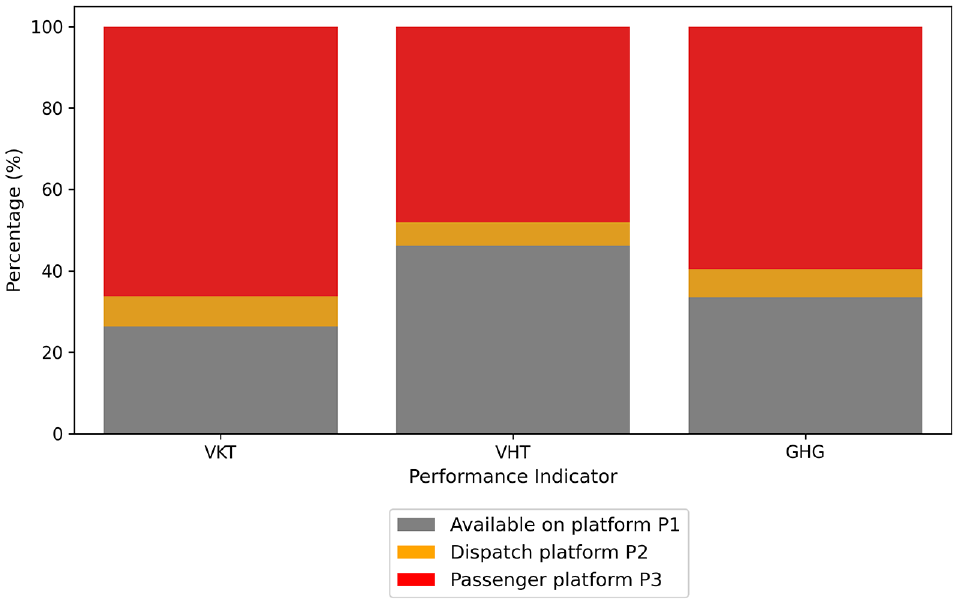
Contribution of each trip period to vehicle kilometers traveled (VKT), vehicle hours traveled (VHT), and greenhouse gas (GHG) emissions.
Deadheading VKT, which includes p1 and p2 distances, represent a total of 34%, which is higher than the 26% estimated in Austin, Texas by Wenzel et al. using data from a single TNC platform ( 1 ). The difference in findings can be explained by the more comprehensive dataset used in this study that captures the overall travel data of 37,690 different drivers. The findings of this study are, in fact, in line with 2016 estimates of 35.8% and 44.8% in Los Angeles and Seattle, respectively, for the deadheading contribution of uber drivers (without the contribution of distance traveled to and from the service areas) ( 8 , 28 ). The findings indicate that studies conducted based on more comprehensive datasets show a higher deadheading VKT contribution ranging from 34% to 45%. The City of Toronto and Los Angeles exhibit lower deadheading than Seattle. This difference could be explained by the higher population density of these cities, which allows drivers to find customers more quickly and results in less deadheading.
Deadheading at the Driver Level
Figure 10 presents boxplots of vehicle-level p1 GHG emissions per p3 kilometer traveled segmented by full-time and part-time drivers on February 6, 2020. Full-time and part-time drivers show median emission factors of p1 GHG emissions per p3 kilometer equal to 137 g CO2eq/km and 157 g CO2eq/km, respectively. In other words, full-time drivers generate less emissions while waiting to accept a trip than part-time drivers relative to the total distance they travel with a passenger on-board over a given day. Additionally, full-time drivers exhibit significantly less variability than part-time drivers. The 50th percentile of full-time drivers emit between 100 and 190 g CO2eq/km on the evaluated day. On the other hand, the 50th percentile of part-time drivers emit between 90 and 300 g CO2eq/km on the evaluated day. Furthermore, the highest 25th percentile of part-time drivers emit between 300 g CO2eq/km and 600 g CO2eq/km, while the highest 25th percentile of full-time drivers emit a maximum of 310 g CO2eq/km. Similar results were observed for each day of the study week. The numbers of p1 events for part-time and full-time drivers are compared in the supplemental material (Figure S4). We do not note significant differences.
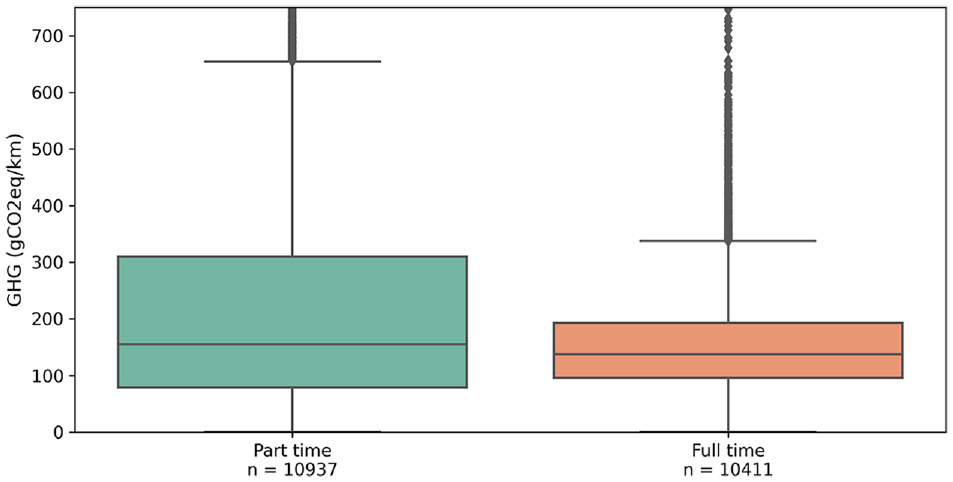
Distribution of vehicle-level GHG emissions from “available on platform” travel divided by distance travelled with “passenger on-board” (gCO2eq/km) segmented by full-time and part-time drivers on February 6, 2020.
Multiple factors can explain these findings. Full-time drivers tend to have more experience and limit the p1 distance traveled, while maximizing revenue-generating p3 distance traveled. Full-time drivers could also be less selective with the types of ride they accept. On the other hand, the high variability observed for part-time drivers can be explained by the uncertainty of part-time drivers, with drivers potentially indicating availability to accept a ride while only being willing to accept rides of a certain length. Studies have shown that part-time ride-hail drivers were more selective in accepting trips on TNC platforms than full-time drivers, as they tended to prioritize trips with higher fares and shorter distances ( 29 ).
These findings suggest that municipal regulations have the potential to reduce p1 deadheading GHG emissions by limiting the number of TNC licenses issued, thereby incentivizing drivers who rely on TNC services full-time to obtain licenses. However, examining the social ramifications of municipal regulations constraining the issuance of TNC licenses necessitates a nuanced consideration of potential equity implications. This study underscores the positive outcome of decreased p1 deadheading emissions, aligning with the encouragement of full-time TNC drivers to acquire licenses. Nevertheless, over half of TNC drivers engage in part-time operations, potentially utilizing the platforms as a supplementary income source. Policies limiting part-time TNC drivers may harm economically vulnerable communities by creating disparities in income opportunities, particularly for those dependent on TNC income. Therefore, any regulatory measures should be carefully crafted to strike a balance between environmental goals and the socio-economic considerations of part-time TNC drivers, ensuring that the benefits of emissions reduction do not come at the expense of equitable economic opportunities.
It is important to note that the observed trends are based on data collected during a single week before the COVID-19 pandemic. These results should be replicated post-pandemic to determine their validity. Additionally, future research should concentrate on the spatio-temporal aspects of p1 deadheading events, with a particular focus on drivers who have the highest proportion of p1 events relative to p3 distance traveled. This will provide a better understanding of the conditions in which high deadheading events occur.
Electrification Potential of TNC Services
For each vehicle, p1, p2, and p3 kilometers traveled were aggregated over a full day. TNC drivers travel a mean and median total daily distance of 105 km and 92 km, respectively. Given that median daily distance traveled by household vehicles in the Greater Toronto Area is 46 km, TNC drivers travel twice as much as privately owned household vehicles ( 30 ). This comparison between TNC drivers and individual drivers is likely an underestimation, as the TNC data used in this study does not account for distance traveled by the TNC drivers to and from their service area before and after a shift, as well as personal travel. Jenn shows that ride-hailing vehicles often travel three to four times more kilometers per year compared with privately owned vehicles based on data collected from 1,000 full-time drivers in California ( 11 ).
Figure 11 presents boxplots of the daily kilometers traveled for TNC drivers segmented by full-time and part-time drivers. As mentioned earlier, full-time drivers are designated as drivers that are active for more than 4 distinct hours a day. A total of 10,411 full-time and 10,937 part-time drivers were identified on February 6, 2020. Full-time drivers travel three times as much as part-time drivers with median daily distances traveled of 149 km and 51 km respectively. A similar trend is observed for each day of the study week.
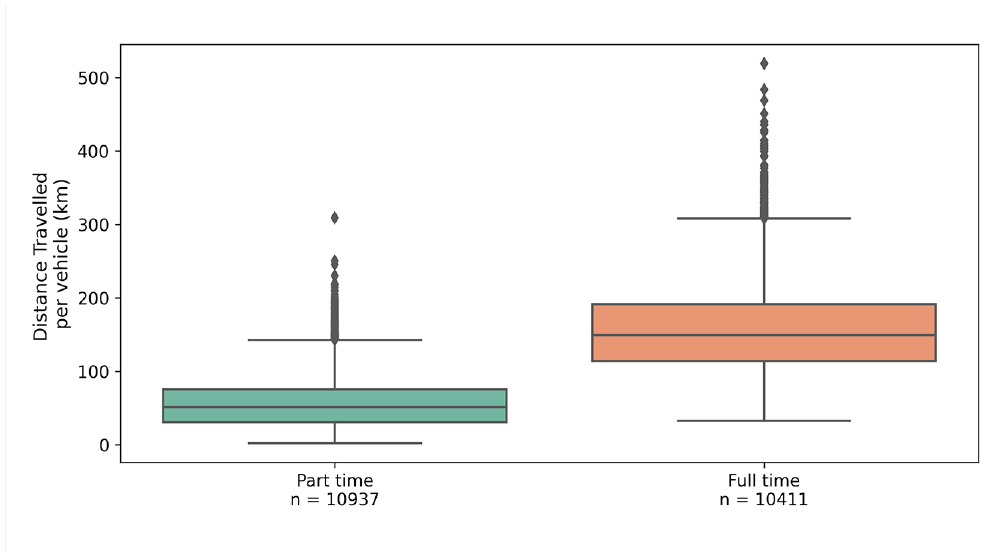
Distribution of vehicle kilometers traveled segmented by full-time and part-time drivers on February 6, 2020.
The province of Ontario, Canada, has one of the lowest carbon intensity electricity productions in the world, resulting in significant potential operational GHG emission reductions with vehicle electrification ( 31 ). Total GHG emissions of each of the 21,430 drivers active on February 6, 2020, were estimated by summing their GHG emissions associated with p1, p2, and p3 distances traveled under ICE vehicle and BEV technologies. The electrification of the fleet would result in a reduction of total daily GHG emissions associated with the TNC sector by 91%.
In the context of Toronto, vehicle electrification stands out as an effective approach for reducing GHG emissions from the TNC sector outside of encouraging TNC consumers to opt for lower emitting transportation options. Municipal regulations could play a pivotal role in mandating a gradual increase in the adoption of BEVs within the TNC sector, mirroring existing initiatives in California ( 32 ). However, numerous barriers still hinder the widespread adoption of BEVs in addition to issues related to cost and vehicle range, the development of public charging infrastructure is imperative to facilitate BEV adoption. The required number of charging stations can vary considerably based on factors such as station utilization in different geographic areas, TNC drivers’ access to home charging, the charging power of the stations, and the capacities and capabilities of vehicle batteries. Furthermore, Canada’s extreme weather conditions can significantly affect energy consumption and charging requirements ( 33 ). Future research should delve into determining the proportion of the TNC fleet that can realistically transition to BEVs, taking into account the availability of public charging infrastructure and access to home charging. This information will be instrumental in shaping effective electrification policies.
In addition to addressing the barriers related to cost, vehicle range, and charging infrastructure, any BEV adoption policy must also carefully consider the capacity of the electrical grid to handle the increased load from a growing fleet of BEVs. The potential for rolling blackouts raises concerns about income loss for TNC drivers if charging disruptions occur. Therefore, an integrated approach to electrification policies should encompass not only the promotion of BEV adoption but also a thorough assessment of the grid’s resilience, to ensure uninterrupted and reliable charging services.
Figure 12 presents the distribution of daily GHG emission reductions per vehicle using BEVs segmented by full-time and part-time drivers. Average daily GHG emission reductions with BEVs were estimated at 42 kg CO2eq and 13 kg CO2eq for full-time and part-time drivers, respectively. These findings indicate that policies targeted at full-time drivers can have a significantly higher impact on GHG emissions associated with the TNC industry, as each full-time driver that electrifies their vehicle would reduce their GHG emissions three times as much per day relative to a part-time driver that electrifies their vehicle. In fact, full-time drivers represented 74% of total TNC GHG emissions on the evaluated day. Similar results were observed for each day of the February 3–9, 2020 week.
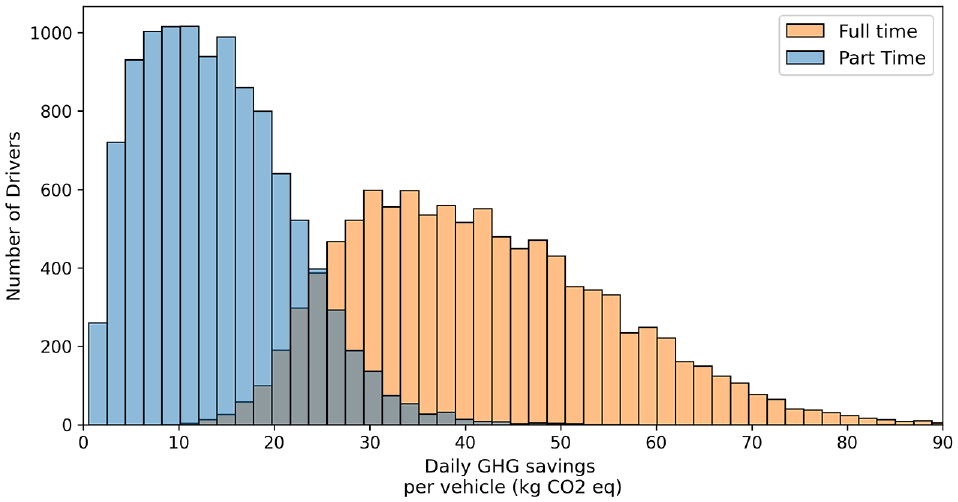
Distribution of daily greenhouse gas (GHG) emission reductions achieved with battery electric vehicles (BEVs) by segmenting drivers by work hours on February 6, 2020.
The economics of BEVs entail a higher capital cost for the purchase of a vehicle that is followed by operational savings throughout the lifetime of the vehicle ( 34 ). These operational cost savings are achieved through maintenance and fuel cost savings that result in a lower overall total cost of ownership relative to ICE vehicles after a certain number of years of operations ( 35 ). Full-time drivers drive longer distances yearly than part-time drivers, making the economics of electrification more attractive to them because of reduced maintenance and lower charging costs. However, while operational cost efficiencies make electrification financially favorable in the long run, particularly for full-time drivers covering extensive distances, caution must be exercised. There lies a potential risk of inadvertently imposing undue financial burdens on segments of the TNC driver population, especially part-time drivers who rely on TNCs as a supplemental income source and may not accrue the mileage needed for optimal cost-effectiveness. Future studies should evaluate the total cost of ownership of each technology and quantity the number of years of operation required for various TNC driver profiles to break even with BEVs relative to an ICE vehicle. These findings, in parallel with a charging infrastructure needs assessment, can be used to design TNC electrification mandates, which ensure that electrification policies are designed with careful consideration, to prevent creating environmental justice issues by disproportionately affecting those who may already face economic challenges.
Emission Intensities of all TNC Services under Different Powertrain Technologies
TNCs offer ride-pooling services that allow passengers to share their ride with other passengers for a reduced fee. Pooled trips provide an opportunity for emission reductions by reducing low-occupancy trips and indirectly playing a role in reducing vehicle ownership.
Pooled trips were identified as a TNC service that was not widely utilized by consumers before the pandemic. During the evaluated week, only 10% of total trips were pooled, and just 27% of those resulted in multiple passengers sharing a vehicle on the same route. In other words, the majority of rides identified as pooled rides were in fact single-passenger rides, and only 27% of consumers who requested a pooled trip were matched with another passenger to share the ride. There was insufficient demand for the service to effectively match rides in a way that resulted in multiple passengers sharing a trip.
Figure 13 summarizes the estimated median emission intensity in g CO2eq/passenger-km of each TNC service relative to using a private ICE household vehicle by distinguishing the contribution of emissions associated with the p1 driver waiting for a request and the portion of p2 and p3 trips. The figure compares emission intensities for pooled and non-pooled ride-hailing trips by segmenting between ICE and battery electric powertrain technologies (boxplots are represented in Figure S5 of the supplemental material). The comparison is only focused on operational GHG emissions and does not include lifecycle GHG emissions and the implications of vehicle ownership on parking requirements and congestion.
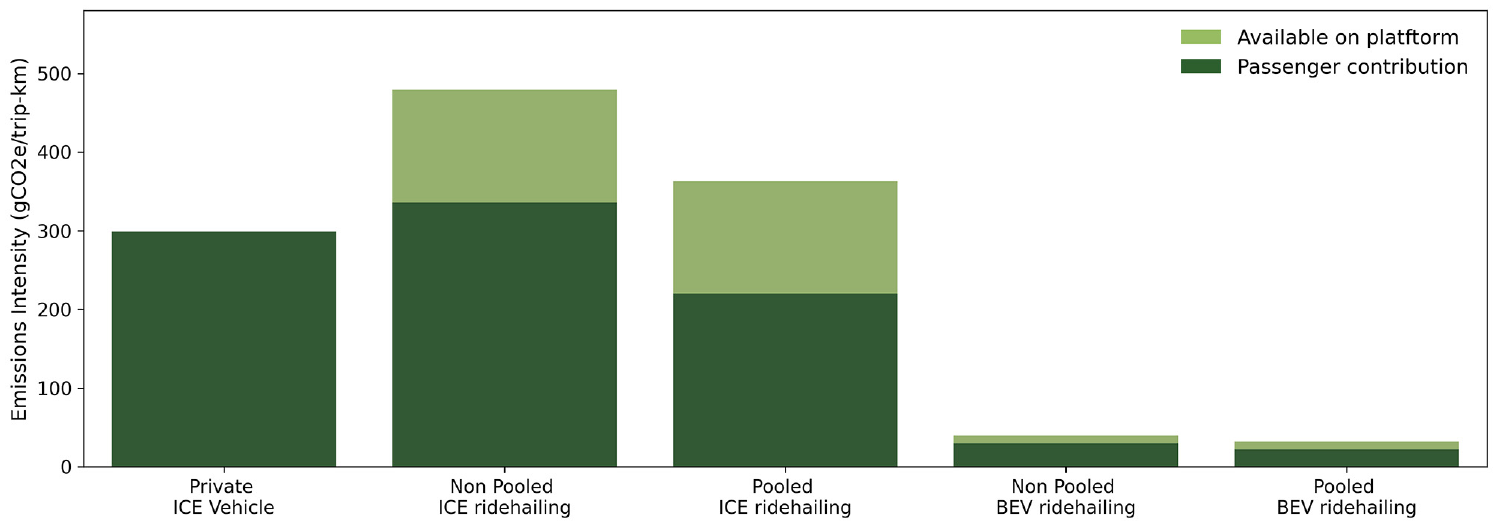
Median emission intensities of transportation network company (TNC) services including pooled and non pooled internal combustion engine (ICE) and battery electric vehicle (BEV) services relative to a private ICE vehicle.
Non-pooled ICE ride-hailing trips have a median emission intensity that is 61% higher than using a private ICE vehicle. The passenger contribution of a non-pooled trip is 13% higher than a private vehicle because of the contribution of p2 distance, which consists of the distance traveled by a TNC driver to reach a passenger after accepting a trip. The additional 48% are as result of p1 events that occur throughout a day of driving. While a non-pooled ICE TNC trip has higher operational GHG emissions than a consumer using their own private vehicle, TNC services play a role in allowing individuals who live in urban areas to remain car free and use TNC services as part of a group of transportation modes including active and public transit ( 36 ). In other words, these findings do not necessarily indicate that TNC services promote higher emissions at the scale of an urban transportation system.
Pooled ICE ride-hailing trips have an emission intensity that is also higher relative to using a private ICE vehicle but less pronounced, with an 20% increase. While the passenger contribution of pooled ICE trips is expectedly 36% lower than a private ICE vehicle as a result of the scaling of emissions by the number of passengers in a vehicle, the p1 contribution results in a higher emission intensity overall. These findings reflect the low penetration of pooled trips before the pandemic. Theoretically, a TNC driver that conducts pooled trips for a full day should be spending less time available on platform (p1) as the pooling increases the number of chained trips. However, the evaluation of p1 events from drivers did not reveal differences across drivers that do pool and those who do not pool, indicating that pooling penetration had not reached levels that would result in reduced p1 periods for drivers. These findings are in line with other studies that have demonstrated the lack of demand for pooled trips ( 37 , 38 ). Additionally, no difference in emission intensities was observed between TNC providers (supplemental material Figure S6). With the recently reintroduced pooling option in Toronto by certain TNCs, approaches to reaching higher penetration should be explored to lower the p1 contribution in the emission intensity of pooled trips relative to private ICE vehicles. One potential policy approach is to mandate an increasing proportion of trips conducted by TNCs to be pooled as a compliance measure aimed at reducing the GHG emissions of their fleet, drawing inspiration from California’s approach ( 32 ). Future research should also delve into consumer behavior and the factors influencing TNC users’ decisions to opt for pooling services.
Lastly, non-pooled and pooled BEV ride-hailing services result in significant emission intensity reductions of 87% and 90%, respectively, relative to private ICE vehicles. These findings are because of the low carbon intensity of the Ontario electricity grid. In other words, despite emissions associated with p1 events, vehicle electrification has significant potential for operational GHG emission reductions in the City of Toronto because of the very low emission intensity of the grid. The analysis centers exclusively on operational emissions, neglecting full life cycle emissions. However, the marked disparity strongly indicates that electrification emerges as the most effective strategy for reducing TNC GHG emissions in Toronto. While the analysis underscores the substantial GHG reduction achieved through electrified TNC services, it is essential to recognize that the most effective emission reduction strategy extends beyond TNCs. Encouraging individuals to transition from TNCs to public transit, especially for short-distance urban trips, provides the lowest GHG emission intensity per passenger kilometer traveled, in addition to addressing congestion-related issues. In essence, while the electrification of TNCs is a crucial step, steering individuals toward public transit usage remains the most effective approach for achieving broader environmental benefits and optimizing urban transportation sustainability.
Conclusion
This study uses detailed TNC data from February 3 to 9, 2020, to evaluate the spatial and temporal patterns of GHGs from TNC trips in Toronto. Consistent with previous research, TNC trips primarily consist of short-distance trips of less than 10 km that start and end in the central business district. Encouraging consumers to opt for active or public transportation for some of these trips is crucial for mitigating transportation GHG emissions in the City of Toronto. Future research should investigate the degree of service improvement necessary to boost the percentage of public transit trips relative to TNCs and gain a deeper comprehension of the factors influencing consumer choices to select TNCs over public transit for short-distance trips. Looking beyond the spatial and temporal trends of TNC trips, the study investigated the role of three widely promoted methods—deadheading reduction, electrification, and pooling—for reducing GHG emissions from TNCs in Toronto.
P1 periods contribute 26% of VKT and 33% of GHG emissions. Furthermore, the median emission intensity in g CO2eq/passenger-km of non-pooled ICE ride-hailing trips is compared with using a private household vehicle. P1 events of drivers increase the emission intensity of a non-pooled ride relative to consumer driving their own vehicle by 61%, because of the deadheading distance traveled by the drivers en route to pick up a passenger (p2) and the distance traveled while not servicing trips (p1). Moreover, part-time drivers (that are active for less than 4 h a day) exhibit a higher proportion of GHG emissions associated with p1 periods relative to p3 VKT than full-time drivers, with the reasons for this difference still unclear. Future work should explore the observed trends across a longer period than the week evaluated in this study and expand on the understanding of high p1 deadheading events with driver consultations. A better understanding of the context in which high-emitting deadheading events occur could help target policy that minimize the behavior.
Vehicle electrification provides significant GHG savings in Toronto because of the low emission intensity of the local grid. The median emission intensity of a BEV non-pooled ride-hailing trip in CO2eq/passenger-km is 87% lower than having a consumer drive their own vehicle, despite the contribution of p1 periods and p2 distances to TNC trips. Additionally, the electrification of the TNC fleet would result in significantly higher daily GHG emission reductions per vehicle than an average vehicle owner, as the median daily distance traveled of a TNC driver is twice as large as a household vehicle in Toronto. A comparison between full-time and part-time drivers further shows that full-time drivers reduce their GHG emissions three times more than part-time drivers, and electrification would have the highest impact with high-mileage TNC drivers. Future studies should assess the total cost of ownership for each technology and determine the number of years of operation required for different TNC driver profiles to reach a break-even point with BEVs compared with ICE vehicles. Additionally, research should investigate the public charging infrastructure requirements for TNCs. These findings can then inform the development of municipal regulations aimed at gradually increasing BEV adoption within the TNC sector.
Pooled trips represent a TNC service that was not significantly used by consumers before the pandemic. Only 10% of total trips in the evaluated week are pooled trips, and, of those, only 27% resulted in more than one passenger on-board. To assess the GHG emissions of these trips, the median emission intensity of pooled ICE rides in CO2eq/passenger-km was calculated and compared with the emission intensity of driving one’s own vehicle. The median emission intensity for a pooled ICE ride-hailing trip is 20% higher than that of driving one’s own car. While the portion of the GHG emission intensity associated with passengers is lower than using a private vehicle, because of the higher number of passengers in the vehicle, the contribution of p1 events results in a higher overall GHG intensity. This is because the demand for pooled trips is not high enough for drivers to have fewer p1 periods from chained trips over a full day of work relative to drivers that do not conduct pooled trips. Pooling is still crucial in mitigating TNC GHG emissions, particularly for long-distance commuting trips of consumers. To promote the use of pooling services, future research should focus on identifying effective incentives and targeting the most suitable types of pooled trips based on consumer travel patterns.
Because of data availability and privacy concerns, our data analysis focused on a single week before the COVID-19 pandemic. Despite the constraints of limited data, our analysis delves into unprecedented driver-level trends, unveiling novel insights into the TNC sector. It identifies key trends associated with each approach employed to reduce GHG emissions in the TNC sector. Nevertheless, it is essential to replicate this analysis using post-pandemic data to assess the potential impact of the pandemic and account for seasonal variations in demand. Moreover, the TNC sector comprises a dynamic fleet that responds to supply and demand dynamics. Promoting approaches to reduce GHG emissions, such as electrification, can indirectly affect the number of full-time and part-time drivers, thus influencing deadheading rates. Future research should also explore modeling approaches that simulate the interaction between supply and demand in addition to the empirical methods employed in this study.
Supplemental Material
sj-docx-1-trr-10.1177_03611981241236480 – Supplemental material for Greenhouse Gas Emissions and Potential for Electrifying Transportation Network Companies in Toronto
Supplemental material, sj-docx-1-trr-10.1177_03611981241236480 for Greenhouse Gas Emissions and Potential for Electrifying Transportation Network Companies in Toronto by Marc Saleh, Shoma Yamanouchi and Marianne Hatzopoulou in Transportation Research Record
Footnotes
Author Contributions
The authors confirm contribution to the paper as follows: study conception and design: Saleh. M, Hatzopoulou. M; data collection: Saleh. M, Yamanouchi. S; analysis and interpretation of results: Saleh. M, Hatzopoulou. M; draft manuscript preparation: Saleh. M, Hatzopoulou. M. All authors reviewed the results and approved the final version of the manuscript.
Declaration of Conflicting Interests
The author(s) declared no potential conflicts of interest with respect to the research, authorship, and/or publication of this article.
Funding
The author(s) disclosed receipt of the following financial support for the research, authorship, and/or publication of this article: This study was funded by the City of Toronto, under a research contract awarded to Prof. Marianne Hatzopoulou in 2022–2023.
Supplemental Material
Supplemental material for this article is available online.
References
Supplementary Material
Please find the following supplemental material available below.
For Open Access articles published under a Creative Commons License, all supplemental material carries the same license as the article it is associated with.
For non-Open Access articles published, all supplemental material carries a non-exclusive license, and permission requests for re-use of supplemental material or any part of supplemental material shall be sent directly to the copyright owner as specified in the copyright notice associated with the article.