
Abstract
Multi-modal public transport (PT) networks within metropolitan areas are often characterized by complexity resulting mainly from their infrastructure, design, operations, and demand. This complexity leads to a significant amount of effort on behalf of the transit agencies to properly evaluate their performance at certain locations and proceed with improvements. This study proposes a methodology based on clustering techniques that facilitates the evaluation of PT networks. The evaluation framework refers to the comparison between the levels of supply and demand at a certain stop. Service supply is quantified through an existing connectivity index, whereas demand is considered through the number of transfers that are performed at each stop. Transfers are critical within multi-modal mobility and often serve as a hindrance for choosing PT. The case study here is the Helsinki PT network in Finland. General Transit Feed Specification (GTFS) data are used for quantifying connectivity and a dataset deriving from smartphone ticketing application for quantifying transfers. Results include the evaluation for each PT mode and for the overall multi-modal PT network. Focusing on the evaluation of the overall multi-modal PT network, connectivity and transfers levels for 75.60% of stops are found to be well aligned. Therefore, these stops could be eliminated from the list of candidate stops for performing improvements. Of the remaining stops, 19.73% belongs to the case of higher connectivity than transfers and 4.67% to the case of lower connectivity than transfers. Stops included in these two cases require further attention and prioritization during planning processes.
Keywords
There is a vital need for efficient public transport (PT) networks to ensure well-functioning and sustainable cities. Decision-making associated with planning PT systems and services can be very complex, especially in large multi-modal networks where both the set of candidate actions and locations for improving the offered services can be very long. Therefore, the development of tools and methods to evaluate existing PT systems and proceed with planning decisions to improve them accordingly is of high importance, considering also the high costs of constructing new PT systems ( 1 ) and the efforts required for planning infrastructure investments ( 2 ). According to literature, most studies evaluate PT based on supply or demand, but it is important to account for both ( 3 ). In addition, many of the studies in the field focus on one travel mode, as for example buses (3–6), which highlights the need for more multi-modal approaches.
Multi-modal environments are considered in Carroll and Yamamoto ( 7 ), where the authors highlight the need for balance between system performance and user perspective. The importance of multi-modal approaches in transport evaluation is discussed in Litman ( 8 ). In addition to supporting the role of accessibility in the list of conventional factors commonly used for transport evaluation, the authors also emphasize on the need for recognizing the diversity of travel demands and modes to achieve more comprehensive evaluations. Both supply- and demand-related factors as part of multi-modal evaluations are also considered in Rodríguez González et al. ( 9 ). Supply is considered through generating space–time characterization of the PT system’s operation. Demand is studied through origin–destination matrices that demonstrate mobility patterns. An evaluation of multi-modal trips was performed in Kumar et al. ( 10 ), by considering supply-related performance measures (e.g., level of service) and quantifying user experience (e.g., access/egress time) through surveys.
Considering supply, there are several indicators used for evaluating PT performance, among which is the usage of network connectivity measures (11–13). Park and Kang ( 14 ) identified the need for a connectivity index that accounts for the PT network’s operational characteristics and thus introduced the transit connectivity index. This index has been further extended and utilized in various studies ( 15 – 17 ). Mishra et al. ( 15 ) emphasized on the role of such an index in prioritizing PT stops for funding and other planning activities in multi-modal networks, among other applications.
Planning activities should account for how people use complex PT networks, as for example, with reference to demand, accessibility, and trip planning ( 18 ). Therefore, understanding the network usage should be part of the methods and tools that are implemented for evaluation purposes. One of the most critical parts of a PT network’s usage refers to where travelers perform transfers. Transfers are in the core of multi-modality and one of the greatest challenges to achieve seamless PT mobility ( 19 , 20 ). According to De Witte et al. ( 21 ), transfers are often associated with great disutility when it comes to mode choice and thus might be a hindrance for choosing PT instead of competing alternatives (e.g., private cars). Therefore, stations serving as transfer points play a major role in PT networks with various studies emphasizing the need for more attention to be given to them ( 22 ).
The quantification of a PT network’s performance as regards supply and demand can be achieved through a variety of available data sources in the field of PT, such as automatic vehicle location (AVL), automatic passenger counts (APC), and smart card data. A widely available data source concerning PT operational characteristics is the General Transit Feed Specification or GTFS data ( 18 , 23 ). As a source for schedule information, it is usually released by PT authorities for users to plan their routes accordingly. Tracking PT users’ trajectories within large multi-modal networks is a complex process and requires the combination of different traditional data sources under several assumptions. Moreover, such sources offer information that is not detailed enough to properly detect transfer activities ( 24 ). Emerging data sources in the field refer to wireless communication technologies ( 25 ) and Bluetooth beacons which have been applied in PT systems in recent years ( 26 ). The potential role of mobile phones in improving mobility has been investigated in literature ( 27 ). Rinne et al. ( 28 ) proposed an automatic method to recognize PT trajectories based on activity information and sensor measurements sensed by mobile phone systems, which provides a new opportunity to sense PT data.
One of the challenges associated with large datasets refers to the need for advanced processing to derive useful results for practice. Machine learning techniques are widely used for analyzing large datasets and producing results and insights of practical interest. Clustering techniques are common machine learning approaches that are used for a variety of PT applications (29–31). Among them, the hierarchical clustering technique consists of defining clusters of observations progressively and is often used for classification purposes in PT studies (e.g., in He et al. [ 32 ]).
Acknowledging the above, this study develops a methodology to evaluate multi-modal PT systems at the stop level. This methodology aims at assisting planning processes for PT improvement. Clustering techniques are implemented for ordering stops based on their supply and demand levels. Supply and demand clusters are compared according to the proposed methodology to identify the stops that require further attention, thus reducing the number of stops that planners should investigate during their efforts for increasing PT performance. Supply is quantified through the indicator of PT connectivity ( 14 – 16 ) and GTFS data are utilized to obtain the required information. Demand is studied with a focus on the critical case of transfer activities, and data derived from mobile phone applications are used ( 33 ). The case study refers to the PT network of Helsinki (Finland), operated by the Helsinki Regional Transport Authority (“Helsingin Seudun Liikenne” or “HSL”), which also owns the utilized demand dataset called “TravelSense”.
Methodology
This study aims at utilizing traditional and emerging data sources for the quantification of supply and demand to evaluate the performance of a multi-modal PT network that accounts for both. Supply is quantified here through an established metric of transit connectivity. Demand is studied here concerning performed transfers per stop. Clustering techniques are used for evaluating the PT performance. The steps of the proposed methodology are described in detail as follows.
Quantification of Connectivity
The connectivity index considered here was first presented in Park and Kang (
14
) and later extended and utilized in other studies (
15
–
17
). The goal was to identify a connectivity index that reflects not only the nodes and links within a PT network, but also allows the reflection of its operational characteristics. This connectivity index focuses on a stop

where

The inbound


where
Quantification of Demand
Demand in this study refers to the number of transfers that are performed at a certain PT stop. Transfers are a critical part of multi-modal PT trips that are usually challenging to quantify through conventional data sources. As transfers, in this study we consider the number of travelers within the network that boarded a PT vehicle at a certain stop shortly after they alighted another PT vehicle, either at the same or a different PT stop. If two stops are involved in the transfer activity, then both are attributed the transfer activity when counting the number of transfers per stop. The time interval between alighting a PT vehicle and boarding a new PT vehicle that determines whether this activity is a transfer or not, is set according to network and data-specific conditions. These conditions are described in the following section in which the case study and utilized data are described.
Clustering Method
The clustering approach implemented in this study is the hierarchical agglomerative clustering (HAC) technique, which is used in several PT applications (e.g., in Cats et al. [29]). The analysis starts by considering that each point within the dataset is an individual cluster (i.e., it is a bottom-up approach) and a similarity (or distance) matrix is calculated. An iterative process of clustering the two closest data points and updating the similarity matrix is implemented until there is only one cluster left. The similarity between two clusters can be compared with different linkage methods. In ( 34 ) a comparison of different methods is performed and Ward’s method ( 35 ) seems to be the one performing best in most situations examined. Therefore, this method is adopted in this study. There are several ways of determining the optimal number of clusters. The method used here is to consider the silhouette score (SS) presented in Rousseeuw ( 36 ). It is a commonly used validation metric of the consistency of data within a cluster. The score values range from −1 to 1, with score 1 indicating high similarity of points within a cluster and high difference with points outside the cluster.
The PT stops per mode are first clustered according to their connectivity index considering a meaningful maximum number of clusters that will support the explainability of results (e.g., from two to ten). For each clustering, the SS is recorded. Similarly, the PT stops are then clustered according to the transfers that are performed at them, and the respective SSs per clustering are recorded. The number of clusters,
Evaluation Framework
For each mode,


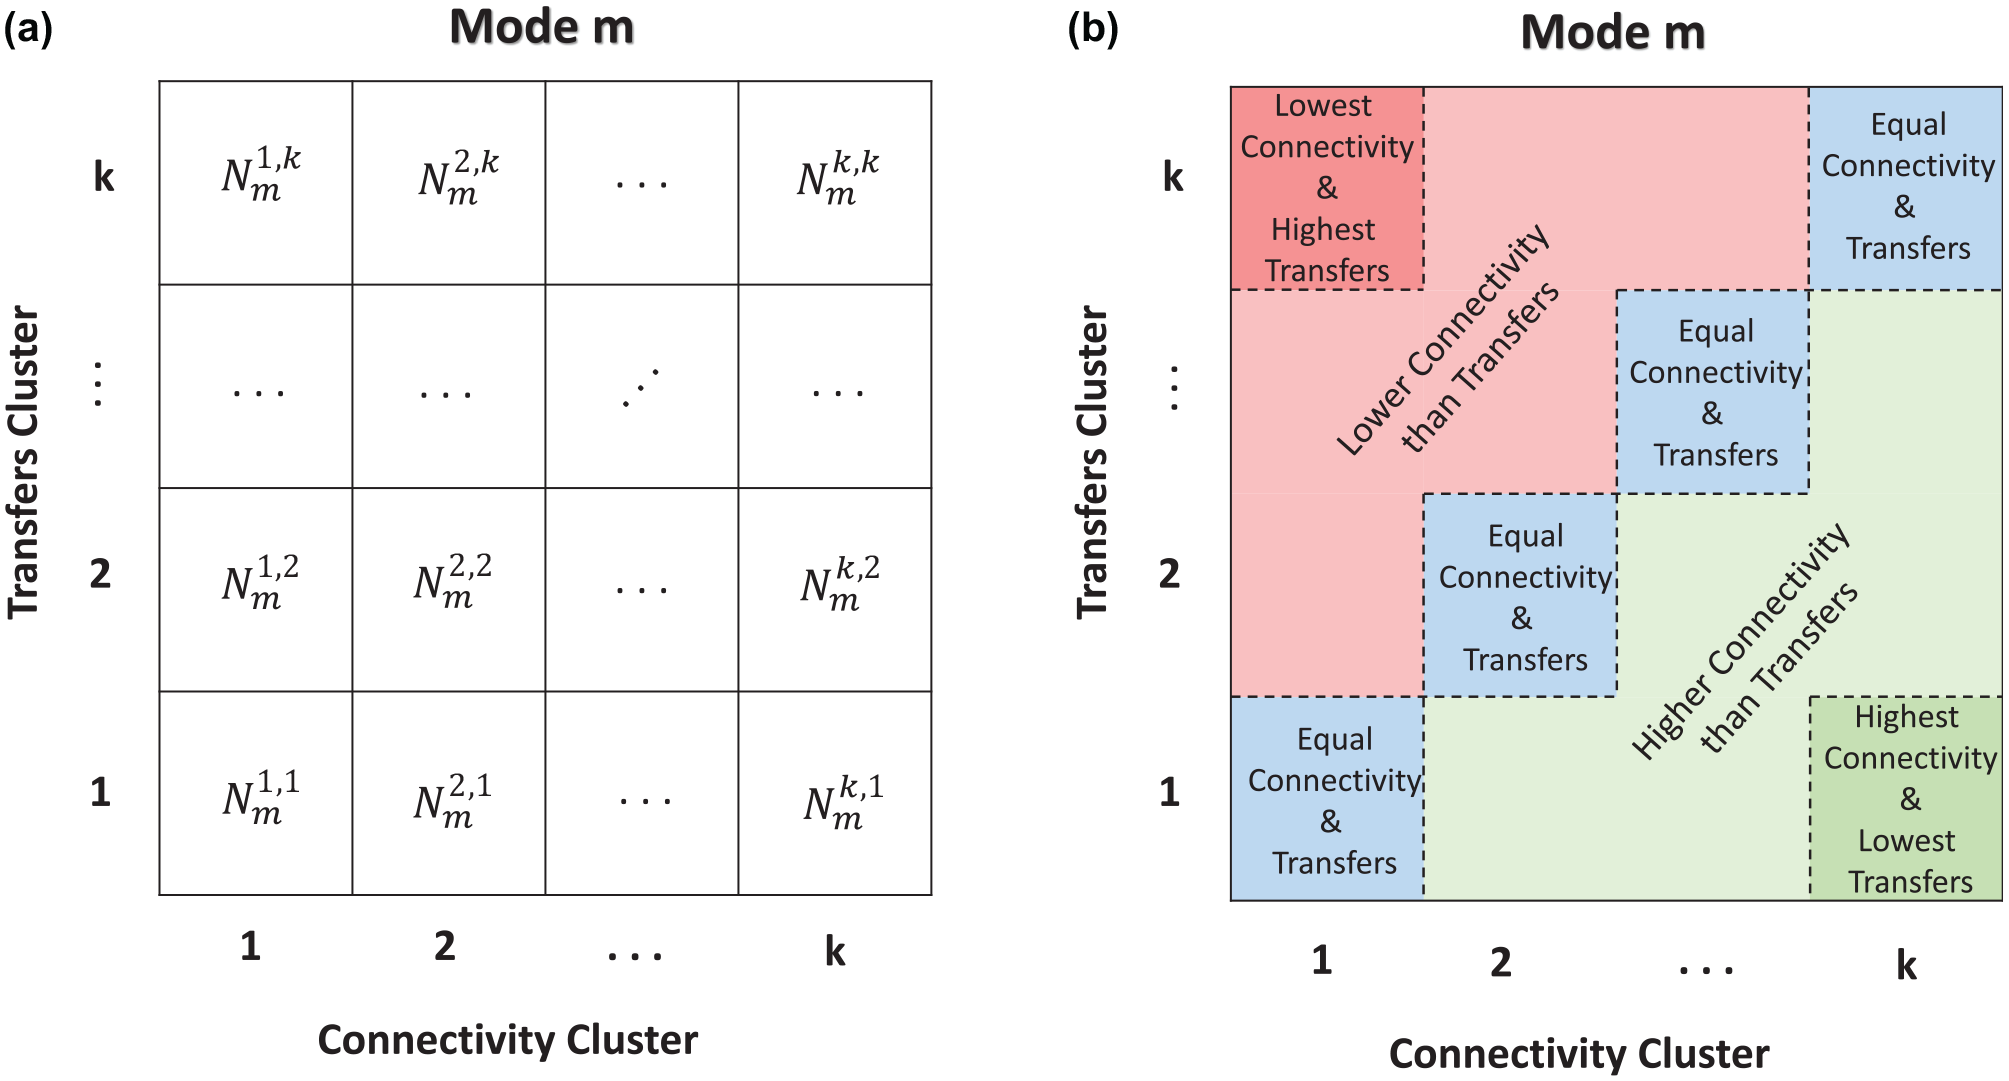
Sample of matching matrix (a) with number of stops per cell and (b) with evaluation of areas. (Color online only).
The cells in Figure 1 that are above the diagonal (also illustrated in red shade color) include the numbers of stops for which the connectivity is in lower cluster than the transfers. These stops require further attention from PT authorities, to ensure that the PT user experience is efficient. The percentage of stops that belong to the case of lower connectivity/higher transfers for a mode,
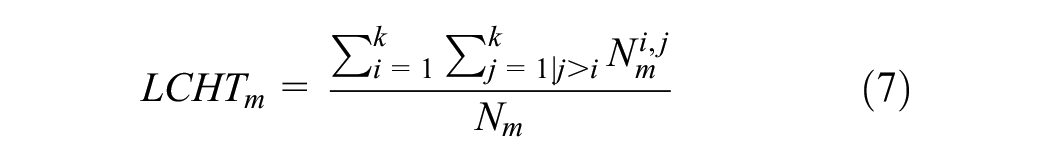

In general, the closer the cells to the diagonal, the better the performance of the included stops relating to alignment between connectivity and transfers. Among the cells that are above the diagonal, the cell with


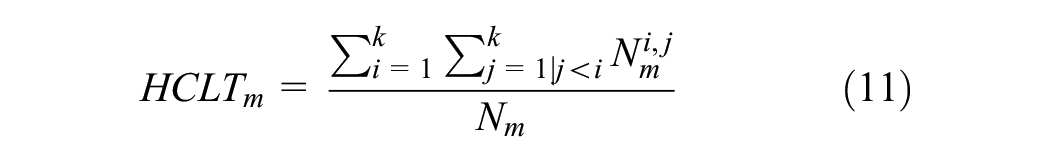
In addition to the stops above the diagonal, the stops included in cells below the diagonal (illustrated with green shade color in Figure 1) also indicate cases in which the connectivity and the transfers are not perfectly aligned. In this case, the stops are included in a higher cluster of connectivity compared with the cluster of transfers. Therefore, PT operators should investigate whether they should decrease their efforts to decrease their operational costs. For example, the cost savings could be re-allocated to the stops above the diagonal. In any case, the operators should also take into account the marginal effects of such decisions on the PT users experience. Every action within the network might affect the overall structure of the matching matrix and iterative process of re-structuring it after every intervention might be needed. It is noted that the ideal scenario that results from this method is a matching matrix in which all stops belong to the diagonal. The percentage of stops that belong to the case of higher connectivity/lower transfers for a mode,

The percentage of stops that belong to the extreme cell of the highest cluster of connectivity and the lowest cluster of transfers (highlighted with darker green color in Figure 1) for a mode,


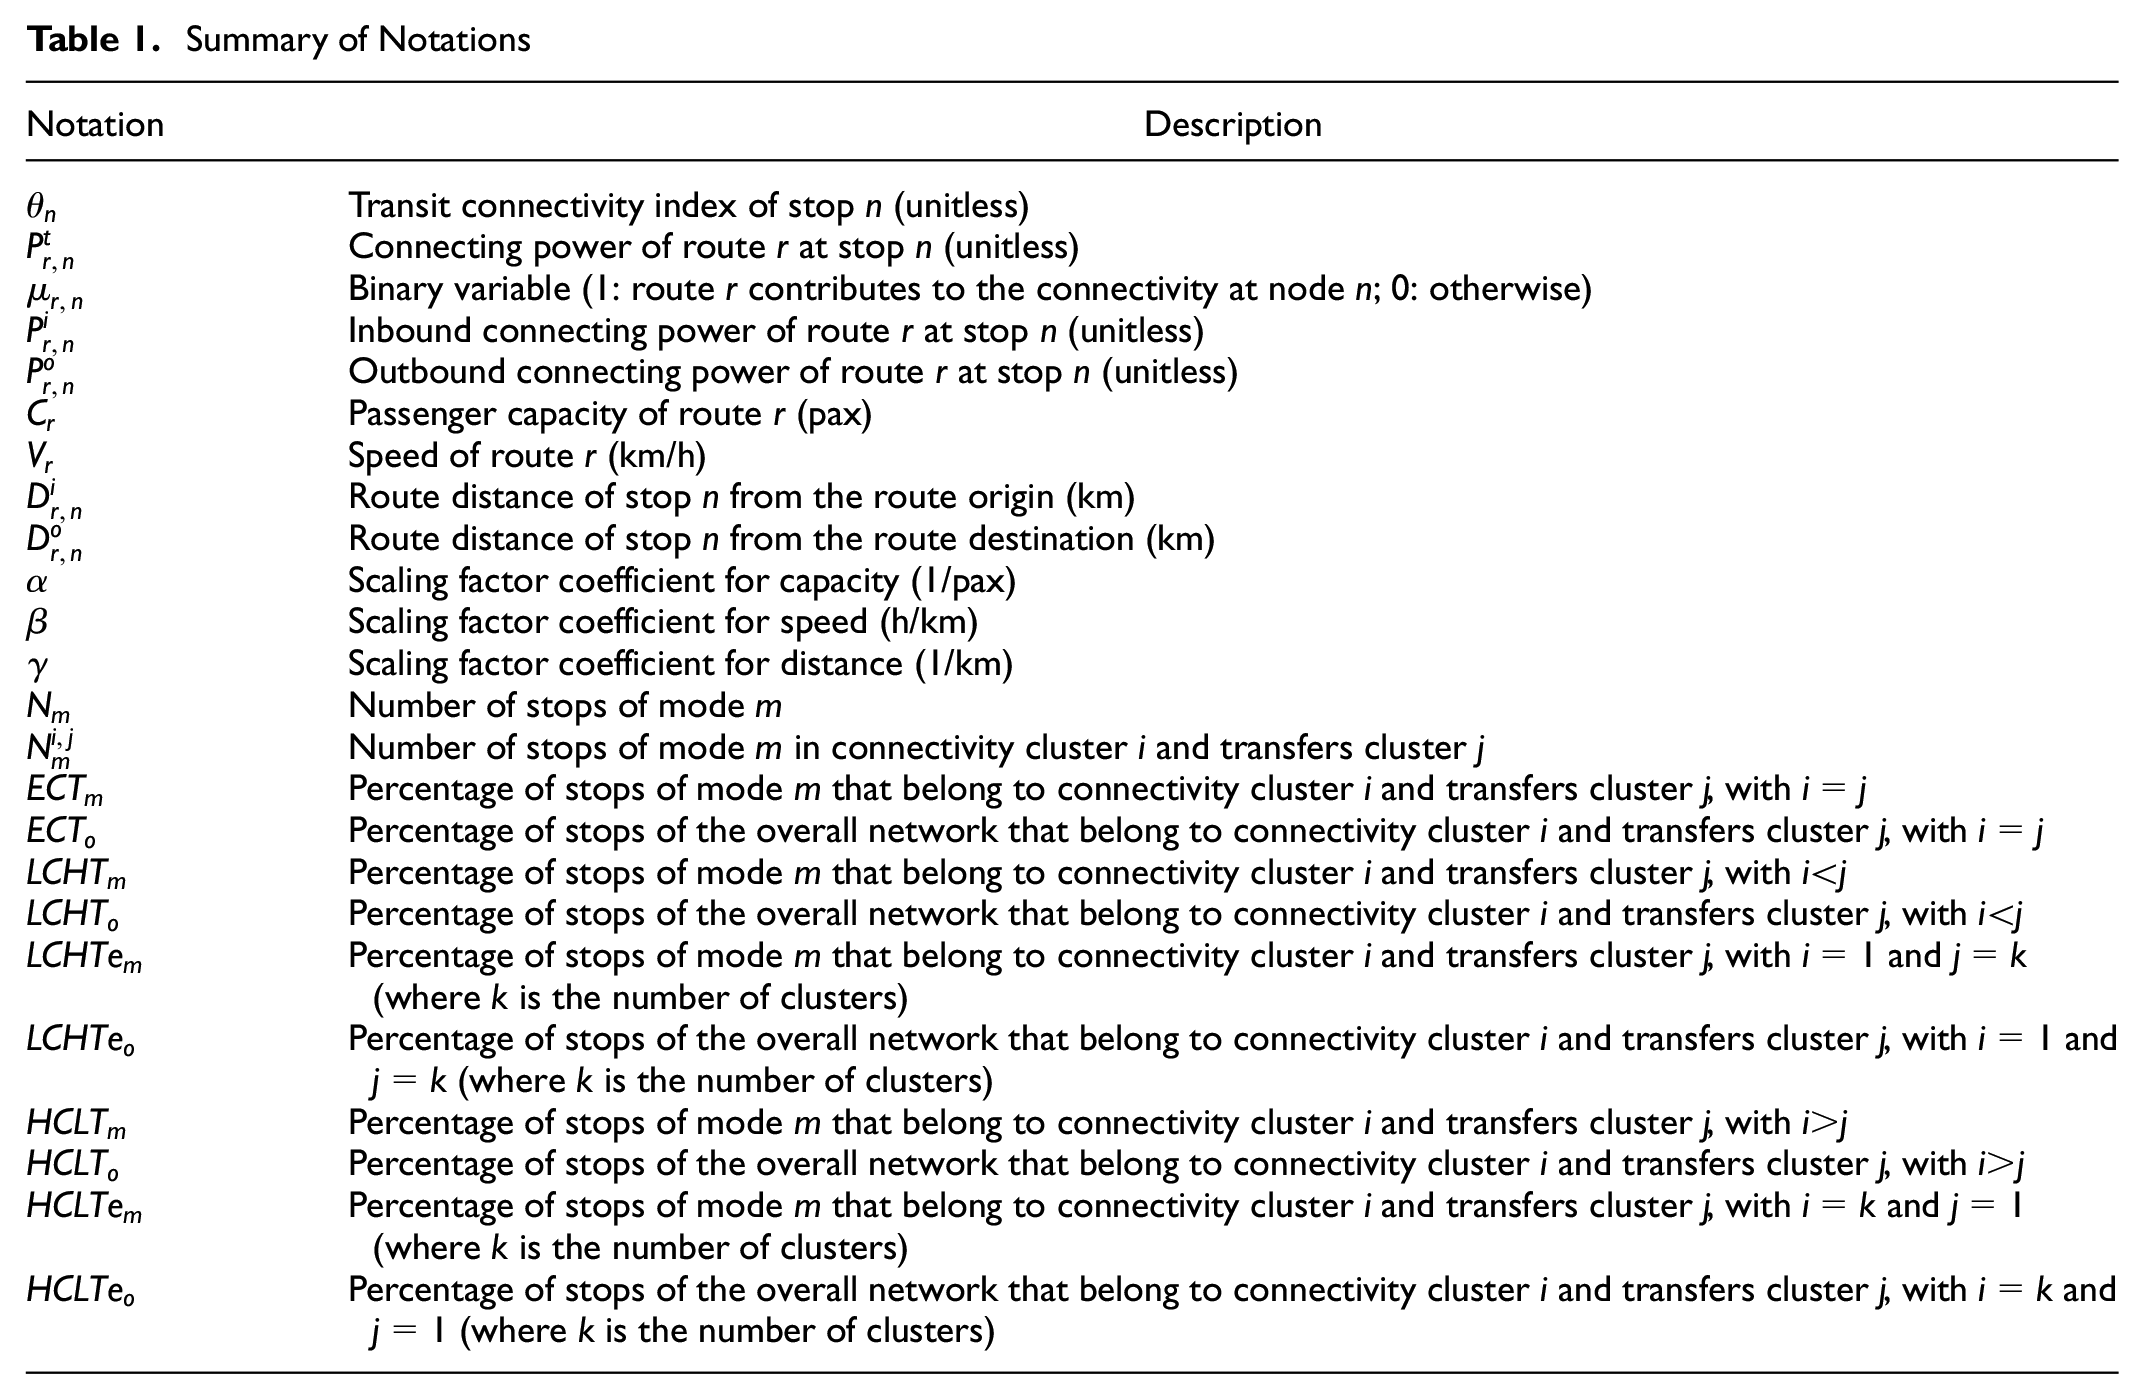
A summary of notations used in this section is given in Table 1, with notations listed in the order of appearance in the paper. The overall proposed methodology for each mode’s evaluation is summarized in Figure 2. As presented above, the current study focuses on evaluating each mode separately but the proposed method also allows deriving conclusions for the overall multi-modal network performance. The evaluation consists of determining percentages of stops that belong to each one of the cases presented above (i.e., diagonal, above diagonal, below diagonal, and extreme). Such metrics can offer insights to guide decision-makers through implementing changes in the network. The proposed method also allows us to identify the specific stops that require further attention and therefore reduce the efforts of decision-makers when it comes to choosing where (either stop or mode level) to implement improvements.
Summary of Notations
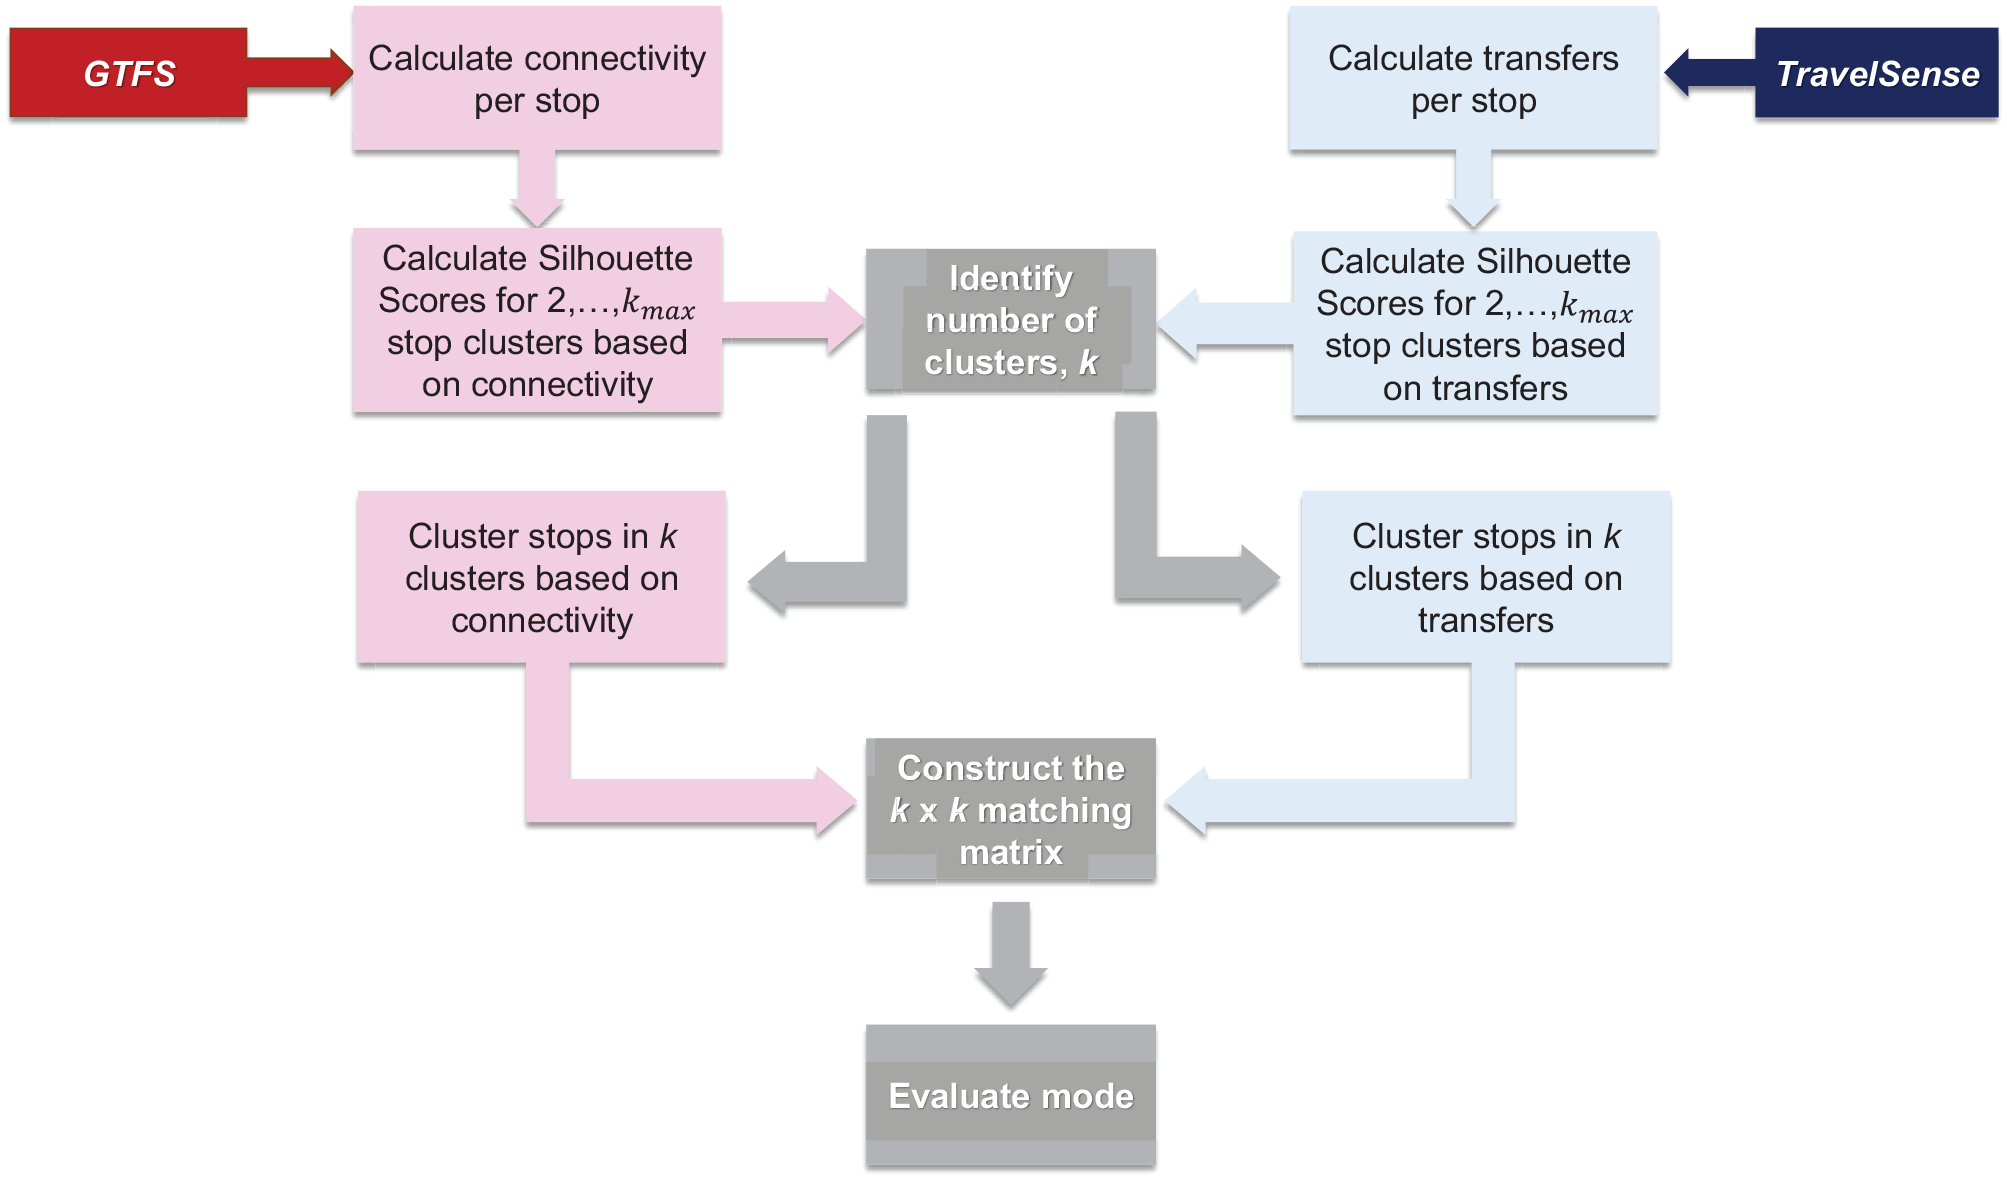
Flow chart of proposed methodology.
Study Area and Data
Helsinki is a metropolitan area that covers
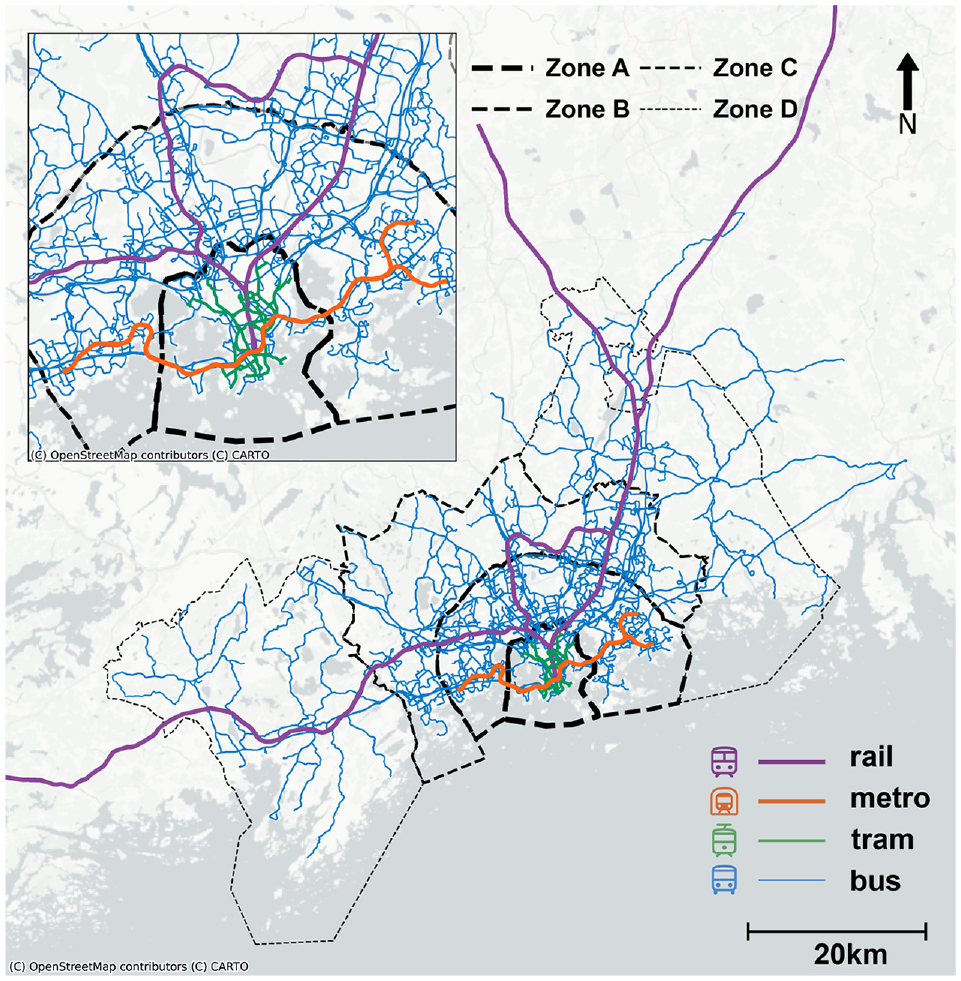
Map of the Helsinki public transport (PT) network.
GTFS Data
GTFS is a data specification that allows PT operators to publish data that could be further used for different applications. The GTFS dataset is divided into scheduled component (e.g., schedule and fare information) and real-time component (e.g., arrival predictions and vehicle locations). The focus of this study is on static PT information, with the respective files including information about stops, routes, trips, and fares, among others. The goal of this study is to utilize GTFS data to derive at a stop level:
number of stops: readily available
location of stops: readily available
routes per stop: readily available.
At a route level, the required information obtained from GTFS data refers to:
number of routes: readily available
number of daily trips per route: readily available
shape distances (km) between stops per route: readily available
duration (h) per route: calculated as the difference between the timestamps of vehicle’s dispatch at origin stop and vehicle’s arrival at the terminal stop
length (km) per route: calculated as the sum of shape distances (km) between stop locations within the route
speed (km/h) per route: calculated as the route length (km) over route duration (h)
type of mode per route: readily available.
An additional piece of information needed in this study is the vehicle capacity (pax/veh) per mode, which can be easily identified though the operators’ websites, among other sources (e.g., reports). The required processing for obtaining the above information from GTFS data is fairly fast and straightforward, since most of it is already recorded in the dataset while the rest can be easily calculated.
TravelSense Data
HSL provides PT users with a mobile application which allows them to buy tickets (i.e., single ticket, day ticket and season ticket), as well as to find the best route for their trip and receive information about the PT operation (e.g., timetables, delays). HSL has incorporated in this application the option to record trip trajectories for users who consent and thus detect whether the user is still, walking, cycling, or on board a vehicle, either PT or private. Exact coordinates of locations outside the PT network are not recorded, but are resolved up to grid cells of dimension
The information included in the TravelSense dataset is structured based on “legs” and “trip chains.” A “leg” is a discrete stage within a journey recognized by the data collection system and the pre-processing. The reasons for such recognition could be a pause in the movement or a change in recognized activity. A “trip chain” is a series of legs that have been recognized by the pre-processing as being part of a single journey. A trip chain is ended when the system detects prolonged periods in the same location and no changes in activity. The raw information included in the TravelSense dataset for PT journeys includes:
start and end timestamps of legs
start and end PT stop IDs and coordinates for each leg
PT mode used at each leg
PT route used including direction for each leg.
For journeys outside the PT network, the raw information includes:
start and end timestamps of legs rounded to nearest quarter-hour for privacy purposes
grid cells associated to each leg
type of movement including walking, cycling, or vehicle.
Unlike commonly used data sources for identifying mobility patterns (e.g., smartcard data), the TravelSense dataset offers enough details to illustrate the full trajectory of a door-to-door journey (Figure 4). A full trajectory allows us to detect and quantify transfers at a PT stop level. For example, in Figure 4 the PT user boards the bus (blue vehicle) and after alighting walks to access the respective PT stop to board the metro (orange vehicle). In this study, the analysis considers both parts of a transfer activity. More specifically, the term “transfers alighting” at a PT stop refers to the number of PT users that alight at a certain PT stop to board another PT vehicle, either at the same or at another PT stop of the same or different mode. The term “transfers boarding” refers to the number of PT users that board a PT vehicle after alighting another PT vehicle either at the same or at another PT stop of the same or different mode. The detection of transfers is constrained within an amount of time equal to 80 min, which is the validity time for a ticket. Therefore, if a PT user alights a vehicle and does not board another one within 80 min, then it is assumed that there is no transfer activity. For example, it could be shopping time.
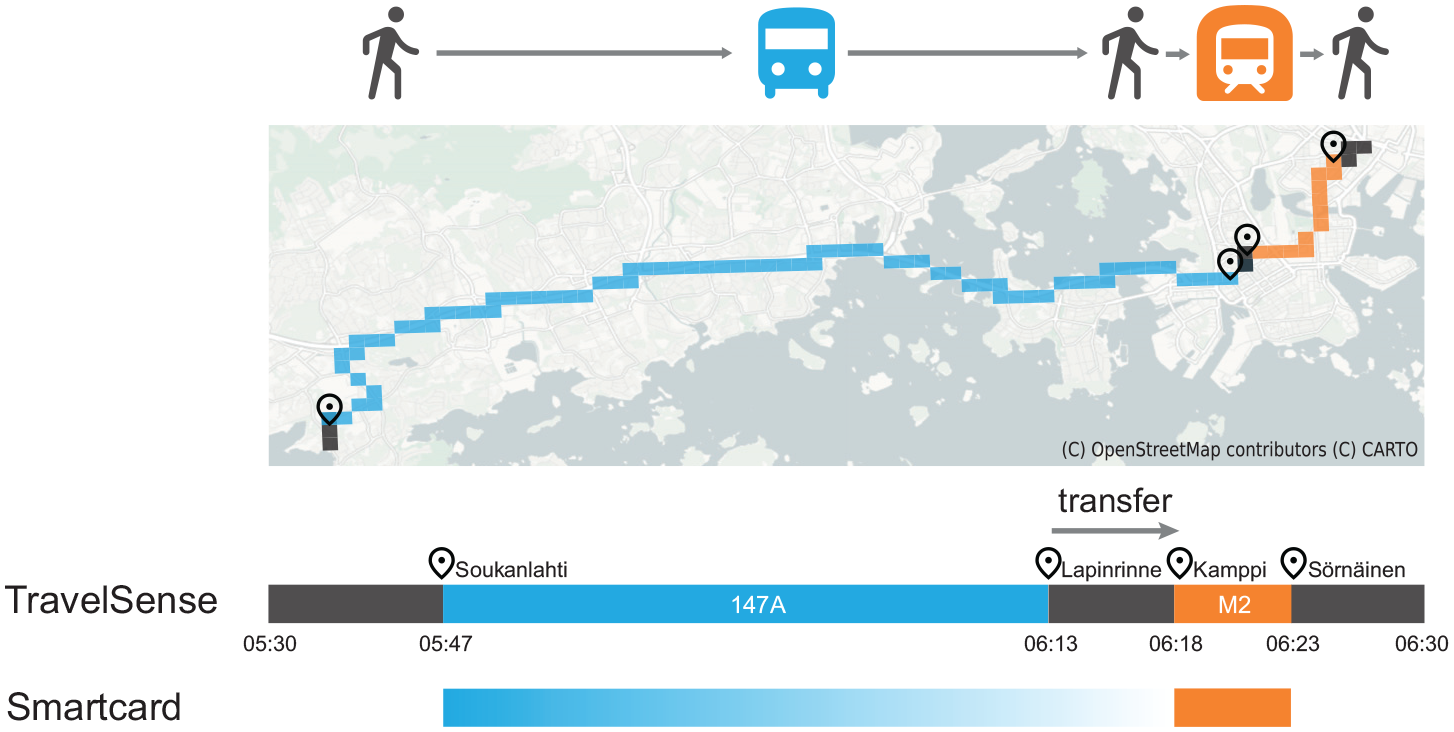
Example of a trajectory derived from TravelSense data and comparison with other data sources. (Color online only).
The TravelSense dataset depends on a complex system of data collection and requires a careful pre-processing for deriving the required outputs directly from the raw data. Details about the infrastructure required for obtaining the data included in TravelSense, the necessary assumptions required for cleaning the raw data and the process for deriving the needed transfer related results are described in Huang et al. ( 33 ).
Results
GTFS and TravelSense data are obtained, processed, and analyzed to evaluate each PT mode that operates within the multi-modal PT network of Helsinki, following the methodology proposed in this study. The results from each step are presented as follows.
Data Analysis
GTFS Data Analysis
GTFS data were analyzed to derive the components of stop connectivity index: passenger capacity (pax), speed per route (km/h), and length of route (km). The analysis here considers the operation of regular weekdays of April 2022 and identifies the stops and routes that operated during regular weekdays as well as the details of their operation. The analysis here considers the 7,852 stops that belong to the HSL area (i.e., zones A, B, C, and D) and are common among all weekdays. The identified number of routes is 513 for a regular Friday and 509 for the other weekdays.
The four main PT modes that operate in Helsinki are bus, tram, metro, and rail services. There are also four ferry stops, which are not considered here. Bus stops are dominating the modal split with 94.56% of stops being bus stops, 3.27% tram stops, 1.53% rail stops, and 0.64% metro stops. Considering vehicle capacity (pax/veh), the average values used in this study are 97, 180, 600, 700, for bus, tram, rail, metro, respectively, utilizing values from HSL’s official website ( 37 ). Bus mode includes different types of services, such as express, regular, regional, and so forth. With reference to stops per zone, 12.29% of stops belong to zone A, 38.20% to zone B, 26.62% to zone C, and 22.80% to zone D.
The connectivity index was calculated for each stop and each day, and then an average daily connectivity per stop was derived to perform a comparison between the average connectivity per stop and the transfers that were performed at these stops in overall during the 22 weekdays of April 2022, as explained in the following section. For the purposes of this study, the parameters
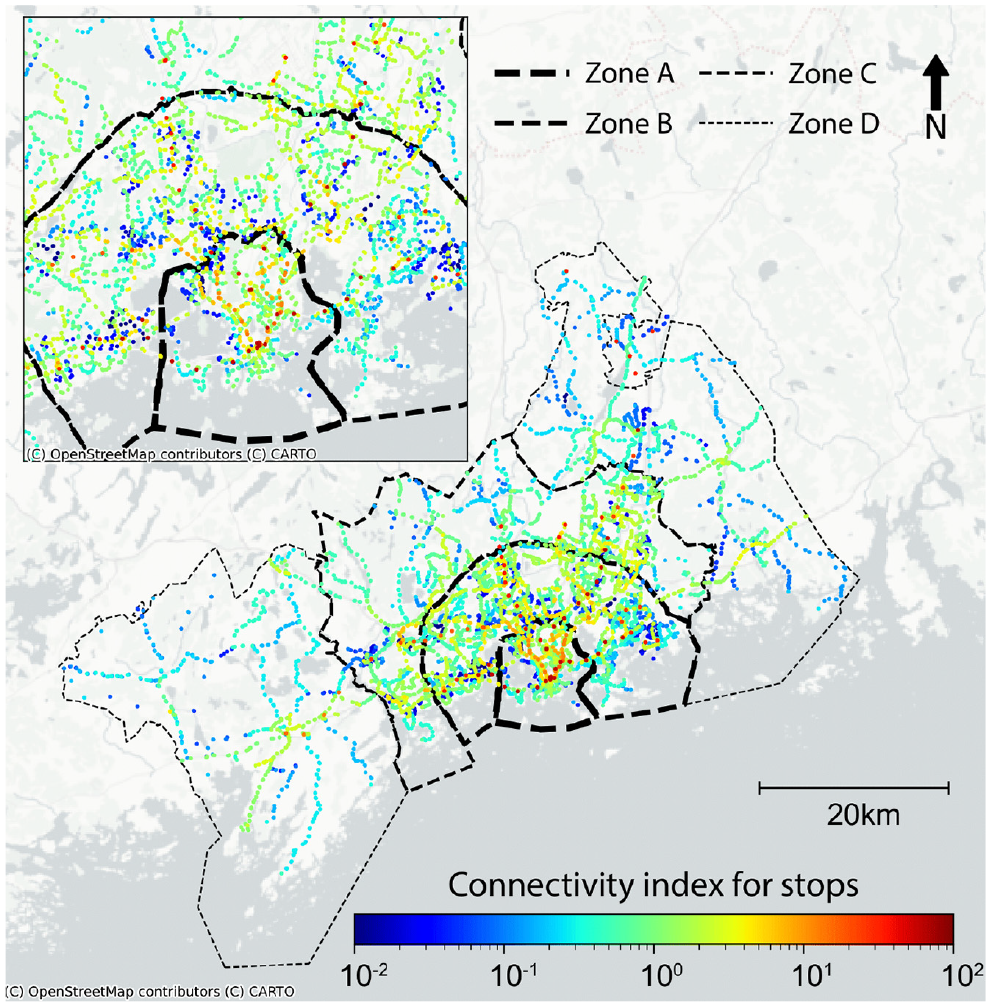
Map of under study area with locations of public transport (PT) stops and colorbar indicating their connectivity index.
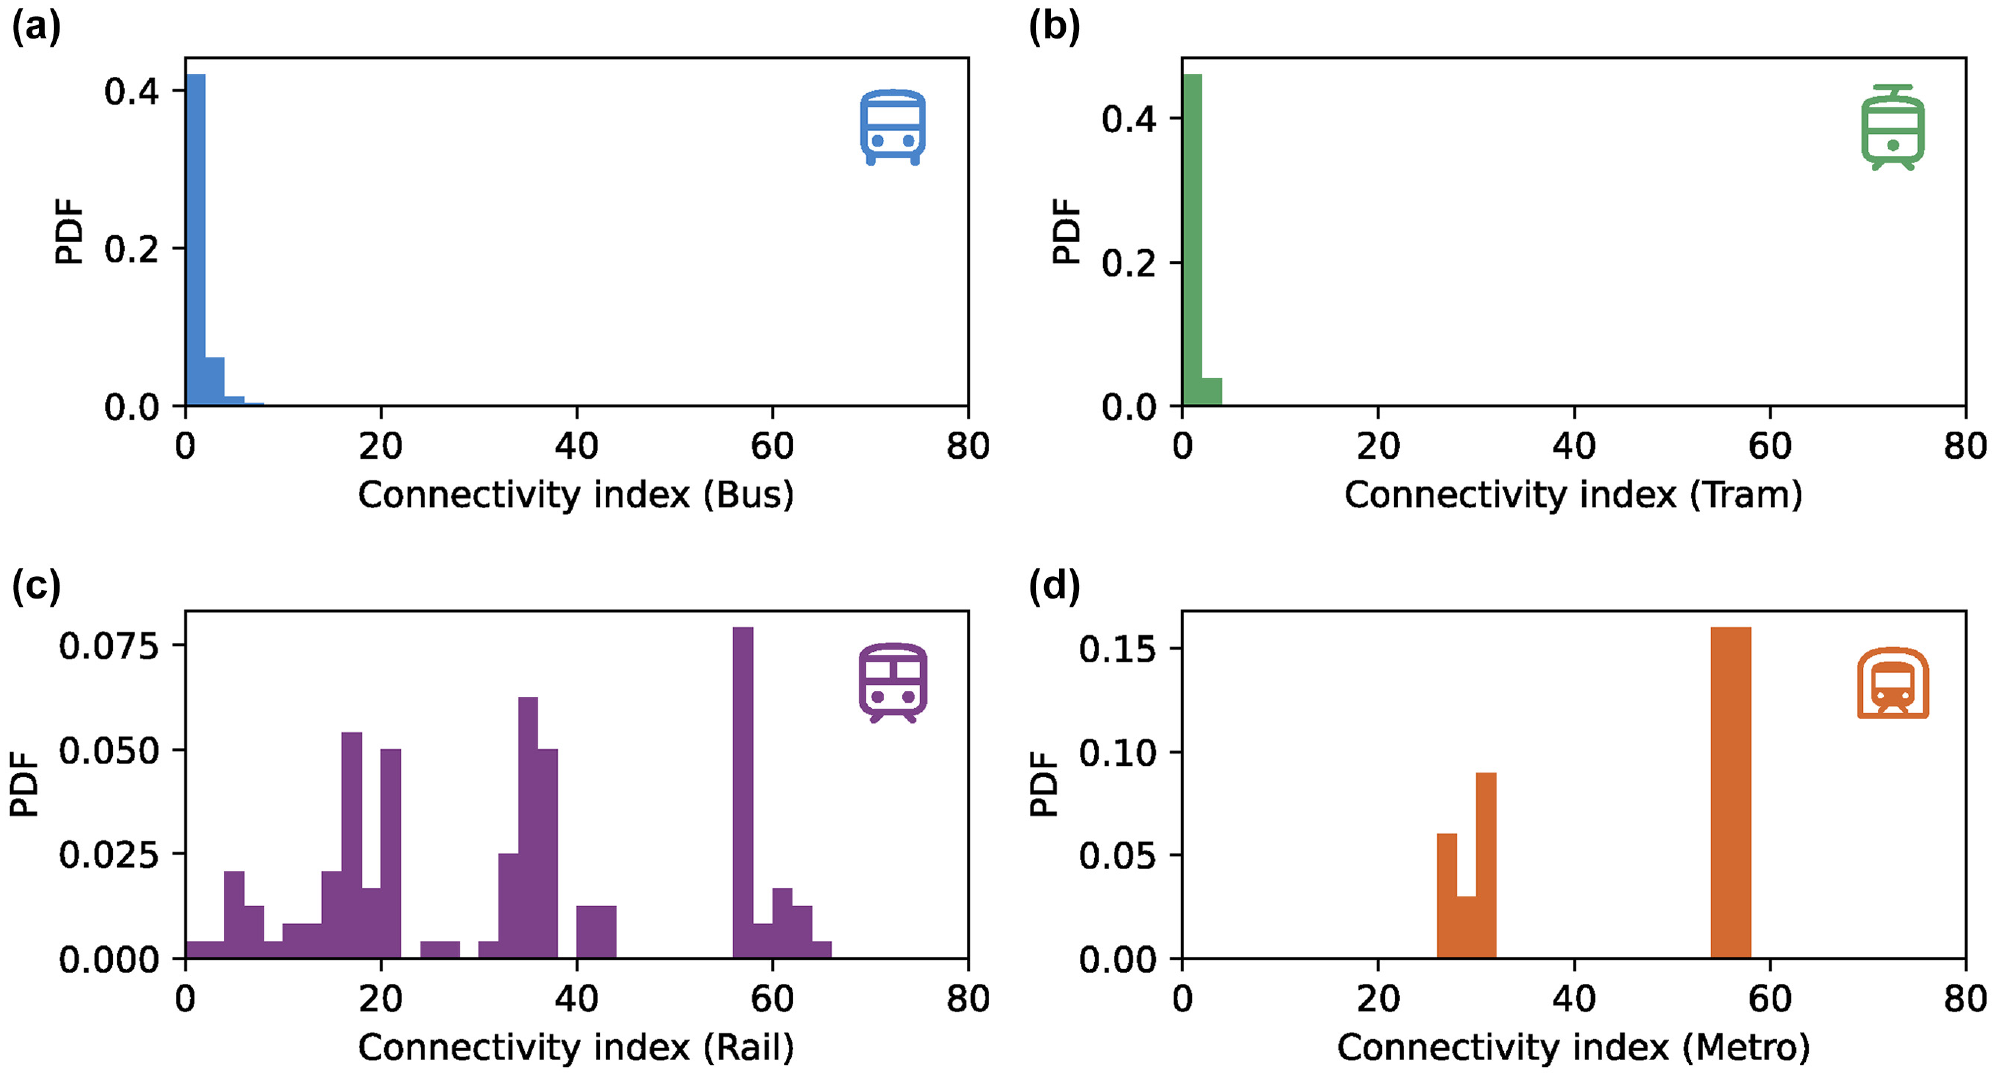
Histogram of connectivity index per stop for (a) bus, (b) tram, (c) rail, and (d) metro.
TravelSense Data Analysis
Demand data are analyzed for the 22 regular weekdays of April 2022. For each day, the number of transfers per stop is quantified and then the total number of transfers per stop is derived for the study period. Transfers are aggregated because the number of PT users who are also mobile ticketing app users who have accepted the tracking of their trajectories was low and did not allow a proper analysis at a more disaggregated level. The issue with these low numbers of TravelSense records is discussed in Huang et al. ( 33 ), in which the authors showed that the TravelSense data can be considered representative. It is noted that the aggregation might lead to double counting some daily repeated travel patterns. However, owing to the anonymity of data, it is not possible to directly know which trips might correspond to the same PT user among the studied days and thus it is not possible to know with certainty which trips are repeated.
The spatial distribution of demand and transfers is presented on the map of the study area in Figure 7. Stops near the center of Helsinki are the ones with the greatest demand and transfers, but there are also stops in the suburban areas that are equally highly used by PT users. In overall, for the study period the TravelSense dataset recorded 2.3 million boardings and alightings with 8.17% of them corresponding to transfer activities. The histograms of transfer activities per stop for each one of the four modes studied here is shown in Figure 8.
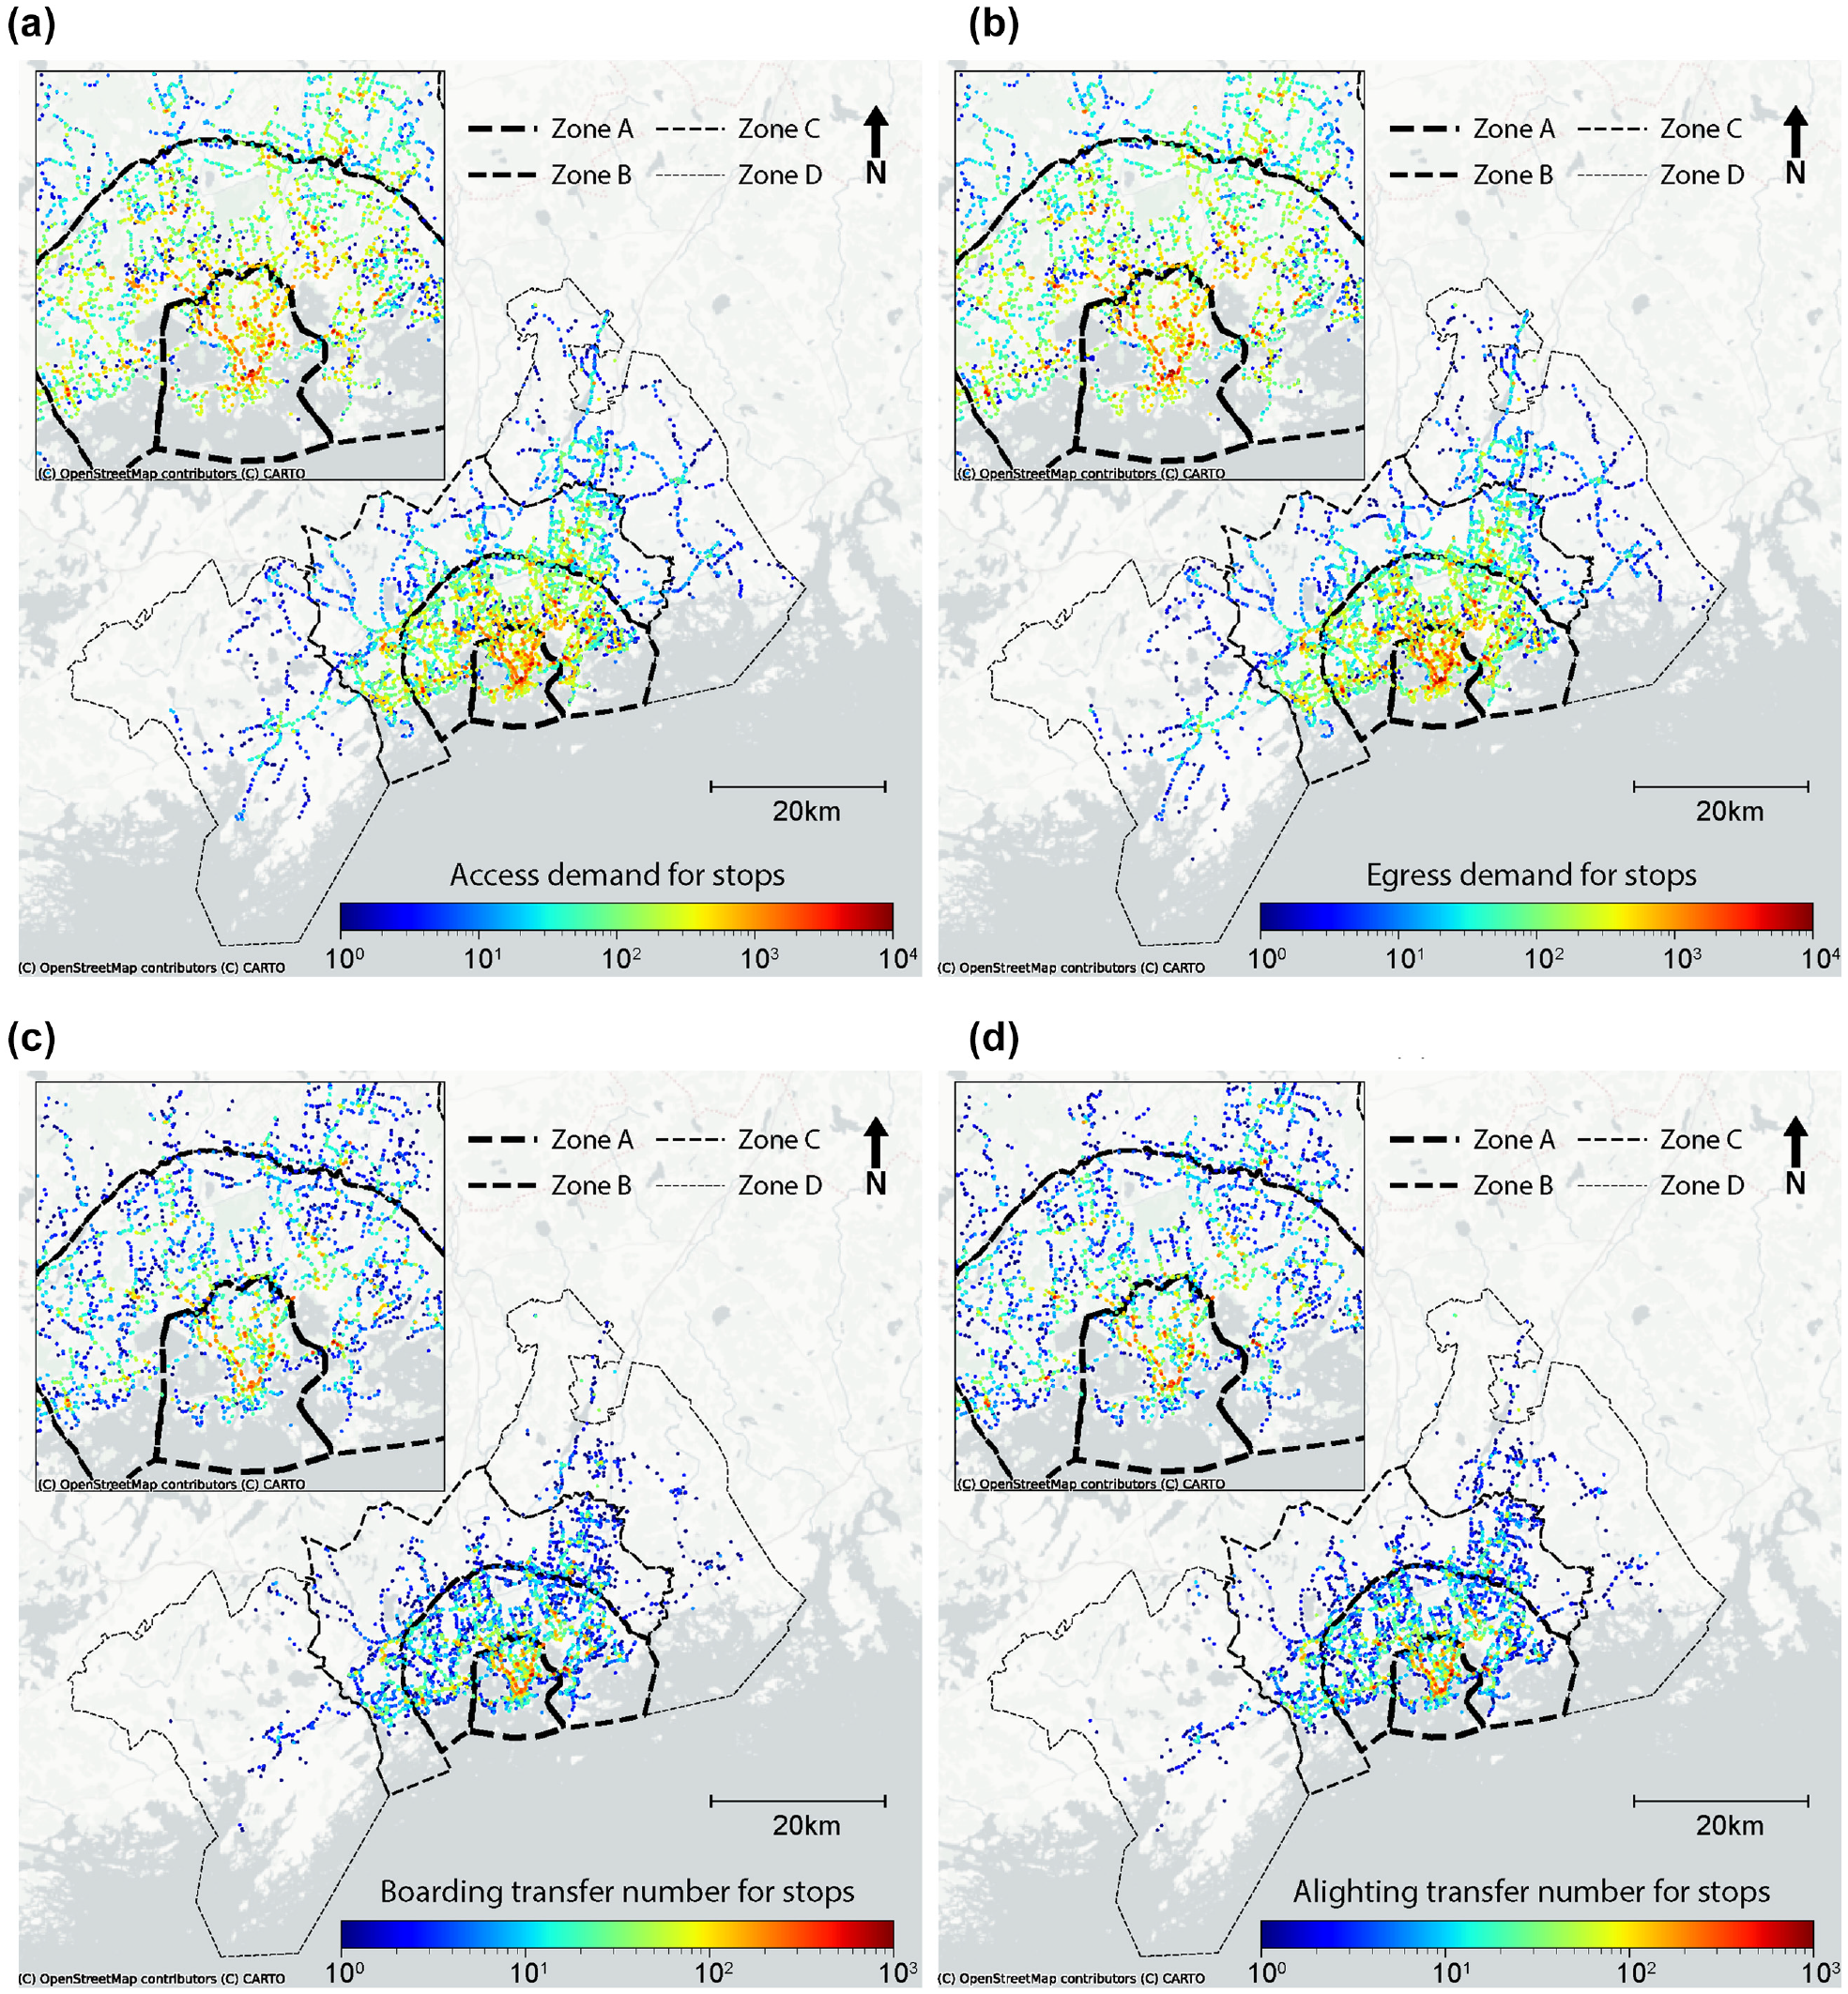
Map of under study area with locations of public transport (PT) stops and colorbar indicating the number of PT users (a) accessing a PT stop, (b) egressing a PT stop, (c) alighting at a stop during transfer, and (d) boarding a PT stop during a transfer. (Color online only).
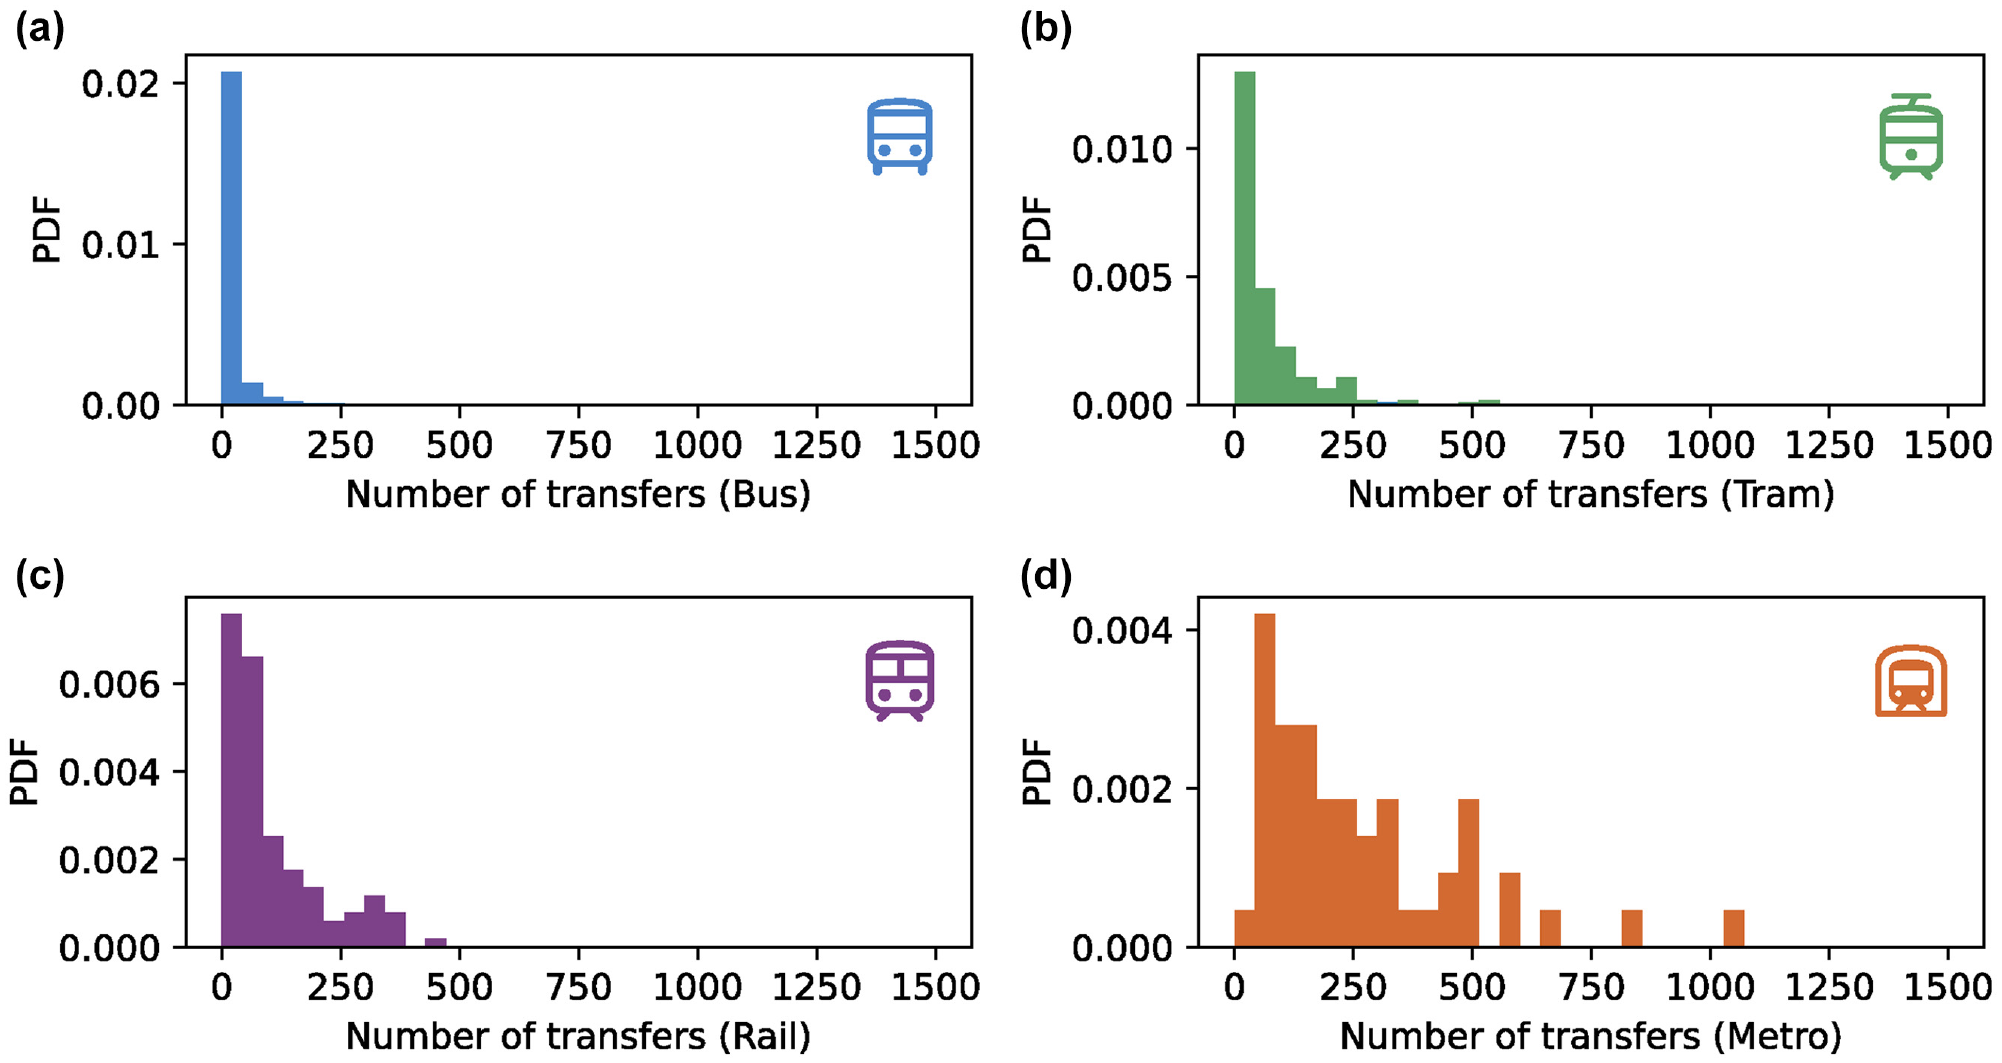
Histogram with number of transfer activities per stop for (a) bus, (b) tram, (c) rail, and (d) metro.
Clustering Analysis
After connectivity and transfers per stop are quantified, HAC is used for clustering stops of each mode according to their connectivity and transfers. To identify the greatest combination of SSs for clustering based on connectivity and transfers, we used a maximum number of clusters equal to 20. Eventually, metro stops are clustered in two clusters, bus and rail stops in three clusters, and tram stops in four clusters. The results of the clustering procedure for connectivity index per stop are shown in Figure 9. The results of the clustering procedure for transfers per stop are shown in Figure 10. In these figures, the stops per mode are ordered from low to high value according to their connectivity or transfers, with different colors indicating the cluster in which they belong. The resulting mean values per cluster and the SS per cluster are also included in the figures. In this study, “cluster 1” refers to low connectivity and the greater the number of cluster the greater the connectivity. The same holds for transfers clusters.
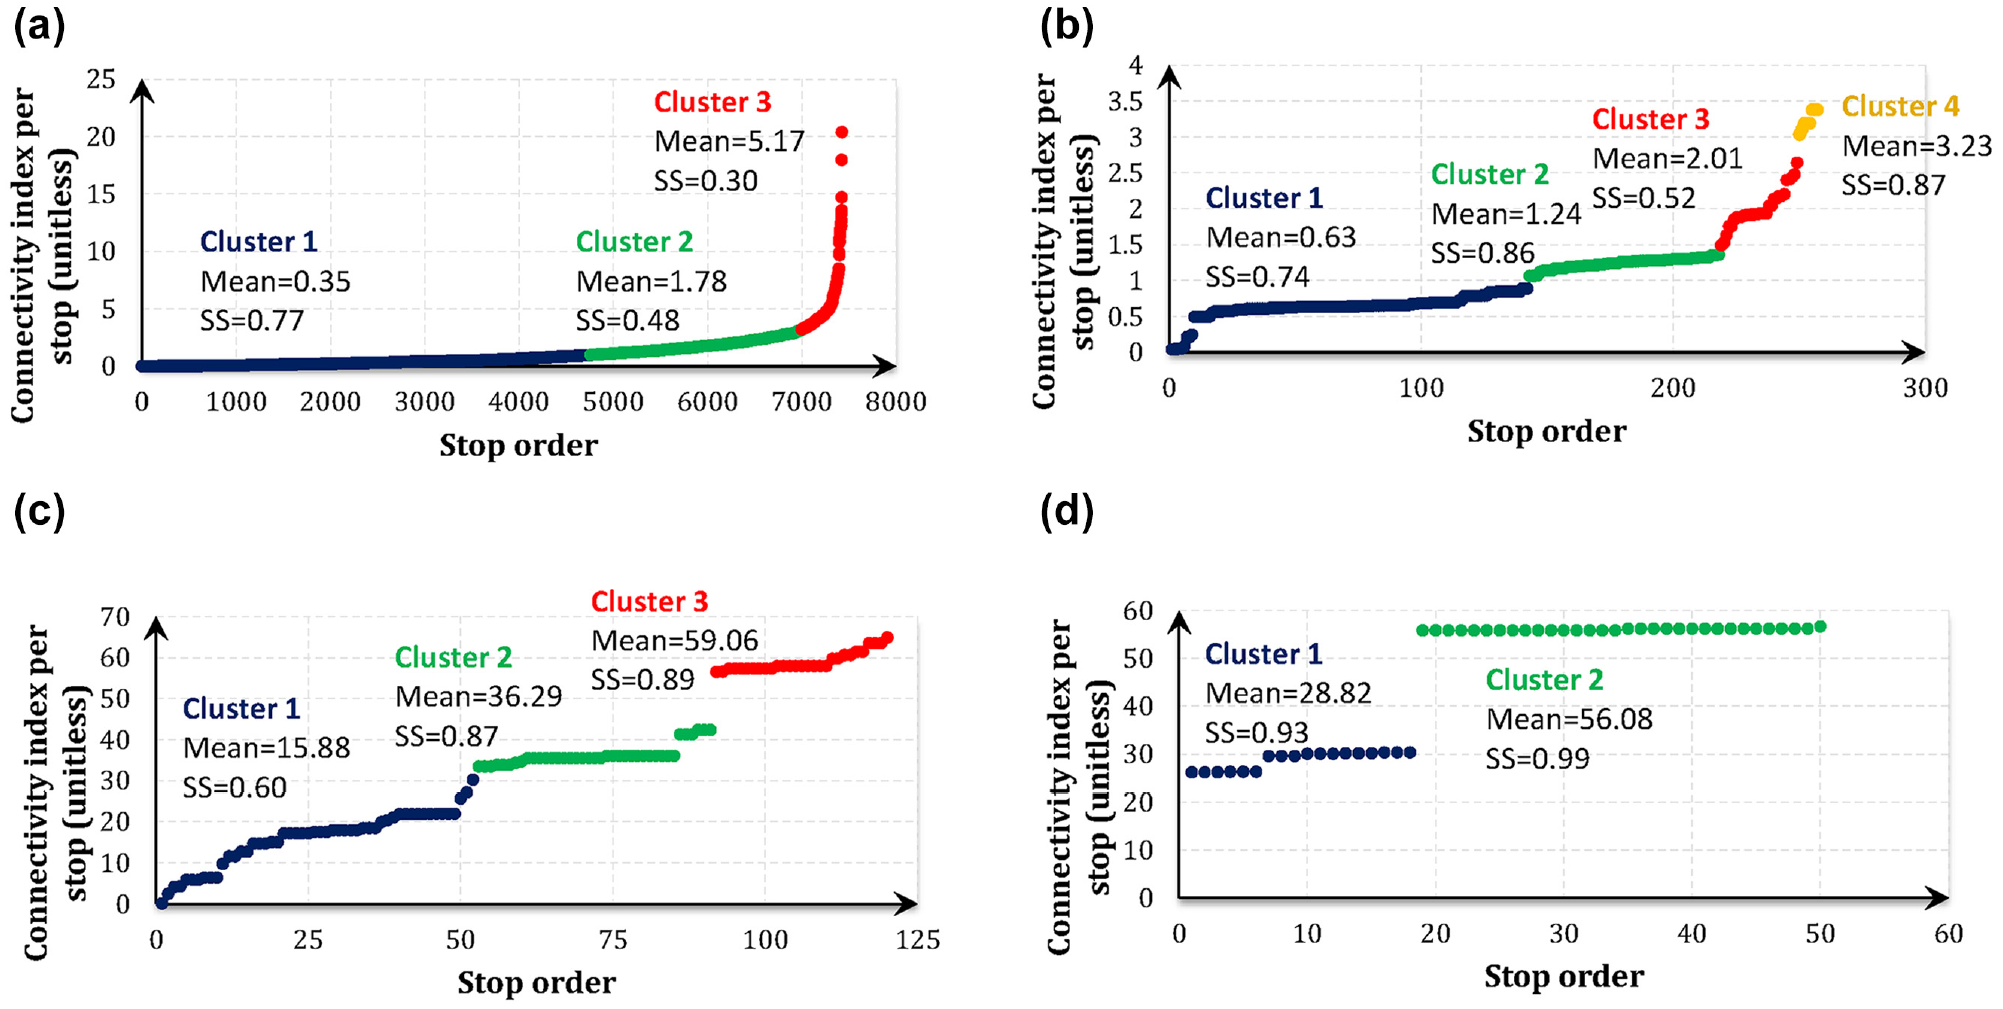
Clustering results for connectivity per stop of (a) bus, (b) tram, (c) rail, and (d) metro.
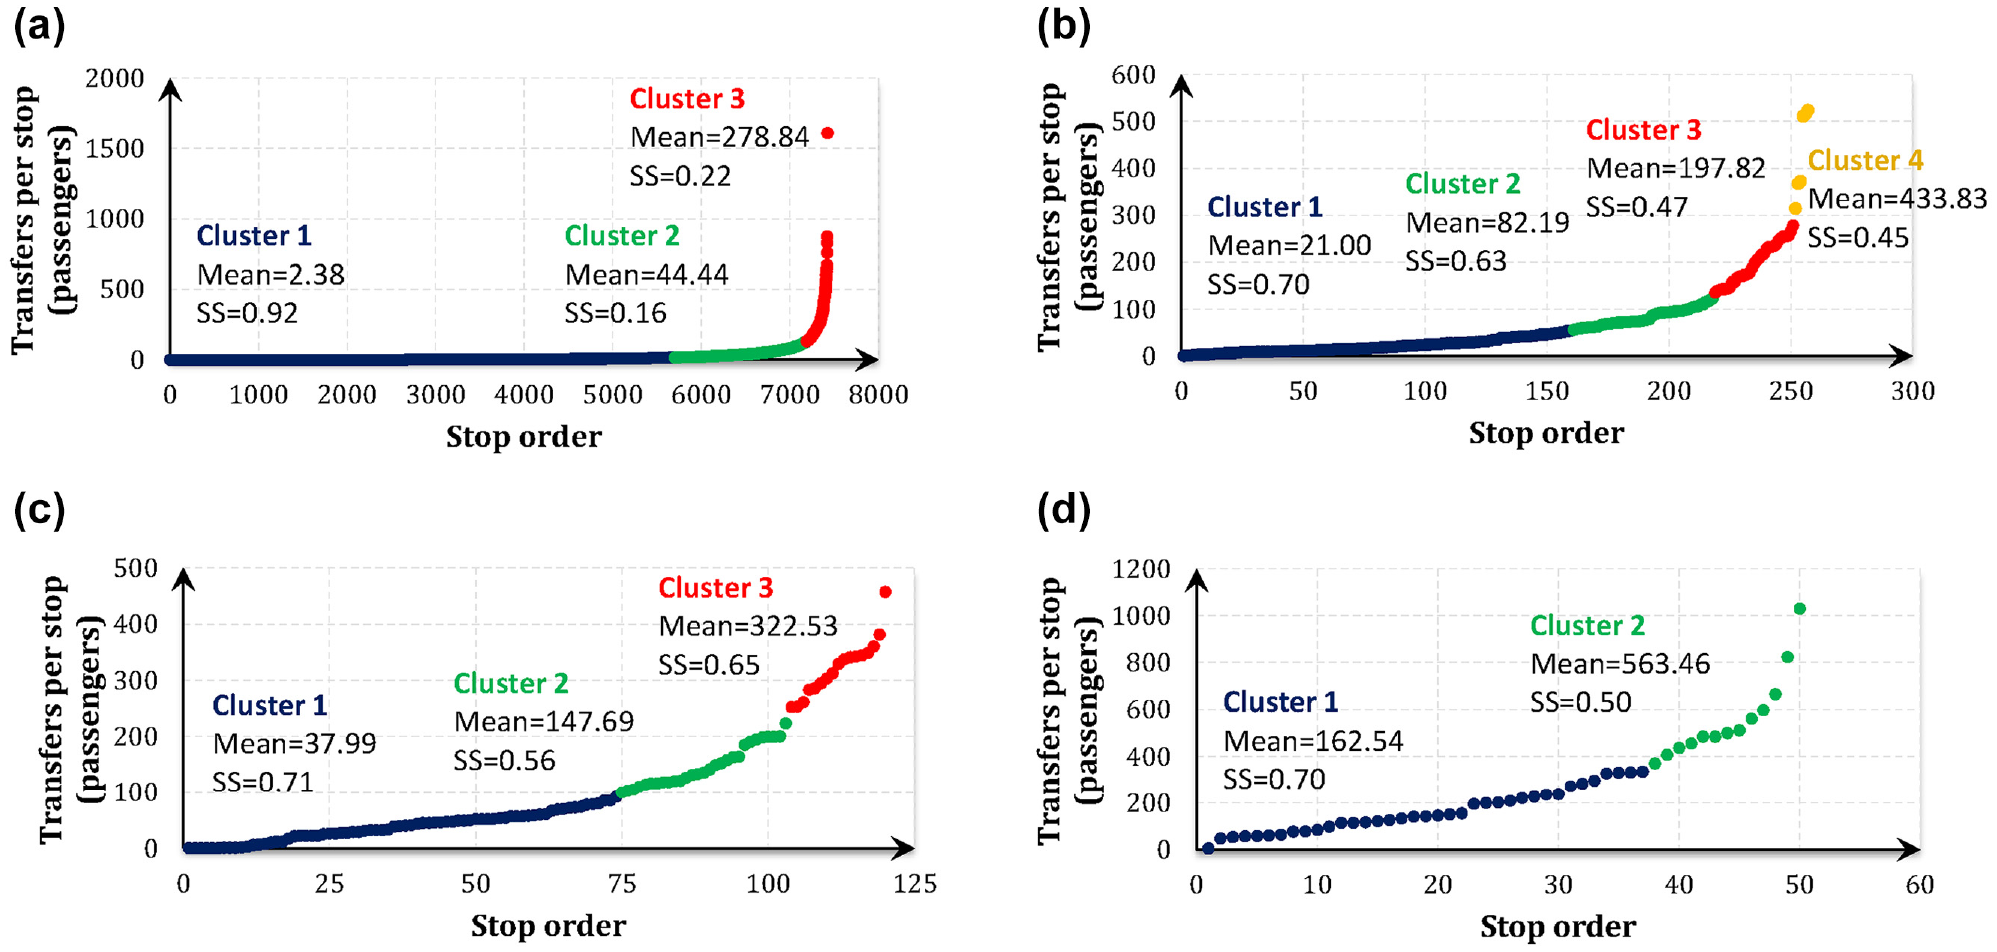
Clustering results for transfers per stop of (a) bus, (b) tram, (c) rail, and (d) metro.
Evaluation
The matching matrices for each one of the four modes of the Helsinki network are shown in Figure 11. This figure also presents the SS for both the clustering based on connectivity and the clustering based on transfers. As shown, it is always positive and close to one, for all clustering processes implemented here, indicating a high accuracy of results. It is noticeable that in all four modes there are more stops in the area of high connectivity and low transfers (i.e., green color shaded area in Figure 11) compared with the area of low connectivity and high transfers (i.e., red color shaded area in Figure 11). In addition, the extreme case of low connectivity and high transfers includes zero number of stops for tram, rail, and metro. The eight bus stops that belong to the extreme case of low connectivity and high transfers (Figure 11a) require further investigation from the operator to ensure that the user experience is efficient at these stops.
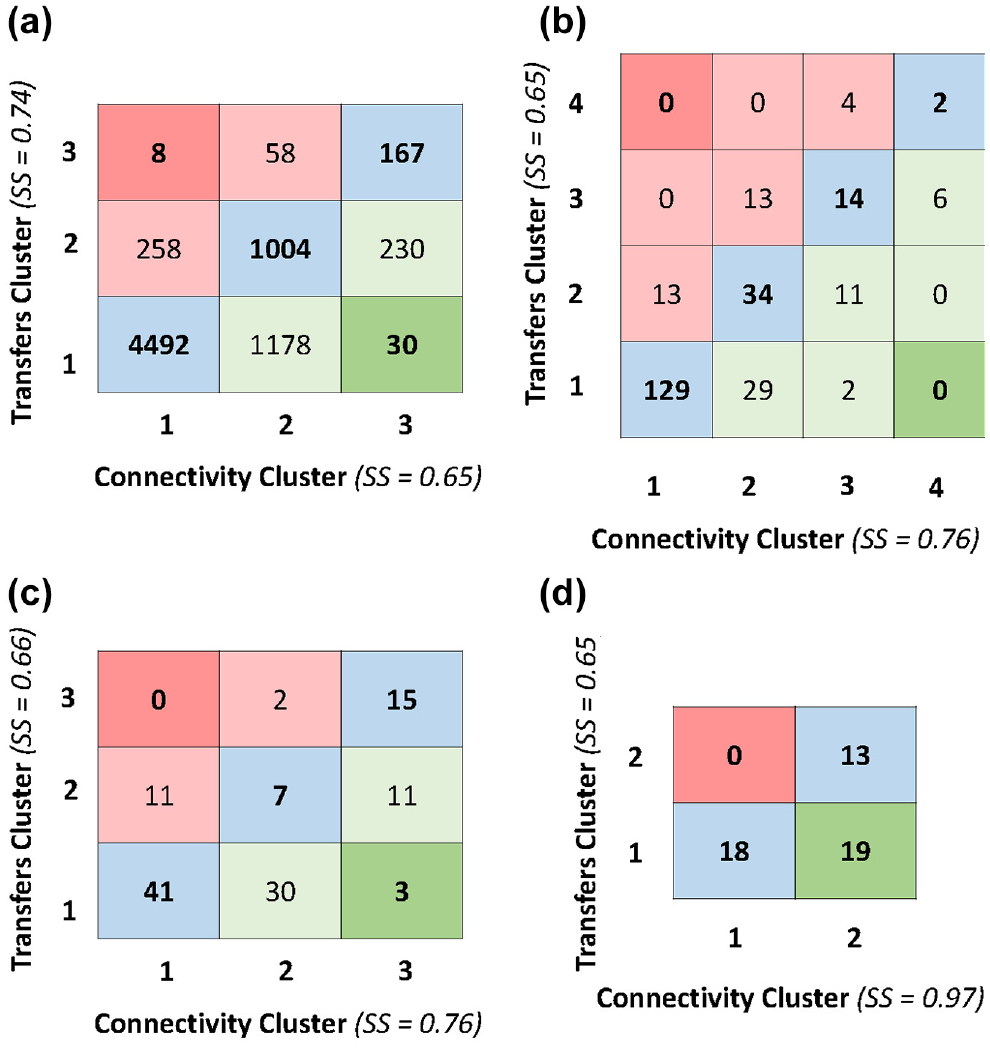
Matching matrix for (a) bus, (b) tram, (c) rail, and (d) metro mode. (Color online only).
Table 2 summarizes the results of Figure 11 with reference to percentage of stops that belong to the cases of equal connectivity and transfers (ECT), low connectivity-high transfers (LCHT), and high connectivity/low transfers (HCLT). The percentages of stops per mode belonging to the extreme cases of low connectivity/high transfers (LCHTe) and high connectivity/low transfers (HCLTe) are also included in the table. As shown, there is a high percentage of stops that belong to the equivalent cluster of supply and demand for all modes (i.e., more than 50% for all modes). Metro mode is shown in this table to have a high percentage of stops belonging to the case of high connectivity and low transfers, compared with the respective percentages of other modes. It is noted that for metro stops the LCHT and LCHTe values are equal because the stops are clustered in two clusters. The same holds for HCLT and HCLTe.
Evaluation of Stops’ Performance Per Mode
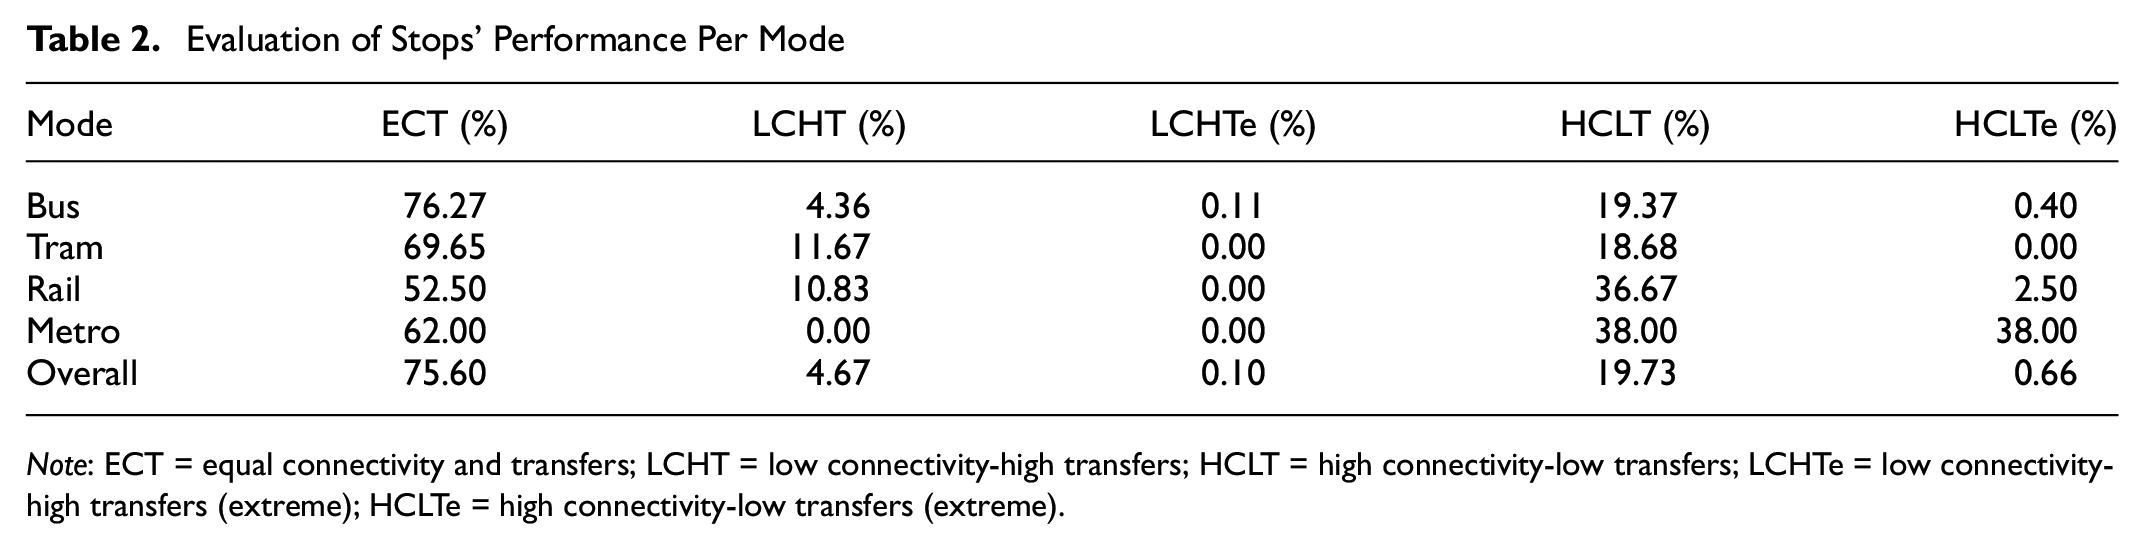
Note: ECT = equal connectivity and transfers; LCHT = low connectivity-high transfers; HCLT = high connectivity-low transfers; LCHTe = low connectivity-high transfers (extreme); HCLTe = high connectivity-low transfers (extreme).
Table 2 also includes the evaluation of the overall multi-modal network based on each mode’s evaluation. Considering the dominating role of bus stops within Helsinki’s multi-modal network (i.e., 94.56% of stops are bus stops), it is noted that the overall multi-modal network’s evaluation is similar to that of the bus mode. Therefore, it has a high percentage of stops within ECT (i.e., more than 75% of Helsinki stops present equivalent connectivity and transfers), and more stops belonging to the area of high connectivity and low transfers compared with the case of low connectivity and high transfers.
Discussion and Conclusions
Summary of Findings and Discussion
This study focuses on the evaluation of multi-modal PT networks’ performance and proposes a clustering-based methodology to compare supply and demand using traditional and emerging data sources. The implementation of the proposed methodology led to the Helsinki’s PT stops being clustered according to their connectivity and transfers. The constructed matching matrices showed that the majority of stops presents a good alignment between supply and transfers (i.e., more than 50% of stops for each mode and for the overall multi-modal network). These stops can be thus eliminated from the investigation of planners as regards where to perform improvements, reducing significantly their planning efforts. Considering stops in which supply and demand are not equivalent, it is shown that they mostly refer to cases of stops belonging to higher clusters of connectivity when compared with the transfers clusters in which they belong. This observation ensures the good quality of offered services, but it is up to the operator to decide whether they would like to reduce their efforts in some stops to properly allocate funding to other stops that require more attention (i.e., to the stops of low connectivity and high transfers). The high performance shown by this analysis is well aligned with a recent survey that has ranked Helsinki’s PT services as the second best among European urban regions with a percentage of user satisfaction equal to 76% ( 38 ).
Implications for Practice
This study required the availability of sufficient information to quantify supply and demand. Quantifying supply was achieved through utilizing an existing connectivity index suitable for PT networks. Acknowledging the importance of proposing a methodology that can be easily replicated, the authors utilized openly available GTFS data, as suggested also by existing literature ( 39 ). However, quantifying transfers is a more challenging task which can be achieved either through fusing traditional data sources or through using emerging sources in this field. The former case is more complex computationally, while the latter requires the availability of such data source. Mobile phone-based demand data sources, like the one utilized here, are promising for quantifying PT demand ( 28 ). Therefore, it is expected that they will become more common in advanced PT networks in the near future, allowing the replication of the proposed method in more case studies. Despite the uncertainties of what percentage of demand can be captured by such a dataset, the TravelSense data were shown to be efficient in revealing the relationship between supply and demand within the Helsinki network as indicated by the high ECT of most modes, thus enhancing the findings of Huang ( 33 ). In that study, the authors found that this dataset’s magnitudes of demand and transfers per stop are much lower than the ones deriving from alternative sources; however, their relative magnitude is considered representative. In a study like the one performed here, the importance is on identifying a dataset that can reveal the relationship among all stops of a network as regards transfers (and not necessarily the actual magnitudes per stop), thus allowing them to be clustered properly.
As regards the evaluation of the proposed methodology’s results, the case of high connectivity and low transfers can be evaluated in different ways. One approach is that the demand data and their filtering processes did not allow the proper representation of transfers at these stops. Another approach is that the effects of COVID-19 on demand were still present in the case study during April 2022. If data are assumed to be fully representative, then this case means that the operators have allocated more efforts than they should on these stops (e.g., as regards budget allocation). Therefore, the operations at these stops should be re-planned to account for the actual levels of transfers that take place at them. For example, that could happen through re-allocating funding from these stops to others that require support. Reducing the supply at a stop, however, is a decision that should be carefully taken, while also accounting for the marginal effects of the respective actions on the entire PT network. A simple example here is that reducing the efforts at a stop might lead PT users to use other stops, therefore increasing their demand and therefore creating new problematic stops in the network. Such scenarios can be investigated by using iteratively the proposed methodology, aiming at the highest possible percentage of stops that belong to equivalent clusters of supply and demand in tandem with the least possible number of problematic stops.
Considering the supply indicator for PT evaluation, an existing transit connectivity index was utilized here, including components of passenger capacity, speed, and length of routes. Therefore, the actions of the operator for adjusting supply to demand levels at a stop should be related to these components, either directly or indirectly. If a network is associated with different needs that cannot be reflected through this indicator, then the proper one should be incorporated in the proposed methodology. The set of actions that a PT operator can take with reference to planning PT services according to demand can vary from less to more intrusive approaches associated with different levels of labor and budget requirements. This study aims at identifying points of interest that require further attention by the PT operators to reduce the set of candidate points that they have to investigate while planning improvements. The following step includes personal judgment on behalf of the operators and/or additional methods for the identification of specific actions. This step lies beyond the scope of this study.
Future Directions
There are several ways in which this study could be extended in the future. A future study refers to identifying the effect of specific changes in the PT network. It is noted that the Helsinki PT network is constantly going through changes aiming at improving the user experience. In recent years, the Helsinki metro was extended, including the transformation of a direct bus network into a metro system with feeder buses ( 40 ). The improvements of metro services continue up to date, with an additional line extension performed during 2023. It is noteworthy that the Helsinki tram network is currently under improvements that started already during 2021 and will continue until 2035 ( 41 ). The evaluation framework proposed in this study could be used for evaluating the effect of a change in the PT network, considering the performance of the network before and after a certain change.
A different supply indicator could be selected (e.g., another connectivity related index), depending on the goals for which the PT operators perform the evaluation. The analysis performed here is static, referring to the PT operations on a daily basis and focusing only on regular weekdays. Future studies could account for the dynamic changes of operational characteristics at smaller time periods within a day. Special days and weekends could also be part of the analysis. Considering data, this study considered the TravelSense demand data which were collected during a time period that could be affected by COVID-19 pandemic and during the early stages of introducing the trajectory tracking option in the ticketing app. An interesting future direction refers to comparing the evaluation of PT performance after the impact of COVID-19 has faded and the TravelSense data have achieved a better penetration among PT users. Finally, this study focused on the evaluation of a multi-modal network as regards alignment between stop connectivity and transfers. Future studies could focus on proposing specific planning actions for improving the performance of these stops and ensuring high quality of services and high user satisfaction.
Footnotes
Acknowledgements
The authors thank HSL for access to the TravelSense dataset, and for their time and discussions about this study. Calculations were performed using computer resources within the Aalto University School of Science “Science-IT’’ project.
Author Contributions
The authors confirm contribution to the paper as follows: study conception and design: C. Sipetas, Z. Huang, A. Espinosa Mireles de Villafranca; data collection: C. Sipetas, A. Espinosa Mireles de Villafranca; analysis and interpretation of results: C. Sipetas, Z. Huang; draft manuscript preparation: C. Sipetas. All authors reviewed the results and approved the final version of the manuscript.
Declaration of Conflicting Interests
The authors declared no potential conflicts of interest with respect to the research, authorship, and/or publication of this article.
Funding
The authors disclosed receipt of the following financial support for the research, authorship, and/or publication of this article: The work of C. Sipetas was supported by the FinEst Twins Center of Excellence (H2020 Grant 856602). Z. Huang is supported by the NetResilience consortium funded by the Strategic Research Council at the Academy of Finland (grant numbers 345188 and 345183) and Guangdong Science and Technology Strategic Innovation Fund (the Guangdong-Hong Kong-Macau Joint Laboratory Program), Project No.: 2020B1212030009. The work of A. Espinosa Mireles de Villafranca was supported by the Academy of Finland.
Data Accessibility Statement
Data not available.