
Abstract
The experience of walking to transit stops plays a critical role in the use of public transportation. Having a safe and walkable environment for this part of the trip is even more important for vulnerable population groups, who depend more heavily on public transportation. The aim of this paper was to evaluate first mile/last mile walkability and road risks in the Montréal metropolitan area using an environmental justice approach. Using a spatially sound method, we determined that areas where more people identify as visible minorities are disadvantaged as far as walking-to-transit routes are concerned and that areas with higher proportions of people on low incomes and people aged 65 and over have more walkable environments but also have to deal with more road risk.
At one point or another along their journey, all transit users become pedestrians. Walking is critical to the use of public transportation and the first mile/last mile experience. The literature on the first mile/last mile experience addresses the access to or egress from public transportation. Some authors use the term “last mile problem” when it comes to highlighting the challenges and barriers transit users face in accessing transit stops ( 1 – 3 ). Built environment and trip attributes can enhance the use of walking as an access or egress mode for arriving at or exiting transit stations ( 4 ). In fact, the out-of-vehicle environment has a bigger impact on transit users’ satisfaction than in-vehicle and system-related factors ( 2 ).
Assessing the First Mile/Last Mile
The literature on the first mile/last mile experience primarily uses surveys to assess which particular elements are important for transit users ( 2 , 5–7). This method is suitable for evaluating the satisfaction of transit users and their public transportation experience. However, studies on walkability use a variety of tools to determine the extent to which an environment is pedestrian friendly. Walkability methods are more appropriate if the issue being studied addresses the suitability of the environment rather than a person’s individual experience.
Walkability in the First Mile/Last Mile
Walkability refers to the extent to which the built environment motivates people to walk, and to a certain degree, how welcoming the built environment is to those individuals ( 8 ). Cervero and Kockelman’s ( 9 ) pioneering study established the three Ds (density, diversity, and design) as crucial features of built environments that must be assessed to improve walkability. Since then, many more features of the physical environment have been considered to have an impact on walking behaviors: presence of a sidewalk; cleanliness; street connectivity; land use mix; green spaces; car traffic volume; aesthetics of places, and so on. Depending on the data available, or the scope of the research, these factors are grouped into broader categories, much like the three Ds, to facilitate analysis and adapt the data to the context. These categories or dimensions, which include efficiency, comfort, safety/security, and pleasantness can all be used as walkability indices ( 8 , 10–15).
Walkability studies utilize three main types of research methods—audits, qualitative methods, and geographical information system (GIS)-based tools—to measure the extent of a particular environment’s walkability ( 11 ). These methods must be embedded in the local context, taking into consideration the latter’s spatial, social, and population characteristics ( 16 ).
The first of these methods—walkability audits—allows researchers to collect observations from a list of elements recognized as being important for pedestrians in a given context (e.g., urban, rural) and the targeted population (e.g., children, seniors) ( 17 , 18 ). Qualitative methods such as walk-along interviews or focus groups, for their part, aim to gather perceptions of an environment from the pedestrian’s point of view ( 19 , 20 ). The third method—GIS-based walkability assessment—allows spatial data to be superimposed onto a road network to evaluate the walkability of each road segment based on the specific features found within them. This method is widely used, especially when studying larger territories, because the first two methods are not suitable in such cases ( 21 ).
Although certain studies on the first mile/last mile concept have included some walkability concepts and methods, surprisingly, walkability is not systematically part of such research despite how critical it is for transit users. For example, as far as access to and egress from a transit station is concerned, Kathuria et al. ( 22 ) found that walkway quality can increase the use of a specific transit stop. Similarly, elements such as sidewalk connectivity and street furniture were identified as factors that enhance transit users’ walking experience ( 1 , 2 ). Roadway narrowing, street lightning, and protected bicycle lanes were also found to affect the overall experience and the specific route chosen to access public transit because these elements influence users’ perception of safety ( 2 , 23 ).
Mobility Inequalities
Research on mobility and transit use found that some populations are more dependent on transit and, therefore, walkability in the first mile/last mile zone has a greater impact on them. There are generally four sub-groups of the population affected by these mobility inequalities: seniors; low-income populations; visible minorities; and young people. Seniors, who often depend less on motorized transport and are faced with economical constraints, rely on public transportation to stay socially active ( 24 ), gain the autonomy they need to enhance social interactions ( 25 ), and to access services ( 26 ). Low-income population groups in the Montréal metropolitan area tend to use public transportation more often and have less access to a vehicle ( 27 ). This dependency on public transportation because of a low level of automobility has also been demonstrated across the U.S.A. by Giuliano ( 28 ). It is also worth mentioning that access to transit can lessen the extent to which low-income populations are negatively affected by spatial mismatch, which is defined as a mismatch between where jobs are located and where job seekers live ( 29 ). Moreover, Thomas ( 30 ) reported that young people and young adults are committed to using public transit rather than cars because of its affordability and that even when they are old enough, these groups in Québec have less access to a car than other groups ( 31 ). Amar and Teelucksingh’s ( 32 ) study also reveals that immigrants in Toronto rely on public transportation because of structural barriers such as a lack of affordable housing, the location of employment, and the lack of opportunity to obtain a driver’s license.
In parallel with this literature, several studies have shown that socioeconomic factors are associated with different pedestrian amenities, including traffic-calming measures ( 33 – 38 ). Similarly, many risk factors relating to pedestrian safety are overrepresented among certain socioeconomic groups or neighborhoods. For example, there is a higher rate of pedestrian–motor vehicle collisions among lower-income populations ( 39 – 41 ), minority groups ( 39 , 40 , 42 , 43 ), children and young people ( 44 , 45 ), and the elderly ( 46 – 49 ). This combination of social and transportation-related disadvantages can lead to what is referred to as transport poverty ( 50 ). Transport poverty, in turn, leads to a lack of access to essential goods and services, inadequate planning and decision-making processes, and social exclusion, which can result in even more social and transportation inequalities.
Environmental Justice
Environmental justice is a concept that emerged in the U.S.A. in the 1980s to demonstrate that African American populations were more exposed to risk because of their residential proximity to pollution or health hazards ( 51 ). Since then, the literature on environmental justice has been centered on the three following approaches: (a) environmental equity is interested in the spatial distribution of risks and amenities relative to socioeconomic group, and this includes the distribution of environmental benefits and resources across different socioeconomic groups ( 52 – 54 ); (b) recognition justice arises from the lack of consideration that the authorities (and their policies) demonstrate toward certain groups; and (c) procedural justice emerges from a lack of representation or power dynamics in decision-making processes relating to environmental implementation.
A safe and walkable environment is critical for transit users, especially vulnerable population groups. As such, it is clear that further research is needed to assess the first mile/last mile experience, especially in cases in which the notion of mobility inequality is involved. This paper specifically examines walkability and road risk in the first mile/last mile near transit stops in the Montréal metropolitan area using an environmental equity approach.
Methods
Study Area and Population Groups
The study area is the Montréal metropolitan area, which has a population of 4.05 million inhabitants and spans 4,370 km2. This area is serviced by 22,029 transit stops (bus, metro, train: see Table 1), half of which are located on the Island of Montréal (42%), a third (30%) on the Greater South Shore, including the city of Longueuil (16%), 15% on the Greater North Shore, and 13% in Laval, which is the second most populated city in the area, and the third in the province. Data on the transit stops were obtained from the transit authorities servicing the study area (Société de transport de Montréal, Société de transport de Laval, Réseau de transport de Longueuil, and Exo).
Number of Stops by Transportation Mode
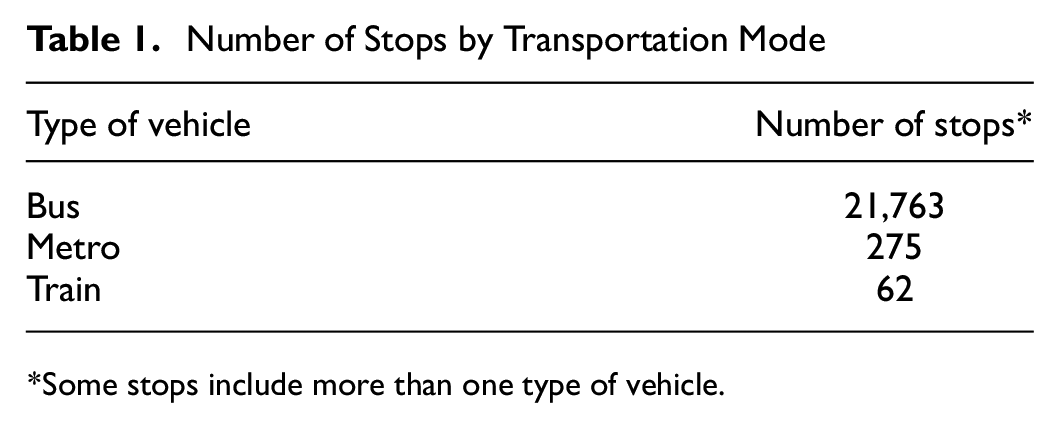
Some stops include more than one type of vehicle.
To study the walkable surroundings, we created a catchment area around each of the transit stops (n = 22,029), based on road network distance from the stops: 500 m in Montréal; and 800 m for other areas. The size of the catchment area is greater outside of Montréal because of lower population density, which influences the distance that people walk to access transit, as demonstrated in studies by Van Soest et al. ( 55 ). Figure 1 illustrates an example of a catchment area around a transit stop in Montréal and another on the North Shore (La Plaine).
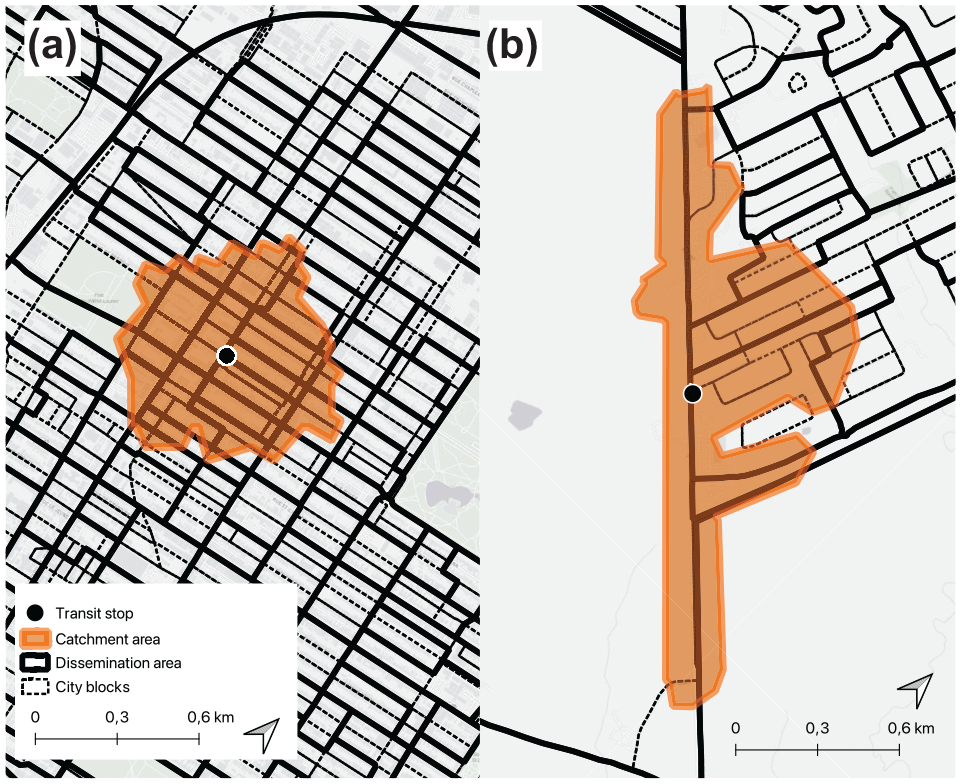
Examples of catchment areas (a) in Montréal and (b) in La Plaine.
As mentioned earlier, this study focuses on four population groups known to be prone to environmental injustice insofar as transportation is concerned: (a) low-income populations; (b) individuals who identify as visible minorities; (c) people between the ages of 15 and 24; and (4) people aged 65 and over. We recognized the literature on the vulnerability of people with disabilities when accessing transit, but this population group could not be included in this study because of data unavailability for our territorial scale.
Data on these populations were taken from the 2021 Statistics Canada Population Census at the dissemination area level (DA) ( 56 ). We identified participants who were considered to belong to low-income populations using Statistics Canada’s low-income cut-offs before tax (LICO-BT) measures, which represent income thresholds below which a family will likely spend 20% or more of their income before tax on food, shelter, and clothing, which is a greater proportion compared with the average family. Visible minorities, for their part, were identified in accordance with Statistics Canada’s definition of visible minorities, namely, “persons, other than Aboriginal peoples, who are non-Caucasian in race or non-white in color.” Finally, we used the Statistics Canada Population Census data as it stands for people between the ages of 15 and 24 and for people aged 65 and over.
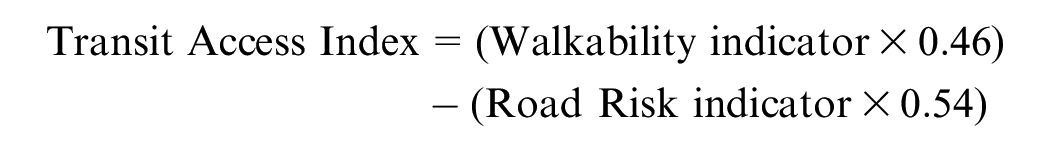
To disaggregate these sociodemographic variables from DAs to transit stop catchment areas, we used a population-based weighting technique proposed by Pham et al. ( 57 ), which uses dissemination (city) blocks, considered to be more precise:

In this formula,
Descriptive Statistics of Population Groups Studied in Transit Stop Catchment Areas
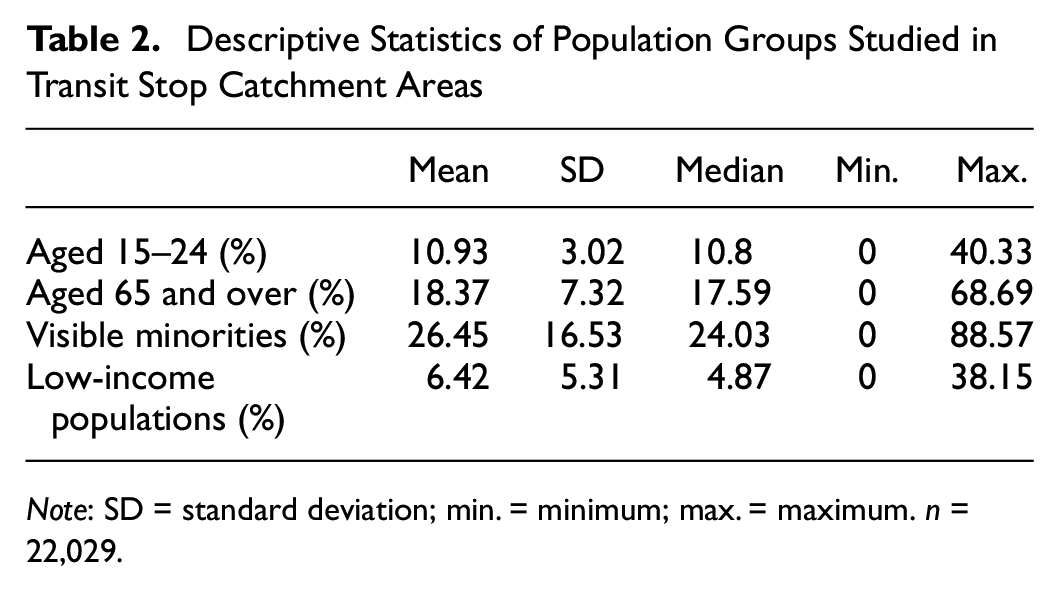
Note: SD = standard deviation; min. = minimum; max. = maximum. n = 22,029.
Safe and Walkable Route-to-Transit Index
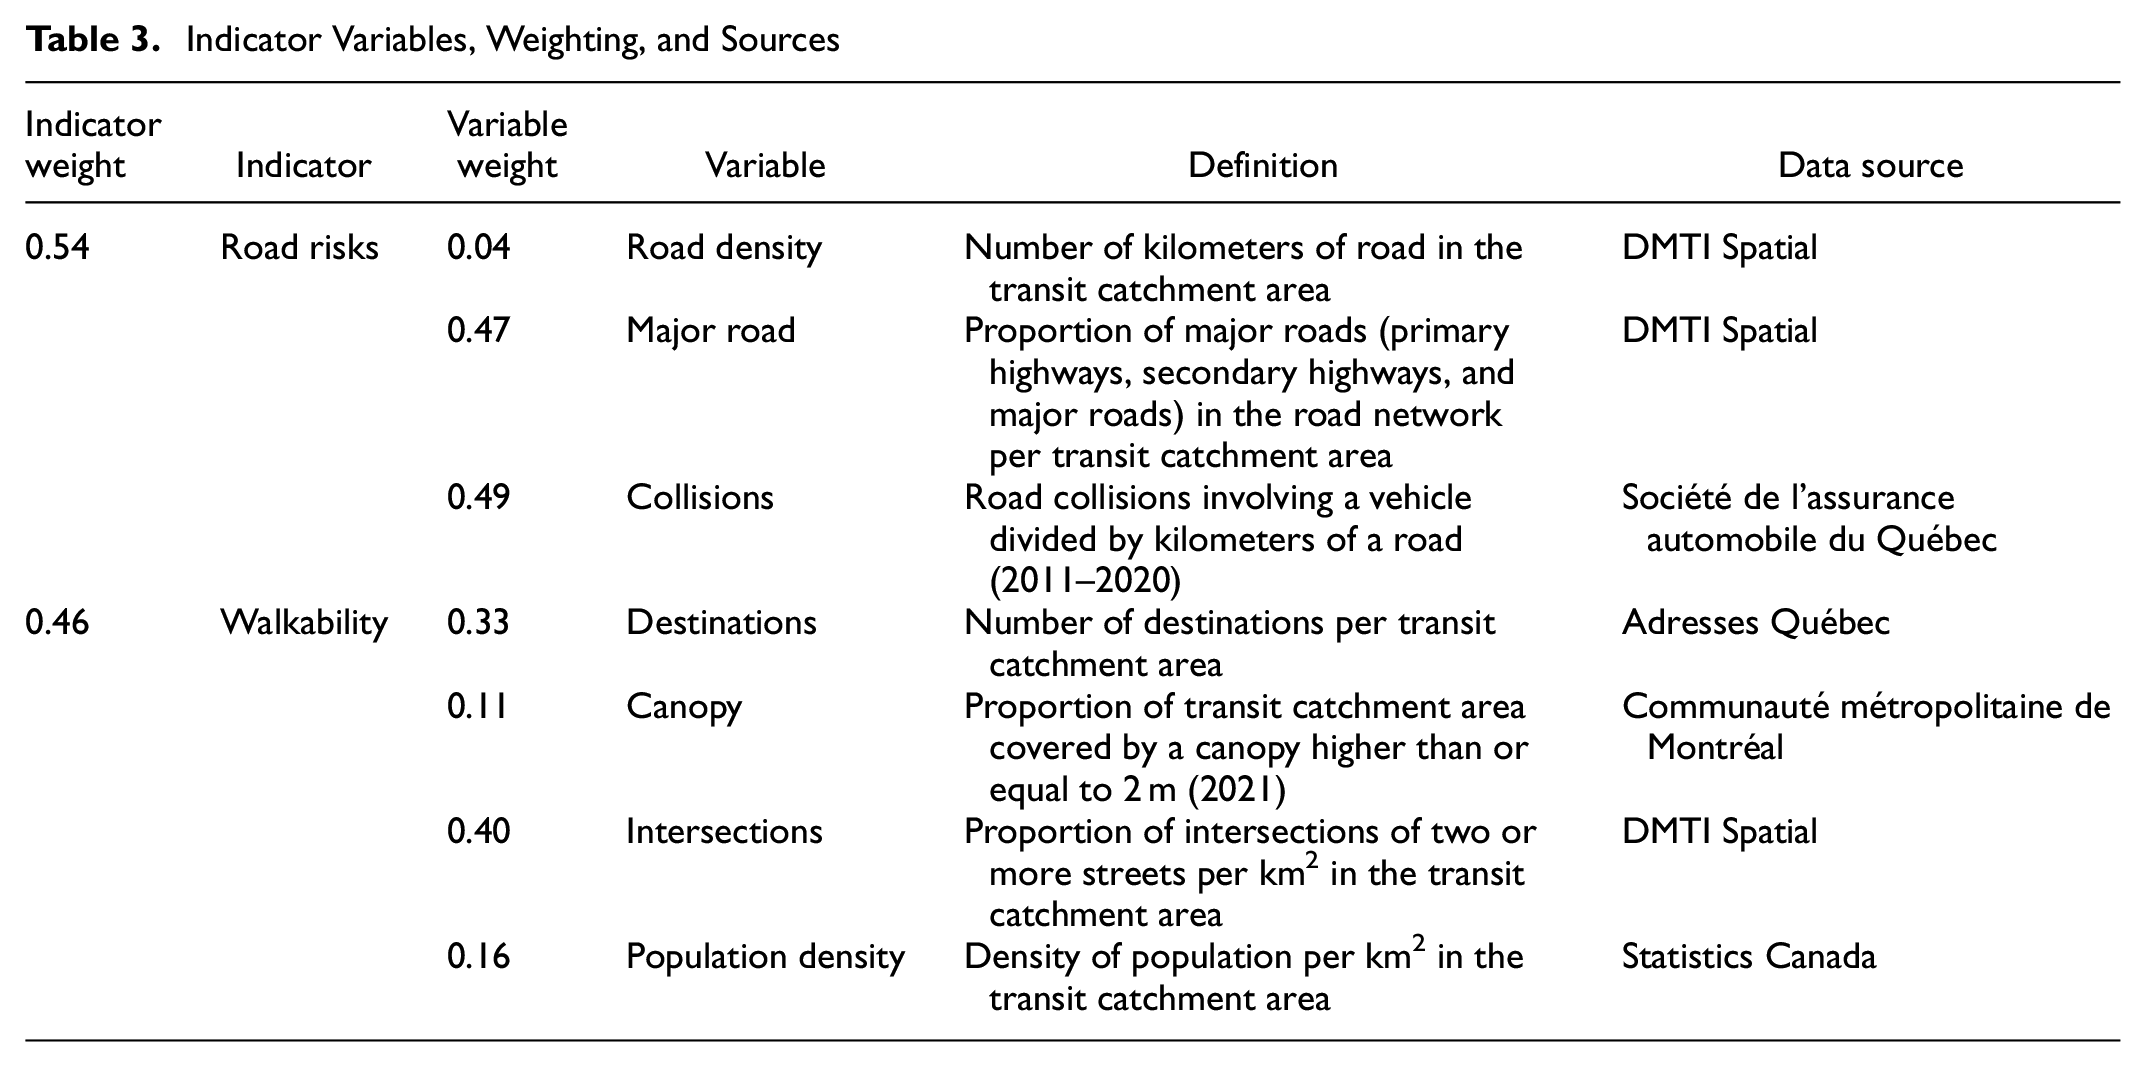
To compare the route to access transit as a pedestrian for each population group, we calculated a “safe and walkable route” index with the available data at the scale of the Montréal metropolitan area based on two indicators: a road risk indicator; and a walkability indicator (Figure 2). Table 3 presents the variables included as part of each indicator and their sources. Three variables were chosen for their effect on road safety ( 8 , 58 , 59 ): road density; presence of major roads; and past collisions. Four variables were chosen for their influence on walkability ( 10 , 12 , 13 , 15 ): destinations (e.g., retail stores, services); canopy; intersection density; and population density. Before calculating these indices, their variables were weighted using an analytic hierarchy process (AHP). The AHP method is one of the multiple criteria decision-making (MCDM) methods, which are used to meet a variety of criteria (quantitative or qualitative) and result in a unique objective value in the best possible way. Using MCDM methods in transportation research offers many benefits: they lead to justifiable and transparent decisions in relation to conflicting or contradictory variables; they organize and simplify a vast amount of data; and finally, they can be controlled and adapted to the research subject ( 60 ). Mardani et al. ( 61 ) and Yannis et al. ( 60 ) reveal that AHP is one of the most utilized MCDM methods in transportation research, notably because of its adaptability to diverse subjects; therefore, it is the best choice for this project. The AHP process was used in pairwise comparison using Saaty’s ( 62 ) scale (1 = equally important, 3 = moderately more important, 5 = strongly more important, 7 = very strongly more important, 9 = extremely more important). The comparison matrix was completed by three graduate students and a professor, all of whom are members of the Laboratoire piétons et espaces urbains at the Institut national de la recherche scientifique. Input for the weighting process was extracted from the literature and was provided by experts in this area ( 63 ). Finally, to calculate the two aforementioned indicators using the z-values of the variables, we subtracted the road risk indicator (negative) from the walkability indicator (positive):
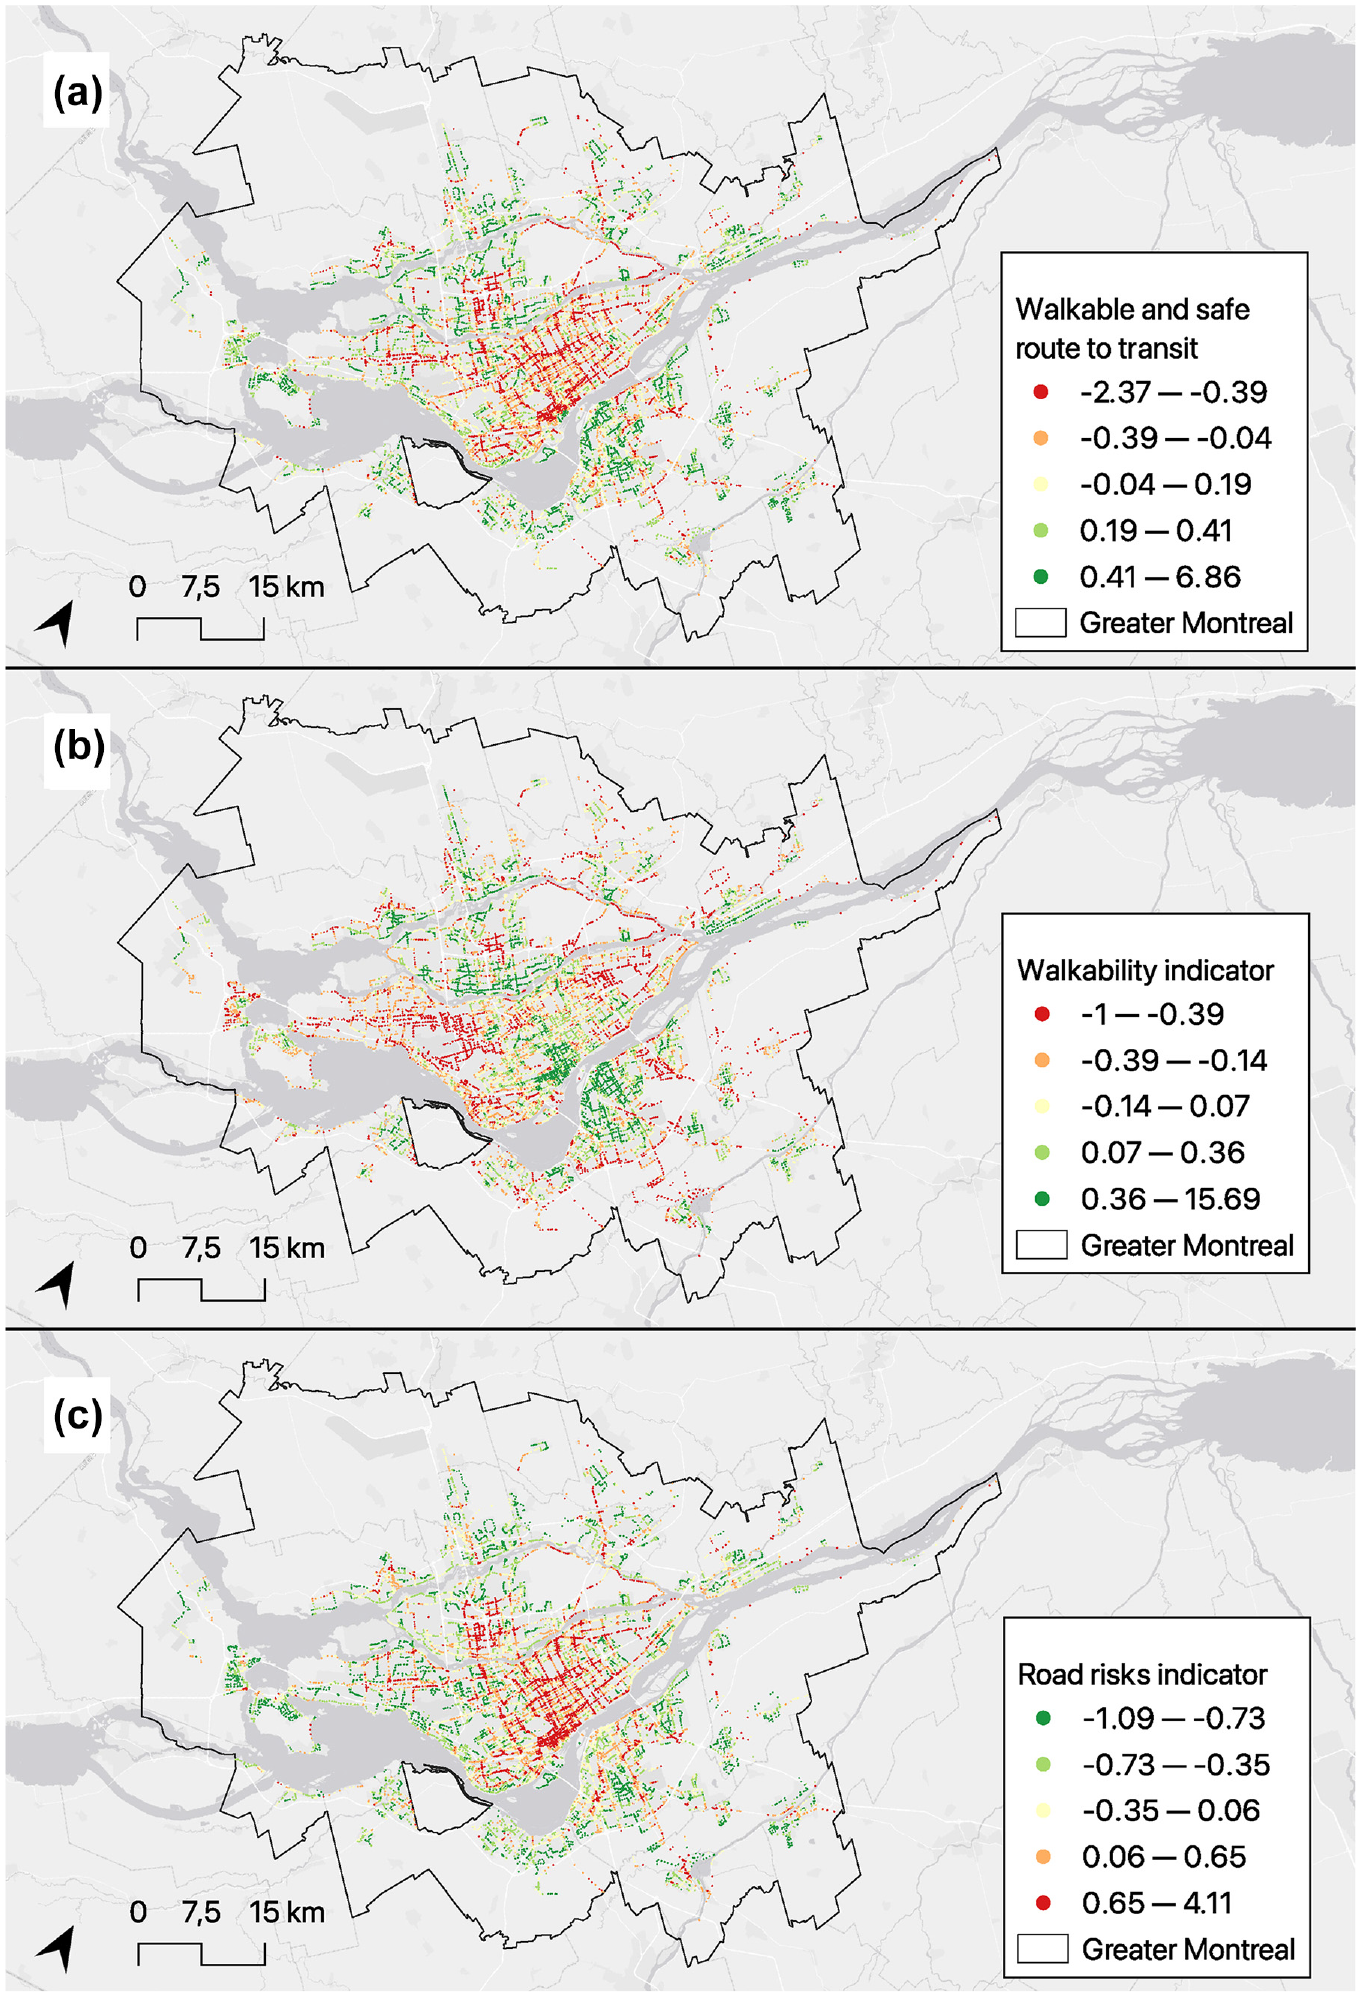
(a) Safe and walkable route-to-transit index (b) walkability indicator (c) road risk indicator.
Indicator Variables, Weighting, and Sources
Analysis
Our methods are inspired by the Carrier et al. ( 64 ) study in which several statistical tests were conducted using the same four population groups. First, we used a t-test to compare the extreme quintiles (Q1 and Q5) of each population to evaluate the association of each group to the safe and walkable route-to-transit index and its two underlying indicators (each separately). Second, to address the spatial dependency of our data, we used two spatial regressions based on the results of the Lagrange multiplier test: spatial lag; and spatial error models ( 65 ). The dependent variables in these three regression models (safe and walkable route-to-transit index, road risk indicator, and walkability indicator) were normalized using the bestNormalize package in R ( 66 ). This package performs multiple normalizing transformations and selects the best one based on a Pearson P-test divided by its degree of freedom for normality. For each dependent variable, the ordered quantile normalization was the most effective ( 67 ). The proportions of the four sub-groups were used as independent variables to determine whether there were any significant associations between the dependent variable and these population groups once we controlled for the three other groups. The t-tests were computed in R using the doBy package ( 68 ) and the spatial regressions were computed in R using the spatialreg package ( 69 ).
Results
Analysis and Mapping of the Safe and Walkable Route-to-Transit Index
The safe and walkable route-to-transit index in the catchment areas for transit stops ranges from −2.16 to 7.09 (least advantageous access to most advantageous access), the road risk indicator ranges from −1.07 to 4.77 (least road risk to most road risk), and the walkability indicator ranges from −0.99 to 16.87 (least walkable to most walkable). As shown in Figure 2, the least favorable safe and walkable access routes to transit are located near major roads. The transit stops that are located closer to Montréal’s central neighborhoods have both an increased walkability indicator and an increased road risk indicator. Outside of Montréal, the transit stops on many major roads, such as those on service roads alongside Highway 10 in Longueuil and on the South Shore, and alongside Highway 25 and Highway 15 in Laval and on the North Shore, have both low walkability and high road risks.
Comparison of Extreme Quantiles for each Population Group
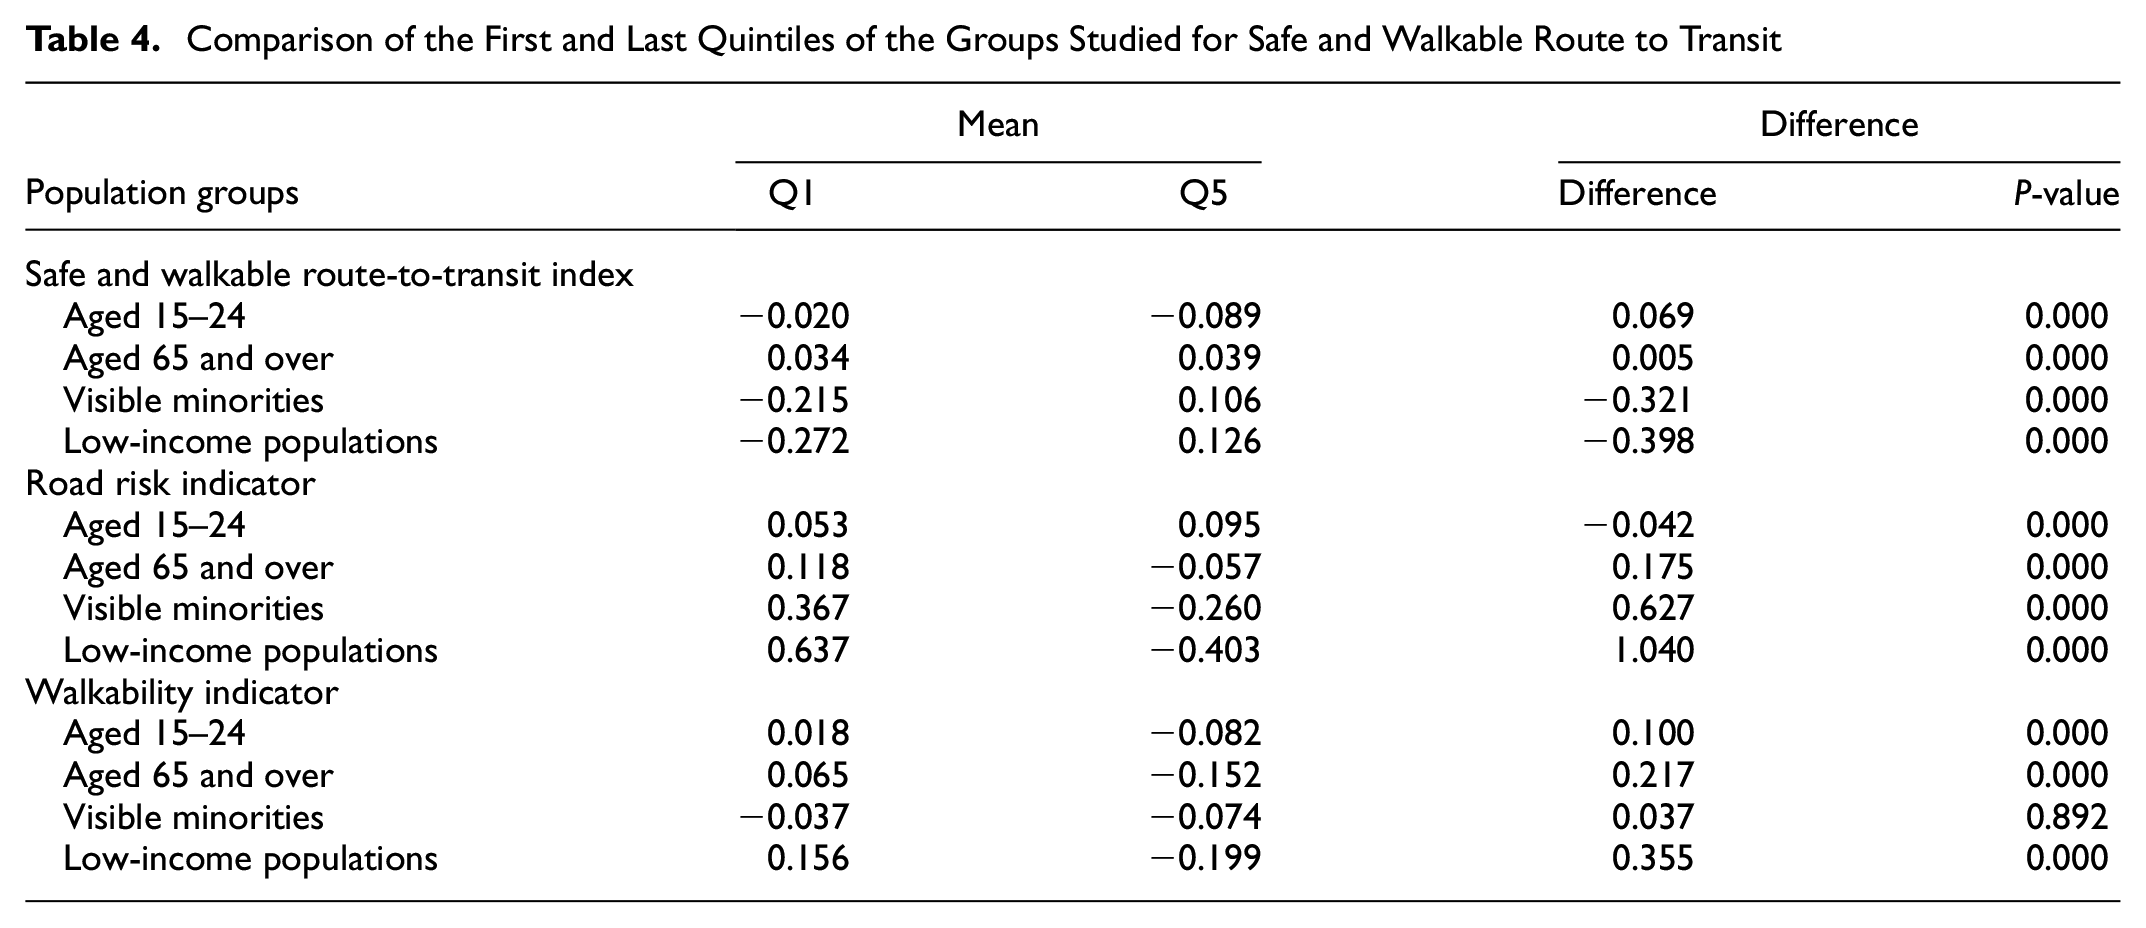
The results comparing the most disadvantaged populations (Q1) with the least disadvantaged populations (Q5) with regard to route to transit are shown in Table 4. As far as the safe and walkable route-to-transit index is concerned, we can observe that the means decrease for visible minorities and low-income populations (highest decrease). This indicates that transit stops with a higher proportion of these two population groups have a worse route-to-transit index score compared with transit stops that have a lower proportion of these two groups. The opposite is true for the population between the ages of 15 and 24 and that aged 65 and over, because the difference between Q1 and Q5 is positive: there is a better route-to-transit index score for the transit stops in the quintiles with the highest proportion of these two age groups combined.
Comparison of the First and Last Quintiles of the Groups Studied for Safe and Walkable Route to Transit
Spatial Regressions of the Population Groups
To test for spatial dependence in our data, we used ordinary least squares (OLS) regression and calculated the Moran’s I of the residuals. As shown in Table 5, all dependent variable residuals are significantly spatially autocorrelated. Therefore, we used a Lagrange multiplier test and a robust Lagrange multiplier test to assess which spatial regression fit the data ( 65 ). Because all of these tests were statistically significant, we then computed spatial lag and spatial error regression. Following this, the spatial regression that best minimized Akaike’s information criterion (AIC) was chosen.
Ordinary Least Squares Regression and Lagrange Multiplier Test Statistics
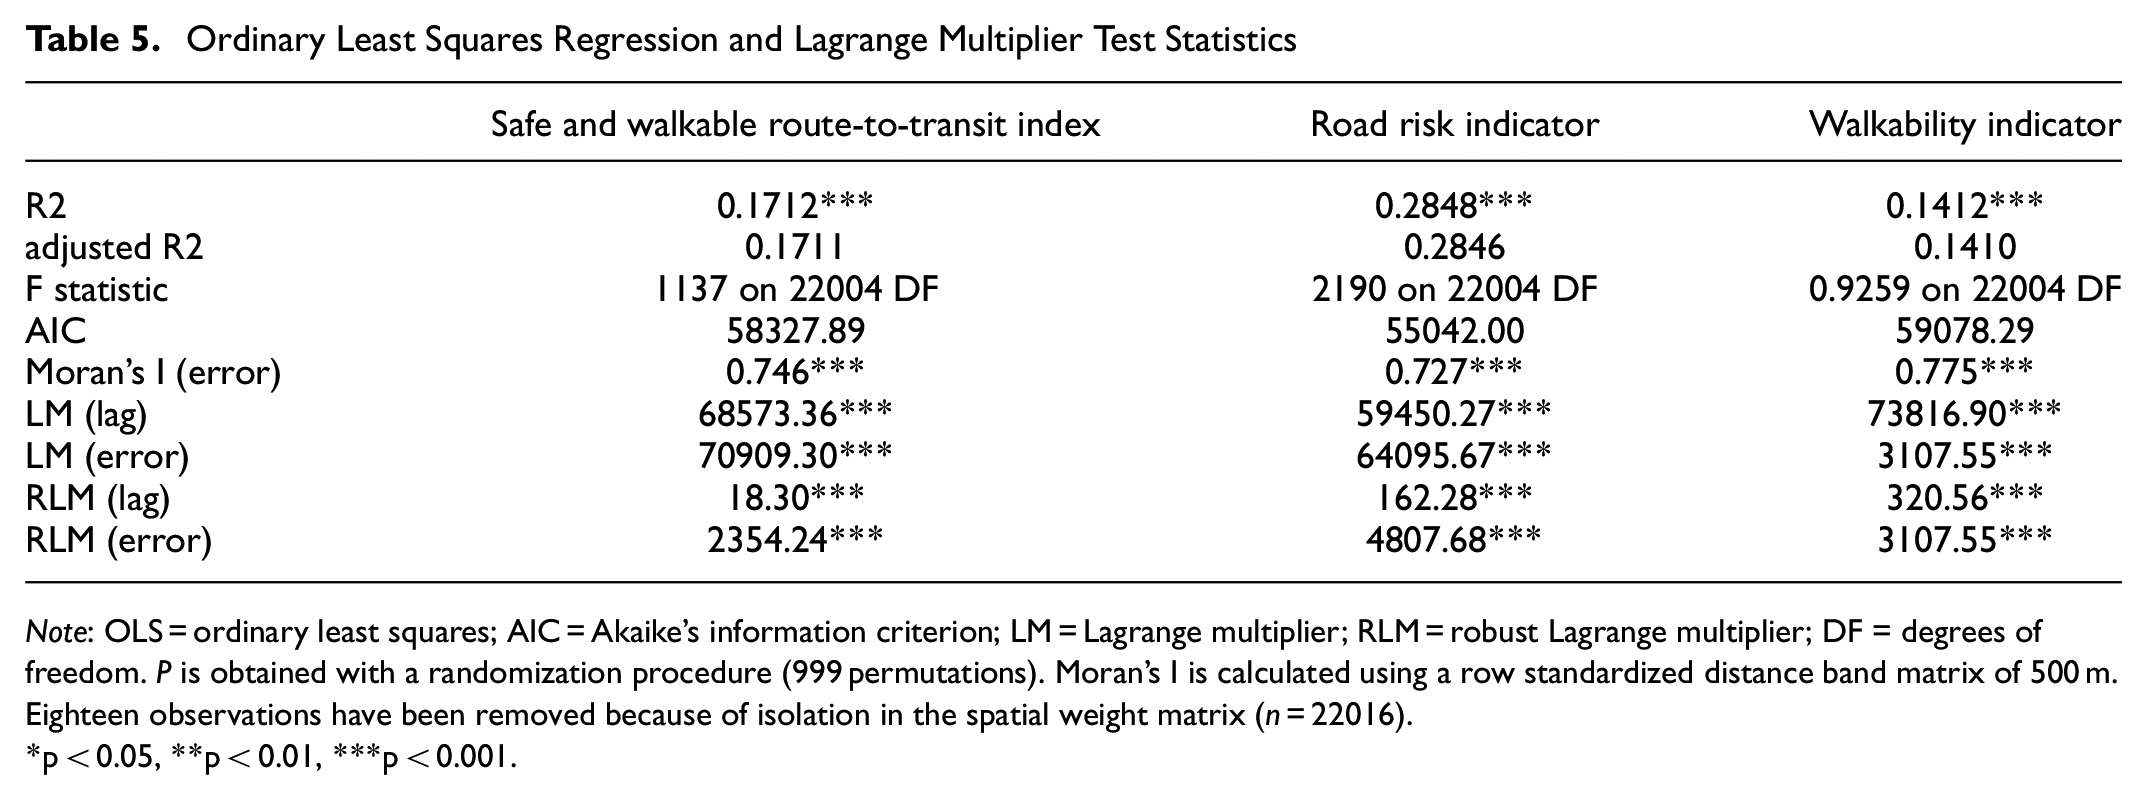
Note: OLS = ordinary least squares; AIC = Akaike’s information criterion; LM = Lagrange multiplier; RLM = robust Lagrange multiplier; DF = degrees of freedom. P is obtained with a randomization procedure (999 permutations). Moran’s I is calculated using a row standardized distance band matrix of 500 m. Eighteen observations have been removed because of isolation in the spatial weight matrix (n = 22016).
p < 0.05, **p < 0.01, ***p < 0.001.
The results of the spatial lag and spatial error regression indicate the following: visible minorities and low-income populations are disadvantaged when it comes to the safe and walkable route-to-transit index; those between the ages of 15 and 24 are at an advantage; and those aged 65 and over have no significant advantage (Table 6). The z-values indicate that the socioeconomic conditions of low-income populations make them less likely to have access to safe and walkable route-to-transit stops. As far as the road risk indicator is concerned, visible minorities, low-income populations, and people aged 65 and over are overexposed to risk. Once again, low-income populations are those who experience the most road safety hazards along their walking routes to transit stops. The walkability indicator increases for those aged between 15 and 24, those aged 65 and over, and for low-income population groups; however, it decreases for those who identify as visible minorities. Finally, we observed that the spatial lag and spatial error regression improved our models by decreasing the AIC and the spatial autocorrelation of the residuals.
Spatial Lag and Spatial Error Regression
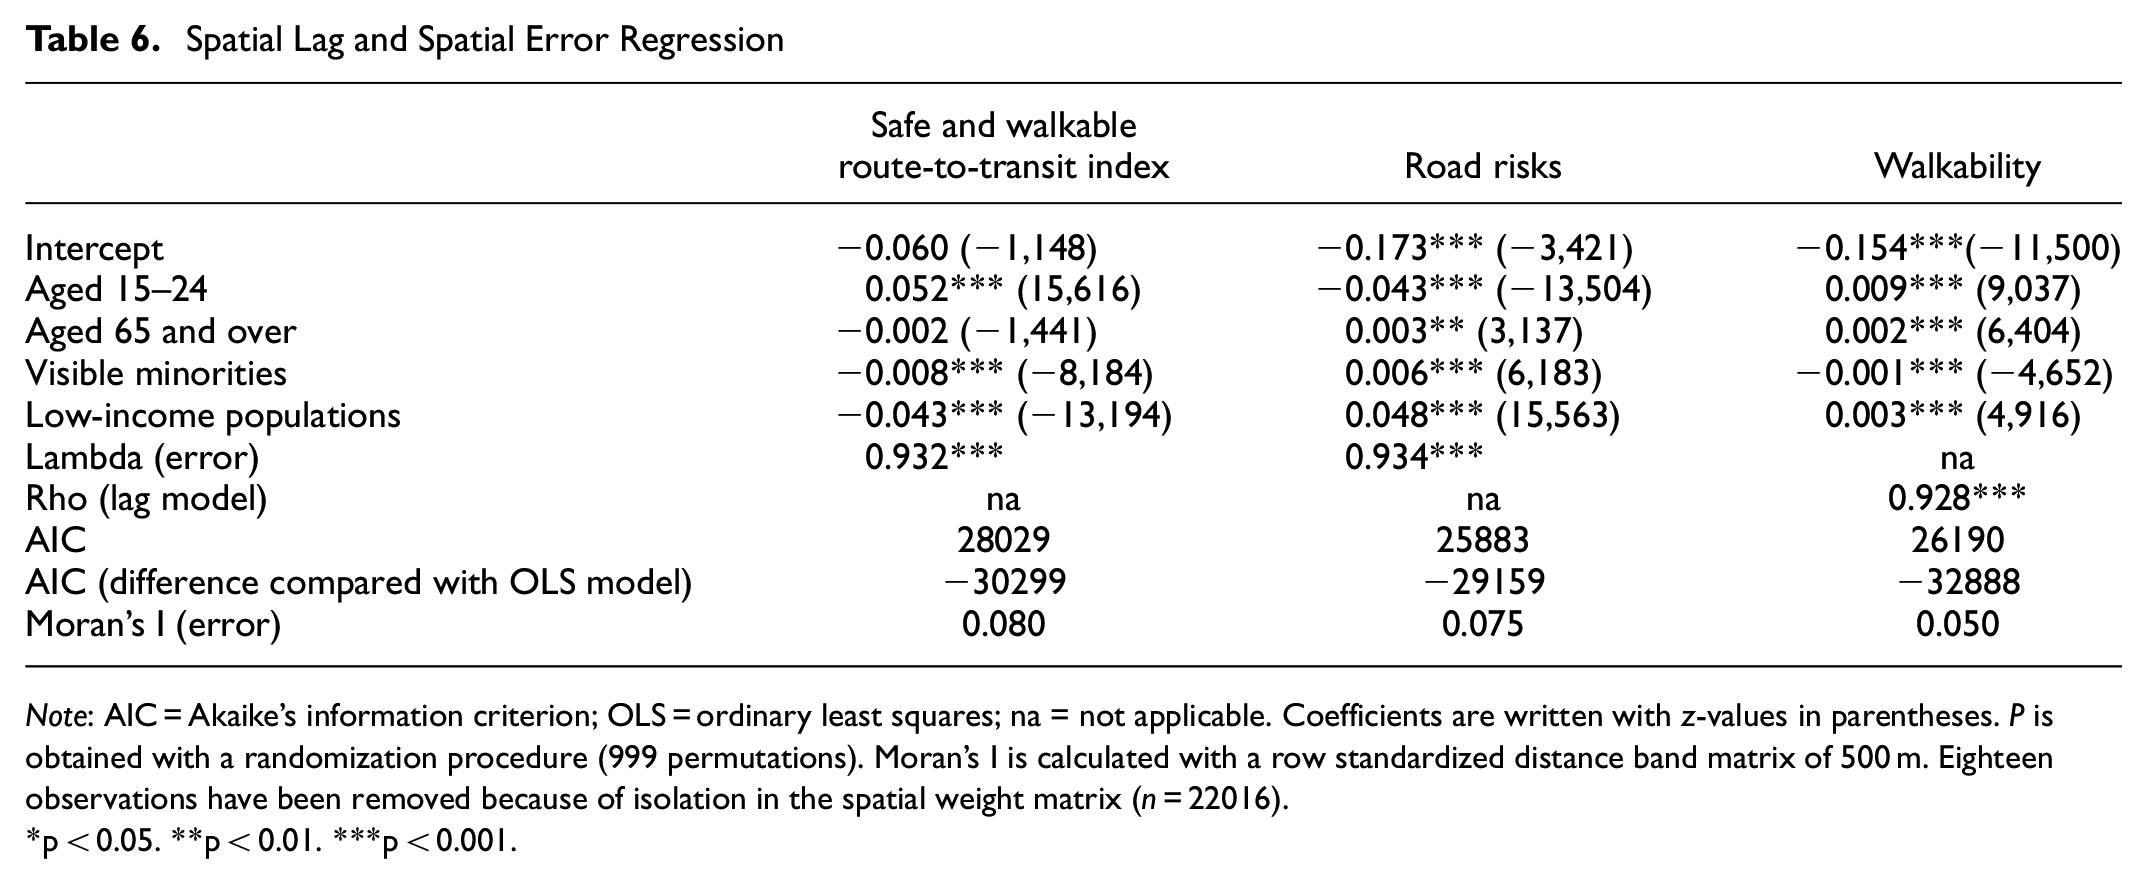
Note: AIC = Akaike’s information criterion; OLS = ordinary least squares; na = not applicable. Coefficients are written with z-values in parentheses. P is obtained with a randomization procedure (999 permutations). Moran’s I is calculated with a row standardized distance band matrix of 500 m. Eighteen observations have been removed because of isolation in the spatial weight matrix (n = 22016).
p < 0.05. **p < 0.01. ***p < 0.001.
Discussion
This paper examines the walkability and road risk in the first mile/last mile area near transit stops through the creation of a route-to-transit index measuring safe and walkable routes. Using an environmental equity approach, we found that individuals who identify as visible minorities have a less walkable route to transit, but low-income populations, people between the ages of 15 and 24, and people aged 65 and over lived in areas with a better walkability score for accessing transit stops. These surprising results for the three latter populations are in line with studies conducted by Bereitschaft ( 70 ) in the 106 most populous U.S.A. metropolitan statistical areas, where he found a positive association between socially vulnerable urban populations and neighborhood walkability. However, Bereitschaft ( 70 ) reported a significant intermetropolitan variation in access to walkable space, which suggests that in some U.S. metropolitan areas, populations that were highly socially vulnerable were less likely to live in a walkable neighborhood. On the other hand, Doiron et al. ( 71 ) found that when applying both the material and social deprivation index, high walkability was more common in the least deprived areas. That said, it is important to keep in mind that in comparison with our research, this study does not address an entire metropolitan area, but rather the city of Montréal only. In addition, it does not specifically address the route-to-transit stops. Finally, our results also show that three out of four of the population groups studied faced more road risks on their walking route to transit stops. Similarly, Roll and McNeil ( 39 ) reported that in Oregon, race and income were positively correlated with pedestrian injuries even after controlling for traffic exposure and built environment factors. Stoker et al.’s ( 44 ) literature review highlights the overexposure of elderly and low-income populations.
In addition, our results indicate that most walkable transit stops also have a higher road risk. This is consistent with the literature, because higher walkability scores are associated with more accidents involving pedestrians ( 72 , 73 ). Moreover, the study conducted by Miranda-Moreno et al. ( 74 ) in Montréal demonstrates that having built environments that increase walkability is also associated with more pedestrian activity, which often translates to increased exposure to risk and, potentially, more collisions involving a pedestrian. These authors suggest that safety strategies and actions are needed to mitigate this effect, and as the literature has shown, these strategies are now lacking in disadvantaged areas ( 33 , 34 , 38 ).
Research Limitations
To the best of our knowledge, our article adopts an innovative approach by combining walkability and road risk in an index to capture what is happening near transit stops, specifically in the first mile/last mile zones. However, there are still certain limitations to our results. First, although it is common among studies using a walkability index to proceed with z-standardized variables because of different metrics ( 75 ), this can also be viewed as a limitation. It should also be noted that we normalized the dependent variables in the spatial regression models. Another limitation can be observed in the analysis of extreme quantiles. As noted by Carrier et al. ( 64 ), who also used this statistical test, the first and the last quintiles are arbitrary thresholds that do not necessarily reflect the largest concentration of vulnerable populations. We chose this test because of its widespread use in the literature but could instead have opted for spatial segregation indices to identify the extreme concentration of vulnerable population groups surrounding transit stops. Further research is needed to examine walking routes to transit, particularly in spatially segregated neighborhoods.
Conclusion
The experience of walking to transit plays a critical role in the use of public transportation. Having a safe and walkable environment for this part of the trip is even more important for vulnerable population groups, who depend more heavily on public transportation. The aim of this paper was to evaluate first mile/last mile walkability and road risks in the Montréal metropolitan area using an environmental justice approach. Using a spatially sound method, we determined that areas where more people identify as visible minorities are disadvantaged as far as walking-to-transit routes are concerned and that areas with higher proportions of people on low incomes and people aged 65 and have more walkable environments but also have to deal with more road risk.
Moving forward, it would be relevant to use other walkability methods, such as walk-along interviews or on-site walkability audits, to address these issues. This would enable complementary information on the walking trip to access transit stops to be gathered, for example, subjective experiences and the mapping of microscale walkability features. Our work assists in obtaining a better understanding of pedestrian issues within the first mile/last mile zone, and this is important for ensuring better mobility equity as well as a shift toward more sustainable transportation modes such as walking and public facilities.
Footnotes
Acknowledgements
We thank Mathieu Rancourt (database) and Kristy Larreynaga-Mejia (maps) for their work.
Author Contributions
The authors confirm contribution to the paper as follows: study conception and design: M.-S. Cloutier and P. Brodeur-Ouimet; data collection: Philippe Brodeur-Ouimet; analysis and interpretation of results: P. Brodeur-Ouimet; draft manuscript preparation: P. Brodeur-Ouimet and M.-S. Cloutier. All authors reviewed the results and approved the final version of the manuscript.
Declaration of Conflicting Interests
The author(s) declared no potential conflicts of interest with respect to the research, authorship, and/or publication of this article.
Funding
The author(s) disclosed receipt of the following financial support for the research, authorship, and/or publication of this article: This research was part of a joint project with Trajectoire Québec and was supported by a grant from Mitacs (project # IT28692).
The views expressed here are those of the authors and do not necessarily represent those of the sponsoring agencies.