
Abstract
Effective incentive strategies have played a major role in the electrification of on-road vehicles. Similar approaches to the off-road sector will be needed to continue decarbonizing the transportation sector. Estimating cost-effectiveness with given incentive funds is crucial to successfully develop and implement financial incentive strategies. Because of the lack of cost information for electric off-road equipment, forecasting cost-effectiveness of electrifying the off-road fleet is not feasible. We developed cost projection models for major components of off-road equipment and combined them into an equipment cost simulation tool. This simulation tool was then used to estimate NO x , particulate matter, and CO2 emission-based cost-effectiveness when diesel off-road equipment is replaced with equivalent electric equipment. Use of the developed cost-effectiveness framework in developing incentive strategies was also demonstrated. Finally, a sensitivity analysis was conducted to address potential variations of the assumptions made for projecting the cost of components and the resulting cost-effectiveness estimates. The framework demonstrated in this paper will inform governmental inventive funding programs to design the most cost-effective strategies, considering equipment vocation, model year, and usage.
Keywords
Recent times have seen the increasing popularity of passenger electric vehicles (EVs), with medium- and heavy-duty segments showing trends in the same direction. These trends only make the slower pace of electrification for off-road equipment more apparent, as this sector remains a major polluter in transportation. Electric equipment is often seen as incapable and expensive. This paper focuses on the expense issue, assuming a case where electric equipment reaches performance parity with diesel equipment, but costs more. Traditionally, incentivization has been employed to induce the adoption of new, expensive technology; a case in point is passenger EVs. A study on battery electric vehicle (BEV) incentives in Norway showed that up-front price reductions, such as tax and value-added tax (VAT) exemptions, were an effective motivation for consumers to choose BEVs ( 1 , 2 ). Around 3400 Norwegian BEV owners participated in the survey leading to this outcome ( 1 ), and 80% of them quoted such exemptions as a critical factor in their BEV adoption. European countries such as Denmark, Sweden, France, and the U.K. all provide some form of incentive for EV purchase ( 3 ). EVs have been highly incentivized in China since 2009 ( 4 ). In the U.S.A., incentives have been an important factor to provide significant impetus to the EV market ( 5 ). Following those footsteps, several incentive programs have been initiated to proliferate the use of cleaner technologies in the off-road sector. The U.S. state of California offers multiple such incentives. The Funding Agricultural Replacement Measures for Emission Reductions (FARMER) program of the California Air Resources Board (CARB) has been funding agricultural equipment such as tractors, pump machines, and heavy-duty trucks ( 6 ). CARB’s Clean Off Road Equipment Voucher Incentive Project (CORE) incentivized specific zero-emission off-road freight equipment ( 7 , 8 ). They also host the Carl Moyer program, which funds replacing, repowering, and retrofitting older, heavy-duty diesel vehicles and equipment to reduce emissions with the cleanest technologies available on the market. Carl Moyer funds a wide range of off-road projects, including construction, agricultural, cargo handling, marine engine, locomotive, and ship-side shore power. Moreover, Carl Moyer also funds select on-road categories as well as eligible infrastructure procurement for clean energy transportation ( 9 ). The Surplus Off-Road Opt-In for NO x (SOON) program of the South Coast Air Quality Management District (South Coast AQMD) provided funding assistance to large fleets to purchase commercially available low-emission heavy-duty engines, oxides of nitrogen (NO x ) exhaust retrofits, repowers, or equipment replacements ( 10 – 12 ). The San Joaquin Valley Air Pollution Control District (SJVAPCD) in California offers funds for replacing mobile, self-propelled, off-road equipment with diesel engines rated at 25 horsepower (Hp) or greater. The funding amount is determined by the equipment type and Hp. For eligibility, the replacement equipment need to satisfy additional requirements for regional operation as well as emission standards ( 13 ). SJVAPCD also has a trade-up program specifically for agricultural tractors that grants funding based on application type and Hp ( 14 ). There is thus a raft of incentives available for adopting zero-emission technologies in the off-road equipment sector. However, there is hardly any capable commercial electric equipment that can be acquired by utilizing these grants. Because of this, when funding electric equipment, the incentive programs have been restricted to certain categories. For example, FARMER funded electric utility terrain vehicles (UTVs) having a maximum Hp of 25, and the electric equipment Carl Moyer managed to fund are cargo handling equipment.
The incentive programs require deliberate designing to focus on certain equipment types and sizes. They also have certain criteria, which applicants must meet to be eligible for funding. As mentioned earlier, these include operation and emission clauses. However, these can only be determined after the focus group (e.g., equipment type, size, etc.) is identified. To determine the group, the cost-effectiveness of incentive acts as a major decision variable. It basically shows the efficacy of an incentive program to achieve its goals. If emission reduction is the primary objective, then cost-effectiveness shows how much money is spent to achieve a unit of emission reduction. Programs such as Carl Moyer utilize cost-effectiveness to determine the eligibility of certain grant applications, as well as to determine how much funding can be allocated to certain categories based on cost-effectiveness thresholds ( 9 ). To determine the cost-effectiveness of any future incentive in any category, it is necessary to determine the amount of funding required, and the potential outcomes. For example, if an incentive program is designed to replace diesel excavators with electric ones for emission reduction, the incentive cost-effectiveness calculation will require the funding needed to do so, and the potential emission reduction by doing so. However, the requirement of knowing the funding amount beforehand makes it difficult to design incentive programs for off-road equipment. Incentives should be launched for equipment types that will provide the most benefit and, to identify them, cost-effective analysis needs to be done for all equipment types. However, there are very few commercial off-road equipment available currently ( 15 ), and even for the equipment that is available, the price information is often unavailable in the public domain. For many equipment types, electric versions do not even exist. Prototypes exist for some types, but their prices are far too high to extract any meaningful cost-effectiveness analysis. Such an example is the Cat 323F Z-line excavator, which costs almost three times more than comparable diesel-powered equipment ( 16 ). This hinders the development of effective incentive programs, and thus the market loses potential for development, which in turn affects incentive development.
To avoid this cycle of inconvenience, a cost estimation strategy for off-road equipment was developed in this paper that utilized component sizing to provide the funding estimates required to deploy battery electric models for different types and sizes of equipment. These estimated funding amounts were then used for cost-effectiveness analysis of each type and size of equipment, considering corresponding emission reductions. Suggestions were made on possible usage of the developed cost-effectiveness analysis framework in selecting the most favorable equipment types and sizes for incentivization. Furthermore, use of the proposed system for incentive implementation strategies for different equipment types and sizes was also demonstrated. Multiple assumptions were made for component sizing and cost estimation. To address possible changes of assumed values, a sensitivity analysis was also conducted varying 10 input parameters over three values each, resulting in 59,049 scenarios. Sample results from the sensitivity analysis were shown and compared with base-case outcomes. These results recognized the possibility of the assumptions changing to a certain extent, and provided information on the magnitude of change in funding cost-effectiveness should the input assumptions vary.
The methodology and findings presented in this paper can help policymakers in designing effective and efficient incentive programs, aimed at specific equipment types and sizes, focused on attaining specific cost and emission-reduction goals. In addition to equipment type and size selection, this paper shows the calendar year(s) and equipment model year(s) best suited to implement incentives, which would provide crucial information with respect to project timeline and implementation. The sensitivity analysis provides even more information by presenting variation boundaries of the cost-effectiveness values, which can provide additional planning insights. Furthermore, the variables included in the sensitivity analysis essentially identified them as major decision variables in this type of analysis. This information will help future research in this area.
Data
We obtained data on different off-road equipment types, model years, Hp bins, populations, fuel consumptions, and emissions from the OFFROAD2017 model ( 17 ). It is the most comprehensive database of statewide equipment population and activity in California. Table 1 shows the organization of data in OFFROAD2017. For presentation purposes, only the values used in this study are shown; numbers are also rounded up, and examples from different calendar years are shown. Each row shows aggregated emissions in standard U.S. tons per day (tpd), fuel consumption in gallons per year (gpy), and population for a certain equipment type, Hp bin, and model year for each calendar year. In addition, the database reports other emission types, such as reactive organic gases (ROGs), particulate matter with a diameter of 10 µm or less (PM10), sulfur oxides (SO x ), ammonia (NH3), and so forth.
Data Organization in the OFFROAD2017 Model
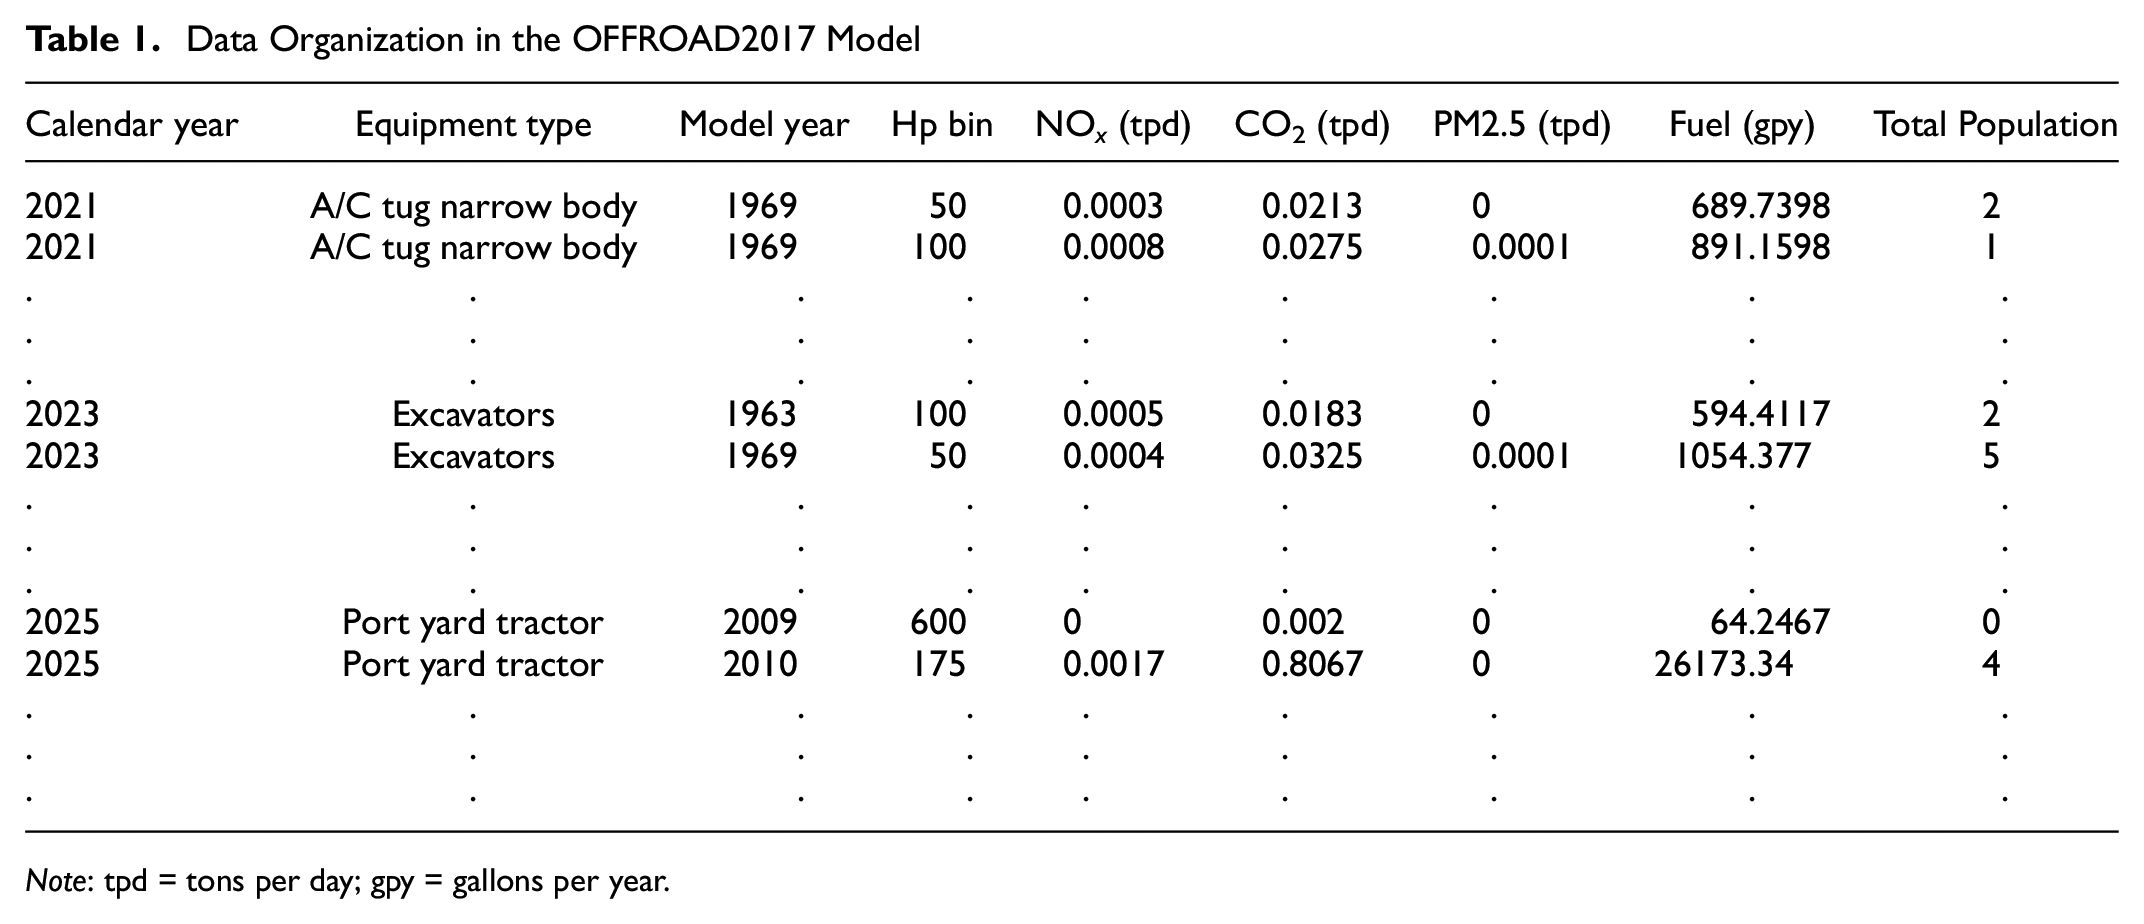
Note: tpd = tons per day; gpy = gallons per year.
A 10-year incentivization project was assumed, aimed at replacing diesel equipment with battery electric equipment. The project duration was based on the current EV warranty ( 18 ). Thus, data for 10 calendar years (2021–2030) was obtained from OFFROAD2017. The compiled data was cleaned to remove entries having no Hp bin data or having zero population or activity.
Methodology
Two parameters are essential for calculating the cost-effectiveness of incentive funding: the required funding amount and the potential benefits of that funding. A funding estimation model was developed for obtaining the first parameter. As mentioned in the first section, emission reduction is generally considered as a benefit of incentive funding. Thus, for the second parameter, we determined potential reductions in emissions. Using these two parameters, funding cost-effectiveness was finally calculated. This section describes detailed methodologies for this whole process.
The funding amount was considered as the cost difference between a diesel and an equivalent battery electric equipment. As battery electric equivalents for most of the off-road equipment types were not commercially available, and as most of the available ones were in prototype stage and/or without any pricing information, a component-based cost estimation methodology was formulated. This approach estimated the component costs of BEVs (electric motor, battery, additional EV systems) and of the internal combustion engine (ICE) powertrains they would replace (diesel engine and fuel tank) in a pre-transmission drop-in replacement strategy, as shown in Figure 1. The motor would provide the exact same power previously delivered by the engine. This approach was adopted on multiple occasions as a primary step to electrify construction equipment ( 19 ), as it achieves electrification of both drivetrain and hydraulics, and serves well to conduct preliminary feasibility analysis such as battery sizing. The charging infrastructure cost was not considered in this study, as the charging mechanism for off-road equipment is still not clearly defined.
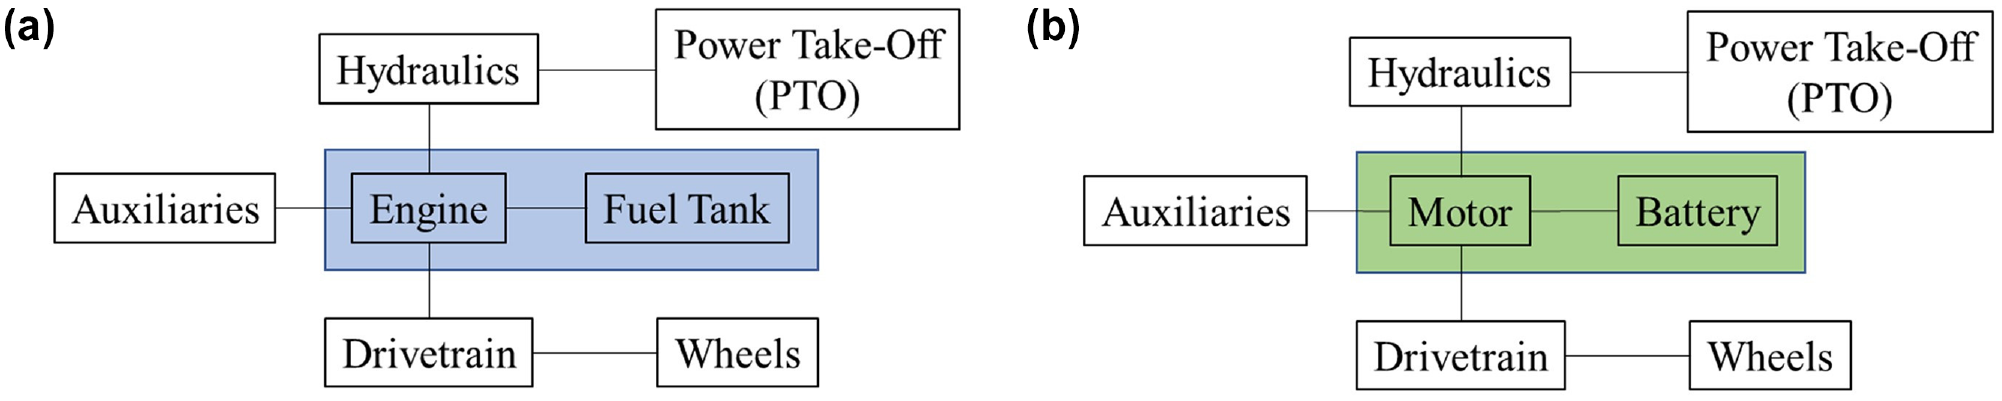
(a) General architecture of construction equipment (adapted from [ 20 ]). (b) The single-motor pre-transmission drop-in replacement considered in this study. A motor powered from a battery pack was considered to replace the engine and the fuel tank, keeping everything else the same.
For the components, available per-unit costs were gathered from the literature. For each equipment type and Hp bin, components were sized according to corresponding calendar and model years. The sizes were then used with per-unit costs to estimate component costs. The component sizing and cost estimation methods are detailed in the next few sections.
BEV Component Costs
Battery
From OFFROAD2017 data, it was observed that equipment were typically used less as they became older (their fuel consumption decreases as the calendar year progresses). Therefore, it can be construed that the newly purchased equipment under any funding program will be the most used, and will not necessarily be used at the same level as the old equipment it will replace. The proposed method thus assumes the new replacement equipment to be used the most, contrary to the assumptions used in existing funding programs such as the Congestion Mitigation and Air Quality (CMAQ) Improvement Program and FARMER Program ( 21 , 22 ). Based on this assumption, the following methodology was formulated.
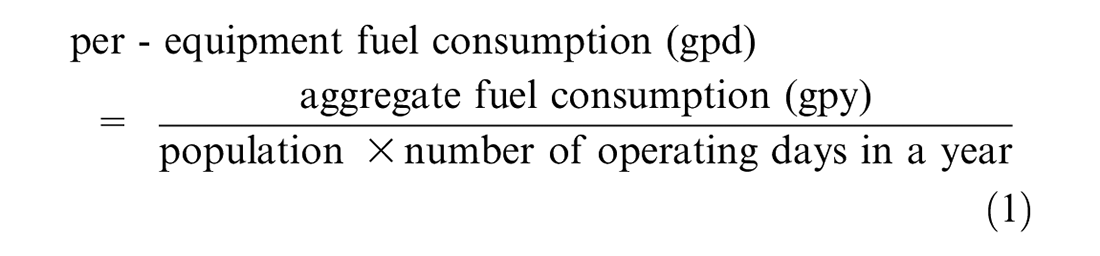
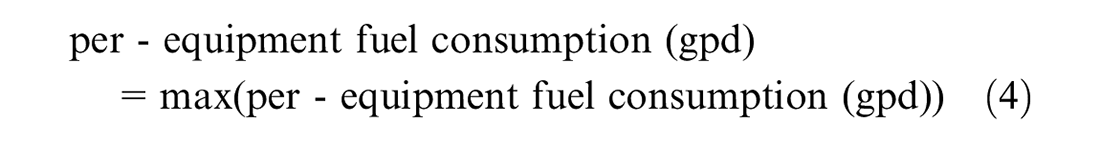
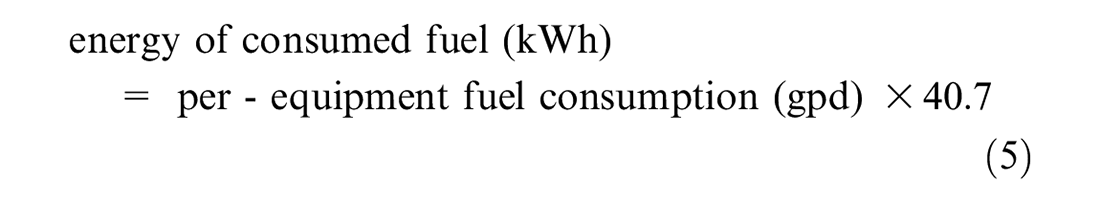
Battery size was derived from the daily energy needs of the corresponding equipment. For the energy needs of each equipment type in each calendar year, Hp bin, and model year, the fuel consumption data from OFFROAD2017 was used. OFFROAD2017 provides this data in gallons per year (gpy) for the entire model year population. Gallons per-day (gpd) fuel consumption for a single piece of equipment was derived from this data for each equipment type in each calendar year, Hp bin, and model year. Then, the maximum of the per-equipment daily fuel consumption values was taken to determine the maximum energy consumption of that bin. Now, diesel engines convert a fraction of the consumed fuel energy to meet the energy demands of the equipment. This fraction is the engine efficiency. For battery electric equipment, this fraction of energy needs to be delivered by the battery, and thus this is taken as the standard battery size for each bin. The battery sizing procedure is described in the following:
The OFFROAD2017 dataset is based on survey activity data, reported on an annual basis. This is a key limitation, and supplemental instrumented data is needed. Baker ( 23 ) appears useful here, by providing information on the data collection of 70 pieces of off-road equipment across 12 types. It lists the duration of the data collection period and the number of days each piece of equipment operated in that duration. For each piece of equipment, the percentage of operating days within the data collection duration can be calculated from Equation 2:

This gives the percentage for each piece of equipment. However, to use this percentage in the large dataset of OFFROAD2017, where far more equipment types exist, a general percentage value is needed, which can be achieved by using aggregated values for the number of operating days and data collection duration from all 70 pieces of equipment regardless of type, and then using those values in Equation 2. With more data, it is possible to further increase the accuracy of this result. Researchers at the University of California, Riverside (UCR), previously collected data from 35 pieces of off-road construction equipment. Using that data along with Baker ( 23 ) gives the percentage of operating days as 51%. The number of operating days in a year can now be calculated using this value, using Equation 3:

Considering 365 days in a year, the number of operation days finally came out as
For the base-case analysis, the engine efficiency was considered as 35%. This value was chosen as a conservative baseline; the existing literature on off-road engine efficiency suggested values as low as 39% ( 25 ). Motor efficiency was obtained from the motor efficiency map of the UQM PowerPhase 145 heavy-duty electric motor, sourced from the powertrain simulation software Autonomie ( 26 ). The motor can operate at different efficiencies based on different operating conditions. For the base-case analysis, the minimum efficiency value of 72% was considered.
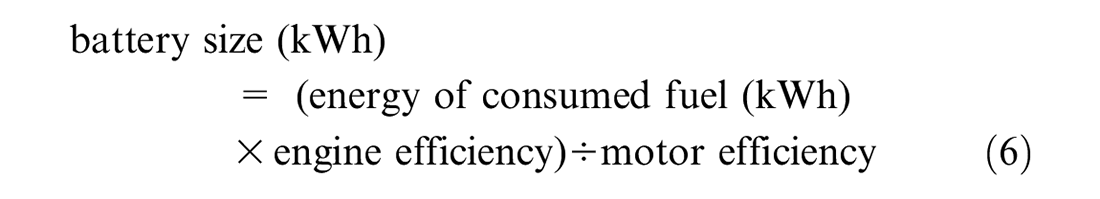
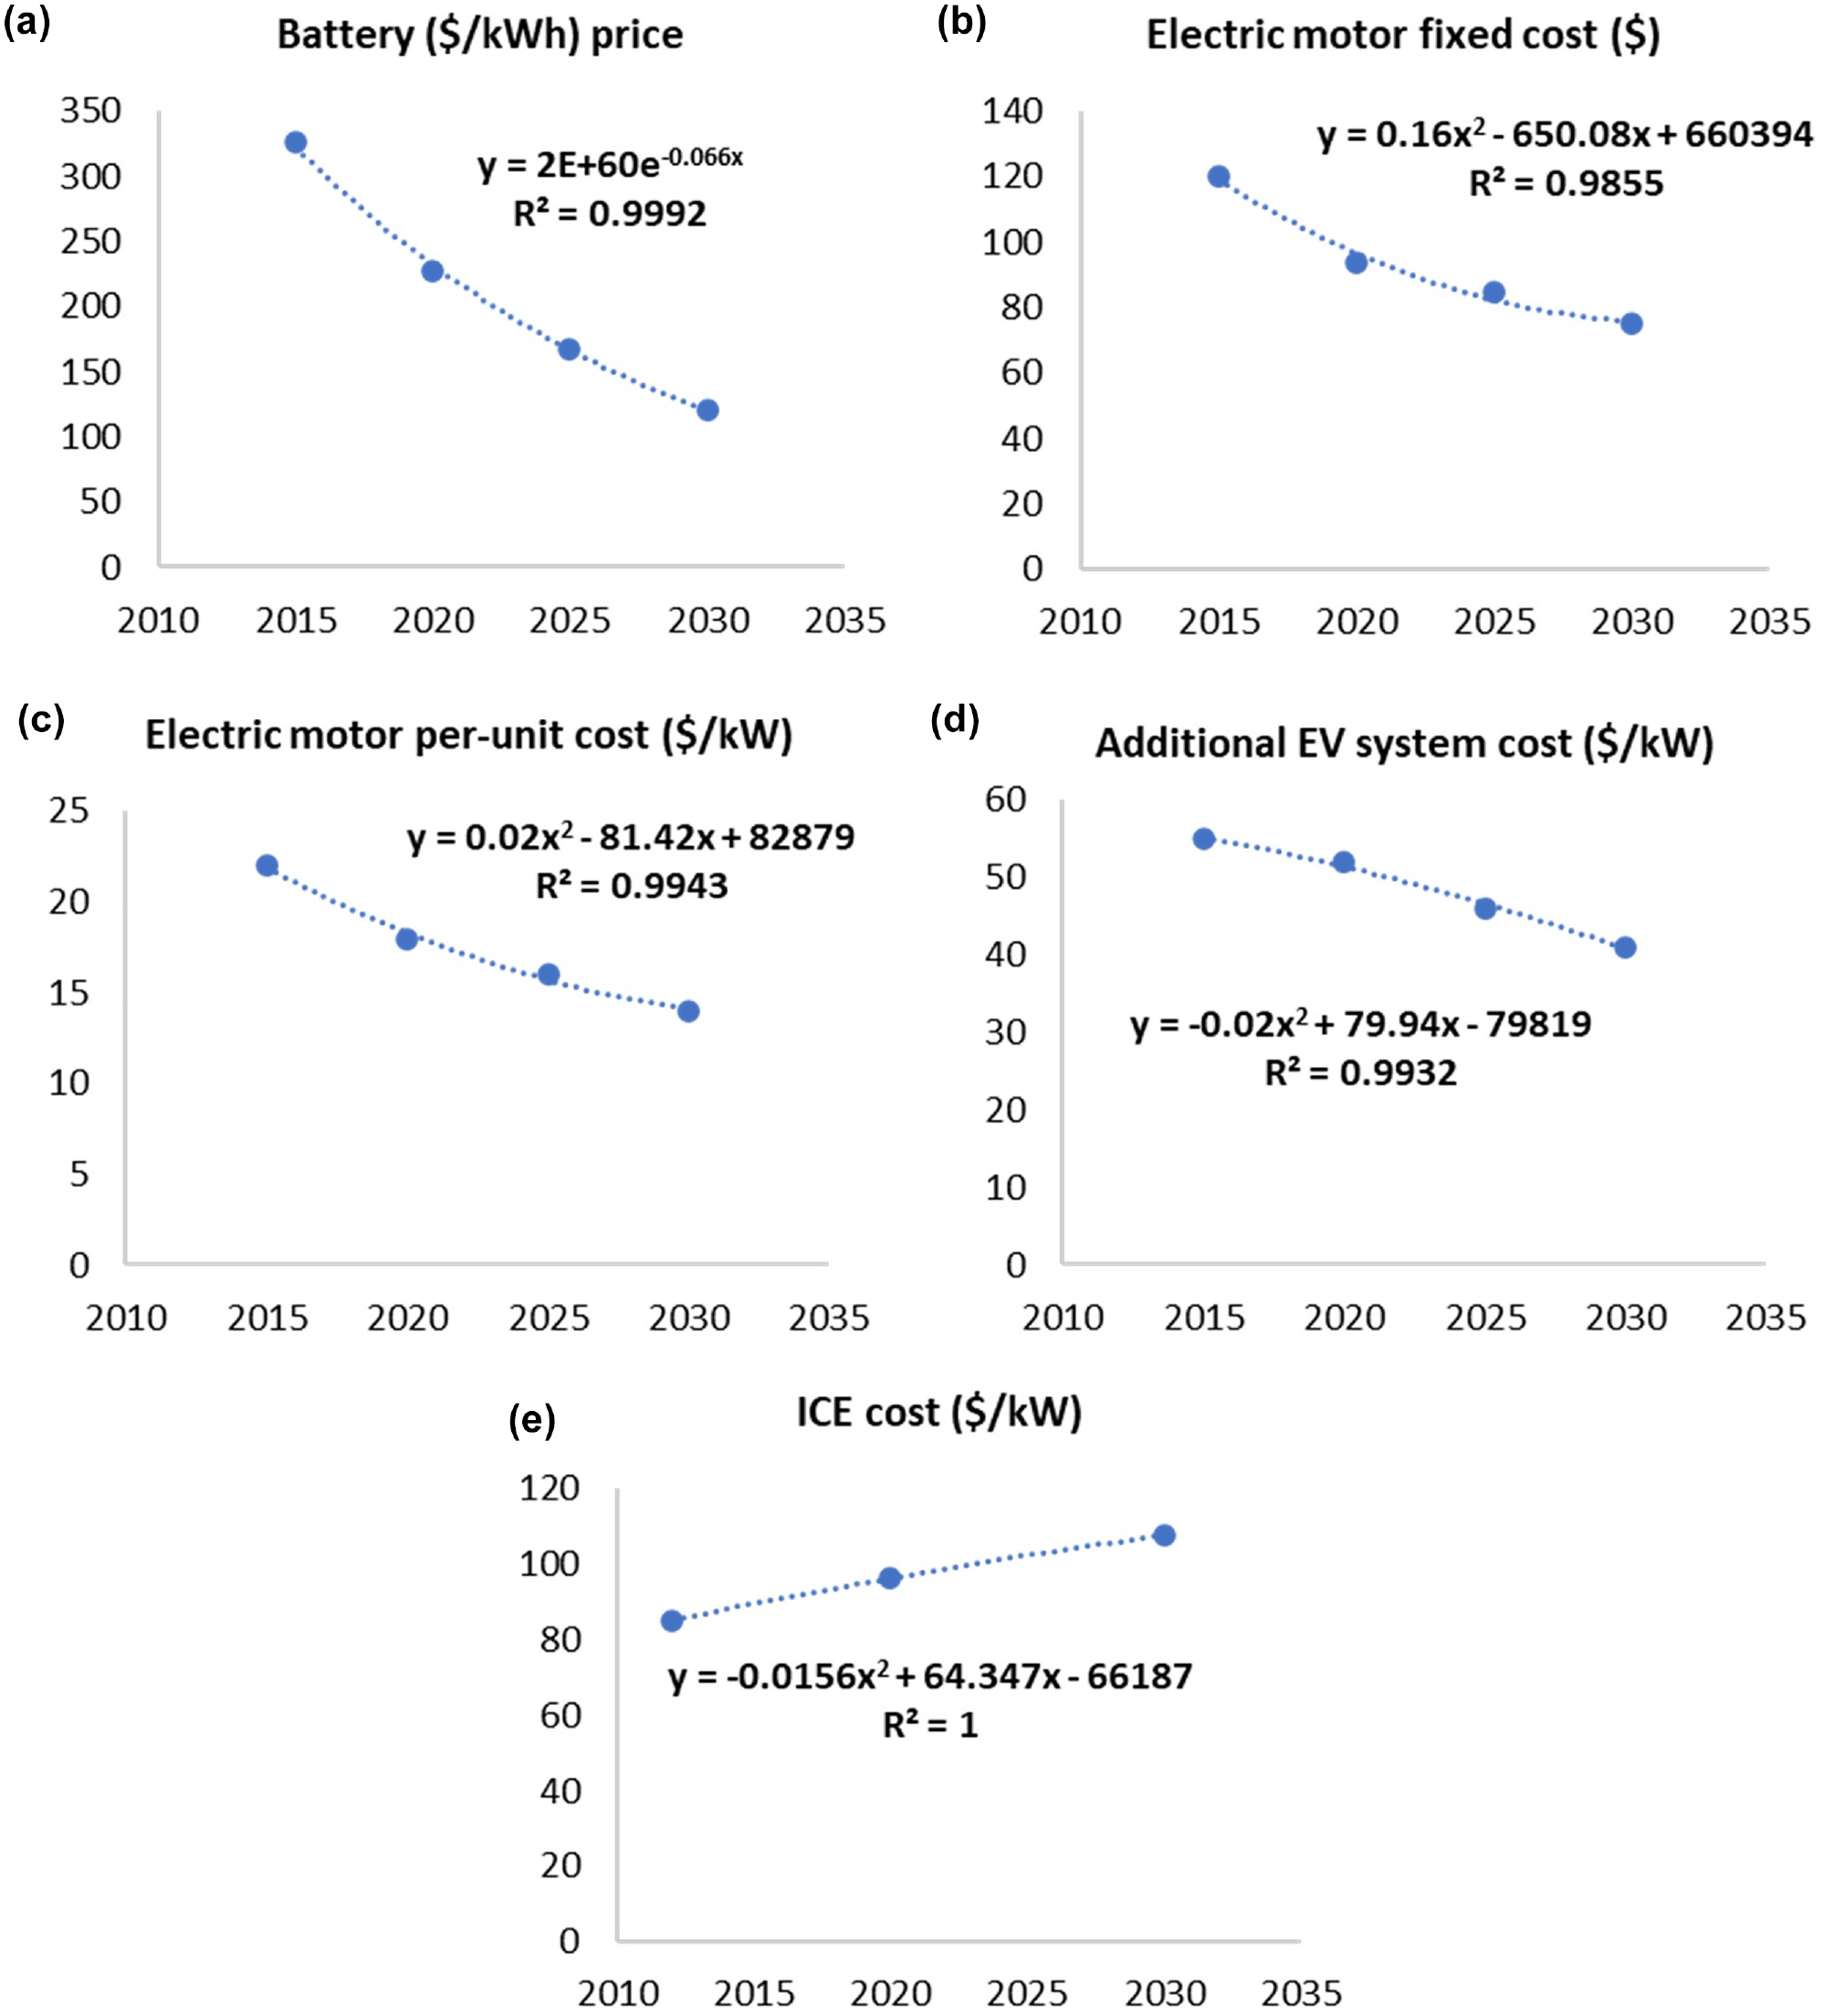
To calculate the battery cost, the per-unit battery cost (US$/kWh) was obtained from the literature ( 27 ). As shown in Figure 2a, it is projected to decrease over the next several years. Using the best trendline equation (with the best R2), the per-unit battery cost in each calendar year in the analysis window (2021–2030) was obtained, and all the corresponding battery costs were calculated from the battery size determined by Equation 6 using the following formula:
Motor
The replacement battery electric equipment was specified to have the same motor power as the corresponding Hp bins listed in OFFROAD2017. Motor ratings in kW were obtained from the Hp bin values from the following equation ( 27 ):

Two components of the motor cost were found in the literature ( 27 ): the fixed cost and the per-unit cost. Both were dependent on the calendar year and were projected to decrease (Figure 2, b and c ). The best trendline equations were used here as well to get the costs for each calendar year. The following equation then gave the motor cost based on the motor size:
Additional EV Systems
The costs of additional EV systems, such as controllers and converters, are dependent on the kW ratings ( 29 ), which were taken from the determined motor ratings. The literature provided a calendar year dependent per-unit cost (Figure 2d), which was used to get the additional EV system cost using the following equation:
Advanced Engineering Cost
The BEV component costs were based on on-road vehicles. It was assumed that for implementing these components in off-road equipment, additional engineering efforts would be required. These efforts could be needed for adapting the components to different vehicle structures, weatherproofing, enhancing ruggedness, and so forth. There could also be some research and development costs to manufacture EV components that are fully capable of serving off-road equipment. Integrating power take-off (PTO) components could also increase the cost. Because of these, an advanced engineering cost was added to incorporate these additional considerations into the cost estimation.
where
Total EV Component Cost
The total EV component cost was determined using all the EV-related costs, as shown in the following equation:
ICE Vehicle Component Costs
Internal Combustion Engine
The per-unit ICE cost by calendar year for diesel engines is shown in Figure 2e. The cost was expected to increase over time because of new technology integration, primarily to meet stricter regulations on exhaust after-treatment ( 28 ). The best trendline equation was used to obtain per-unit ICE costs for each calendar year. The ICE ratings were obtained from the Hp bin values, and the costs were derived using the calendar year-wise per-unit cost and kW ratings:


Fuel Tank
The fuel tank cost can vary widely based on its volume and target application. Fuel tank cost data for the wide range of equipment types included in this analysis were unavailable. Also, prices available online are primarily for used equipment, and vary widely based on usage, equipment type, and other factors. Thus, a cost of US$482 found in the literature ( 29 ) was used.
Total ICE Vehicle Component Cost
The total ICE vehicle (ICEV) component cost was determined using all ICEV-related costs, as follows:
Cost-Effectiveness of Incentive Funding
The difference in EV and ICEV component costs was assumed as the required funding amount. The assumption was that producing an equivalent battery electric equipment would require replacing the abovementioned ICEV components with EV ones. Thus, the total component cost difference between the two types would be the price premium for purchasing electric equipment in lieu of diesel equipment. It was assumed that this price premium would be covered by incentive funding. Based on this assumption, the required funding amount for each piece of equipment was calculated as follows:
The price premium in reality, however, could be different as manufacturers may include research and development costs, organizational operating costs, profit, and so forth. Warranty and insurance costs could also affect the price. However, as this information was not available, the required funding amount obtained through the stated assumptions was used in the cost-effectiveness analysis of incentive funding.
For each calendar year, OFFROAD2017 provides aggregate tons per-day emissions from each equipment type, Hp bin, and model year. Across calendar years, OFFROAD2017 emissions account for the changing equipment population of different model years, changes in the level of activity (operating hours) for equipment of different model years, and higher emission factors (grams per operating hour) for older equipment. For the cost-effectiveness analysis, emission values are required in tons per year, which were calculated from the tpd values using the following equation:
where the
Emissions were calculated for three pollutants: CO2, NO x , and PM2.5. These emission values were considered as the amount of emissions reduced by replacing a diesel equipment with a battery electric equivalent.
The cost-effectiveness of incentive funding can now be derived as follows:
where
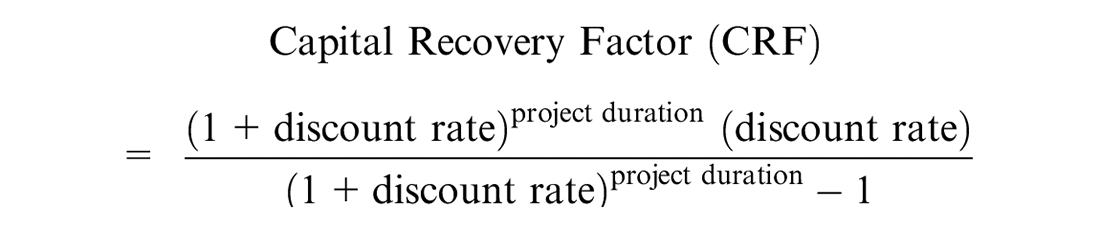
discount rate = 0.01 ( 31 ), project duration = 10 years
Using the three emission-reduction values (CO2, NO x , and PM2.5) resulted in three different cost-effectiveness measures for each of the emission types. This provides the opportunity to determine the effectiveness of incentive funding in reducing specific pollutants.
Results
The developed methodology was applied for 78 equipment types, each with nine Hp bins (25, 50, 75, 100, 175, 300, 600, 750, 9999). The results are available in Un-Noor and Boriboonsomsin ( 32 ) as a spreadsheet tool (Figure 3), which shows these results and additionally allows putting in different values for the input parameters to observe the outcomes based on the developed methodology. As it is not possible to present all the results in this paper, selected examples are provided to illustrate the outcomes of the analysis framework.
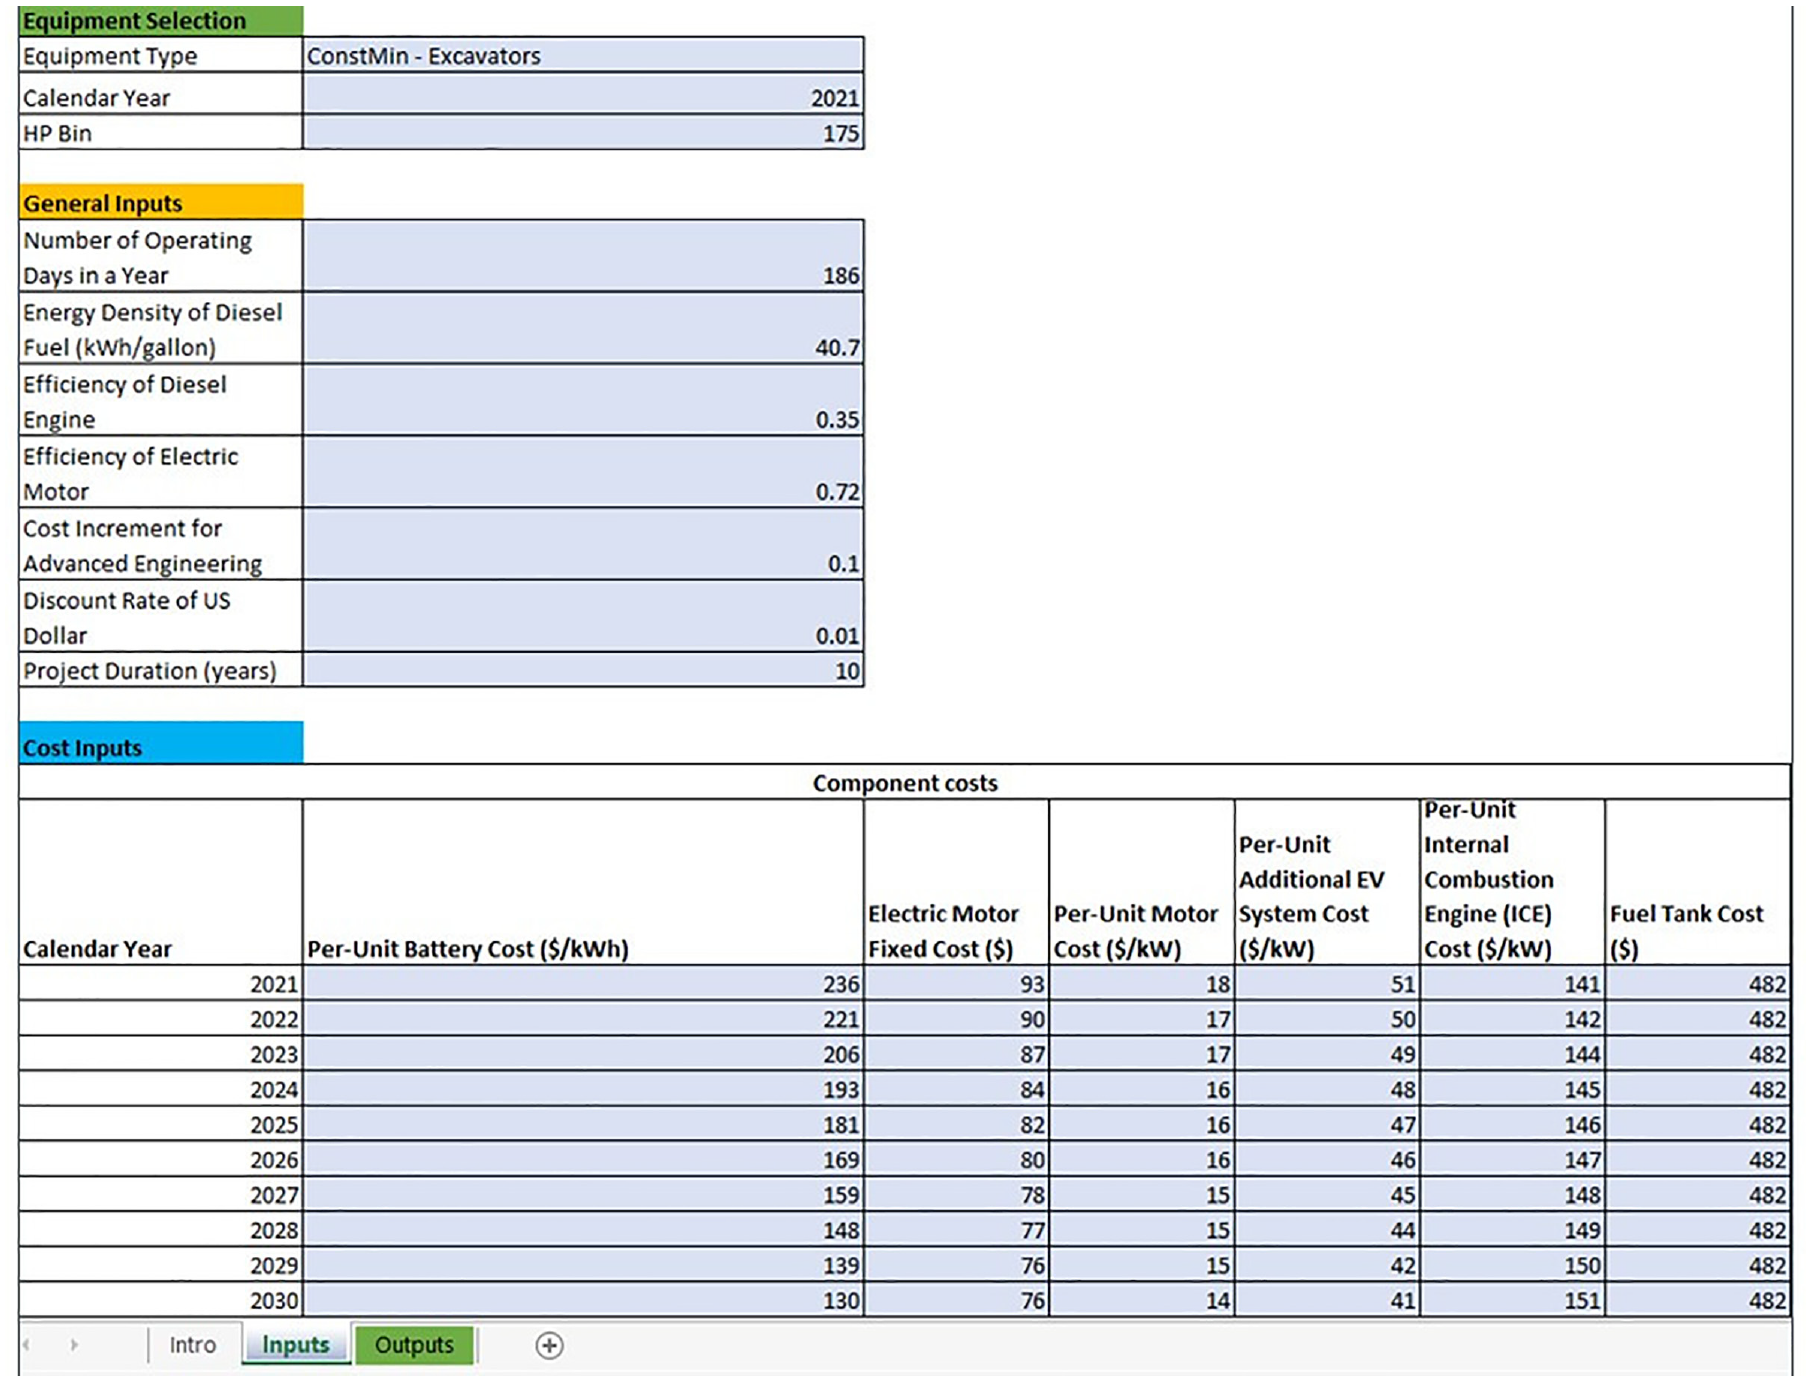
Input sheet of the developed tool; the results appear in the “Outputs” sheet.
Heat maps were created to visualize the results obtained in this analysis. Using these heat maps, it is possible to quickly compare emissions and funding cost-effectiveness across multiple parameters, including equipment type, Hp bin, calendar year, and model year. The heat maps can be generated for the following:
each equipment type;
each model year in each calendar year;
individual emissions of CO2, NO x , and PM2.5;
replacing a single piece of equipment as well as the whole equipment population.
Examples of heat maps of emissions and funding cost-effectiveness are shown and discussed in the following sections.
Emissions
For an example case of replacing excavators in the 175 Hp bin from calendar years 2021 to 2030, heat maps of the three emission types are shown in the following two figures. Figure 4 shows emissions from a single piece of equipment across the 10 calendar years, broken down by model year. Figure 5 shows emissions from the whole population of excavators in the 175 Hp bin. There are multiple model years of equipment for a certain type and Hp bin, in a certain calendar year. This is shown for calendar year 2021 in Table 1. The figures are essentially matrices where calendar years are placed along the Y-axis and model years along the X-axis. The color in each cell represents the amount of emissions produced by the equipment of the corresponding model year in the corresponding calendar year. For certain cells, the emission values are absent in OFFROAD2017. These cells are colored white. For example, there is a series of white cells on the upper right of every heat map. This is because 2022 is the latest model year available in calendar year 2021. Similarly, 2031 is the latest model year available in calendar year 2030.
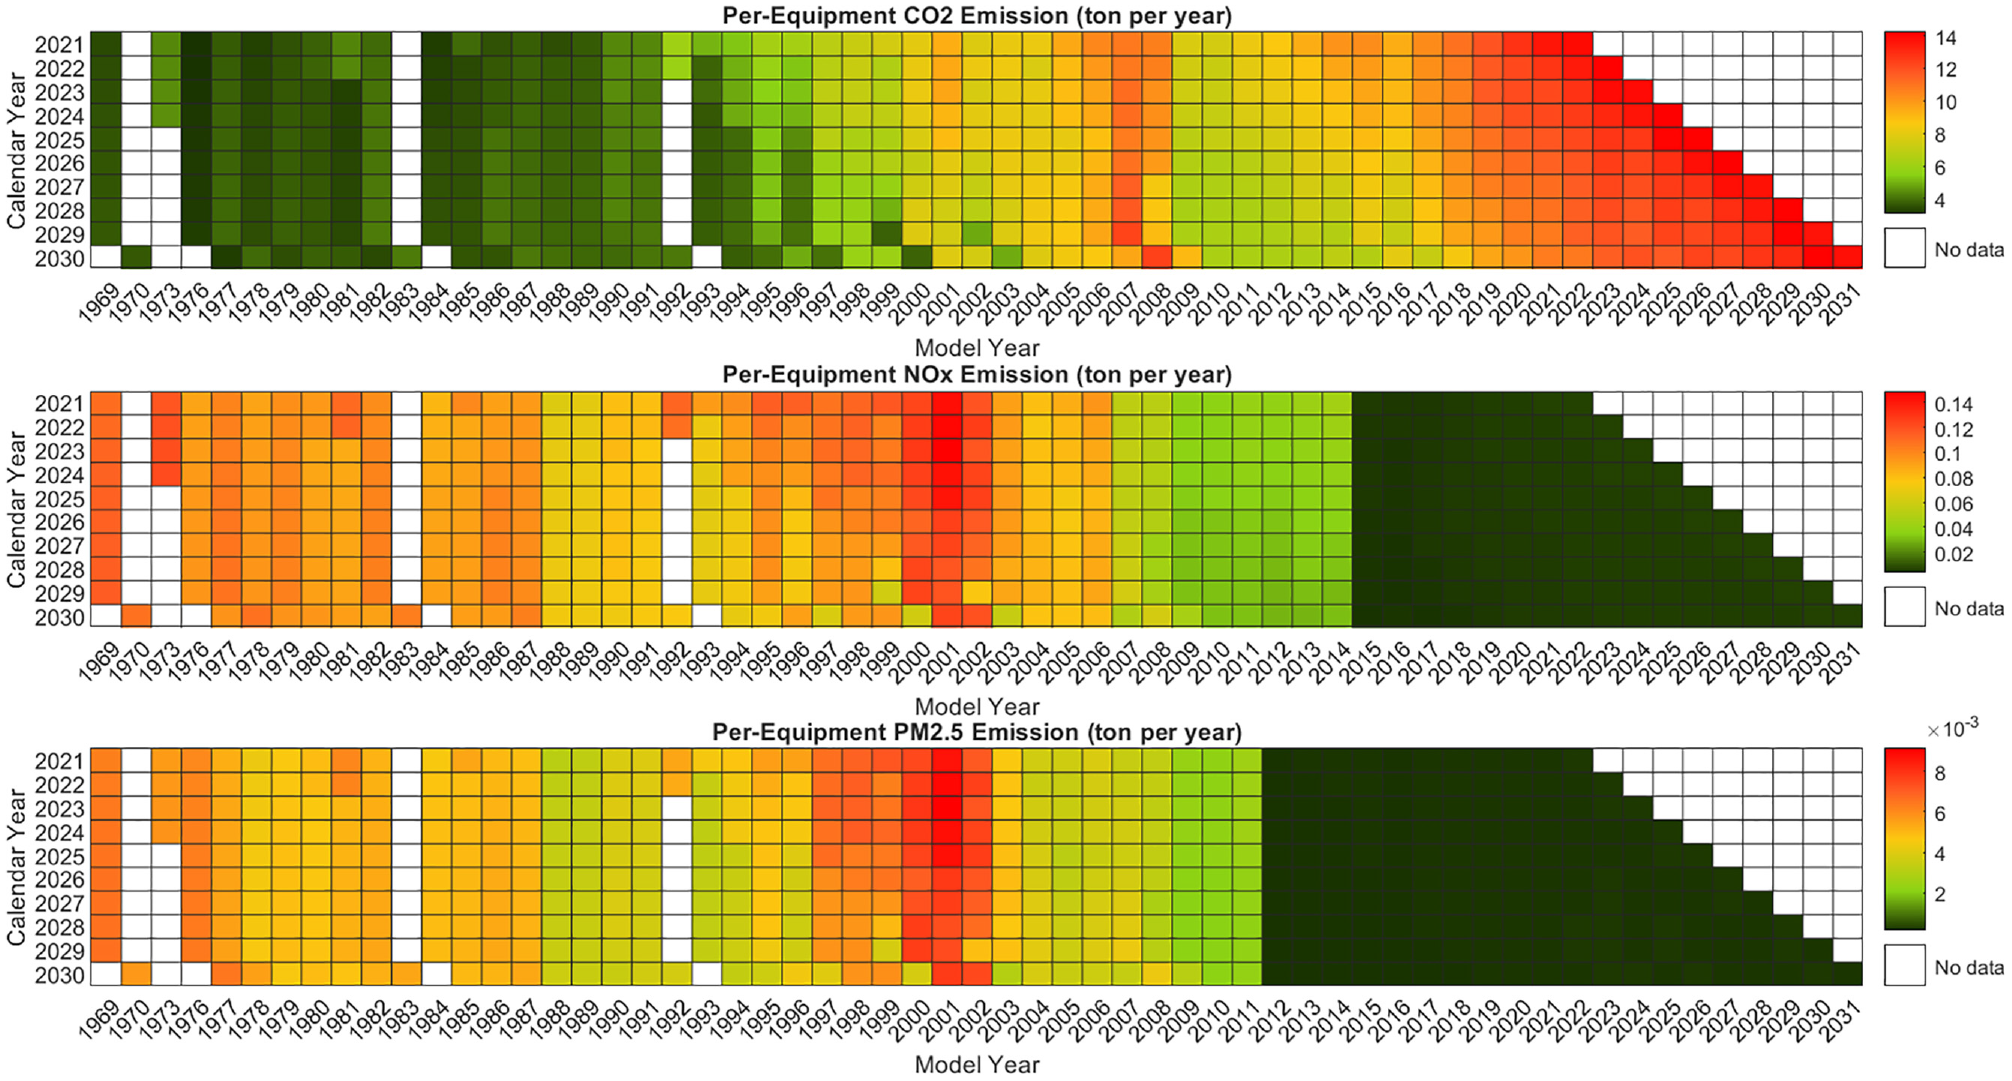
Per-equipment emissions for excavators in the 175 Hp bin.
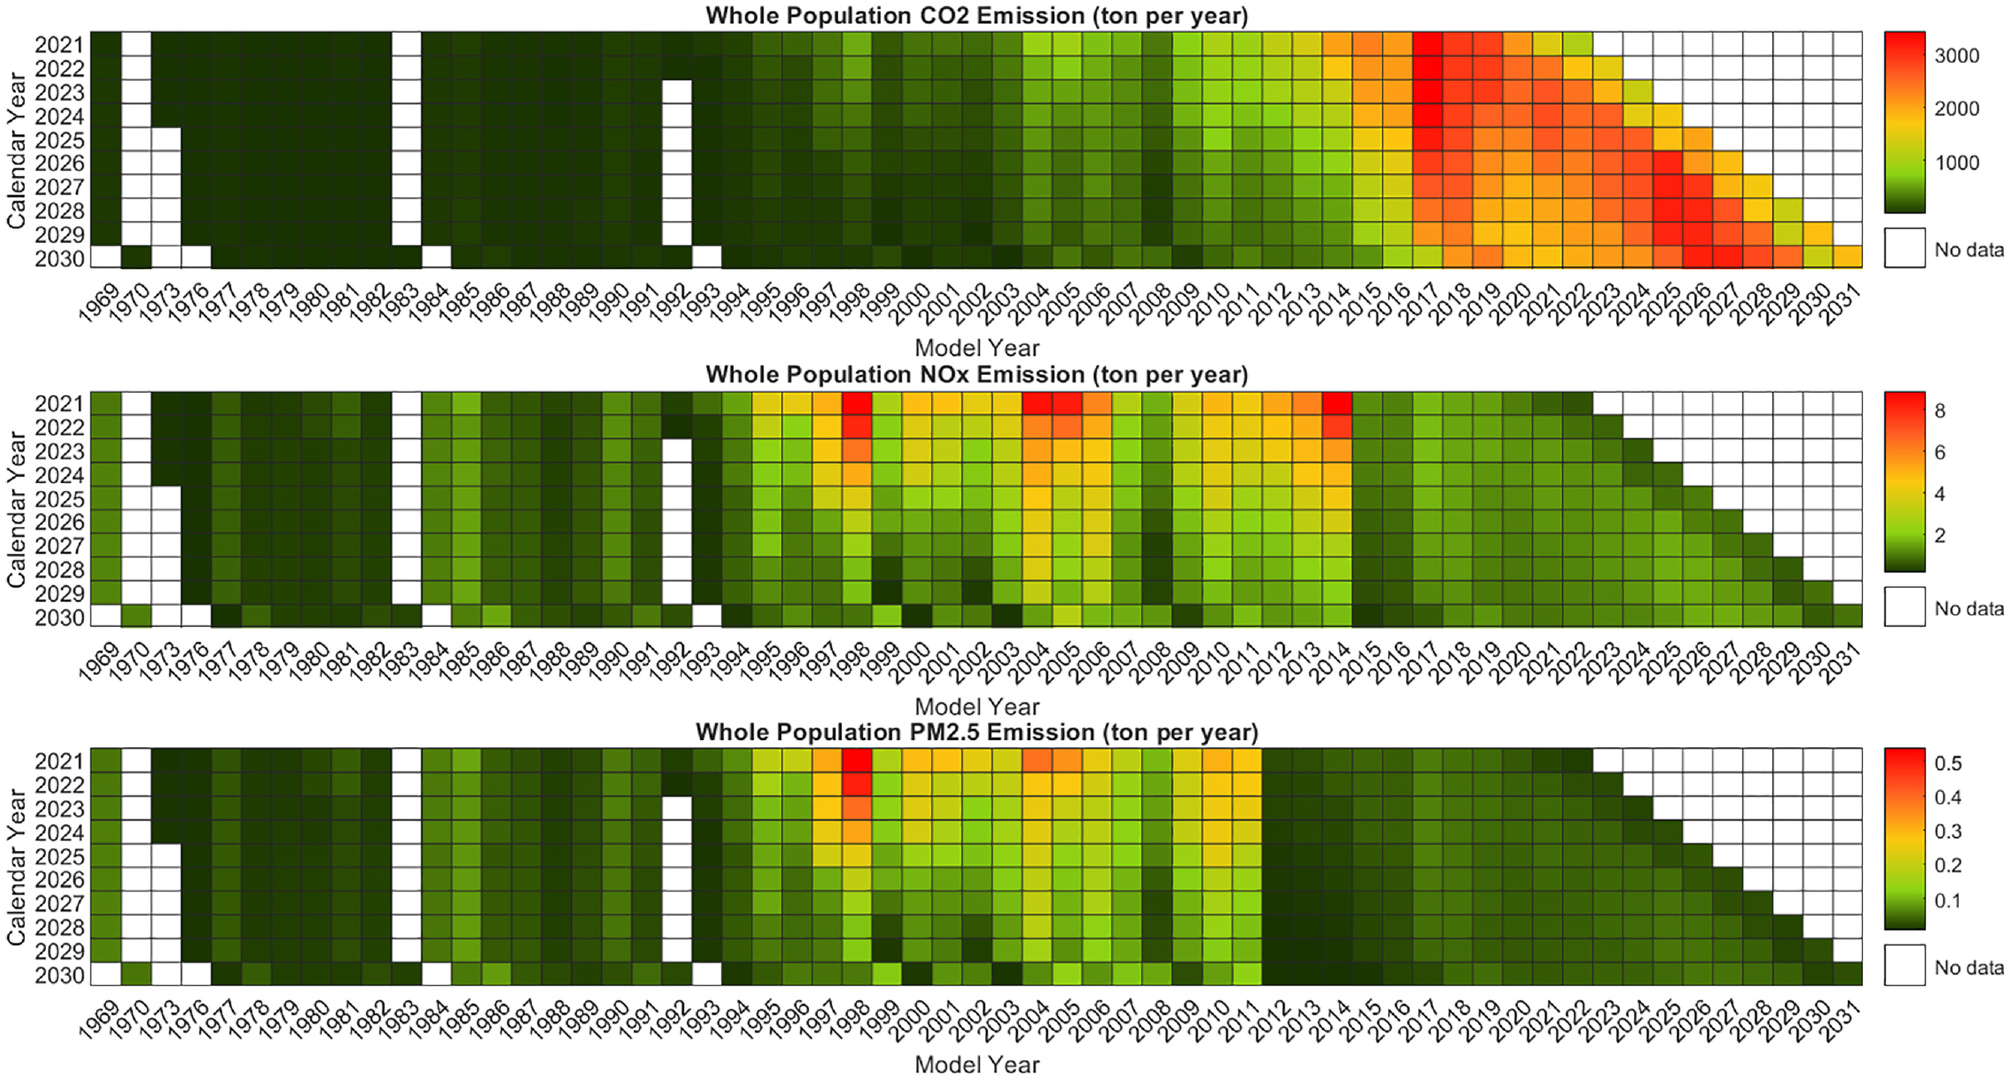
Whole population emission for excavators in the 175 Hp bin.
It can be observed from Figure 4 that for each calendar year, the newer model year equipment generates a higher amount of CO2. This is because of the higher usage of new equipment, resulting in higher fuel consumption and CO2 emission. On the other hand, the newer model year equipment produces less NO x and PM2.5 as it complies with stricter emission standards. Figure 4 shows that CO2 outweighs the other two emissions in quantity.
As the equipment population of different model years is different in each calendar year, emissions from the whole population shown in Figure 5 are different from the per-equipment emissions in Figure 4. The latest model years in each calendar year (e.g., model years 2021 and 2022 in calendar year 2021) tend to have a smaller population than the slightly older model years (e.g., model years 2017–2020 in calendar year 2021). Thus, the newer model year population produces less pollution for all three emission types.
Figures 4 and 5 can be utilized in different decision-making processes. As Figure 4 shows per-equipment emissions, it can be used to determine the amounts of certain types of pollution (CO2, NO x , and PM2.5) caused by certain equipment types and model years in certain calendar years. This can be useful to determine the efficacy of funding a specific number of pieces of certain equipment, or to determine the impact of approving certain grant applications. Figure 5, on the other hand, shows the emissions of whole model year populations. Thus, it is useful while deciding on regulations to phase out certain types and model years of equipment from operation, enforced from certain calendar years.
Funding Cost-Effectiveness
The results of funding cost-effectiveness are presented with similar heat maps. From the funding agency’s perspective, developing an incentive funding program with a fixed amount of funding would require focusing on certain equipment types, Hp bins, and model years. The program timeline should also be determined. With a format similar to Figures 4 and 5, it would be possible to determine the targeted model years and the program timeline, but only if the specific equipment types and Hp bins have already been decided. To select the equipment types and Hp bins, an additional layer of heat map was created for funding cost-effectiveness values, which shows the average funding cost-effectiveness for different equipment types and their Hp bins. An example is shown in Figure 6. In the compiled 10-year OFFROAD2017 data, there were 170 equipment types after data cleaning, and each had multiple Hp bins. Showing all of them in a single figure is not possible. Previous studies showed that among different off-road equipment types, agricultural tractors, excavators, graders, rubber-tired loaders, and tractors/loaders/backhoes are suitable for battery electrification ( 15 , 33 ). Thus, in Figure 6, these five equipment types are shown. Un-Noor et al. ( 15 ) also listed two equipment types not feasible for electrification based on operational data. It showed that a piece of equipment from one of these infeasible types—off-highway tractors—had an Hp rating of 558. Therefore, only the equipment types and the Hp bins determined to be feasible for full electrification according to the mentioned literature are shown. Moreover, as equipment in the 25 Hp bin are outside the scope of heavy-duty equipment, 25 Hp was also not included.
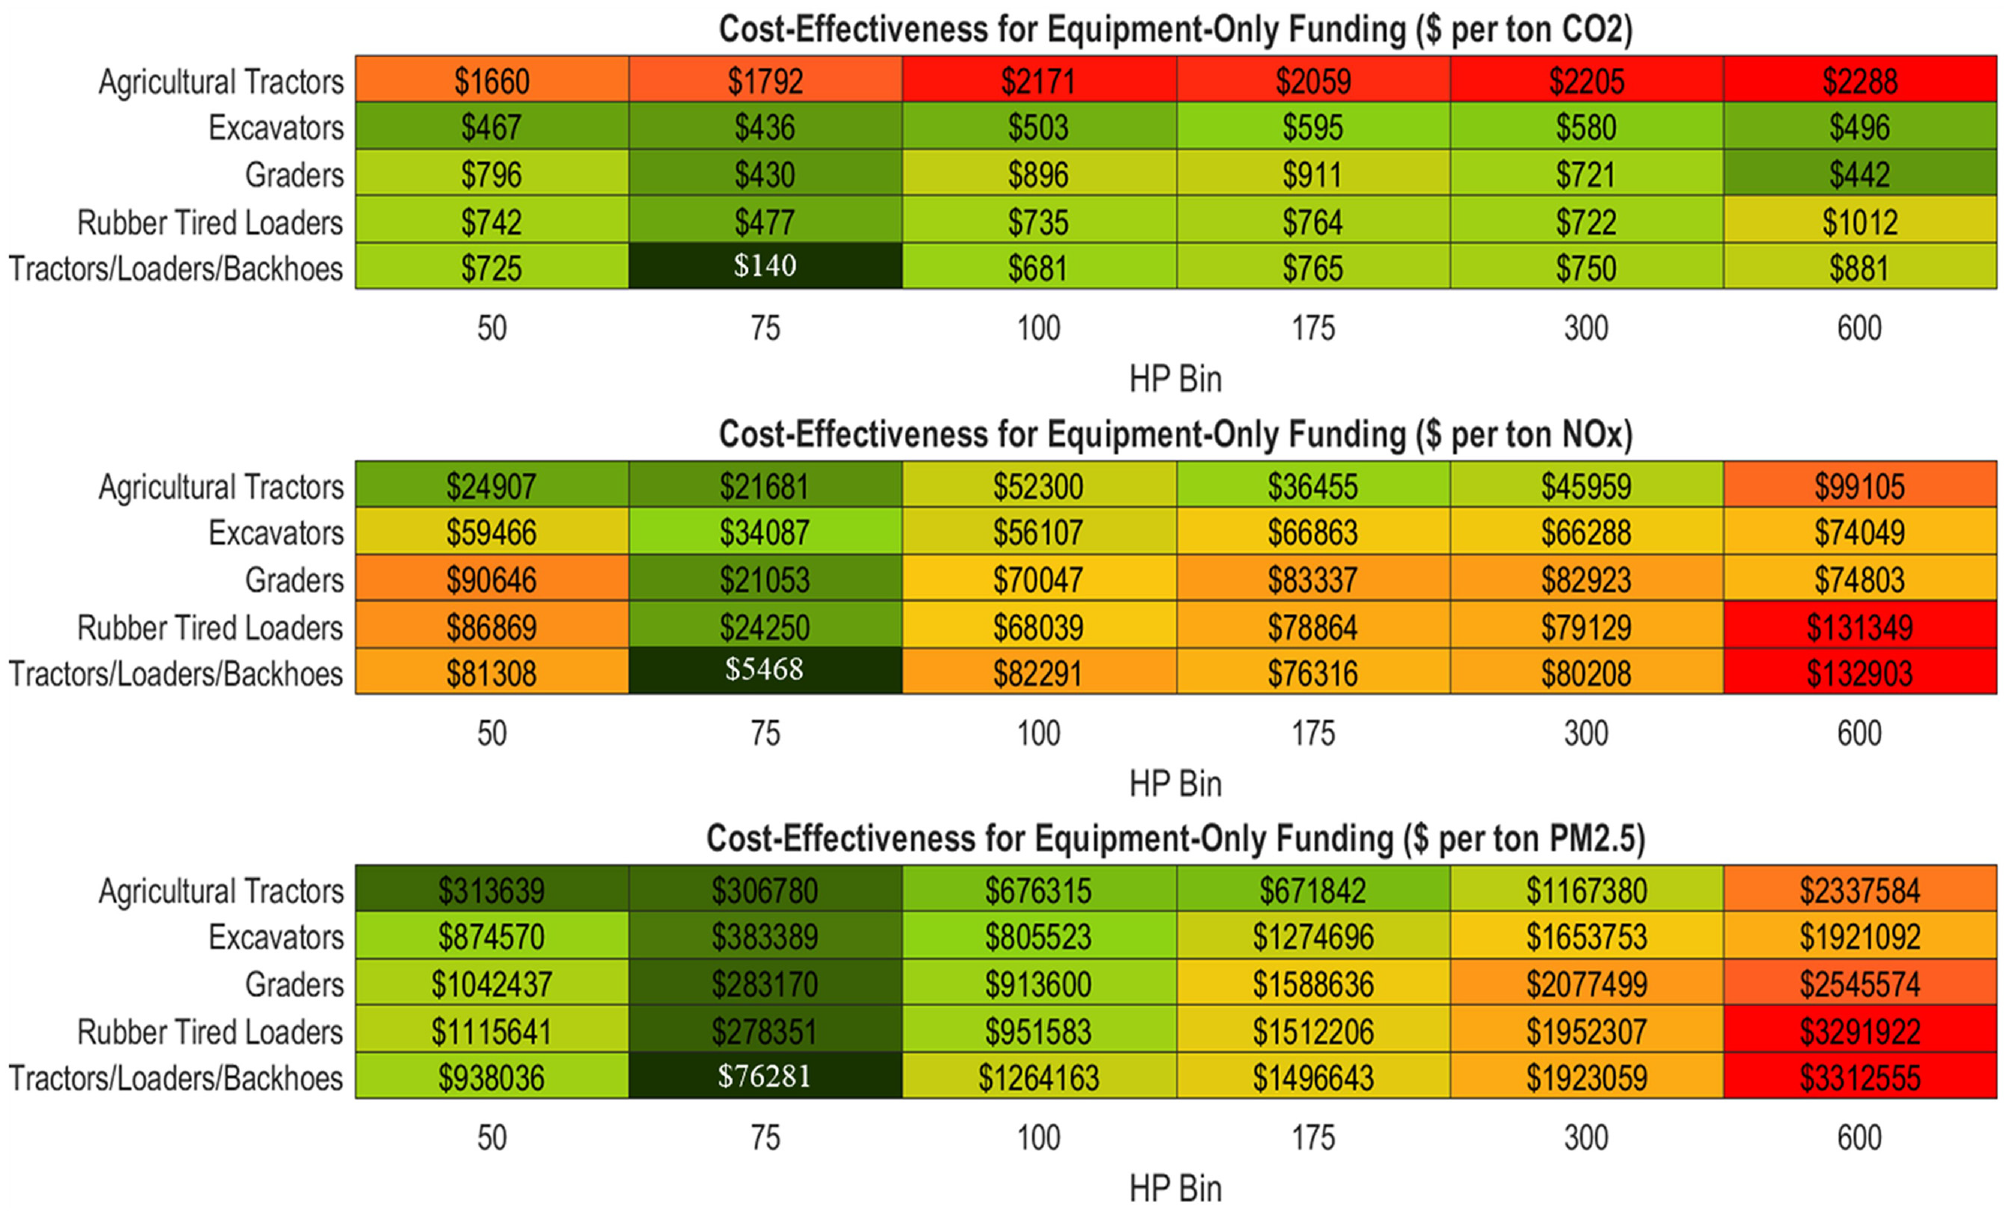
Average funding cost-effectiveness for selected equipment types and Hp bins. Hp bin 75 contains all equipment sizes from 51 to 75 Hp, and so on.
From Figure 6, it can be seen that targeting certain equipment types and Hp bins would be more cost-effective than others, based on their dollars-per-ton values for different emission types. For example, tractors/loaders/backhoes in the 75 Hp bin have the least dollars-per-ton values for all emission types. Thus, funding battery electric replacement of this equipment type and size would be the most cost-effective, on average. Now, with the equipment type and size (Hp bin) selected, the heat maps of funding cost-effectiveness by calendar year and model year can be used to further fine-tune the focus on specific model years in different calendar years.
To be consistent with the emission visualization examples in Figures 4 and 5, we created a heat map of funding cost-effectiveness by calendar year and model year for excavators in the 175 Hp bin, as shown in Figure 7. A quick glance reveals that the cost-effectiveness heat maps appear as opposites of the emission heat maps in Figures 4 and 5. However, the emission and the cost-effectiveness heat maps do not have a strictly inverse relationship as the equipment component costs change with each calendar year rather than remaining constant. The funding amount decreases overall with progressing years, as the EV component costs come down while the ICE cost goes up, as shown earlier.
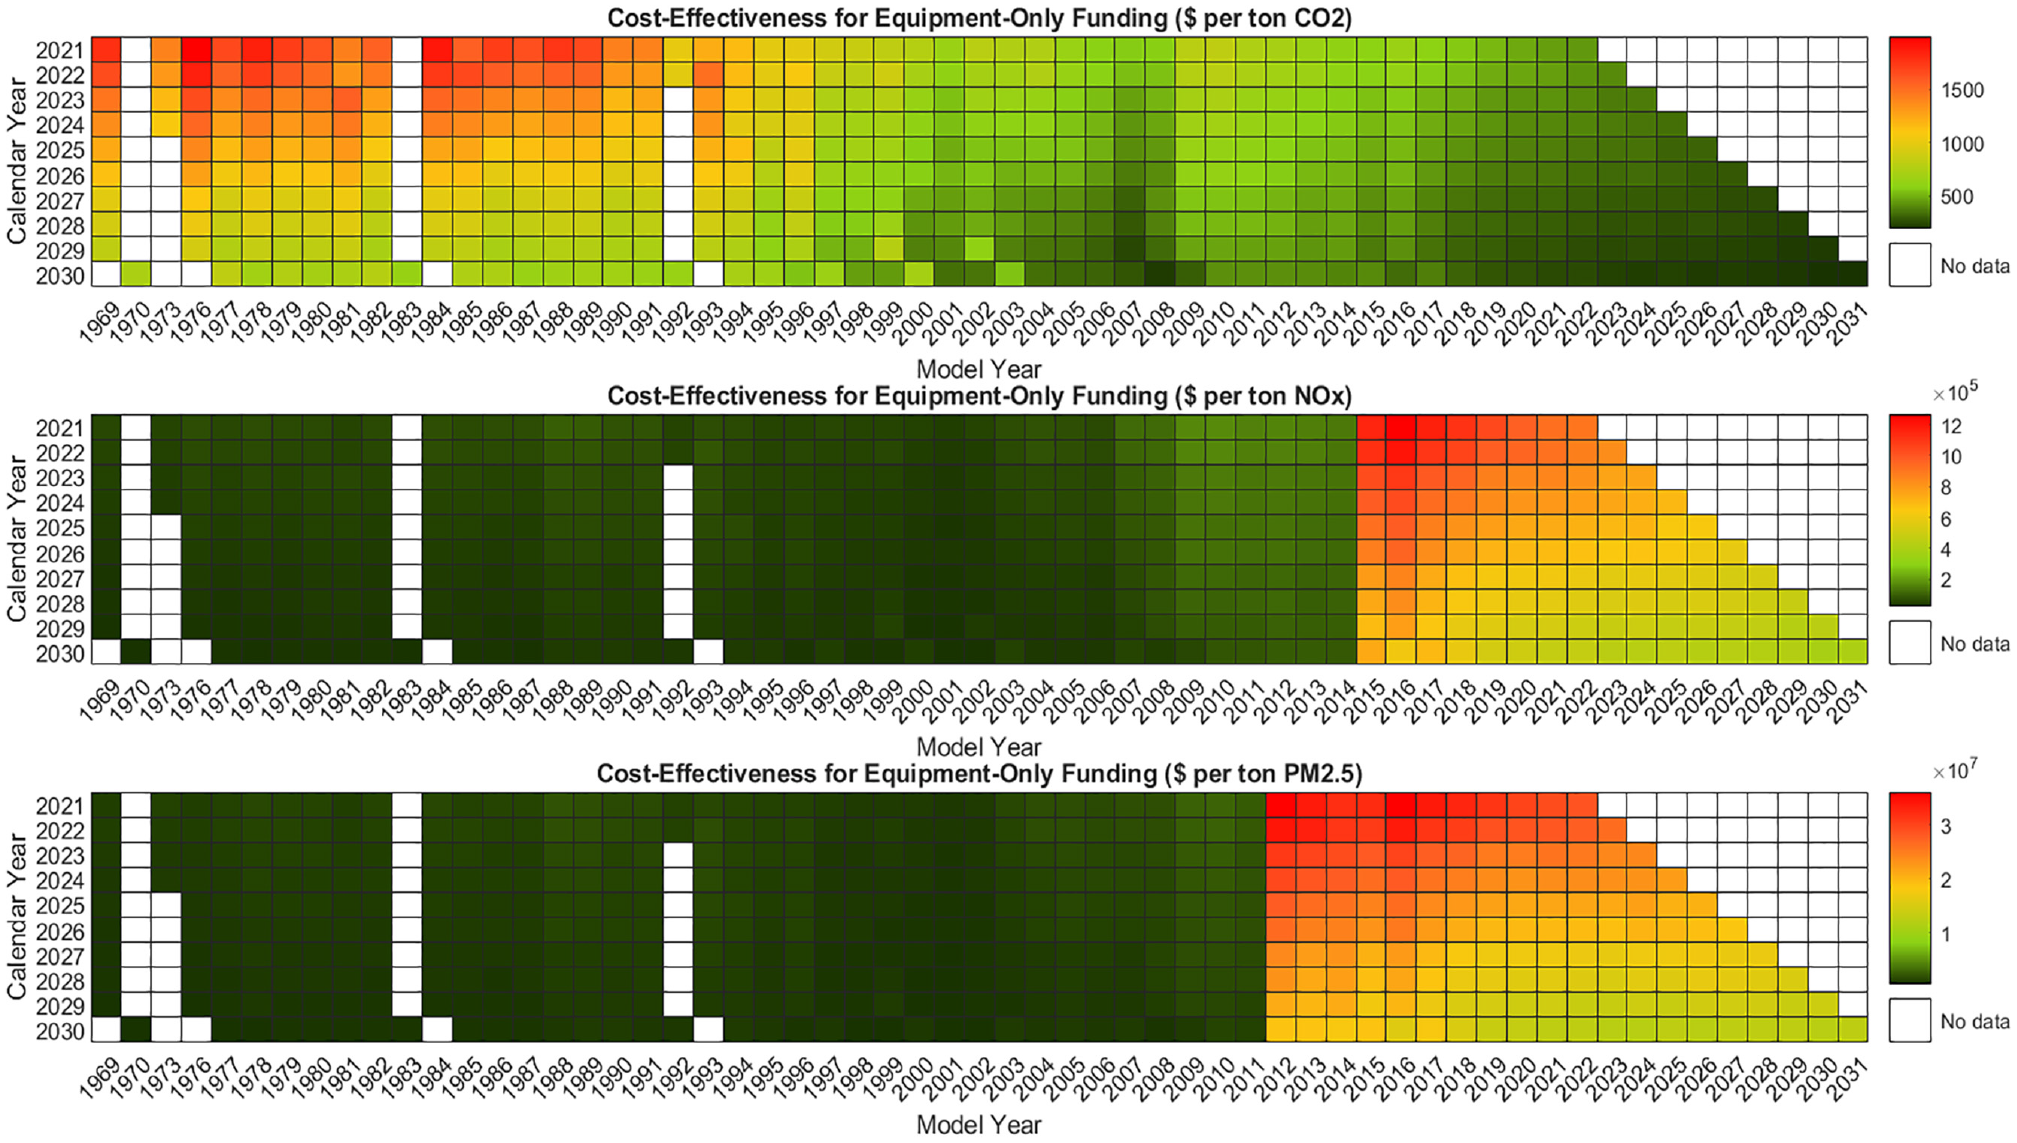
Funding cost-effectiveness breakdown by calendar year and model year for 175 Hp excavators.
Figure 7 shows that for NO x and PM2.5 emission reduction, replacing the older model years in any calendar year would be an effective use of funding dollars. For CO2 emission reduction, however, replacing newer model years would be more cost-effective as they are the main CO2 emitters because of their high usage. It should be noted that equipment replacement considering NO x - and PM2.5-based funding cost-effectiveness can ultimately lead to lowering CO2 emissions as well. This is because the data in OFFROAD2017 shows that the newer equipment gets used the most. If, following the implications of the NO x - and PM2.5-based funding cost-effectiveness statistics, older model year equipment are replaced with electric versions, the electric equipment will become the new equipment—which is likely to be used the most. Thus, this will reduce the use of diesel equipment previously in operation, and will contribute to lowering CO2 emissions. Following NO x - and PM2.5-based funding cost-effectiveness thus supports the conventional wisdom of replacing older equipment, and offers the secondary benefit of reducing CO2 emissions in the process. Also, the variations in the heat maps provide additional considerations in designing the funding strategy. For example, funding the replacement of 1969 model year equipment is more cost-effective for CO2 emission reduction when done in calendar year 2029 instead of 2021. Similarly, the best time for replacing 1999 model year equipment, aimed at CO2 emission reduction, is 2030. Using these heat maps, it is possible to develop highly focused funding strategies by selecting the most cost-effective combinations of equipment types, Hp bins, model years, and calendar years.
The next two figures provide a demonstration of how the strategies can vary based on the equipment type and Hp bin combinations. Figure 8 shows the funding cost-effectiveness heat map for excavators in the 100 Hp bin. As compared to the 175 Hp bin in Figure 7, there are noticeable differences in the NO x -based cost-effectiveness heat map. For the 100 Hp bin, replacing the 2008–2014 model years is not as cost-effective as for the 175 Hp bin.

Funding cost-effectiveness breakdown by calendar year and model year for 100 Hp excavators.
Figure 9 changes the equipment type to graders but keeps the Hp bin the same as in Figure 7 (175 Hp). Funding the replacement of the 2010 model year is markedly less cost-effective here with respect to CO2 emissions, compared to neighboring model years. This is not the case in Figure 7. These examples show how different equipment types and Hp bins can benefit from different funding strategies, tailored specifically for them to achieve the maximum cost-effectiveness by considering the funding objectives and potential outcomes.
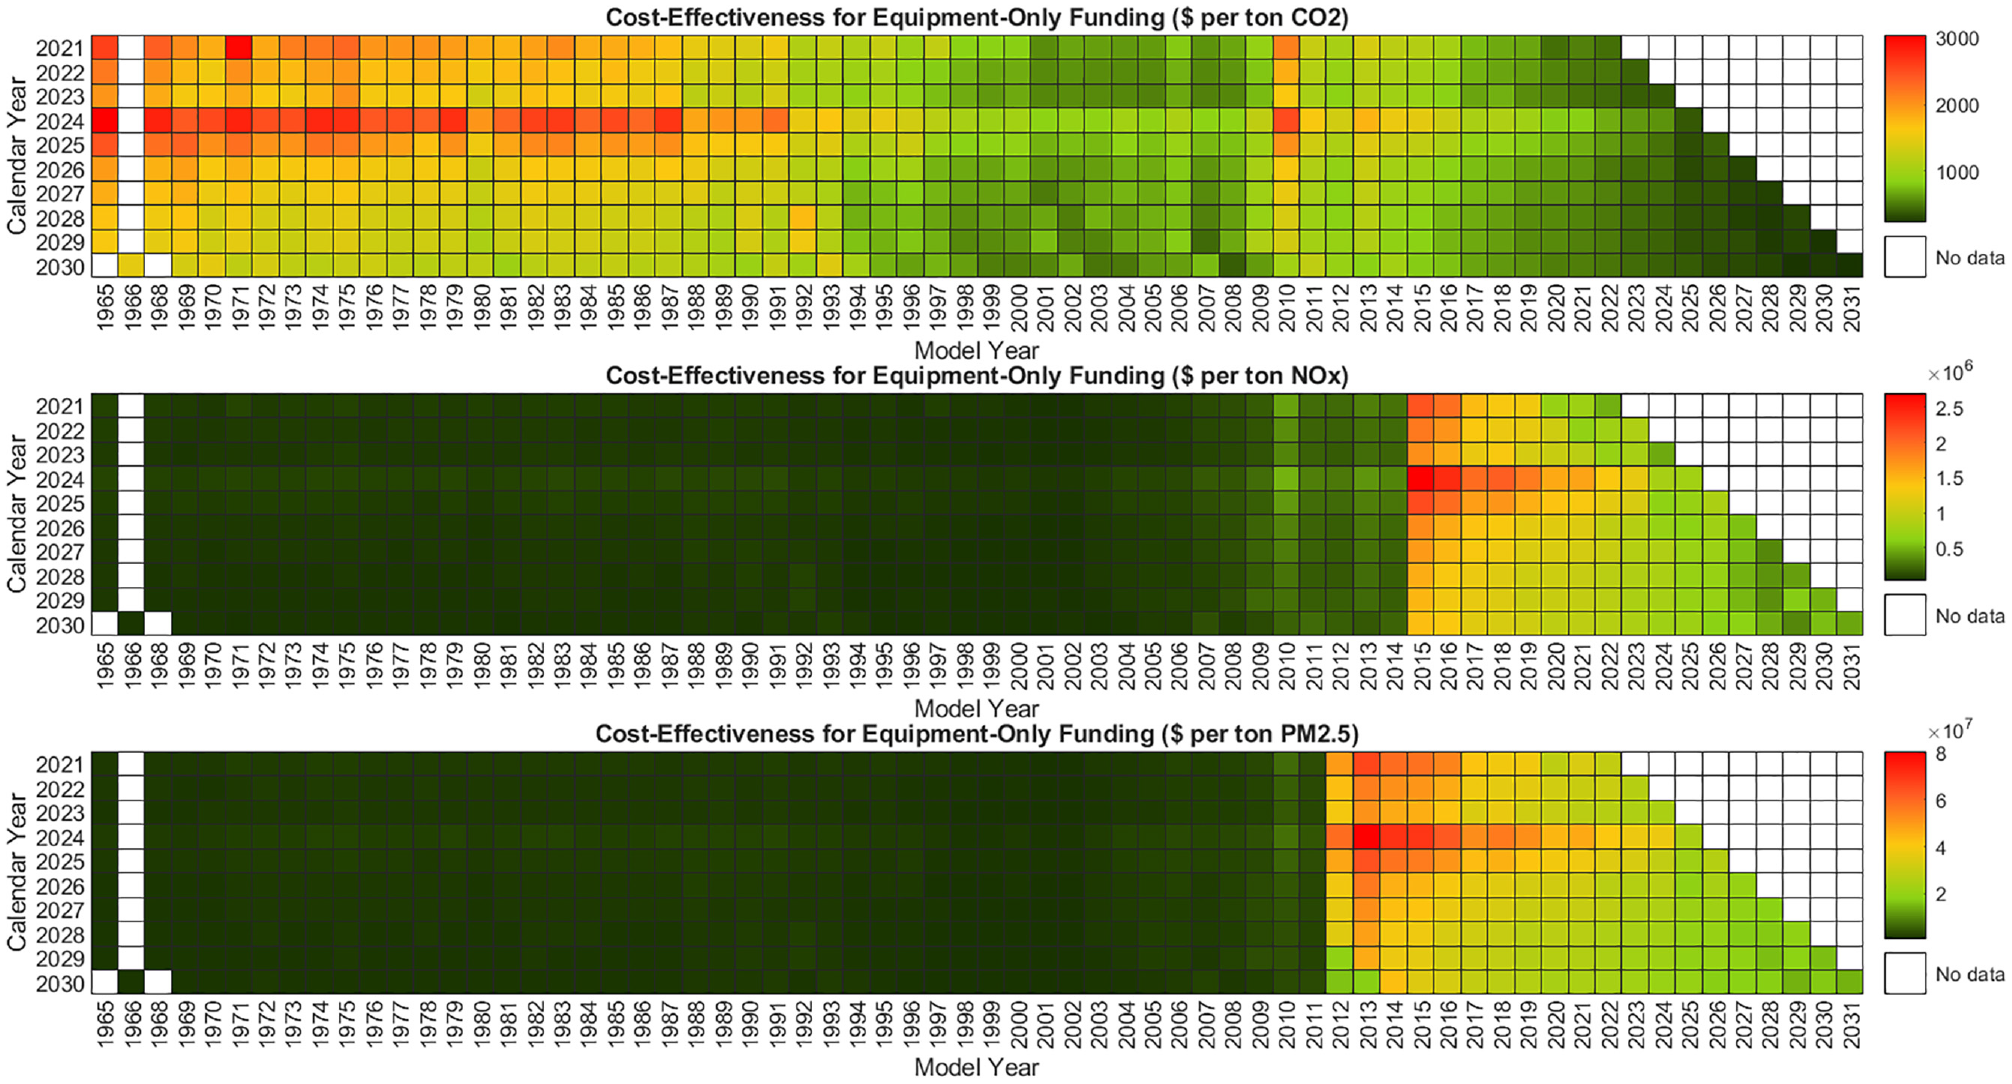
Funding cost-effectiveness breakdown by calendar year and model year for 175 Hp graders.
Sensitivity Analysis
This analysis so far made several assumptions for component sizing and cost estimation. These assumed values can vary over time and produce different results. To address these possible changes, a sensitivity analysis was conducted by varying all input parameters over certain ranges. The 35% efficiency of diesel engines considered for battery sizing could vary for many equipment types and operating conditions. Diesel engines could also be oversized in equipment, making the Hp values used for motor and additional EV system cost estimation oversized as well. The per-unit cost of components could change because of altered manufacturing processes as well as raw-material logistics. The advanced engineering cost could vary for different equipment, PTO types, and manufacturing methods. The fuel tank cost could also change based on factors such as equipment type and fuel tank capacity. Thus, both smaller and larger values than the base case were considered for these parameters. Table 2 shows the varied parameter values against the base values. All 10 parameters were assigned three different values, and the resulting
Parameter Base Values and Variations for Sensitivity Analysis
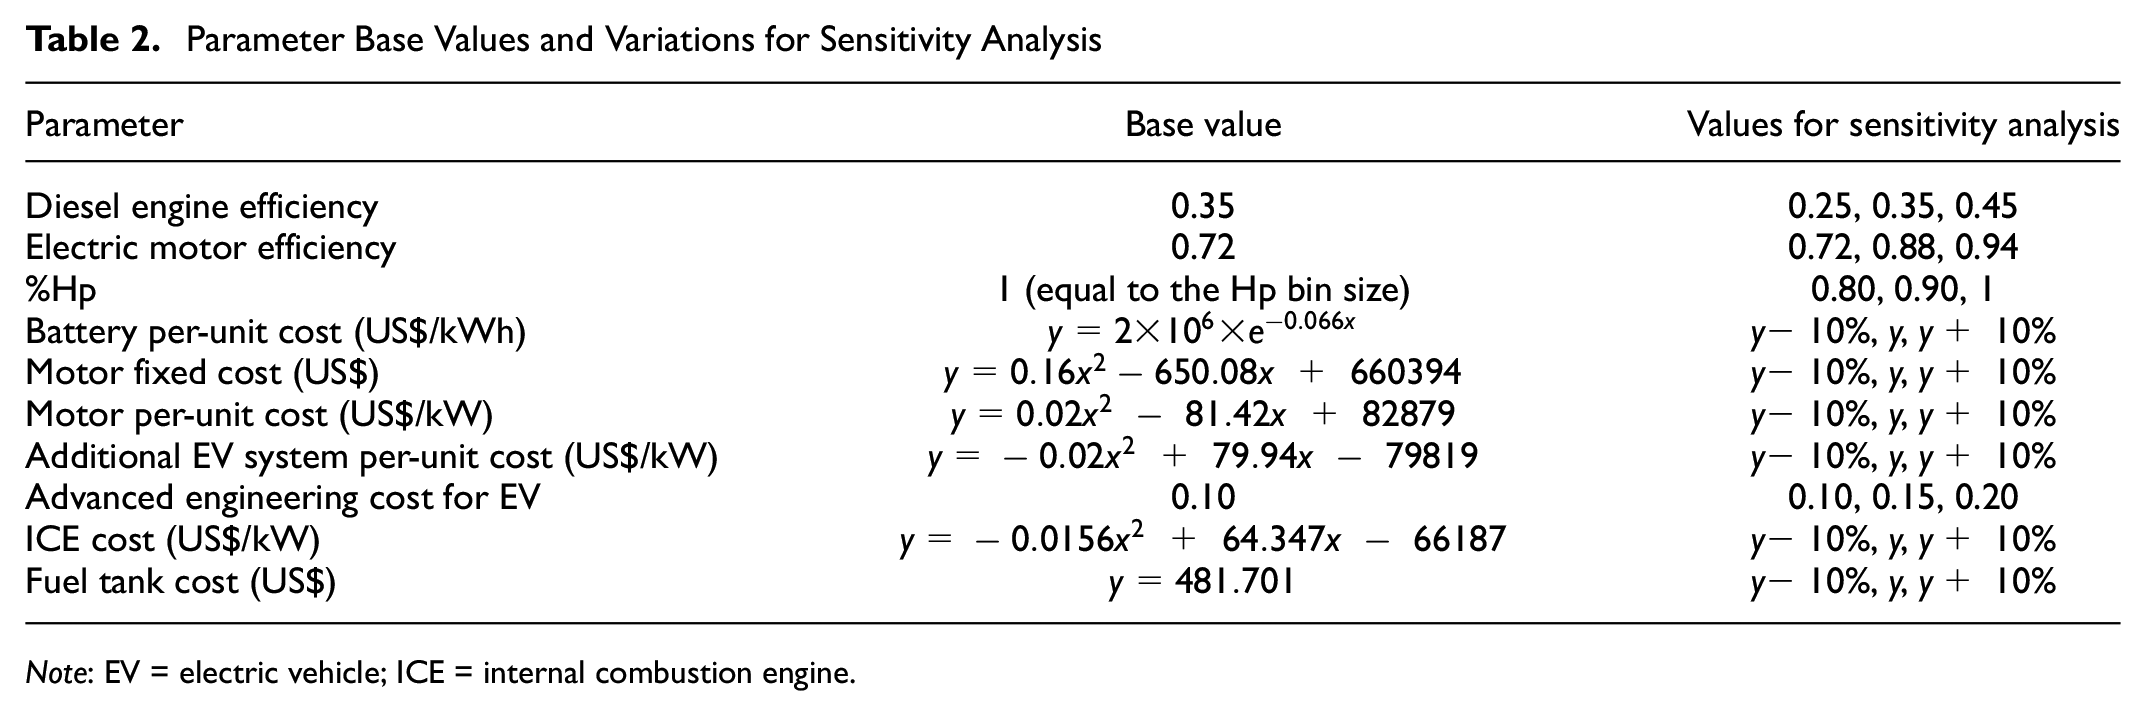
Note: EV = electric vehicle; ICE = internal combustion engine.
For each scenario, component costs were calculated using Equations 1–15, the required funding amount was obtained from Equation 16, and the funding cost-effectiveness was calculated from Equation 18 using the emission calculations from Equation 17. Each scenario simulation provided component sizes, costs, required funding amounts, and funding cost-effectiveness. To provide these results in a compact and meaningful way, means and standard deviations of the determined scenario outputs were calculated.
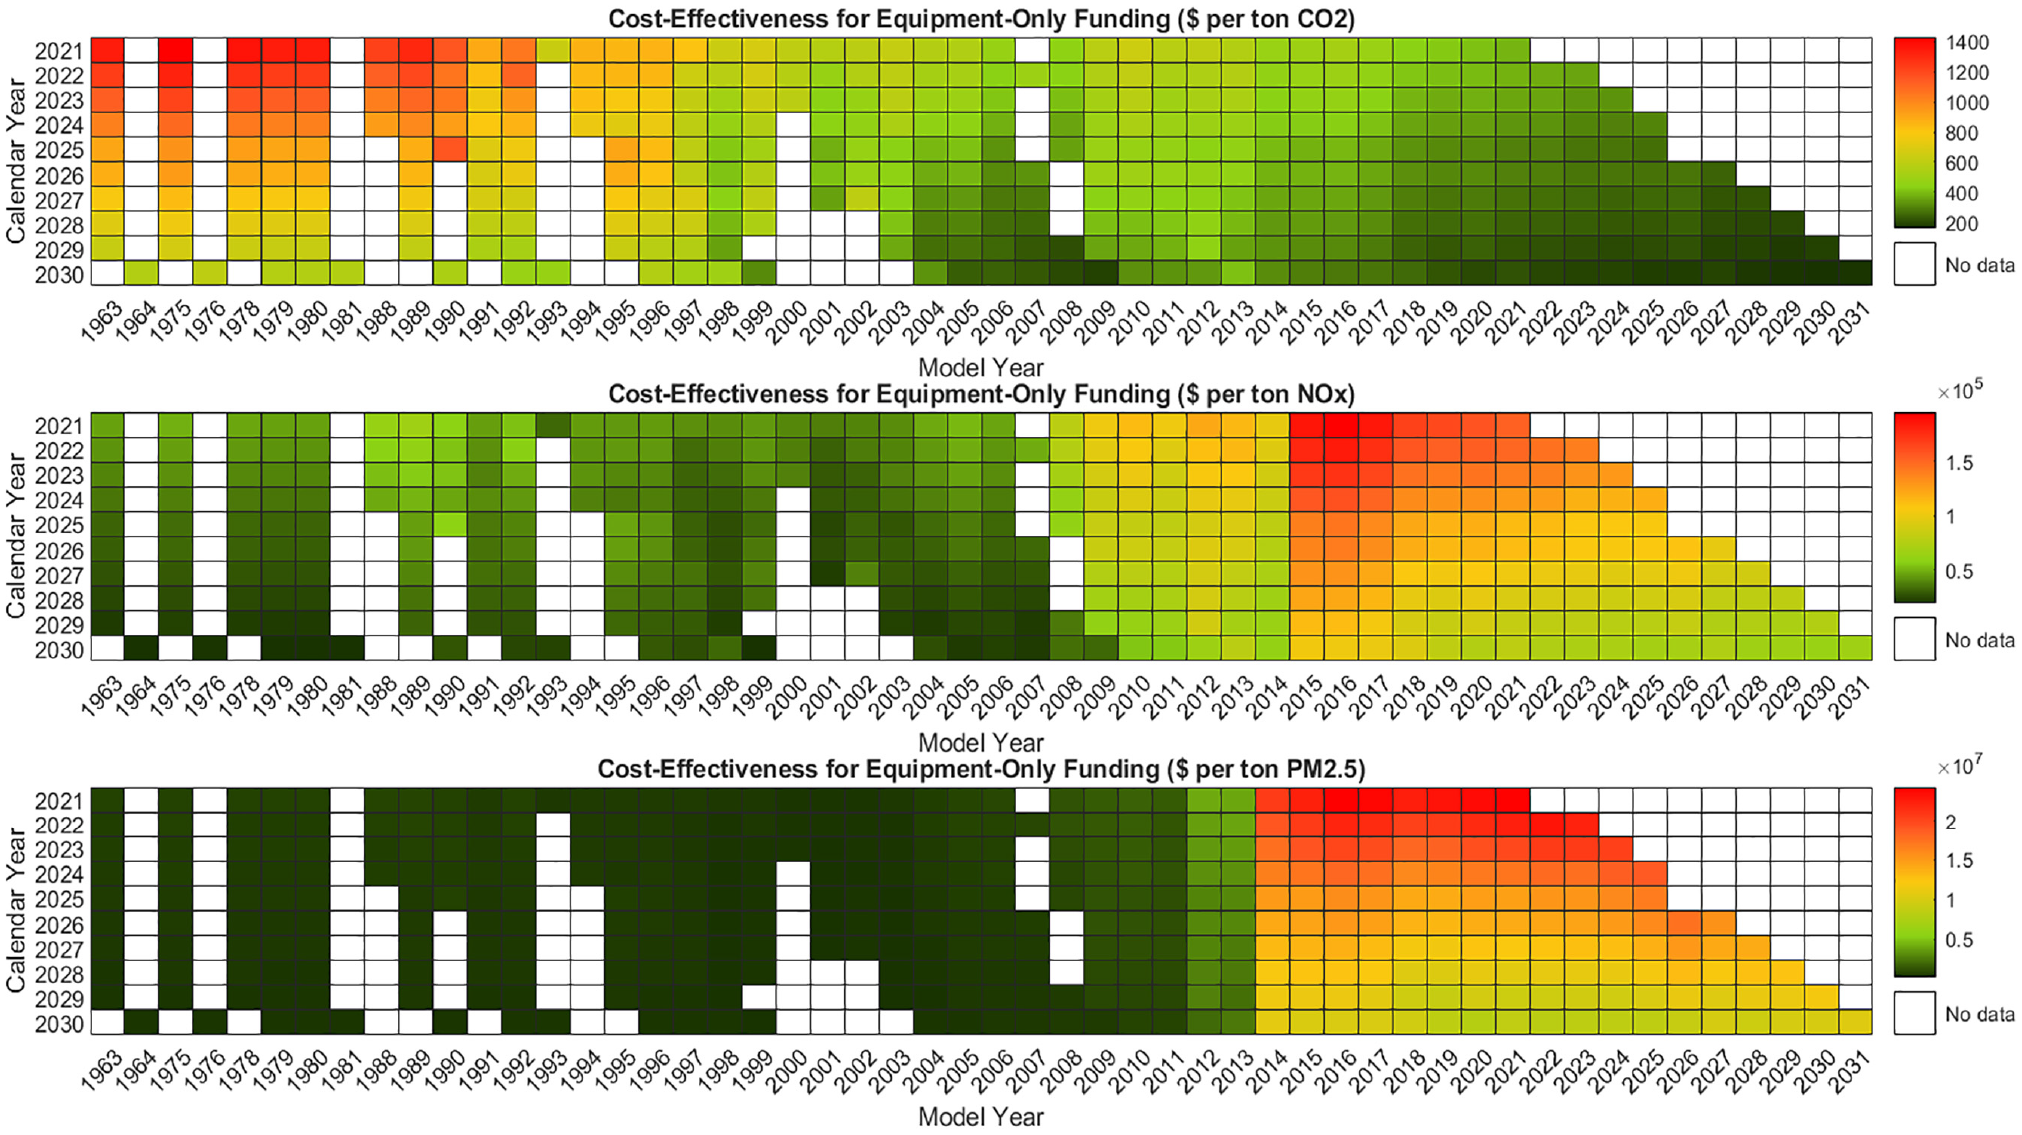
Figure 10 shows the mean funding cost-effectiveness for the electrification of excavators in the 175 Hp bin. These heat maps have the same pattern as the base-case results in Figure 7. However, the magnitudes decreased overall, as can be seen from the ranges of the scales.

Mean funding cost-effectiveness breakdown by calendar year and model year for 175 Hp excavators.
The mean values showed the average of the outputs obtained through simulating all 59,049 scenarios, and for any specific scenario, these values could be either larger or smaller than the mean. To determine the range of this variation, the upper and lower confidence boundaries of the mean cost-effectiveness values were obtained as follows:
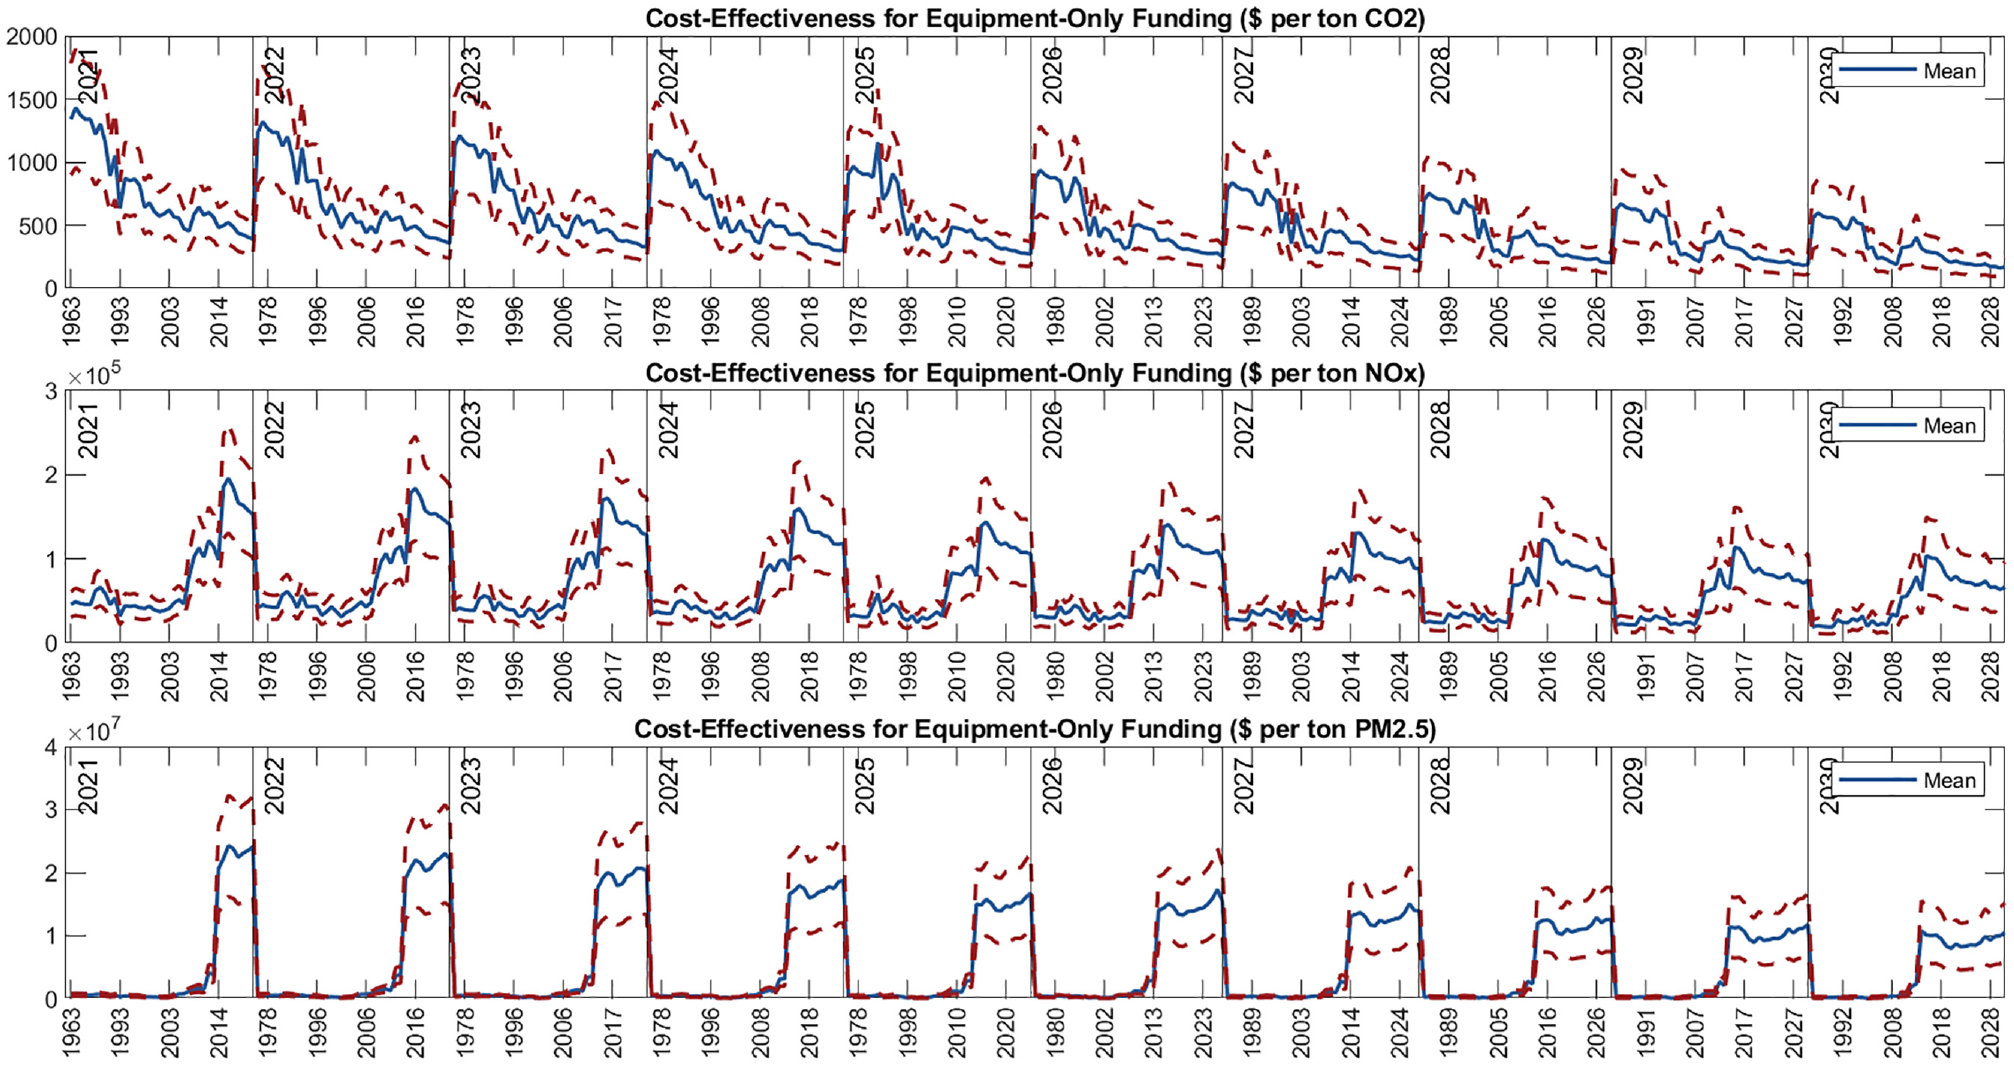
The mean cost-effectiveness values with these boundaries are shown for excavators in the 175 Hp bin in Figure 11, broken down by calendar year (marked with vertical partitions) and model year (on the X-axis). The blue lines in each of the graphs show the mean cost-effectiveness, and the upper and lower boundaries indicate the range of variation of cost-effectiveness values from the mean. The data trend is consistent with the results observed in Figure 7: replacing the older model years in any calendar year would be an effective use of funding dollars for NO x and PM2.5 emission reduction; replacing newer model years would be more cost-effective for CO2 emission reduction. The range of variation is wide for high cost-effectiveness values, as seen from the areas marked by the confidence boundaries in all cases.
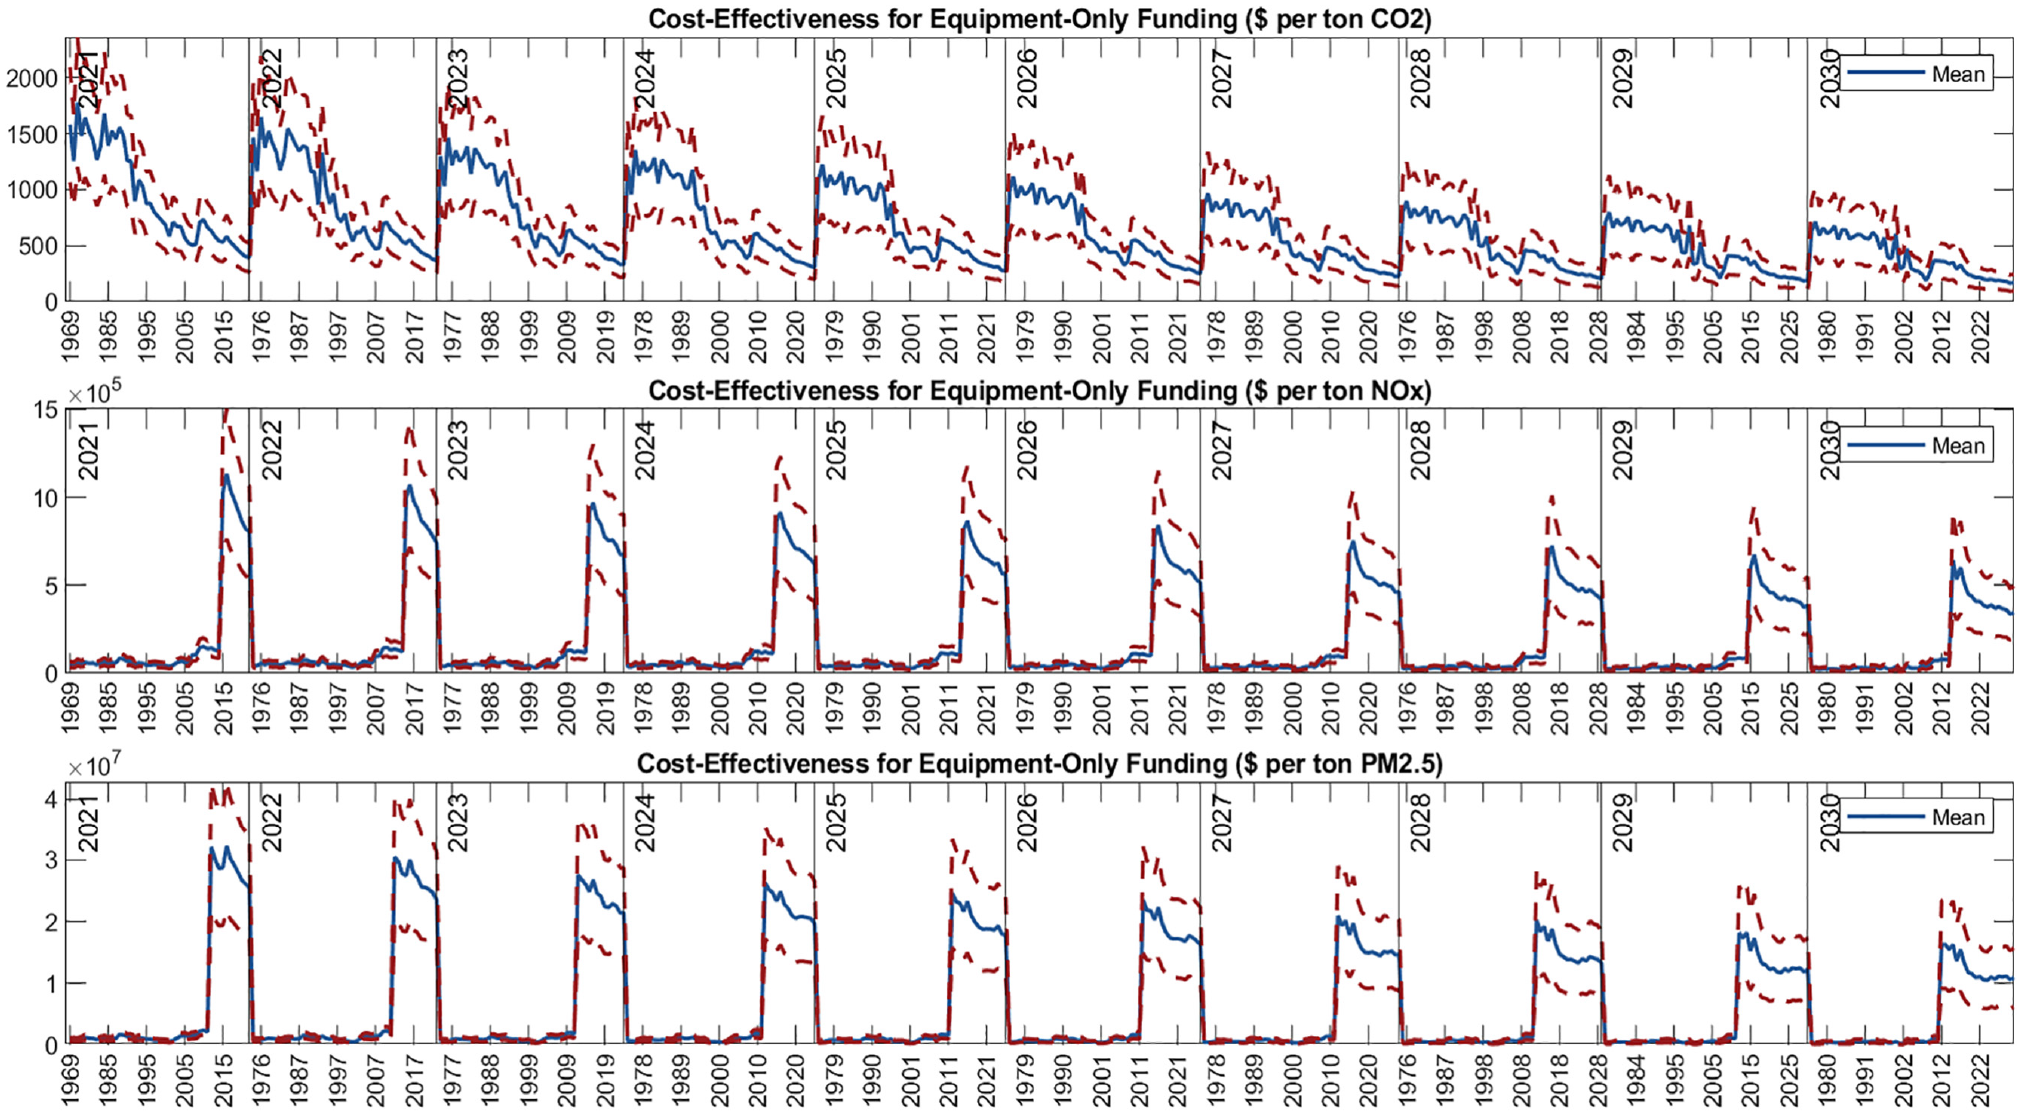
Mean funding cost-effectiveness breakdown by calendar year and model year with confidence boundaries for 175 Hp excavators (color online only).
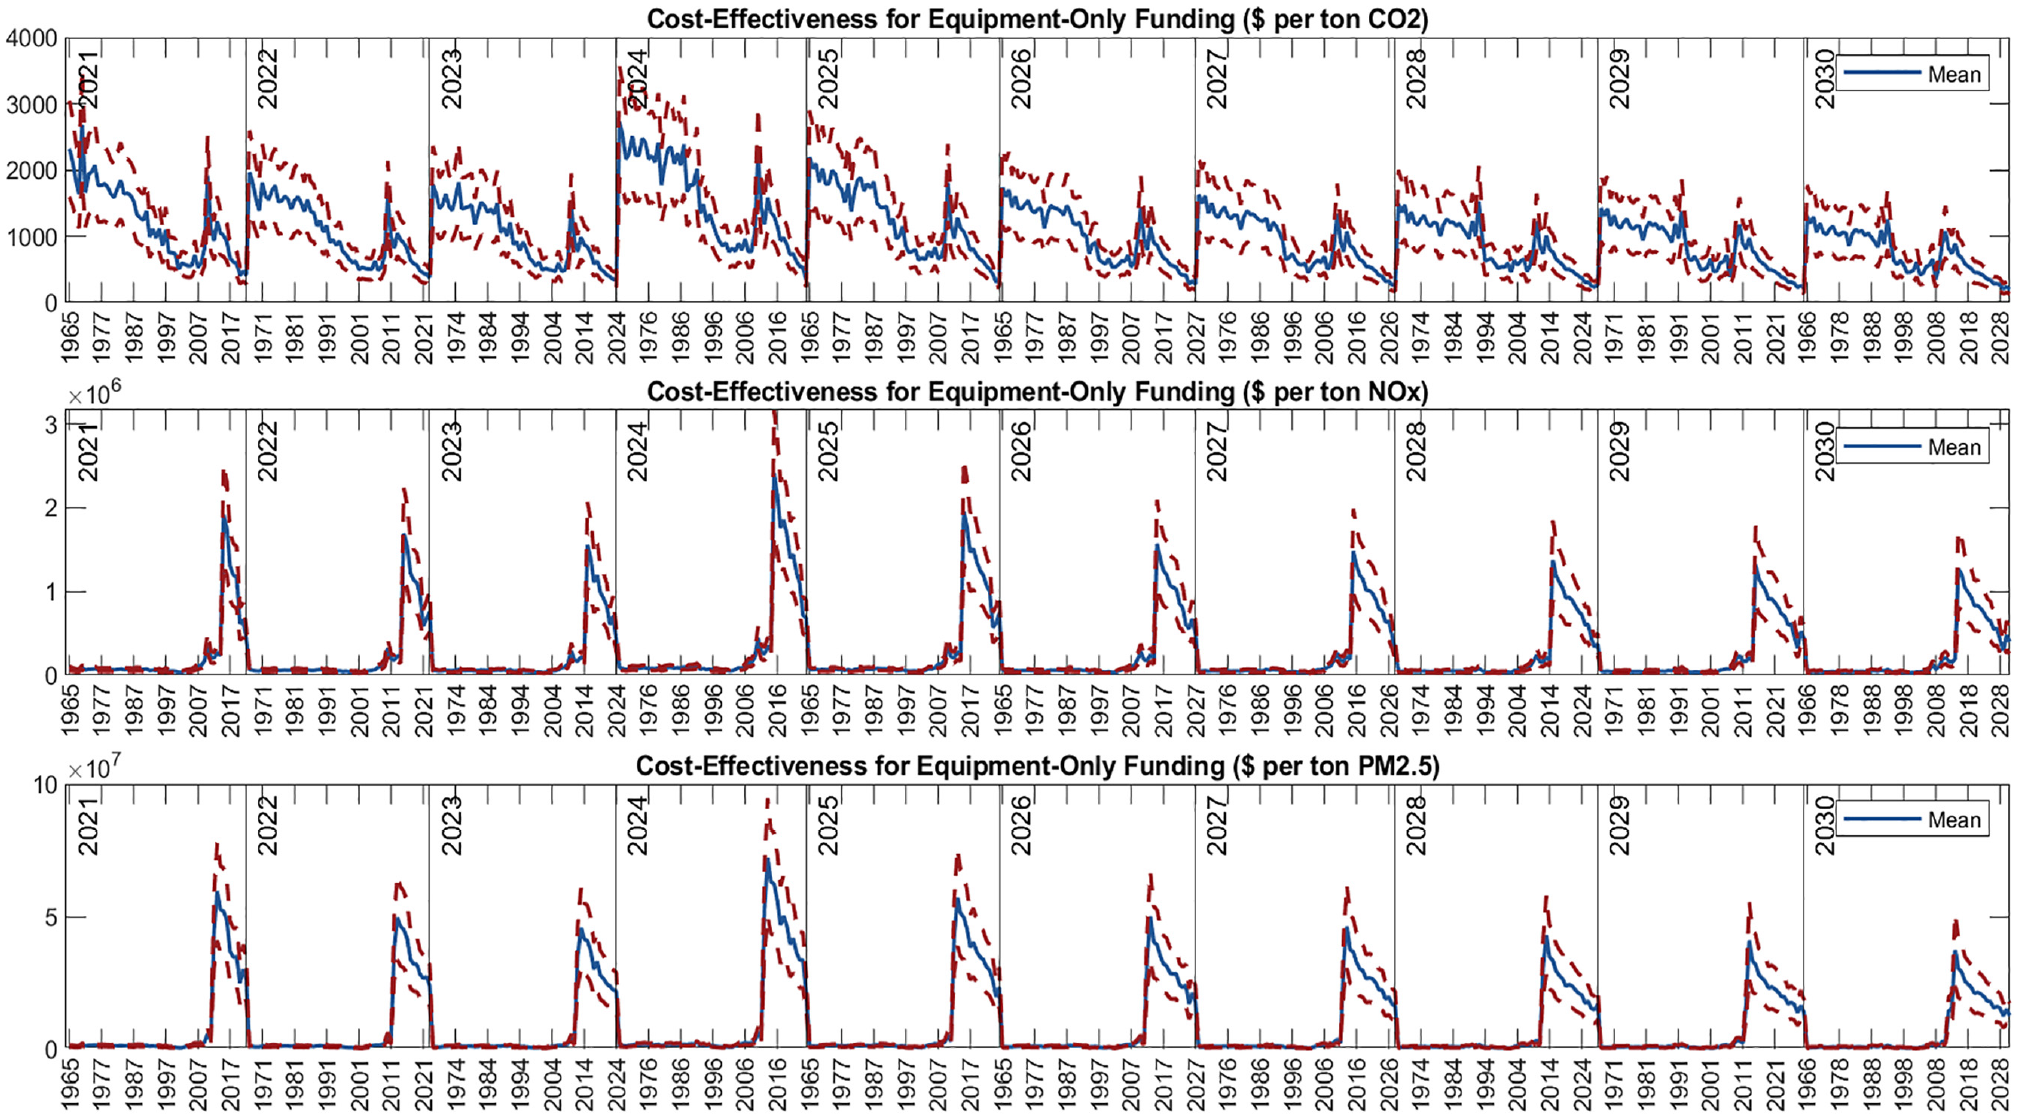
Similar to the 175 Hp excavators, the 100 Hp excavator heat maps showed the same pattern (Figure 12) as the base-case results in Figure 8. However, the magnitudes decreased slightly overall, as can be seen from the ranges of the scales. The variation range for the funding cost-effectiveness of 100 Hp excavators is shown in Figure 13. The observations from Figure 11 apply here as well.
Mean funding cost-effectiveness breakdown by calendar year and model year for 100 Hp excavators.
Mean funding cost-effectiveness breakdown by calendar year and model year with confidence boundaries for 100 Hp excavators.
For the graders in the 175 Hp bin, mean cost-effectiveness values slightly decreased in value overall (Figure 14) compared to the base-case in Figure 9 (noticeable from the ranges of the scales). The patterns are the same. The variation range for 175 Hp graders is shown in Figure 15.

Mean funding cost-effectiveness breakdown by calendar year and model year for 175 Hp graders.
Mean funding cost-effectiveness breakdown by calendar year and model year with confidence boundaries for 175 Hp graders.
It should be pointed out that the cost of battery electric equipment, and consequently the cost-effectiveness of funding these pieces of equipment, presented in this paper depends largely on the battery price projections obtained from Moultak et al. ( 27 ) (shown in Figure 2). However, recent data that were released after the analysis has been completed show that the real battery price has decreased faster than projected over the last few years (Figure 16) ( 34 ). For example, the real battery price in 2015 was US$384 per kWh, which is 18% higher than the projected price of US$326 per kWh. In 2020, however, the real battery price dropped to US$137 per kWh, which is only 60% of the projected price of US$228 per kWh. Since the battery cost accounts for approximately 80% of the total EV component cost in this analysis, the actual incentive funding required and the dollars per ton of emission reduction would be about half of the results presented in this paper.
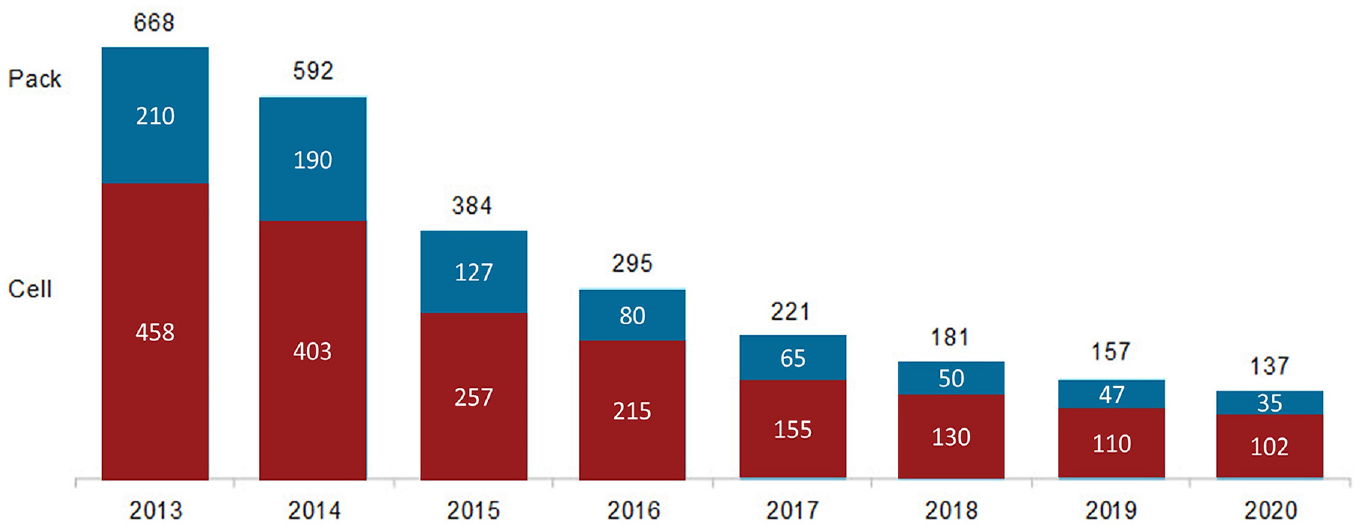
Volume-weighted average battery pack (dark blue) and battery cell (dark red) prices in 2020 US$/kWh (color online only).
Conclusions
In this paper, a component-based cost estimation model has been developed to estimate the required funding amount for replacing diesel equipment with battery electric alternatives. This estimation methodology is crucial for assessing equipment types with little or no cost data. Using the developed methodology, the required incentive funding has been calculated as the overall cost difference between diesel equipment and an electric equivalent, which has been used in conjunction with emission data from CARB’s OFFROAD2017 database to determine the cost-effectiveness of funding the equipment replacement. In addition, a series of heat maps has been created to visualize emissions and funding cost-effectiveness. Based on these heat maps, it is possible to compare emission and funding cost-effectiveness values across different equipment types, Hp bins, calendar years, and model years. Then, incentive funding strategies can be designed based on specific objectives and considerations. A sensitivity analysis has also been conducted to estimate the range of variation of the obtained outputs. The proposed framework will help in prioritizing equipment types and sizes for future incentives, and to design effective strategies for incentive implementation.
The strategies demonstrated in the paper for effective policy design can be summed up as follows. Funding policy/program or grant applications can be evaluated using emission-based calculations at a rudimentary level, or with more comprehensive cost-effectiveness analysis. As a higher-level analysis, emission-based evaluations can help in assessing funding efficacy for specific type, size, and model year equipment populations in specific calendar year(s) (e.g., Figures 4 and 5). These can also help one to decide on mandates to phase out specific equipment groups from certain calendar years (e.g., Figures 4 and 5). Cost-effectiveness-based analysis can help identify the best selection of equipment type and size to fund (e.g., Figure 6) with respect to funding cost-effectiveness, and then select the best model years to target within the type-size selection and select a project timeline (e.g., Figure 7). Furthermore, funding decisions can be more informed when possible variations of cost-effectiveness are considered (e.g., Figure 11). Finally, the spreadsheet tool can be used to obtain the most updated cost-effectiveness values using the latest data, and design programs based on that.
For future work, additional details pertaining to life-cycle emissions (e.g., potential emissions from charging and power generation) and possible cost recovery from lower operating costs of electric equipment can be factored into the developed framework.
Footnotes
Acknowledgements
The authors acknowledge the contribution of many individuals in this research effort, including Tom Durbin, Kent Johnson, Chengguo Li, and Chas Frederickson. Finally, the authors thank several anonymous fleets for their participation in this research.
Author Contributions
The authors confirm contribution to the paper as follows: study conception and design: K. Boriboonsomsin, S. Yoon; data collection: G. Scora, F. Un-Noor; analysis and interpretation of results: F. Un-Noor, G. Scora, G. Wu, K. Boriboonsomsin; draft manuscript preparation: F. Un-Noor, K. Boriboonsomsin, S. Yoon. All authors reviewed the results and approved the final version of the manuscript.
Declaration of Conflicting Interests
The author(s) declared no potential conflicts of interest with respect to the research, authorship, and/or publication of this article.
Funding
The author(s) disclosed receipt of the following financial support for the research, authorship, and/or publication of this article: This research was conducted in fulfillment of Agreement No. 18RD016 by the University of California, Riverside, under the sponsorship of the California Air Resources Board (CARB), with supplementary resources from the U.S. Environmental Protection Agency (EPA).
The statements and conclusions in this paper are those of the authors and not necessarily those of CARB or EPA. The mention of commercial products, their source, or their use in connection with material reported here is not to be construed of actual or implied endorsement of such products.