
Abstract
This study develops safety performance functions (SPFs) for “fatal and injury” (FI) commercial motor vehicle (CMV) crashes (here, a CMV is defined as a large truck or a bus) at both signalized and unsignalized intersections in Kentucky. Five count-response regression models—negative binomial, Conway–Maxwell–Poisson, heterogeneous Conway–Maxwell–Poisson, zero-inflated Conway–Maxwell–Poisson, and zero-inflated heterogeneous Conway–Maxwell–Poisson (ZI-HTCMP)—were developed and compared at each of the selected signalized and unsignalized intersections. FI CMV intersection-related crash data in Kentucky over a period of five years (2015 to 2019) were used. Information on road-specific characteristics, for example, shoulder width, median width and type, International Roughness Index (IRI) value, and traffic volume (including annual average daily traffic [AADT] and heavy vehicle percentage [HVP]) was collected. Additionally, information on intersection-specific characteristics, for example, number of through lanes and presence of exclusive left- and right-turn lanes on major and minor roads, was collected using Google Maps’ street view time slider back to the crash year. For both signalized and unsignalized intersections, the ZI-HTCMP model (with a varying dispersion parameter) outperformed the other comparative models. With regard to signalized intersections, a speed limit of greater than 45 mph on the major road, a speed limit greater than 45 mph on the minor road, and a median on the major road wider than 3 ft were significantly associated with increased FI CMV crashes. As far as unsignalized intersections were concerned, higher major road AADT, 4-legged configuration, a speed limit greater than 45 mph on the major road, and an IRI value of greater than 100 for the major road were significantly associated with increased FI CMV crashes. The SPF results (for each of the signalized and unsignalized intersections) were then used to identify the top 10 hazardous locations for each intersection type.
In the U.S.A., before the COVID-19 pandemic, the year 2019 had a fatal commercial motor vehicle (CMV) crash involvement rate of 1.67 per 100 million large truck vehicle miles traveled, the highest since 2010 ( 1 ). Intersections are critical locations along the roadway because of the increased conflicts between approaching vehicles. They can become even more challenging for CMV drivers, especially during left- and right-turn maneuvers. According to the Federal Motor Carrier Safety Administration ( 2 ), nationally, there were 1,224 reported fatal CMV crashes at intersections, representing a 9.4% and a 2.6% increase compared with 2018 and 2017, respectively. Kentucky is a U.S. state that sees a great deal of trucking activity and is home to many trucking companies (around 43,000). In the state, during the five-year period 2015–2019, intersections accounted for the highest number of “fatal and injury” (FI) and “severe” CMV crashes compared with all other roadway locations, for example, segments, ramps, and driveways. The percentage of CMV crash involvement was 17% and 3% for FI and severe crashes, respectively.
Investigation of intersection-related crashes is well represented in the safety literature. However, the number of studies that specifically analyze CMV-related crashes at intersections is limited, especially in relation to crash frequency analysis and development of safety performance functions (SPFs) by intersection type (i.e., separately for signalized and unsignalized intersections). Furthermore, to the authors’ knowledge, there are few studies that have developed SPFs for predicting FI CMV crashes at both signalized and unsignalized intersections. This study takes the initiative and develops SPFs for FI CMV crashes at both signalized and unsignalized intersections.
The negative binomial (NB) model is the primary approach (or crash prediction model) adopted for SPF development in the Highway Safety Manual ( 3 ). However, the NB model restricts the overdispersion parameter as fixed across the sites and is only valid for overdispersed data (i.e., data with variance greater than the mean). A more flexible approach that could handle both overdispersed and underdispersed data and one that exhibits a varying dispersion parameter is the heterogeneous Conway–Maxwell–Poisson (HTCMP) model, which is an extension of the Conway–Maxwell–Poisson (CMP) model. A more refined form of the HTCMP model that could even handle excess zeros (e.g., for fitting FI CMV crash SPFs) is the zero-inflated heterogeneous Conway–Maxwell–Poisson (ZI-HTCMP) model. The ZI-HTCMP model incorporates varying parameter distribution as part of the zero-model portion and the varying dispersion parameter as a function of site-specific characteristics. In addition, it has overdispersed and underdispersed data handling flexibility. Therefore, this model can handle temporal instability.
The aims of this study are the following: (a) develop SPFs for FI CMV crashes at both signalized and unsignalized intersections in Kentucky using the NB and the newly introduced CMP-based models (ZI-HTCMP, ZI-CMP, HTCMP, and CMP); and (b) identify and rank signalized and unsignalized intersections that have a high number of FI CMV crashes using the empirical Bayes (EB) method. Comprehensive statewide data have been used, including 503 signalized intersections (representing 277 FI CMV crashes between 2015 and 2019), 291 unsignalized intersections (representing 129 FI CMV crashes between 2015 and 2019), and a myriad of roadway- and intersection-related variables, as shown next.
Literature Review
Studies on SPF Development for Intersections
Oh et al. ( 4 ) used gamma models to develop SPFs for rural 3- and 4-legged signalized intersections in South Korea. Crash data were collected at rural signalized intersections in Seoul, Gonju, and Jeollabuk in 2004. The authors found that the number of lanes on the minor road, the presence of a crosswalk on the major road, the speed limit on the major road, and the number of left-turn lanes on the major road were the significant factors affecting traffic crashes at 4-legged signalized intersections. For 3-legged signalized intersections, the left-turn sight distance from the major road, the presence of a crosswalk on the minor road, the presence of a left lane on the major road, and the presence of a bus stop on the major road significantly influenced crash frequency.
Stapleton et al. ( 5 ) adopted random effects NB models to develop SPFs for crashes occurring at 4-legged stop-controlled (4ST) and 3-legged stop-controlled (3ST) intersections in Michigan for the period 2011–2015. The results demonstrated that the annual average daily traffic (AADT) on major and minor roads and skew angle (greater than five degrees) increased crash frequency at both 3ST and 4ST intersections.
Wang et al. ( 6 ) compared various functional forms of NB-based models, including NB-1, NB-2, and NB-P, when estimating SPFs for five different crash types (total, opposite direction, same direction, single vehicle, and intersecting direction). The SPFs were developed separately for 3ST, 4ST, and 4-legged signalized intersections. Crash data were collected at rural two-lane intersections in Minnesota between 2003 and 2009. The NB-P model was found to outperform the other NB-based models for most crash and intersection types, especially for 3ST and 4-legged signalized intersections. Similarly, Khattak et al. ( 7 ) compared three different functional forms of NB-based models (including NB-1, NB-2, and NB-P), and a generalized Poisson regression model when developing SPFs for urban intersections. Data on crashes, geometry, and traffic volume were collected for 760 intersections in Antwerp, Belgium from 2010 to 2015. For signalized intersections, the comparison results showed that the NB-P model outperformed the other models in most crash severity categories. For unsignalized intersections, the generalized Poisson model was the best fit.
Gamaleldin et al. ( 8 ) investigated crashes at different types of intersections using the NB model. Data were collected for signalized 4-legged intersections and unsignalized 3-legged intersections in Florida. The results showed that a heavy volume of traffic was a significant factor contributing to crash occurrence at the intersections studied. Wang et al. ( 9 ) studied the effects of different exposure measures (including major road AADT, minor road AADT, and total AADT) and functional forms, namely, power function, Hoerl function 1, and Hoerl function 2, on SPFs developed for urban and suburban 4-legged intersections. The generalized negative binomial-P model was adopted using crash data collected from Connecticut between 2015 and 2019. The authors found that the overdispersion parameters of the SPFs varied as a function of the minor road AADT for single vehicle, same direction, and intersecting direction crashes.
Shirani-bidabadi et al. ( 10 ) developed separate bicycle–vehicle SPFs for urban 4-legged and 3-legged signalized intersections, and urban 4ST and 3ST intersections. Bicycle–vehicle crash data were collected in the state of Alabama between 2011 and 2015. The Conway–Maxwell–Poisson (CMP) and multivariate adaptive regression splines models were used to develop the SPFs. The authors found that at urban signalized intersections, the presence of bus stops, higher major road AADTs, and the absence of right-turn lanes on minor roads increased the frequency of bicycle–vehicle crashes. For urban 4ST and 3ST intersections, it was found that the presence of both a physical median and on-street parking on the major road reduced crash frequency.
Studies on CMV Crash Frequency Analysis
Overall, the majority of safety analyses of CMV crash frequencies have been generic in nature, with no emphasis on the specific roadway location (i.e., intersections, road segments, ramps, etc.). For example, focusing on fatal crashes, Forkenbrock and Hanley ( 11 ) investigated the circumstances under which fatal crashes involving multiple-trailer trucks were more likely to occur compared with single-trailer trucks. Crash data from 1995 to 1998 were collected from the Trucks Involved in Fatal Accidents statistics produced by the U.S. Department of Transportation. The authors found that multiple-trailer trucks were more likely to be involved in fatal crashes than single-trailer trucks under the following circumstances: on interstate highways; in cases in which three or more vehicles were involved, under dark lighting conditions, and on road surfaces covered with snow, slush, or ice. McKnight and Bahouth ( 12 ) investigated the factors associated with rollover crashes involving large trucks. The authors used crash data from 2001 to 2003 collected from the Large Truck Crash Causation Study in 17 states across the U.S.A. The authors found that rollover crashes were more likely to occur as a result of the following: failure to adjust speed when negotiating curved sections; drowsiness; distraction; oversteering; rushing; overloading; and limited sight distance.
In general, only a limited number of studies have specifically analyzed CMV crashes at intersections. Notable exceptions were Daniel et al. ( 13 ) and Dong et al. ( 14 ). Daniel et al. ( 13 ) developed a CMV crash prediction model at signalized intersections along US-1 in New Jersey using large truck crash data for 1998 and 1999 and employing the Poisson and NB approaches in the analysis. Dong et al. ( 14 ) used a multivariate Poisson-lognormal regression model to estimate crash frequencies by vehicle type at urban signalized intersections in Tennessee. Crash data were collected between 2005 and 2009. For both car–truck and truck-only crashes, the authors suggested that traffic volume and HVP, median width, and number of left-turn lanes on major and minor roads contributed positively to the crash frequency.
Study Contribution to State-of-the-Art CMV Safety
Overall, the literature review revealed a very limited number of studies that specifically investigated CMV crash frequencies by intersection type (separately for signalized and unsignalized intersections). In addition, to the authors’ knowledge, there are only a limited number of studies that have specifically developed SPFs for predicting FI CMV crashes at intersections. Thus, the current study offers the following two main contributions: (a) fit SPFs to predict FI CMV crashes at both signalized and unsignalized intersections separately (instead of combining them into one model to represent “intersections”), because signalized and unsignalized intersections possess different traffic and driver behavior characteristics; and (b) introduce promising new methodological approaches (including the ZI-HTCMP, ZI-CMP, HTCMP, and CMP models) to predict FI CMV crashes more accurately.
Data Collection and Preparation
Five years of CMV crash data from 2015 to 2019 were collected from the Kentucky Transportation Cabinet (KYTC) crash database, and with regard to intersection-related crashes, the INTERSECTIND indicator in the database was used to identify these. The research team investigated several of these intersection-coded crashes by inspecting crash locations (longitude and latitude coordinates) via Google Maps ( 15 ), and by reviewing the police crash narratives. However, it was found that the INTERSECTIND indicator did not correctly specify intersection-related crashes. Therefore, to do this, the research team merged the crash data from the period 2015–2019 with the roadway-specific inventory data according to the milepost of each crash, roadway ID, and the beginning and end milepost of each roadway section. Following the merging process, any CMV crash that occurred within 250 ft of the center of the intersection between the major and minor road was identified as intersection-related.
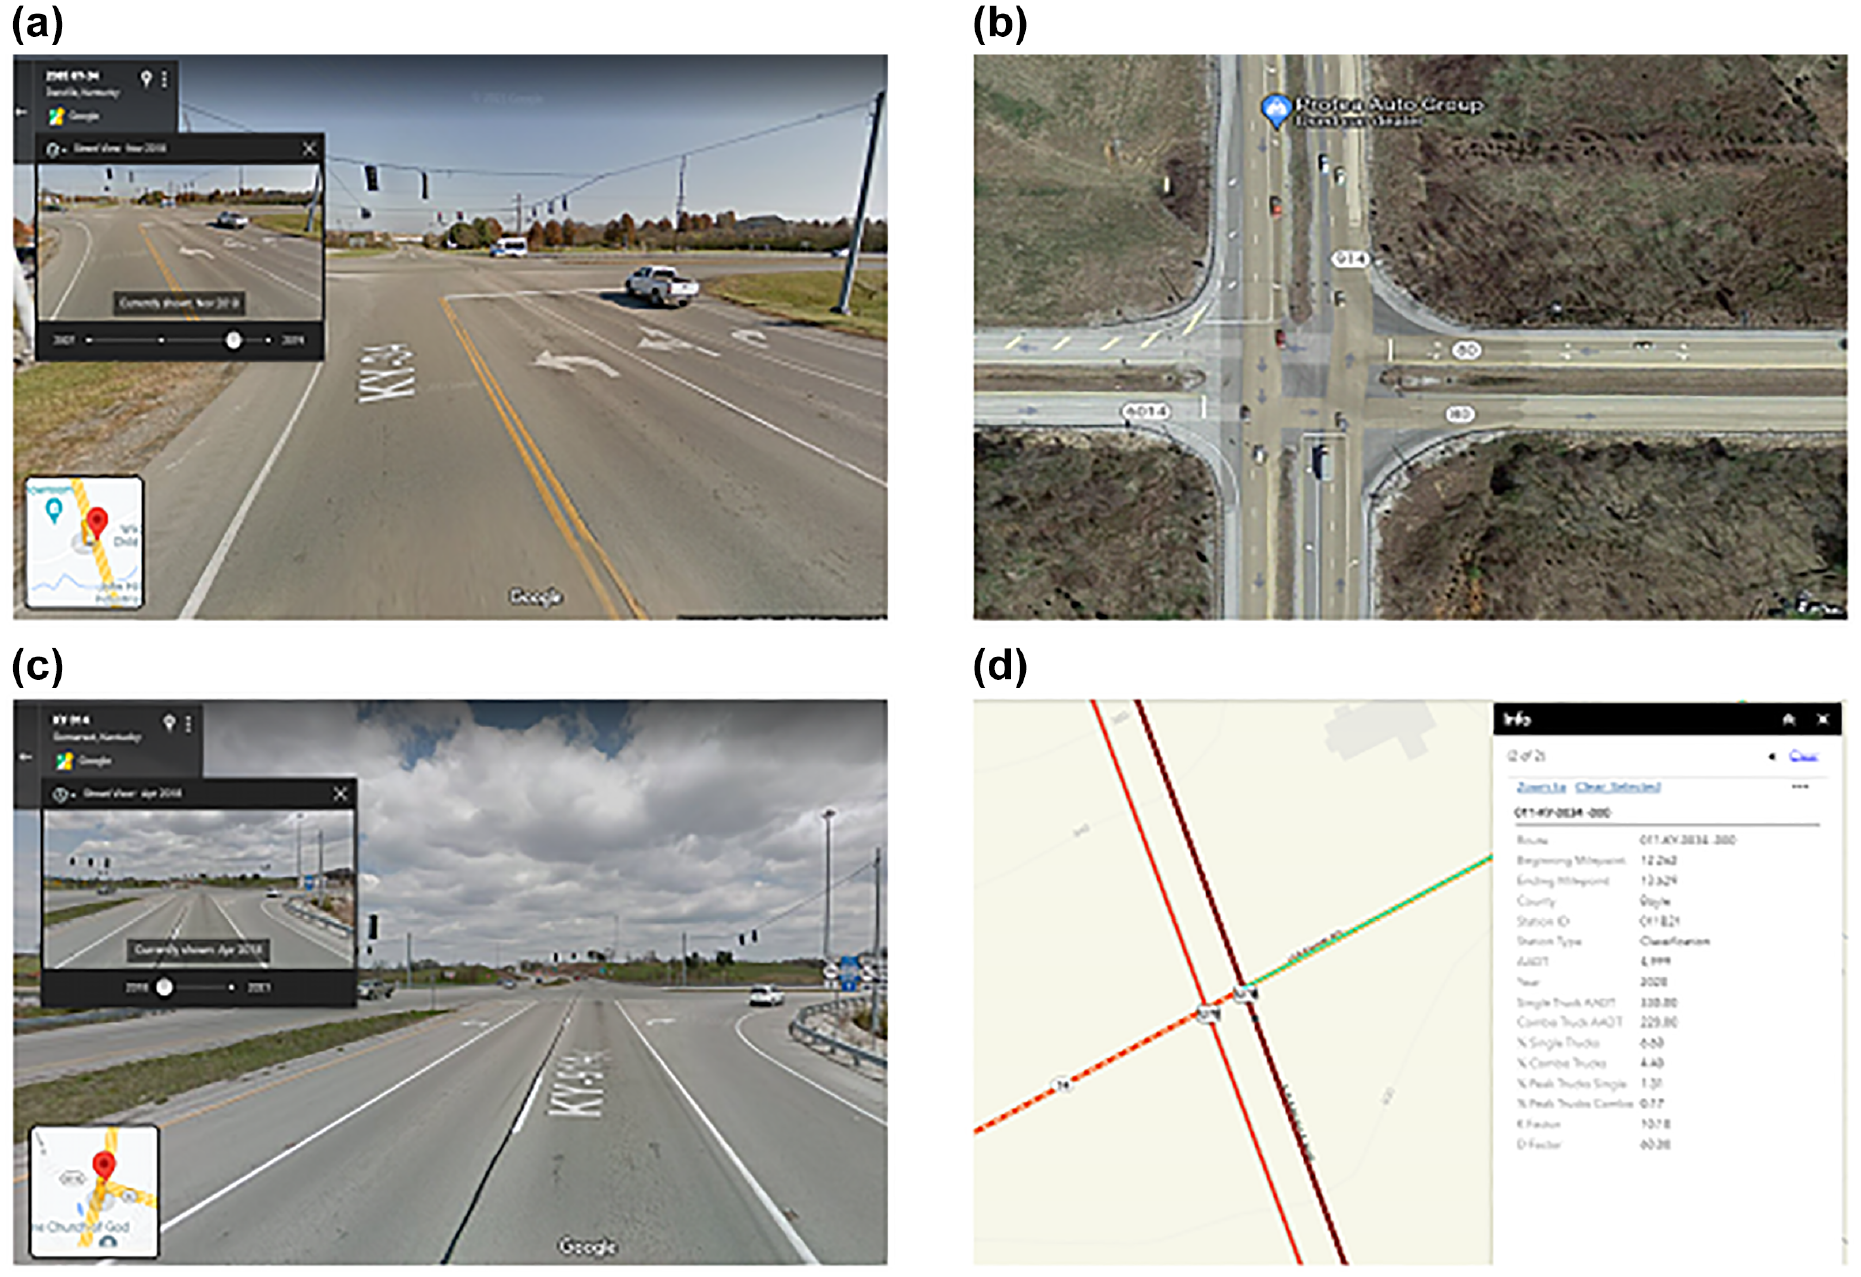
The KYTC roadway inventory database contains information on roadway characteristics, for example, presence and location (i.e., milepost) of intersection, median type, posted speed limit, and traffic volume (including AADT and HVP) for most roadways in the state of Kentucky. However, it should be noted that it lacked information on intersection-specific characteristics, for example, the presence of exclusive left- and right-turn lanes, type of traffic control for both major and minor road approaches, and key roadway geometric and traffic characteristics along the minor road approaches. As a result, the research team manually collected additional intersection-specific characteristics, for example, number of through lanes on major and minor roads, and median type on the minor road, using the street view time slider window on Google Maps ( 15 ) back to the year of crash occurrence. It should be noted that information on AADT for major and minor roads was collected from the KYTC interactive map ( 16 ). Figure 1 shows sample intersection data collection for some variables using Google Maps ( 15 ) and the KYTC interactive map ( 16 ).
CMV crashes were then aggregated by intersection type (either signalized or unsignalized) to represent the crash frequency by totaling the number of CMV crashes occurring at each intersection. Then, CMV crashes were screened to only include FI (i.e., K+A+B+C crashes) crashes by intersection type. For each intersection type, the total number of sites was split randomly into calibration and validation data sets with a ratio of 75:25, the former being used to calibrate the SPF models and the latter to validate them. Table 1 presents descriptive statistics of all explanatory variables used in the SPF development for both signalized and unsignalized intersections. It can be seen from Table 1 that signalized intersections were found to result in more FI crashes than unsignalized intersections in both the calibration and validation data sets ( 17 , 18 ).
Descriptive Statistics of the Variables for Both Signalized and Unsignalized Intersections
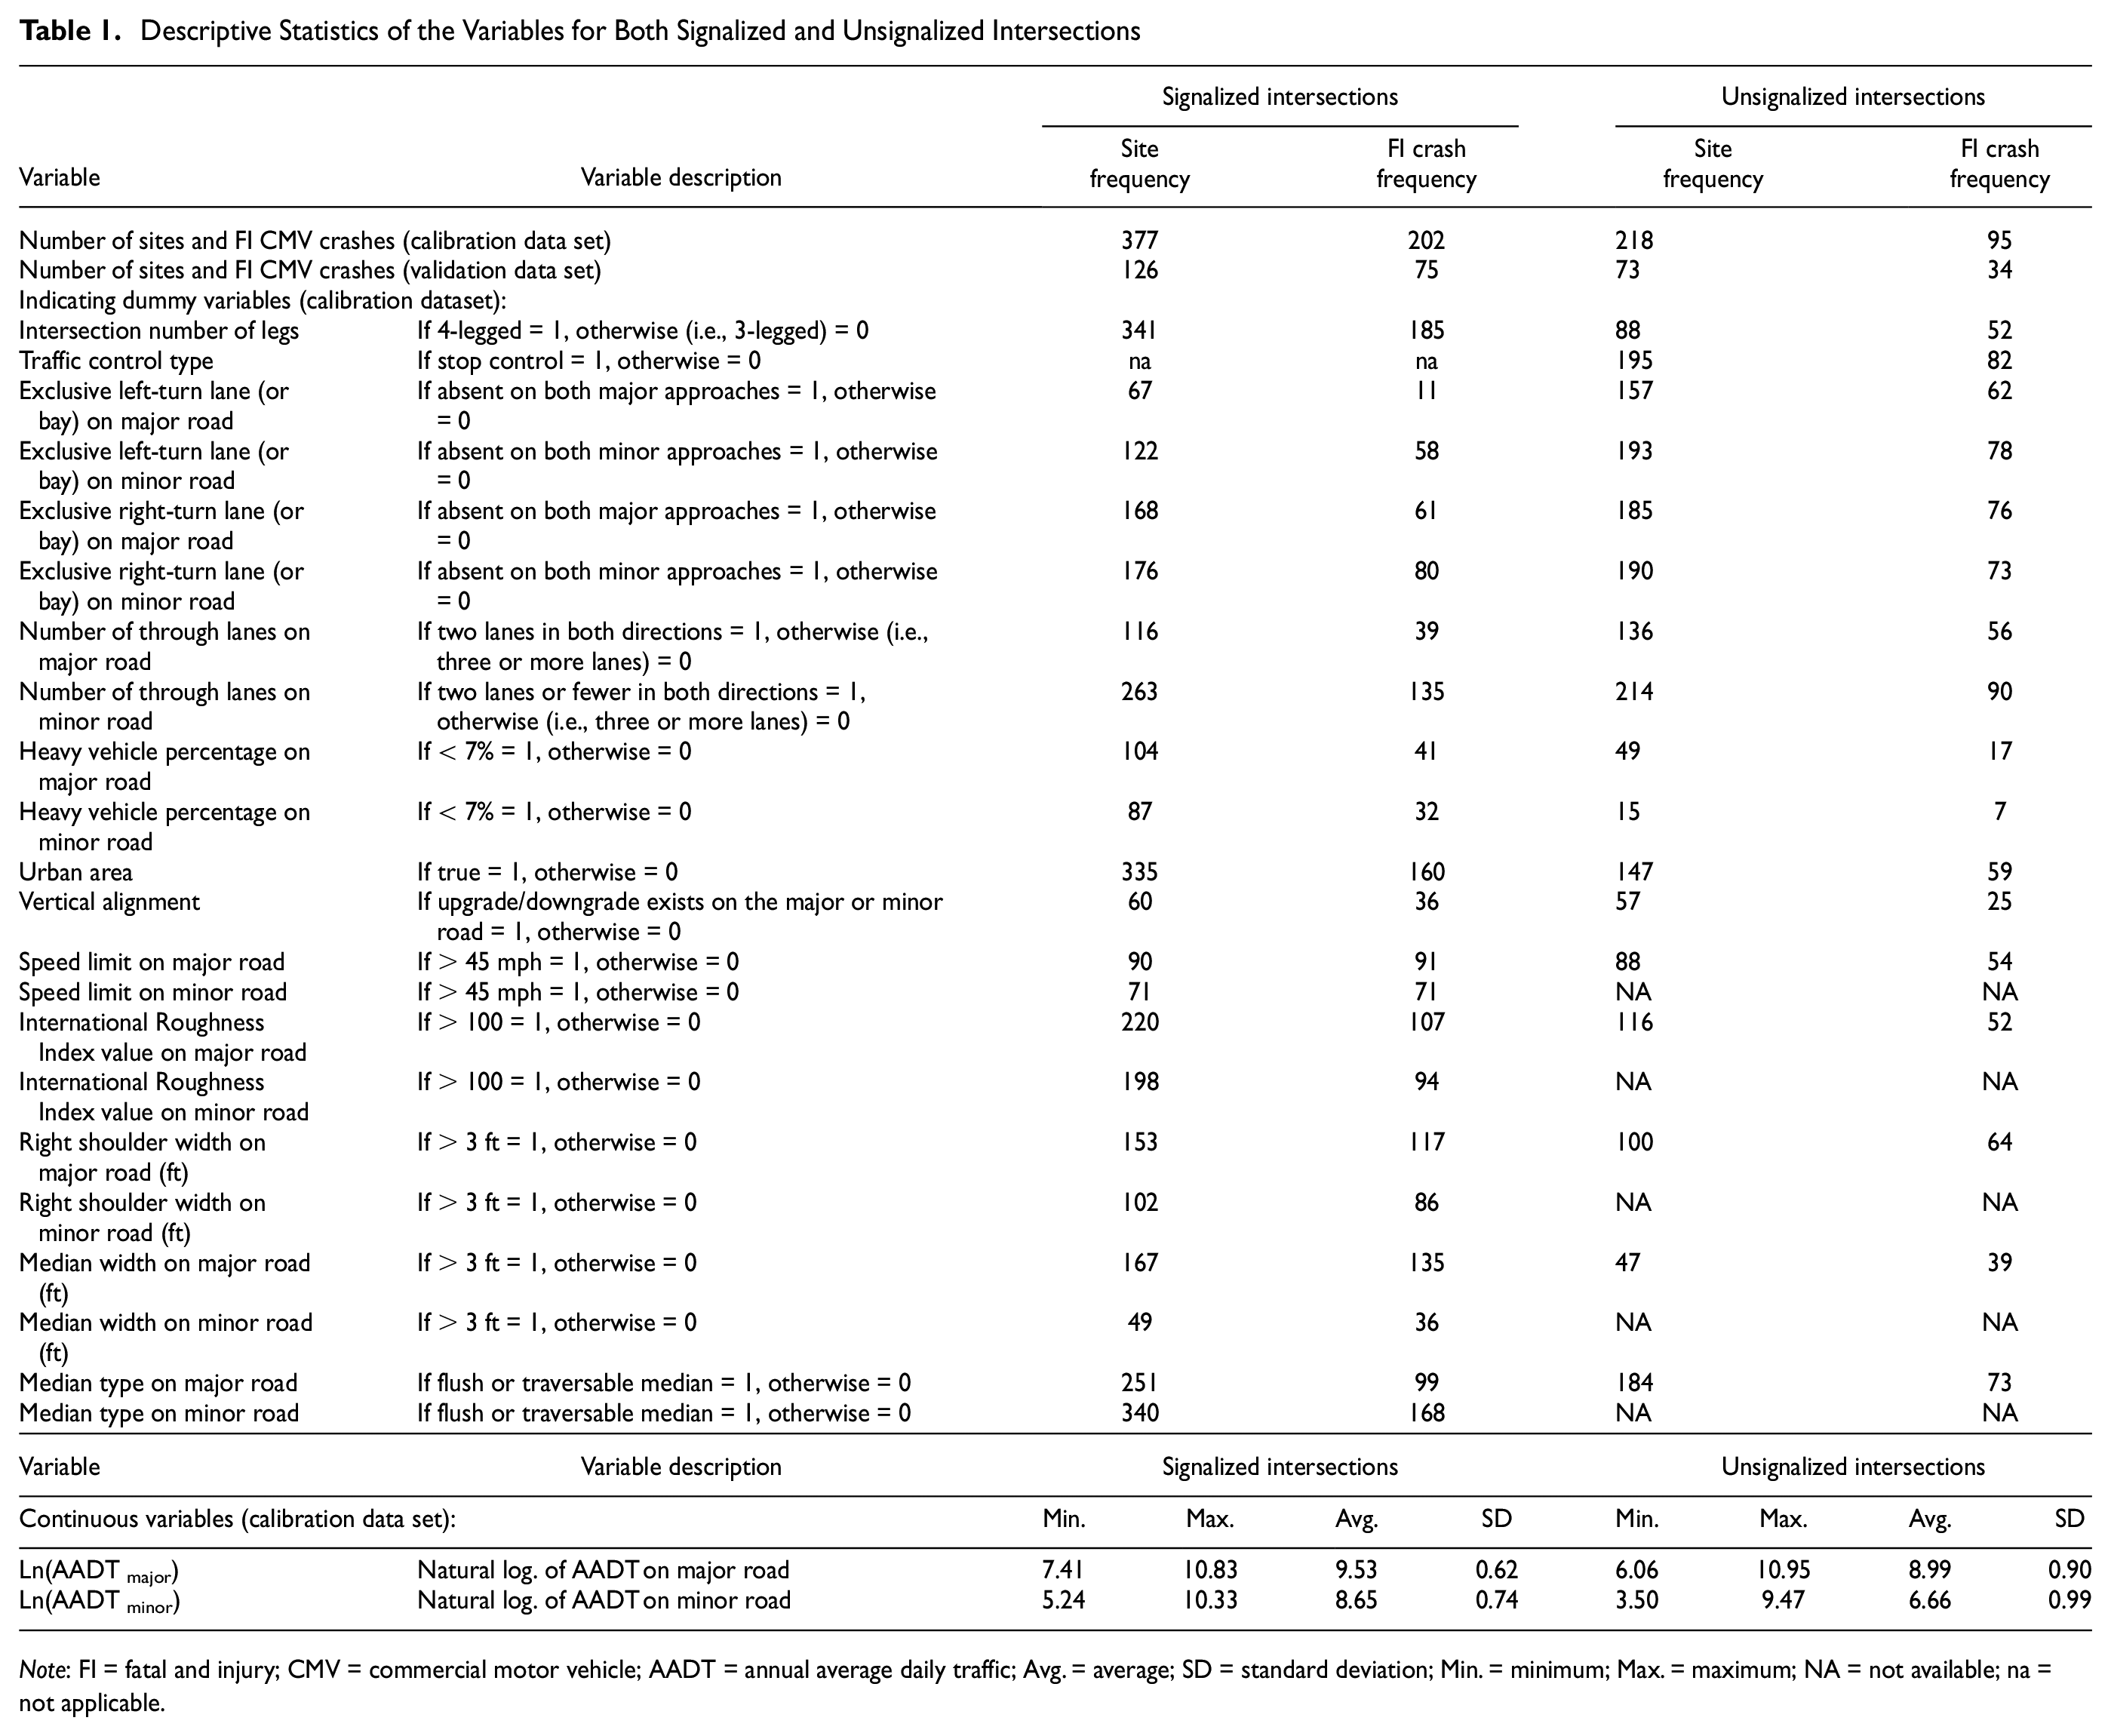
Note: FI = fatal and injury; CMV = commercial motor vehicle; AADT = annual average daily traffic; Avg. = average; SD = standard deviation; Min. = minimum; Max. = maximum; NA = not available; na = not applicable.
Figure 2 shows histograms of FI CMV crash frequencies for both signalized and unsignalized intersections. As can be seen, these two intersection types had many excess zeros. For example, of the total 377 signalized intersections in the calibration database, 236 (63%) experienced zero FI CMV crashes during the study period, whereas the remaining 141 sites had at least one FI CMV crash (refer to Figure 2a). Similar proportions of zero crashes or at least one crash can be seen for unsignalized intersections (refer to Figure 2b). This indicates that the standard count models (such as NB and CMP) may not be appropriate for modeling crash frequency characterized by excess zeros. To accommodate the presence of excess zeros better, CMP-based models (including ZI-HTCMP, ZI-CMP, HTCMP, and CMP) were developed and their prediction performance was compared with that of the standard NB model.
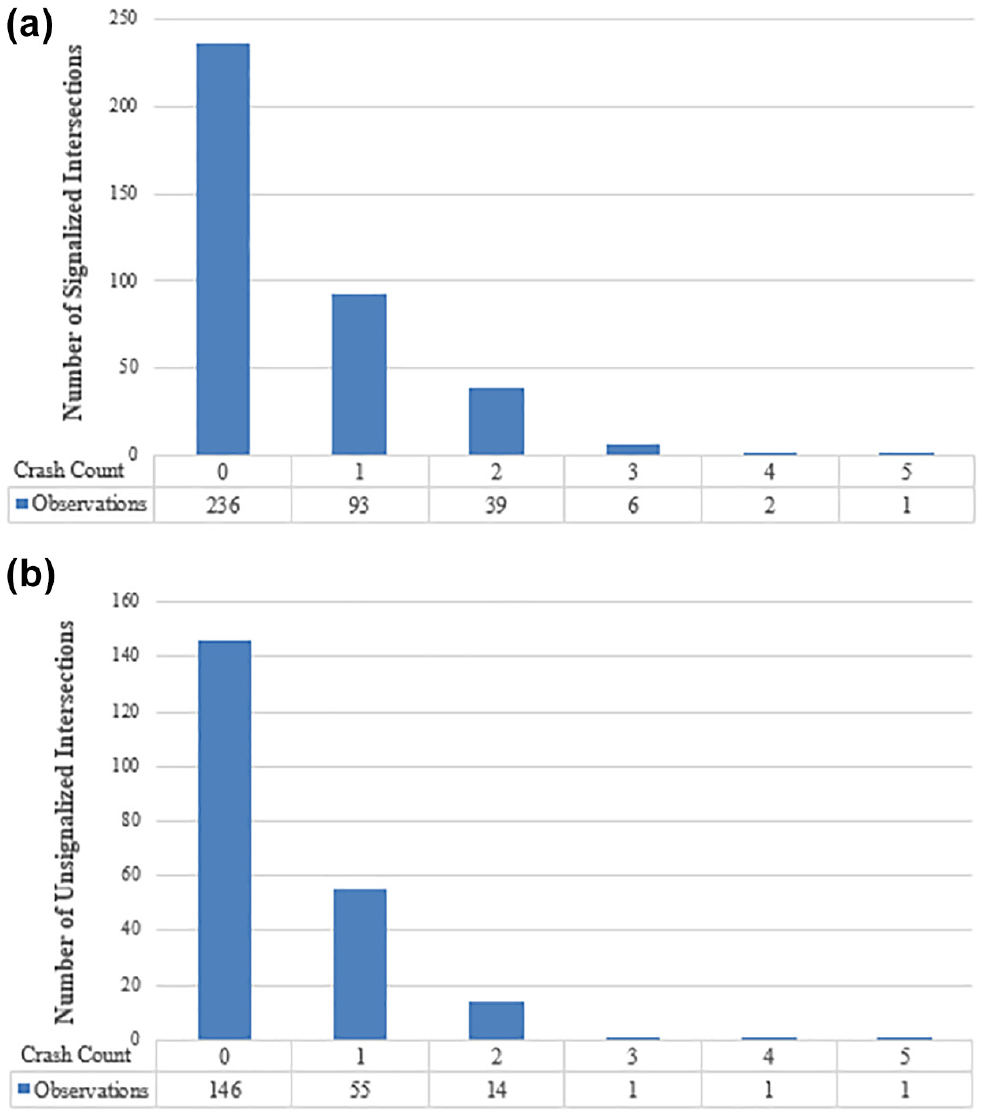
Histograms of FI CMV crash frequencies for: (a) signalized intersections, and (b) unsignalized intersections.
Methodological Approaches
CMP and HTCMP Models
The NB model is well known in the safety domain, but its main limitation is that the overdispersion parameter is fixed across the sites and is only valid for overdispersed data (i.e., data with variance greater than the mean). A more flexible approach that could handle both overdispersed and underdispersed data is the CMP model. One main advantage of the CMP model over the NB model is that the former can model count data subjected to both over- and underdispersion ( 10 ). A promising generalization of the CMP model is the HTCMP model, which allows the dispersion parameter to vary across the observations depending on site-specific characteristics ( 19 ) and also addresses temporal instability. The probability mass function of an HTCMP distribution is presented by:
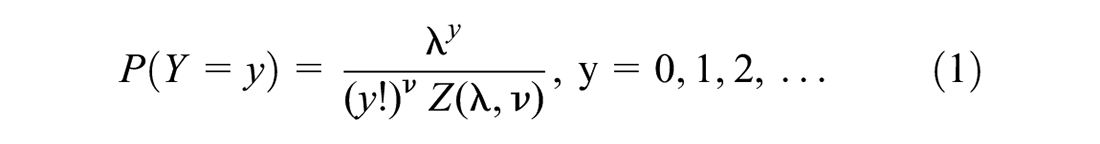


where
ZI-CMP and ZI-HTCMP Models
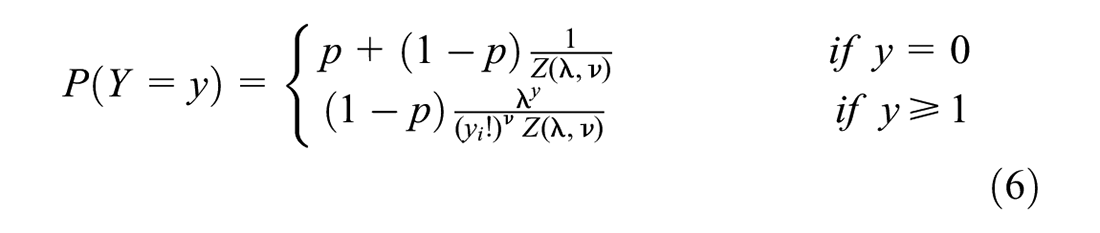
This study adopted the ZI-CMP and ZI-HTCMP models because multiple intersections experienced no FI CMV crashes during the study period, which resulted in zero inflation of the crash data. The ZI-HTCMP is an extension of the ZI-CMP model, initially introduced by Sellers and Raim ( 21 ), which allows the dispersion parameter to vary across observations while handling the presence of zero inflation. The ZI-HTCMP model is a mixture of a zero-degenerated distribution with probability P, and a heterogeneous CMP distribution with probability (1−P) ( 22 , 23 ). An advantage of the ZI-HTCMP model over its zero-inflated NB counterpart is that it is more flexible with regard to handling underdispersion or overdispersion while still accounting for zero inflation. It also allows the dispersion parameter to vary ( 22 ). The probability density function for the ZI-HTCMP model is given as:


where
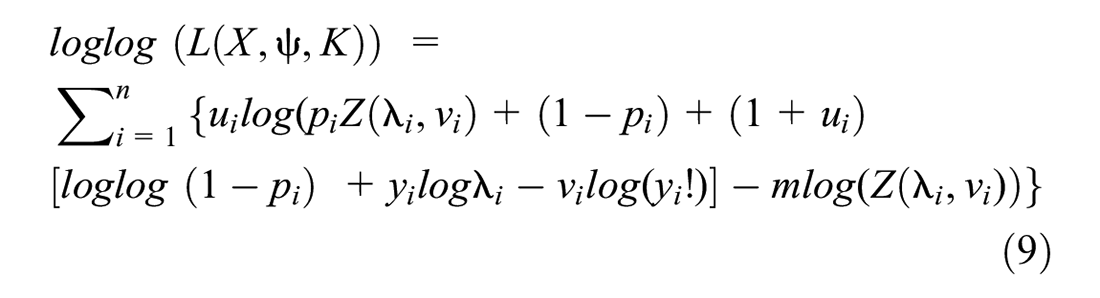
The parameters of the ZI-HTCMP model can be estimated via maximizing the log-likelihood function of Equation 8, as follows ( 22 ):
where
Note that the ZI-HTCMP model reduces to the ZI-CMP model whenever no variables are significant in the model’s dispersion part. Likewise, the ZI-HTCMP model reduces to the HTCMP model if no variables are found to be significant in the model’s zero part. It should be noted that all models in this study were fitted using R version 3.6.3 ( 24 ).
SPF Model Comparison and Selection
For each of the NB, HTNB, CMP, HCMP, ZI-CMP, and ZI-HTCMP models, the overall goodness-of-fit (GOF) measure was determined by calculating the deviance statistic (D). This statistic is calculated using Equation 10, as follows:

where
Another GOF measure used to assess the fitted models was the McFadden Pseudo
The likelihood ratio test (LRT) was also applied to compare a model with a varying dispersion parameter and its fixed dispersion counterpart, for example, the ZI-HTCMP model compared with the ZI-CMP model, and the HTCMP model compared with the CMP model. Here, each latter model is nested to its extended counterpart. The LRT follows a chi-square distribution with degrees of freedom equal to the number of variables significantly found in the dispersion part. For example, the LRT for the HTCMP model compared with its CMP counterpart is shown as follows:

where
For each roadway facility, the Akaike information criterion (AIC) was also used to compare and select the best-fit model, as follows:

where LL is the model’s log-likelihood at convergence, and P is the number of model parameters. It should be noted that the best models are those with the lowest AIC values.
To assess the predictive performance of fitted models developed for each roadway category, two additional GOF measures, the mean absolute deviance (MAD) and the mean square prediction error (MSPE), were also applied using the validation data set, as follows:


where
EB Method for Identifying Intersections with a High Number of CMV Crashes
After developing SPFs for FI CMV crashes at signalized and unsignalized intersections, the EB method was used to rank sites with a high number of FI CMV crashes for each intersection type. In doing this, the expected number of crashes for a specific site was calculated as a weighted average of the predicted number of crashes from the fitted SPF model and observed number of crashes for the site, as follows:

where

where
Signalized Intersection Model Results
FI CMV Crash SPF Results
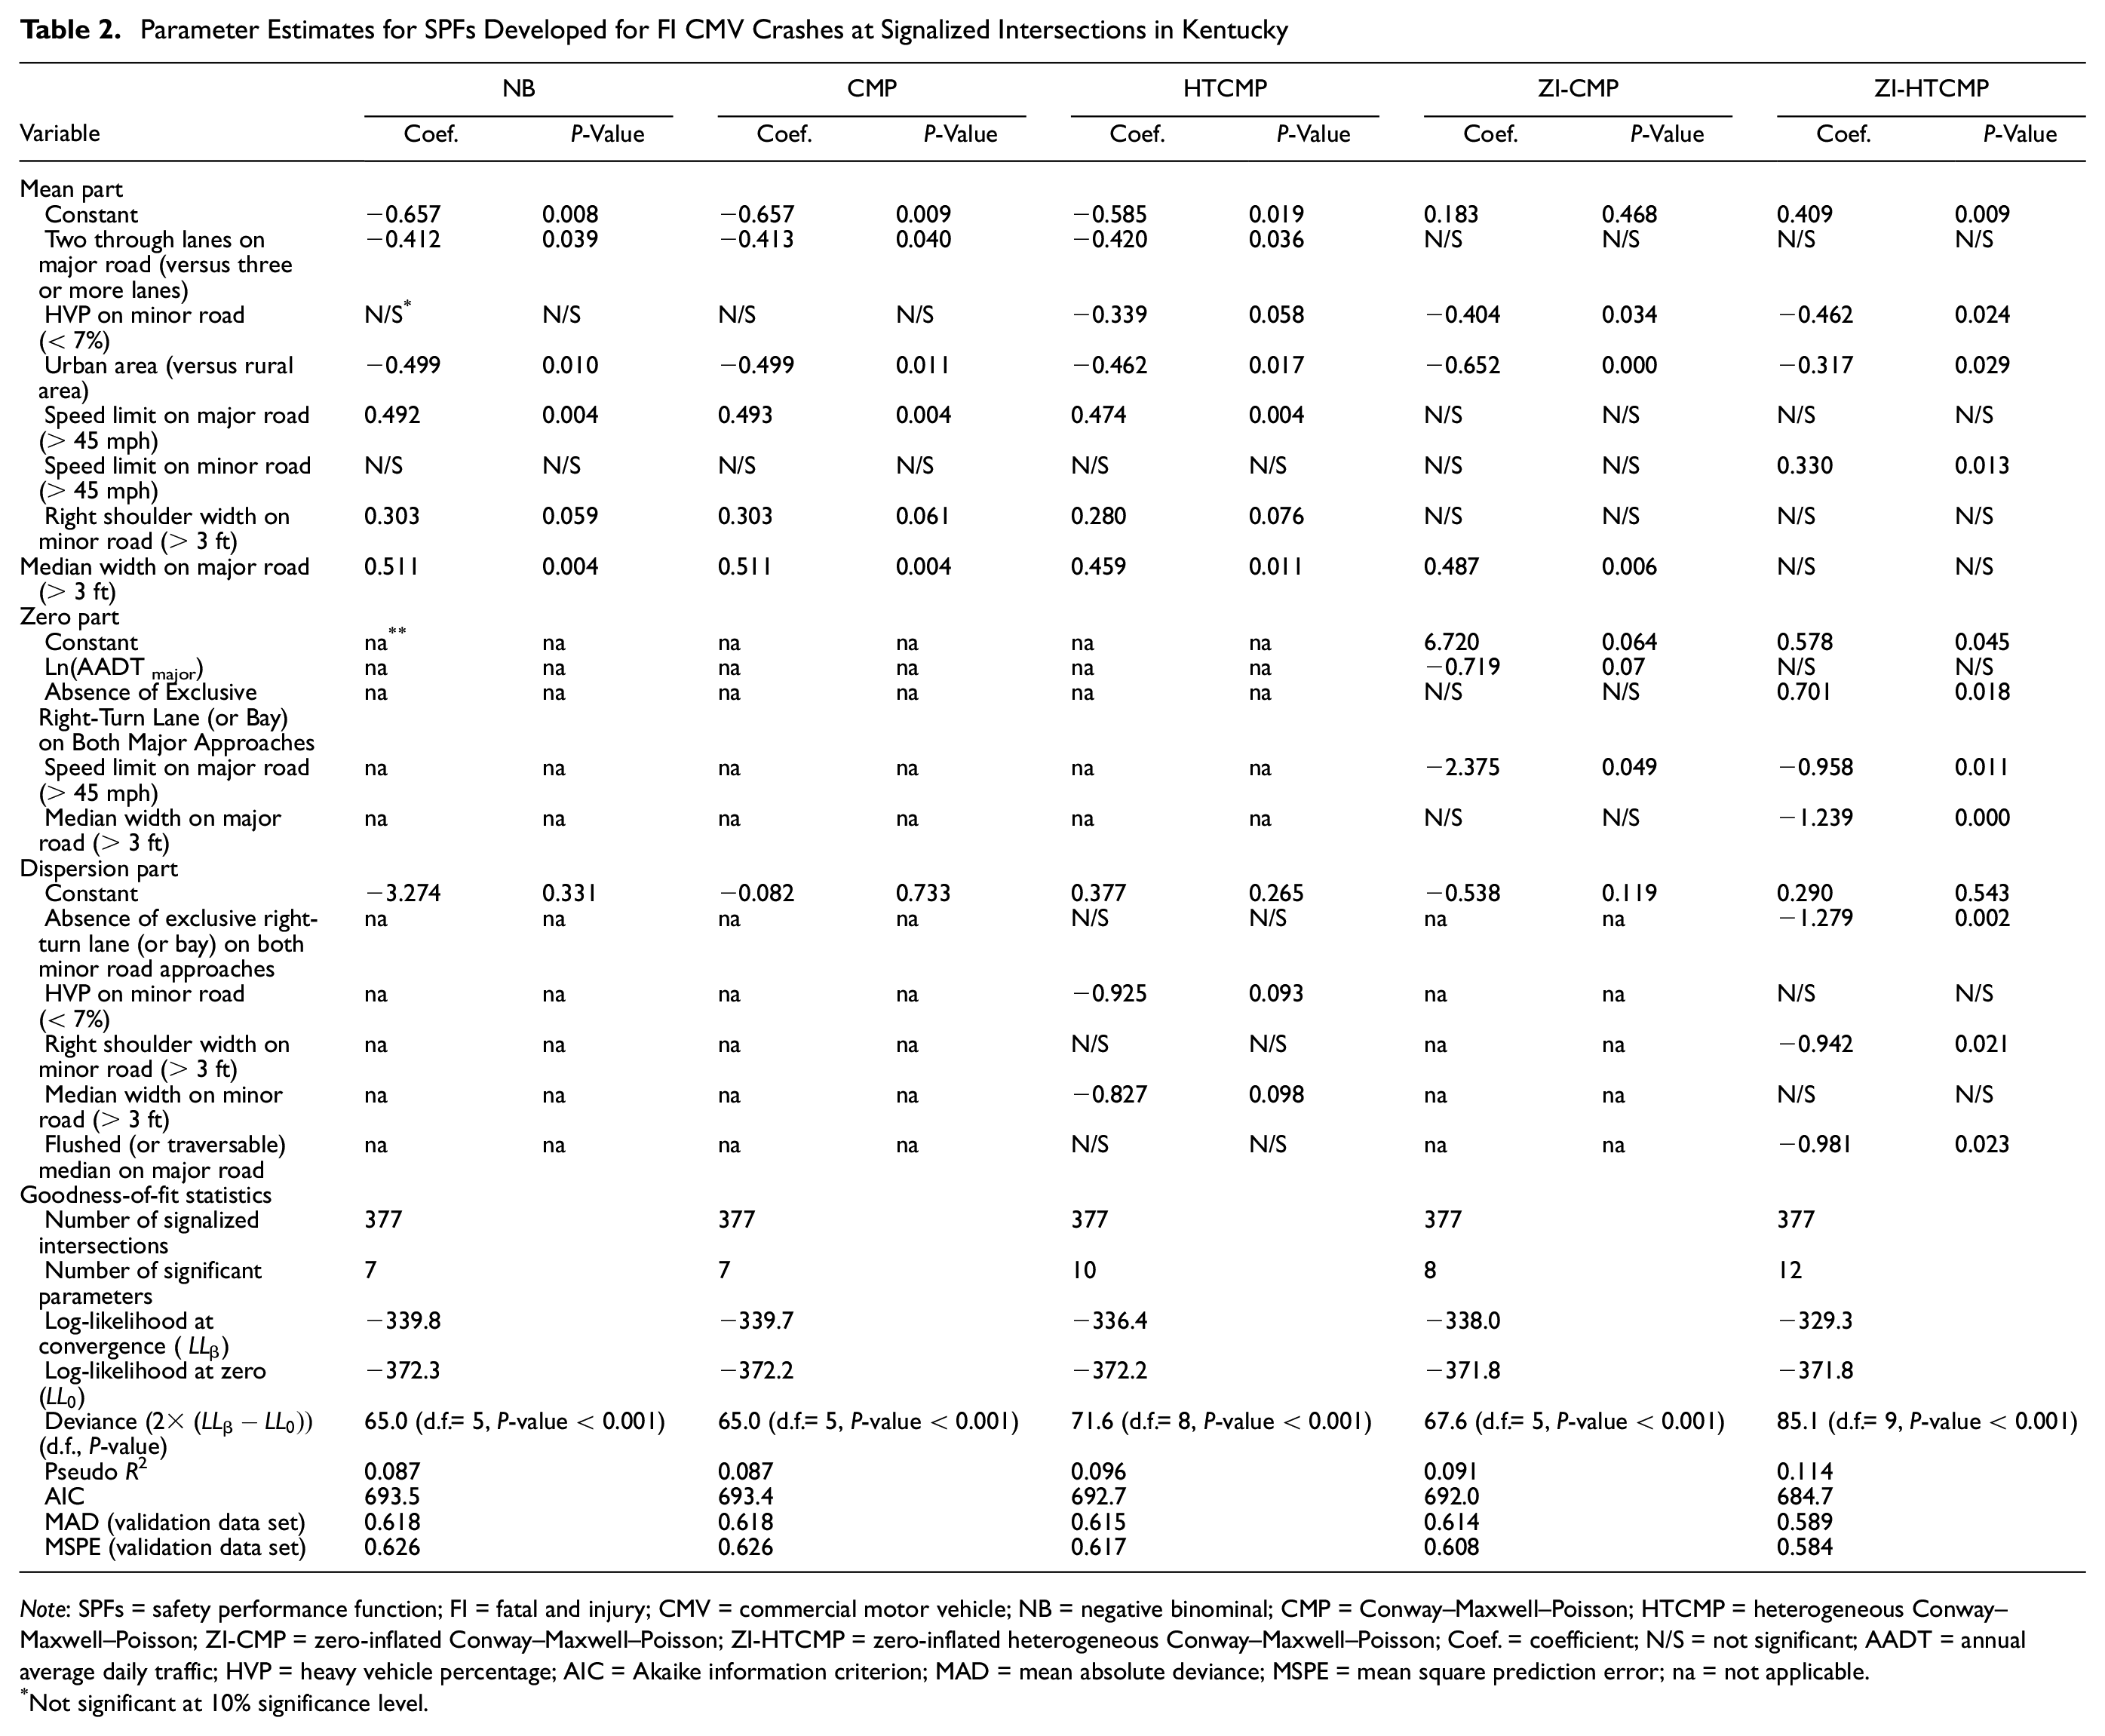
Table 2 shows the results of the NB, CMP, HTCMP, ZI-CMP, and ZI-HTCMP SPF models for FI CMV crashes at signalized intersections. All the models developed were found to have significant deviance statistics, which rejects the null hypothesis that they performed the same as their intercept-only counterparts. “Urban area” was the common significant variable across all five models, although its coefficient magnitude varied slightly between them. With regard to the model performance, all GOF measures used for both the calibration and validation, including Pseudo R2, AIC, MAD, and MSPE, favored the ZI-HTCMP model over the others. Specifically, from the model calibration performance, the ZI-HTCMP model had the highest Pseudo R2 and the lowest AIC values, which testifies to the model’s good fit. From the model validation performance, the ZI-HTCMP model had the lowest MAD and MSPE values, which testifies to the model’s high prediction capability.
Parameter Estimates for SPFs Developed for FI CMV Crashes at Signalized Intersections in Kentucky
Note: SPFs = safety performance function; FI = fatal and injury; CMV = commercial motor vehicle; NB = negative binominal; CMP = Conway–Maxwell–Poisson; HTCMP = heterogeneous Conway–Maxwell–Poisson; ZI-CMP = zero-inflated Conway–Maxwell–Poisson; ZI-HTCMP = zero-inflated heterogeneous Conway–Maxwell–Poisson; Coef. = coefficient; N/S = not significant; AADT = annual average daily traffic; HVP = heavy vehicle percentage; AIC = Akaike information criterion; MAD = mean absolute deviance; MSPE = mean square prediction error; na = not applicable.
Not significant at 10% significance level.
For the ZI-HTCMP model developed for signalized intersections, the absence of an exclusive right-turn lane on both minor road approaches, a right shoulder width of greater than 3ft on the minor road, and median type (flush or traversable medians) on the major road were found to be significantly associated with the dispersion parameter. Because the ZI-HTCMP was the most favorable model (compared with its NB, CMP, HTCMP, and ZI-CMP counterparts), this was selected as the SPF tool for identifying locations at signalized intersections with a high number of CMV crashes. The following sections discuss the detailed results of the ZI-HTCMP model at signalized intersections.
In the count (or mean) part of the ZI-HTCMP model, an HVP of less than 7% was found to reduce FI CMV crashes. This result is intuitive, because the risk of FI CMV crashes increases as the number of heavy vehicles increases ( 14 ). Signalized intersections located in urban areas were found to have a lower number of FI CMV crashes compared with those in rural areas. This is reasonable, because urban intersections experience more traffic and stricter traffic enforcement measures compared with rural intersections. Therefore, drivers are more cautious and less likely to take risky actions, for example, running a red light, at urban signalized intersections, which is consistent with Chen et al. ( 25 ). Signalized intersections with a speed limit on the minor road of greater than 45 mph experienced a higher number of FI CMV crashes. A possible explanation is that drivers tend to approach or cross intersections at greater speeds in areas where posted speed limits are higher, therefore increasing the risk of FI CMV crashes. In addition, higher posted speed limits are typically associated with longer reaction times and stopping distances ( 17 ).
In the zero part of the ZI-HTCMP model, the absence of an exclusive right-turn lane on both major road approaches was found to increase the count of zero FI CMV crashes (or in other words, reduce FI CMV crash occurrence). The explanation is that CMVs and other vehicle types are typically more cautious when making right turns on shared through/right-turn lanes. A similar finding was reached by Dong et al. ( 14 ) and Tarko et al. ( 26 ).
In addition, from the zero part of the ZI-HTCMP model, signalized intersections with a speed limit of greater than 45 mph on the major road experienced fewer zero FI CMV crashes (or more FI CMV crashes). This finding was also reported by Oh et al. ( 4 ) and Dong et al. ( 14 ). Medians of wider than 3 ft on a major road were negatively correlated with zero FI CMV crashes (or more FI CMV crashes) at signalized intersections. A plausible explanation is that wider medians are typically used for larger multilane intersections, where the risk of multivehicle crashes, for example, rear-end and angle collisions, is high, as is the tendency for drivers to be aggressive, which could result in FI crashes, especially when CMVs are involved.
Identification of Locations at Signalized Intersections with a High Number of FI CMV Crashes
The results of the ZI-HTCMP model were incorporated into the EB method to compute EECs for signalized intersections in Kentucky and rank signalized intersections prone to FI CMV crashes. Table 3 shows the top 10 hazardous signalized intersections ranked using the EEC method. It can be seen from Table 3 that all the top 10 intersections (for FI CMV crashes) were 4-legged, with 70% of these located in urban areas. The average
Top 10 Signalized Intersections with a High Number of CMV Crashes
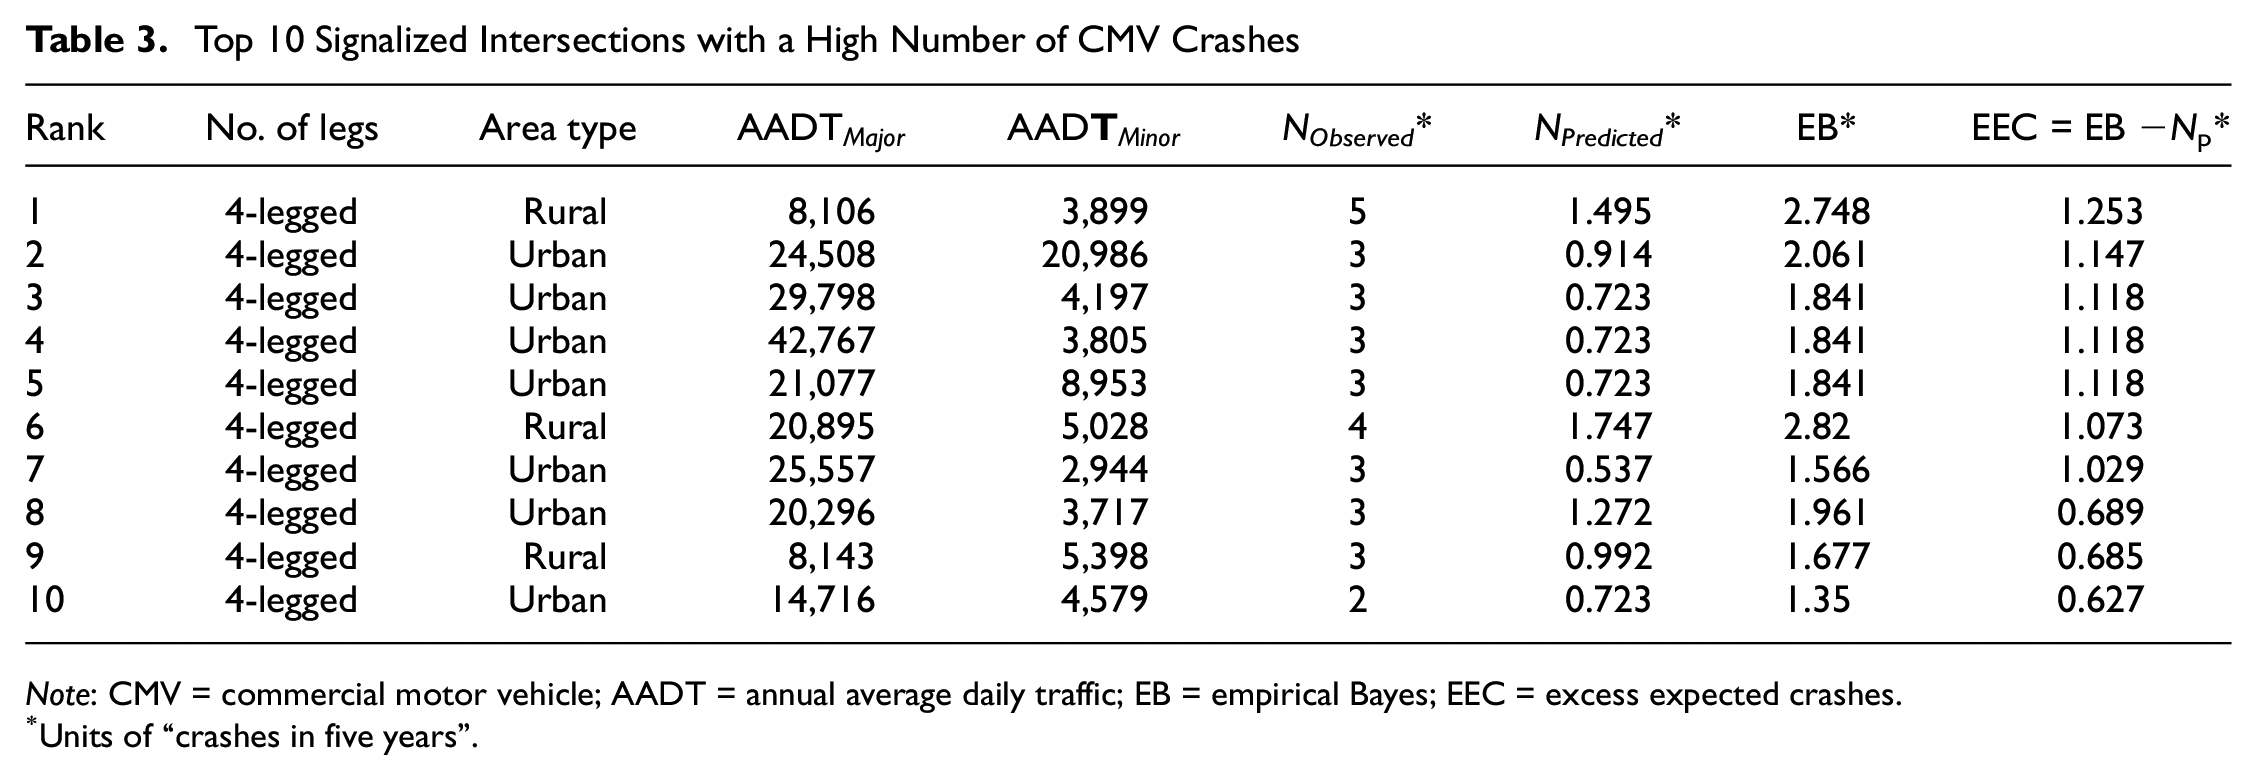
Note: CMV = commercial motor vehicle; AADT = annual average daily traffic; EB = empirical Bayes; EEC = excess expected crashes.
Units of “crashes in five years”.
The top 10 signalized intersections with a high number of crashes were further analyzed using Google Maps ( 15 ), and by a detailed review of police narratives. The relevant information and crash characteristics for the top 10 signalized intersections with a high number of CMV crashes are provided in Figure 3.
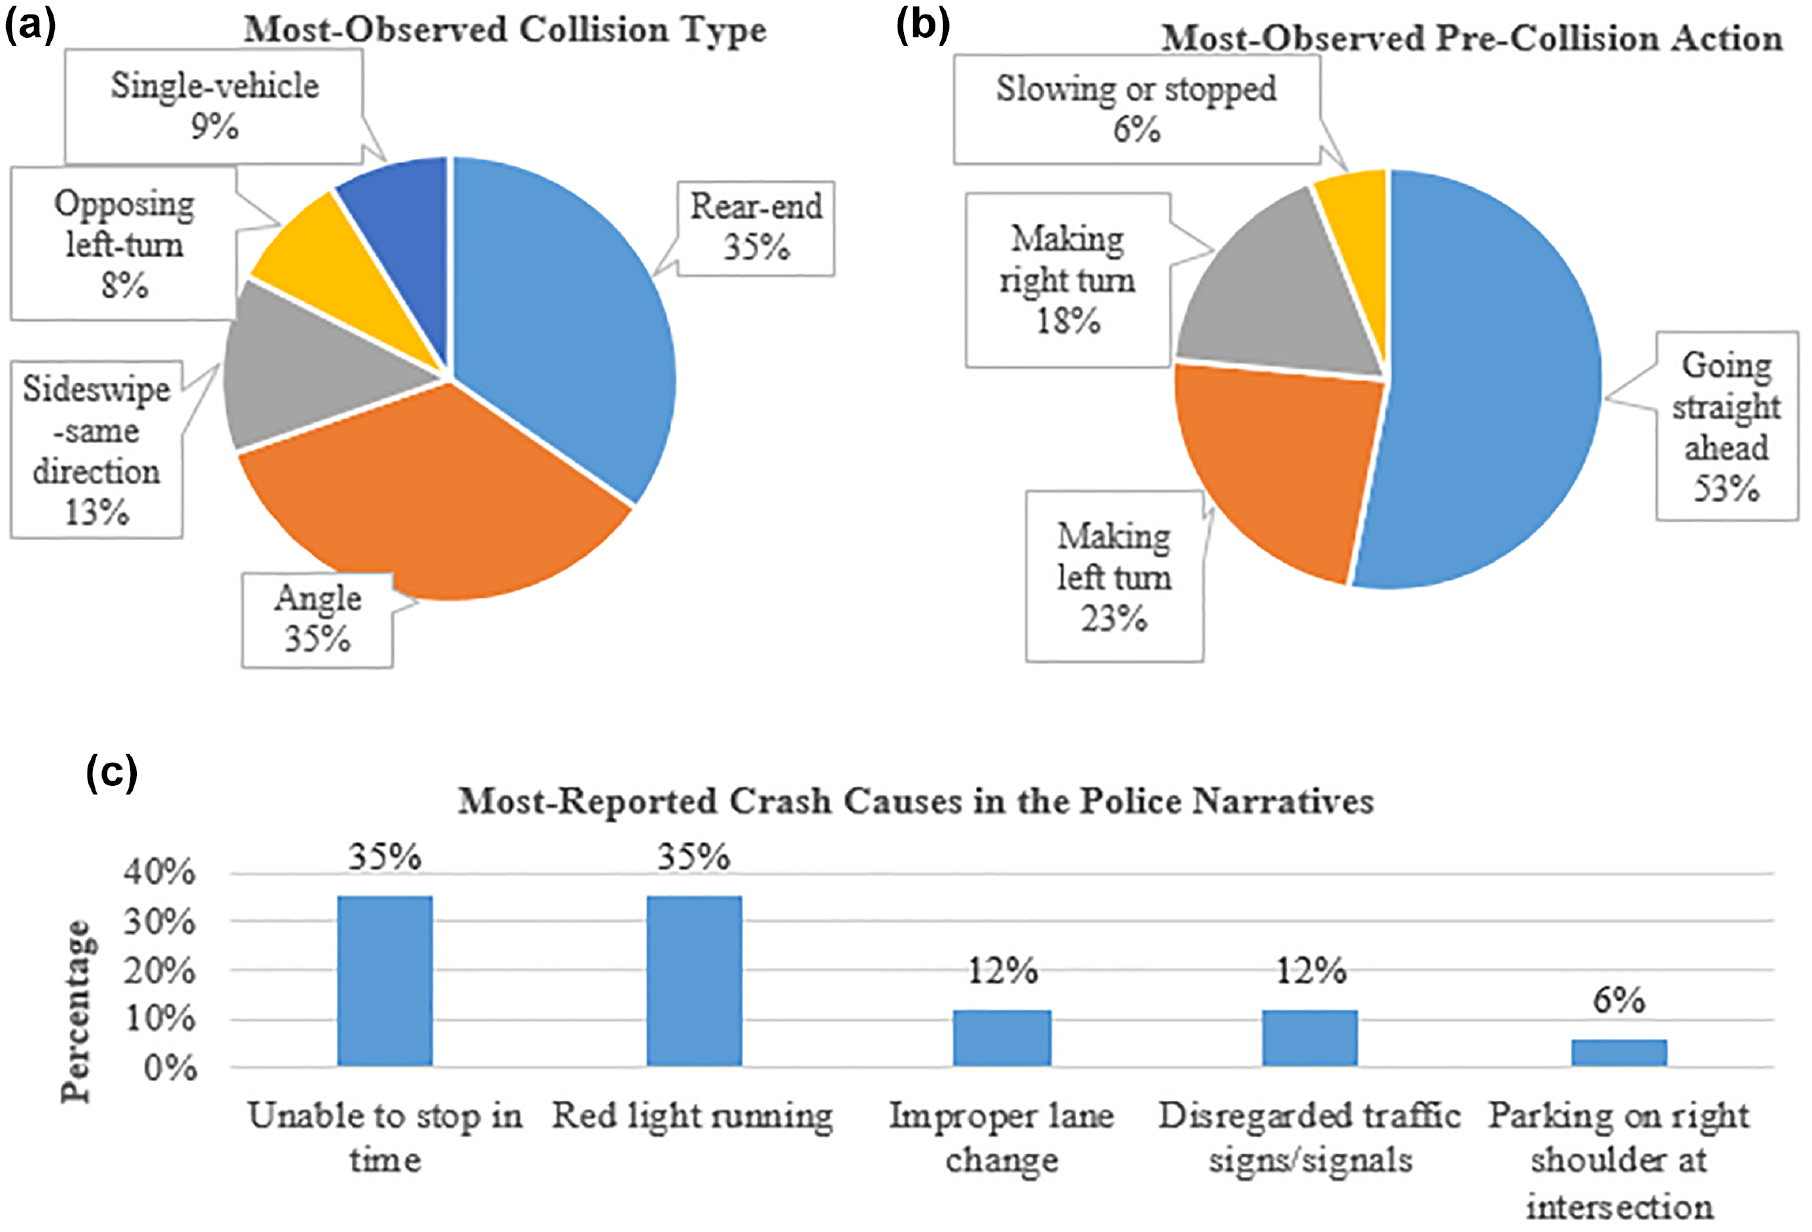
Plots of site-specific and CMV crash characteristics for the top 10 signalized intersections with a high number of crashes: (a) most observed collision type, (b) most observed pre-collision action, and (c) most mentioned crash causes from police narrative.
It can be seen from Figure 3 that rear-end and angle collisions together made up 70% of the total of FI CMV crashes that occurred at the top 10 high-crash sites. “Going straight ahead” and “Making left turn” were the first and second most frequent pre-collision actions, respectively. Together, these accounted for 76% of total FI CMV crashes at the top 10 sites that had a high number of crashes. “Inability to stop on time” and “Running a red light” were the two main causes of crashes according to the police narratives. Together, these two factors accounted for about 70% of the total FI CMV crashes at the top 10 sites that had a high number of crashes. Further investigation of the top 10 signalized intersections with a high number of crashes has revealed that CMV drivers were responsible (or found to be at fault) for 80% of FI CMV crashes that occurred here.
The aforementioned crash-specific characteristics (shown in Figure 3), and the results of the best model in Table 2 (ZI-HTCMP), could help propose potential countermeasures to improve CMV safety at signalized intersections, as follows:
lowering speed limits at those signalized intersections with a high number of CMV crashes caused by speeding or other aggressive driving actions;
minimizing conflicts between major road right-turning traffic and minor road through traffic, for example, by adding “no right turn on red” signs;
promoting the use of in-vehicle crash prevention systems, such as autonomous emergency braking (AEB) and emergency brake assistance (EBA), to reduce CMV crashes related to driver error (e.g., inability to stop in time);
intensifying enforcement at those signalized intersections where aggressive driving (e.g., running a red light) is a problem;
improving driver training/education programs and CMV driving skills to enable drivers to negotiate signalized intersections safely, especially when making turning-related maneuvers.
Unsignalized Intersection Model Results
FI CMV Crash SPF Results
Similar to the SPFs for the signalized intersections, five FI CMV crash frequency SPFs (NB, CMP, HTCMP, ZI-CMP, and ZI-HTCMP), were fitted and compared at unsignalized intersections. It should be noted that no variables were found to be significantly associated with the zero part of the ZI-CMP model. As a result, the ZI-CMP model was excluded from the analysis. Table 4 shows the modeling results and also the GOF statistics for the four fitted SPF models for FI CMV crashes at unsignalized intersections. For all models, the corresponding deviance statistics were significant at the 1% significance level, indicating a reasonable prediction performance for the models developed compared with their intercept-only counterparts. It can be seen from Table 4 that “Speed limit on major road > 45 mph” and “Right shoulder width on major road > 3 ft” were the only two common significant variables across all four SPFs.
Parameter Estimates for SPFs Developed for FI CMV Crashes at Unsignalized Intersections in Kentucky
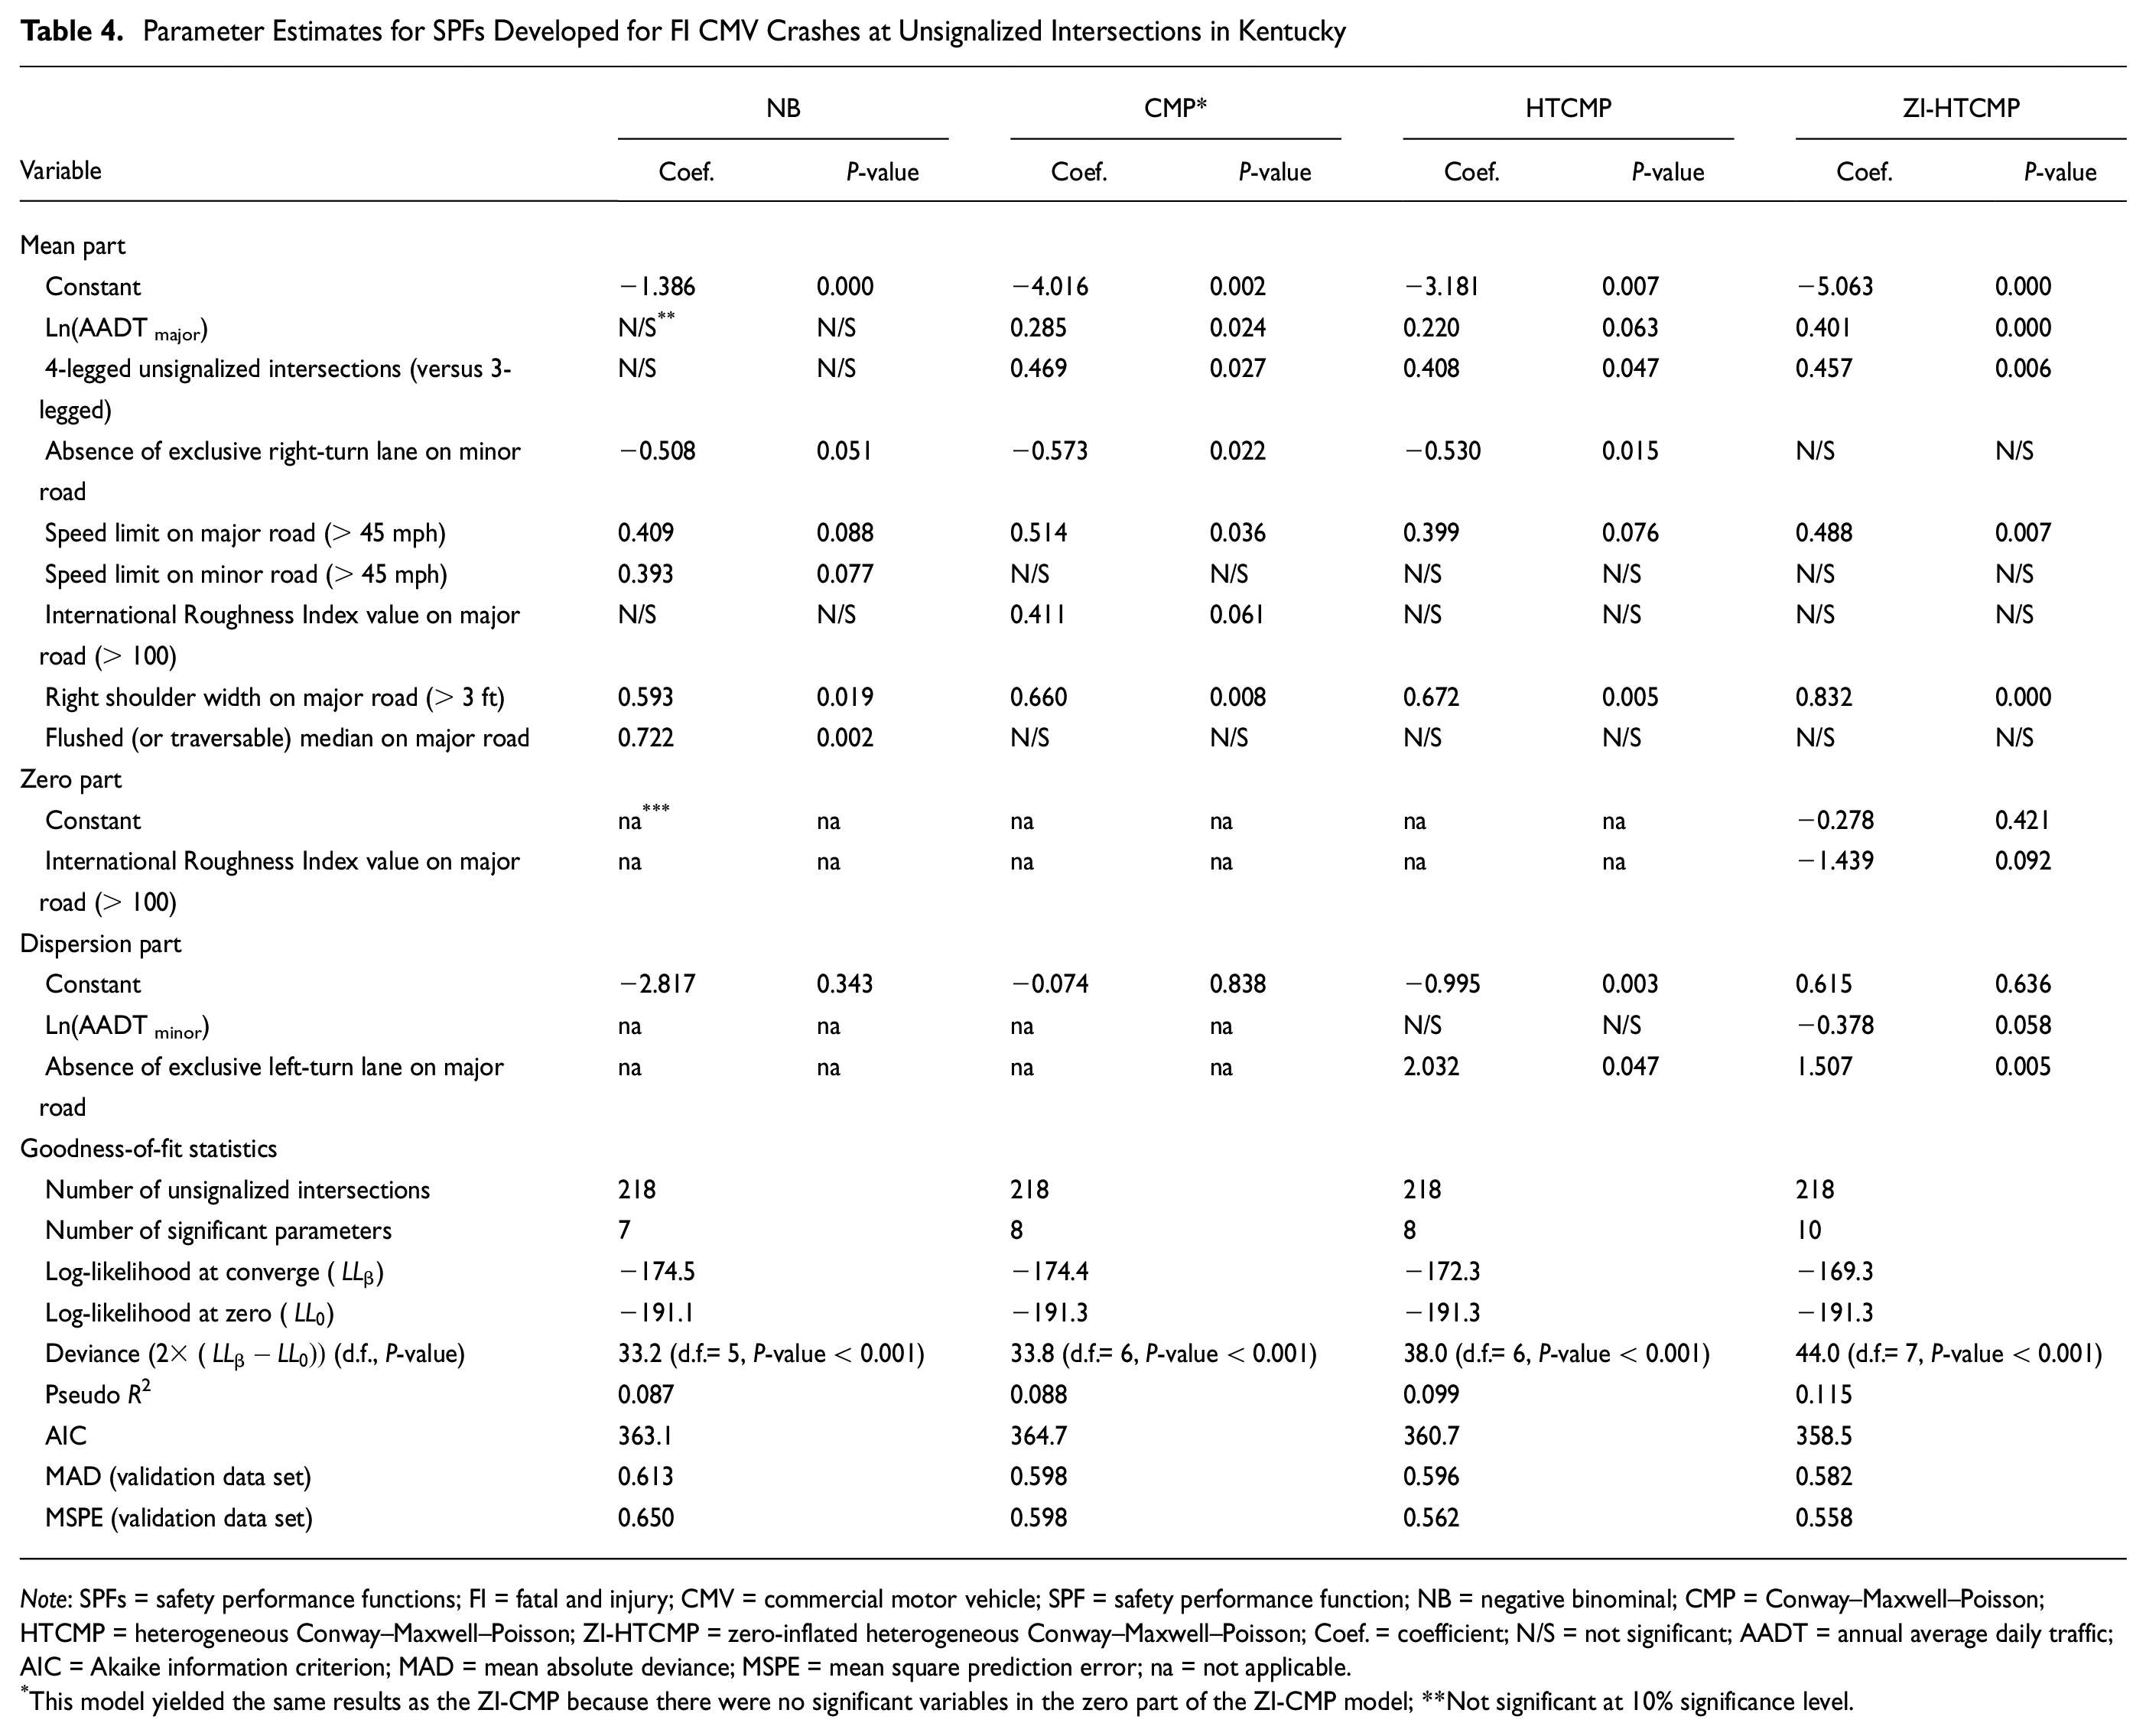
Note: SPFs = safety performance functions; FI = fatal and injury; CMV = commercial motor vehicle; SPF = safety performance function; NB = negative binominal; CMP = Conway–Maxwell–Poisson; HTCMP = heterogeneous Conway–Maxwell–Poisson; ZI-HTCMP = zero-inflated heterogeneous Conway–Maxwell–Poisson; Coef. = coefficient; N/S = not significant; AADT = annual average daily traffic; AIC = Akaike information criterion; MAD = mean absolute deviance; MSPE = mean square prediction error; na = not applicable.
This model yielded the same results as the ZI-CMP because there were no significant variables in the zero part of the ZI-CMP model; **Not significant at 10% significance level.
Similar to the SPF model development for signalized intersections, the ZI-HTCMP model had the highest Pseudo R2 and the lowest AIC values, which testifies to the model’s good fit. Moreover, from the model validation performance, the ZI-HTCMP model had the lowest MAD and MSPE values, which testifies to the model’s high prediction capability. There were two variables in the ZI-HTCMP model that explained its varying dispersion parameter: the natural logarithm of AADT on the minor road “Ln(AADTminor)”; and absence of an exclusive left-turn lane on the major road.
In the count (or mean) part of the ZI-HTCMP model, the AADT on the major road was found to increase the number of FI CMV crashes at unsignalized intersections. This is expected; as the number of vehicles approaching the intersection increases, the exposure to FI traffic crashes also increases ( 6 , 7 , 26 ). Four-legged intersections had a higher number of FI CMV crashes compared with 3-legged intersections. This result is not surprising because 4-legged intersections have a higher degree of complexity and number of conflicting movements compared with 3-legged intersections. This leads to more CMV crashes, especially FI ones ( 7 , 26 ).
Unsignalized intersections with a speed limit greater than 45 mph on the major road were found to experience more FI CMV crashes. This result is in accordance with expectations because on intersection approaches with higher speed limits, drivers tend to travel at higher speeds ( 8 ). The frequency of FI CMV crashes was found to increase with the increase in width of the major road right shoulder. This might be because wider shoulders are inappropriately used by drivers to navigate through the intersection or to pass other waiting vehicles ( 14 ).
In the zero part of the ZI-HTCMP model, an International Roughness Index (IRI) value of greater than 100 on the major road was found to reduce the count of zero FI CMV crashes (i.e., increase the number of FI CMV crashes) at unsignalized intersections. A higher IRI value indicates a rougher pavement surface, which makes it difficult for drivers to control their vehicles (especially CMVs) when braking or turning, therefore increasing the count of FI CMV crashes ( 17 ).
Identification of Locations at Unsignalized Intersections with a High Number of FI CMV Crashes
The results of the ZI-HTCMP model were incorporated into the EB method to compute EECs for unsignalized intersections in Kentucky. Table 5 shows the top 10 unsignalized intersections with a high number of CMV crashes. The intersections were ranked according to the magnitude of their EECs. It can be seen that 60% of unsignalized intersections that had a high number of FI CMV crashes were located in rural areas. In addition, the majority (70%) of the locations were 4-legged unsignalized intersections. For the top 10 high-risk sites, the average AADT on major (
Top 10 Unsignalized Intersections with a High Number of CMV Crashes
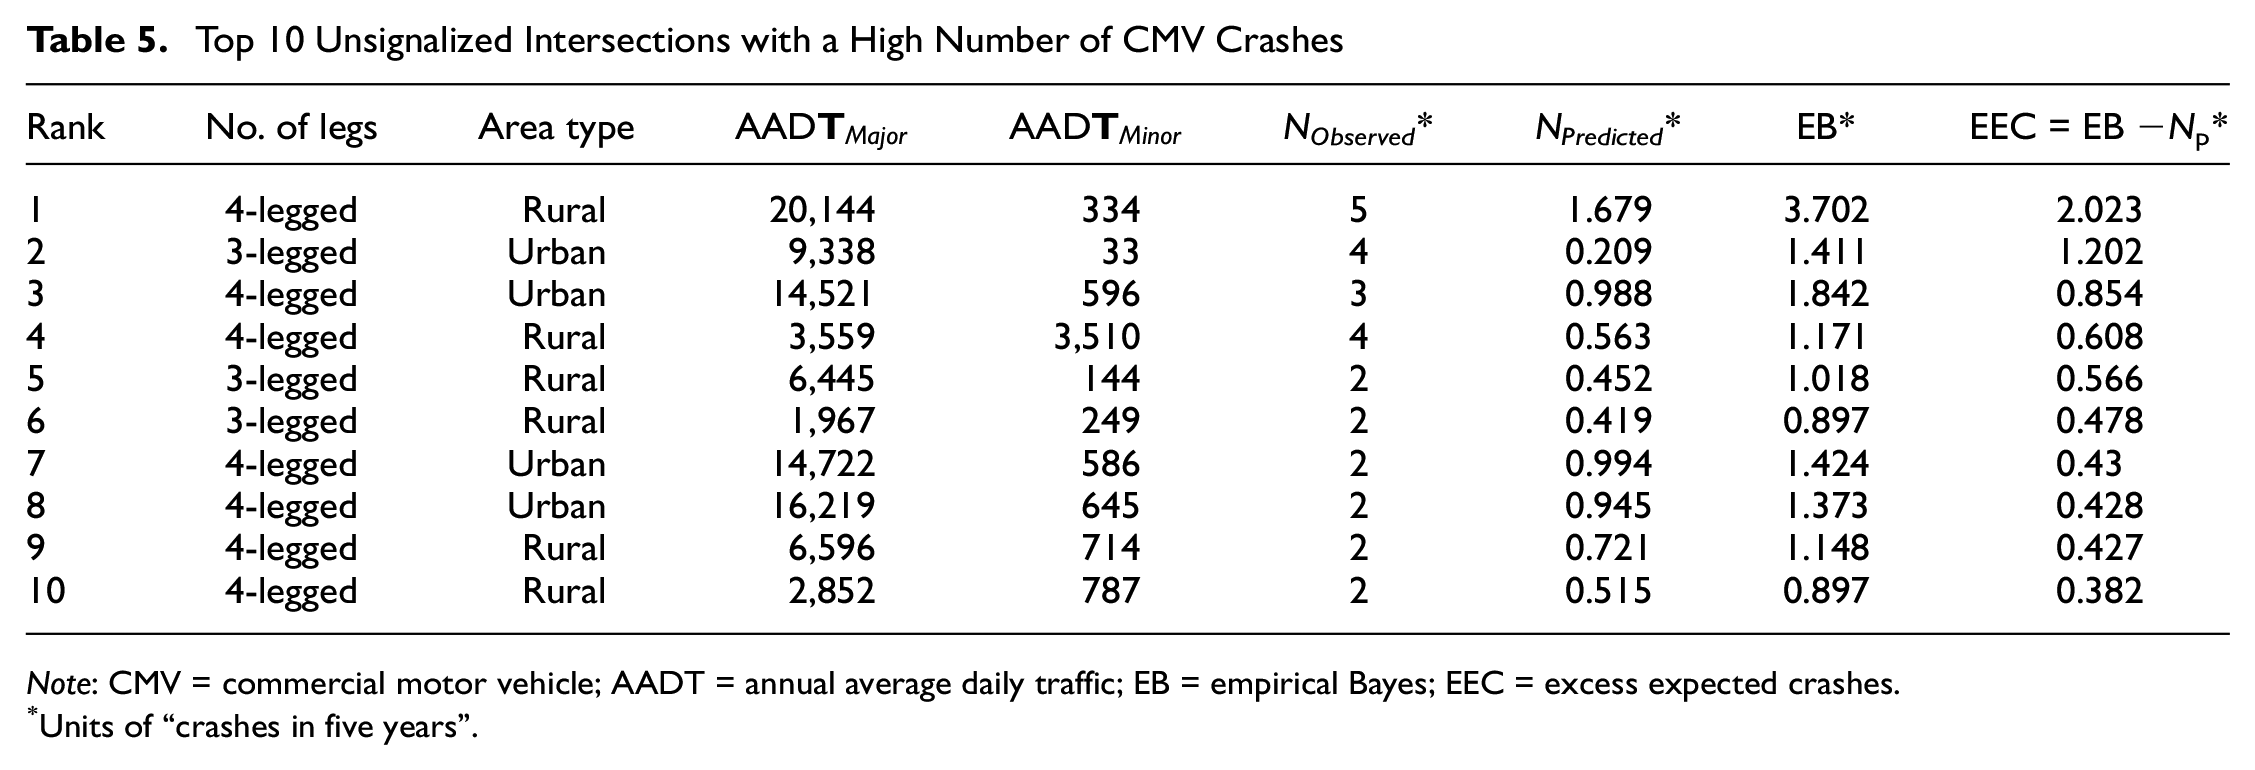
Note: CMV = commercial motor vehicle; AADT = annual average daily traffic; EB = empirical Bayes; EEC = excess expected crashes.
Units of “crashes in five years”.
Figure 4 depicts the proportions of the different categories of most frequent collision type, most frequent pre-collision action, and most mentioned crash causes for the top 10 high-risk sites identified. It can be seen from Figure 4 that rear-end and angle collisions together accounted for over half of the total crashes that occurred at the top 10 unsignalized intersections that had a high number of crashes. With regard to the most frequent pre-collision actions, “Going straight ahead” and “Making left turn” accounted for, respectively, 45% and 25% of the total FI CMV crashes at the top 10 sites that had the highest number of crashes. “Inability to stop on time,”“Improper lane change,” and “Failure to stop at stop sign” were the top three causes of crashes according to the police narratives. Together, these accounted for 78% of the total FI CMV crashes at the top 10 sites that had the highest number of crashes. Similar to signalized intersections, many of the FI CMV crashes at unsignalized intersections were attributed to CMV drivers’ failure to go straight ahead safely, turn properly, stop on time, or stop at a stop sign. Further investigation of the top 10 unsignalized intersections with a high number of crashes has revealed that CMV drivers were responsible (or found to be at fault) for 70% of FI CMV crashes that occurred at these locations.
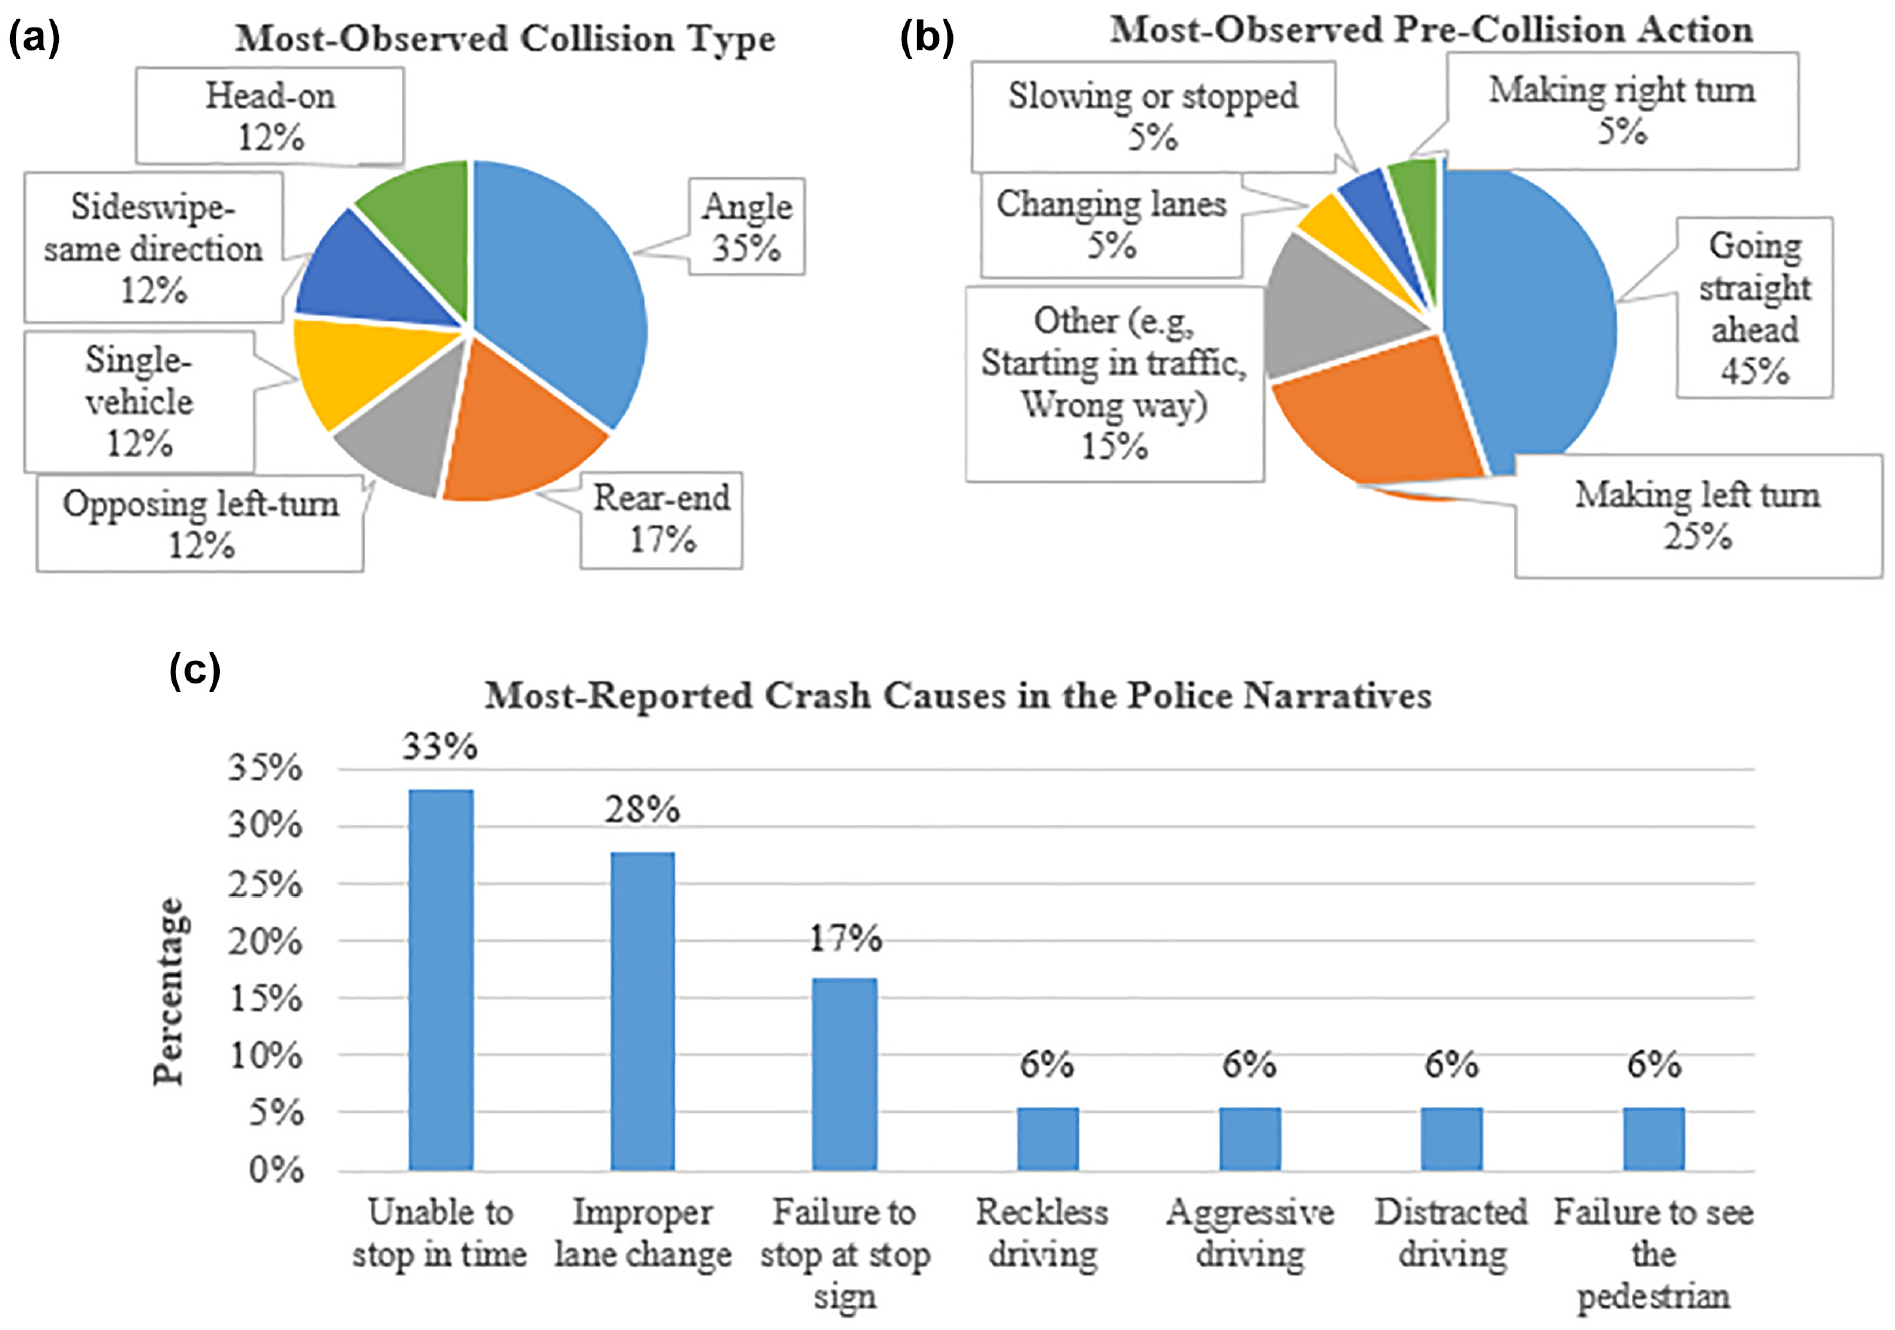
Plots of site-specific and CMV crash characteristics for the top 10 unsignalized intersections with a high number of crashes: (a) most observed collision type, (b) most observed pre-collision action, and (c) most mentioned crash causes from police narrative.
The aforementioned crash-specific characteristics (in Figure 4), and also the results of the best model in Table 4 (ZI-HTCMP), could help propose potential countermeasures to improve CMV safety at unsignalized intersections, as follows:
improving pavement surface condition on the major approaches to unsignalized intersections;
lowering speed limits at those unsignalized intersections with a high number of crashes caused by speeding or other aggressive driving actions;
promoting the use of in-vehicle crash prevention systems, such as AEB and EBA, to reduce CMV crashes related to driver error (e.g., inability to stop on time);
intensifying enforcement at those unsignalized intersections with a high number of violations;
intensifying enforcement at unsignalized intersections where aggressive driving (e.g., speeding) is a problem;
improving driver training/education programs and CMV driving skills to enable drivers to negotiate unsignalized intersections safely, especially when making turning-related maneuvers.
Conclusions
This study presented the results of SPFs developed for FI CMV crashes that were separately fitted at both signalized and unsignalized intersections in the state of Kentucky. Five count-response regression models (NB, CMP, HTCMP, ZI-CMP, and ZI-HTCMP) were developed and compared at each intersection type. FI CMV crash data for a period of five years (2015 to 2019) were collected. Information on several road-specific characteristics, for example, shoulder width, median width and type, IRI value, posted speed limit, and traffic volume (including AADT and HVP), was collected from the KYTC roadway inventory database. Information on other intersection-specific characteristics, for example, number of through lanes, and presence of exclusive left- and right-turn lanes on major and minor roads, was collected manually by the research team using Google Maps ( 16 ).
For both signalized and unsignalized intersections, the ZI-HTCMP model outperformed the other comparative models (i.e., the NB, CMP, HTCMP, and ZI-CMP). The appropriateness of the ZI-HTCMP model shows that this approach, with a varying dispersion parameter, could effectively handle the issues of excess zeros and overdispersion through incorporating different sets of variables in the zero and dispersion parts at both signalized and unsignalized intersections. For example, at signalized intersections, the ZI-HTCMP model showed that the absence of an exclusive right-turn lane on both major road approaches explained the presence of excess zero FI CMV crash counts, whereas the absence of an exclusive right-turn lane on both minor road approaches, a right shoulder width of greater than 3 ft on the minor road, and median type (flush or traversable medians) on the major road were found to be significantly associated with the dispersion parameter.
For signalized intersections, the results of the ZI-HTCMP model showed that a minor road HVP of less than 7 % and the intersection being in an urban area significantly reduced FI CMV crashes, whereas a speed limit greater than 45 mph on the major road, a speed limit greater than 45 mph on the minor road, and medians on the major road wider than 3 ft were significantly associated with an increased number of FI CMV crashes. With regard to unsignalized intersections, higher major road AADT, 4-legged intersection configurations, a speed limit greater than 45 mph on the major road, a right shoulder width of greater than 3 ft on the major road, and an IRI value of greater than 100 on the major road were significantly associated with an increased number of FI CMV crashes. The identification of different significant variables in the SPFs for the signalized and unsignalized intersections supported the need to fit separate models rather than combining both types of intersection into one.
The results of the separate ZI-HTCMP models (for both signalized and unsignalized intersections) were used to identify the top 10 hazardous locations for each intersection type using the EB method. The thorough inspection showed that CMV drivers were mainly responsible for FI CMV crash occurrence at both intersection types. Rear-end and angle crashes were the two most observed collision types at both intersection types, and “Inability to stop on time” and “Improper lane change” were the two main causes of crashes at both signalized and unsignalized intersections. Moreover, CMV drivers were mainly responsible for FI CMV crash occurrence at both intersection types.
Based on the SPF model findings, several safety countermeasures were proposed to enhance the safety of CMV movements at intersections. At signalized intersections, the recommendations are as follows: lower speed limits at those intersections with a high number of CMV crashes caused by speeding or other aggressive driving actions; and minimize conflicts between major road right-turning traffic and minor road through traffic by adding “no right turn on red” signs. At unsignalized intersections, the recommendations are as follows: improve the pavement surface condition on the major approaches to unsignalized intersections; and intensify enforcement at those unsignalized intersections with a high number of traffic violations (especially aggressive driving and speeding).
It should be noted that the parameter estimates in the study might have been affected by the random sampling when dividing the data into calibration and validation data sets. Furthermore, the main findings from the fitted SPFs for FI CMV crashes at signalized and unsignalized intersections in this study are based mainly on CMV crashes in the state of Kentucky. Therefore, the results need to be generalized with caution. Specifically, other states that would like to implement the findings and recommendations from the study would need to have similar CMV crash and traffic characteristics to Kentucky. In addition, the best proposed modeling approach, the ZI-HTCMP model, might not be typically better than other count models (because this finding was mainly based on Kentucky’s CMV crash data). Nevertheless, the ZI-HTCMP model is a promising approach that can handle both overdispersed and underdispersed crash data. Future research could compare the SPF model results for FI CMV crashes at both signalized and unsignalized intersections in Kentucky with those from models developed using FI CMV crash data from other states in the U.S.A., and other countries besides.
Footnotes
Acknowledgements
The authors would like to thank the Kentucky Transportation Cabinet for providing the necessary crash and roadway data used in this research. The authors would also like to thank the following students who contributed to the data collection process: Jessica Clouser, Baron Williams, Nicholas Abshire, Tevin Leigh, Ryan Love, and Ryan Mains.
Author Contributions
The authors confirm contribution to the paper as follows: study conception and design: K. Haleem; data collection: M. Hosseinpour; analysis and interpretation of results: M. Hosseinpour; draft manuscript preparation: K. Haleem, M. Hosseinpour. All authors reviewed the results and approved the final version of the manuscript.
Declaration of Conflicting Interests
The author(s) declared no potential conflicts of interest with respect to or publication/or publication of this article.
Funding
The author(s) disclosed receipt of the following financial support for the research, authorship, and/or publication of this article: This research was funded by a grant from the Kentucky Transportation Cabinet.
The opinions, findings, and conclusions in this paper are those of the authors and not necessarily those of the Kentucky Transportation Cabinet.