
Abstract
Prior research on perceived walkability finds generally positive associations between walkability, walking behavior, and well-being. However, these relationships are little examined in the Global South, particularly in locations with significant environmental stressors. This study examined relationships between perceived walkability, walking behavior, and subjective well-being, using a survey of residents in two neighborhoods in Delhi, India. In particular, it examined whether perceived walkability covaried with walking behavior under conditions of environmental stress, and how walking and perceptions of the walking environment affected subjective well-being. Following a descriptive examination of mobility and perceptions, the concept of “walking dissonance” was empirically operationalized, a condition in which individuals walk frequently despite negative perceptions of walkability. Multivariate linear regression assessed the relationship between walking dissonance and subjective well-being, controlling for other factors. The results showed that in these neighborhoods, perceptions of low environmental quality were associated with perceptions of poor walking conditions. Nevertheless, walking behavior did not consistently correlate with these perceptions. Conflict between walking perceptions and behavior may be associated with impacts to well-being that should concern decision makers investing in transportation infrastructure and the built environment.
Keywords
Even with significant, ongoing investment in multimodal transportation, Delhi remains a city dominated by walking. Most neighborhoods are dense, and the affordability of other modes remains out of reach for many ( 1 ). Travelers are directly exposed to a difficult environment, with air pollution, noise, and built and natural features that vary significantly in their quality and maintenance. Much of the transportation literature assumes that the walking environment and walking behavior are positively correlated: walkability encourages more walking. However, places like Delhi suggest that the relationship may not be so simple. Objective walkability and perceived walkability are separate if related phenomena, and for some individuals, walking behavior may be disconnected from objective or perceived walkability. This study examines relationships between self-reported walking behavior and perceived walkability at the level of individual travelers in two neighborhoods where walking is consistently challenging. The analysis helps address the lack of research on walkability and walking in conditions of environmental stress and limited resources, such as those in Delhi and many other parts of the Global South and North. In particular, the study examines how perceived walkability covaries with walking behavior under conditions of environmental stress, and how a disconnect between walking and walkability may affect personal well-being.
This study utilizes a survey of residents in two Delhi neighborhoods—Bhalswa Dairy and Batla House—with primarily low-income populations that have received little attention or investment from authorities. These neighborhoods both face significant environmental stressors in relation to air, water, and the built environment. Despite the challenging walking environment, perceptions of walkability still vary substantially among individuals. The study examines whether perceived walkability positively covaries with walking behavior. Then, the potential implications of a “dissonance” between perceived walkability and local walking behavior are explored. Given the observed disconnect between perceived walkability and walking behavior, walking dissonance (WD) is operationalized as the difference between a standardized measure of walking behavior and a standardized measure of perceived walkability. Multivariate linear regression examines the relationship between WD and subjective well-being, controlling for demographic factors and the built environment at the neighborhood scale. The findings highlight that conflicts between walking perception and behavior may be associated with impacts to well-being that should concern decision makers investing in transportation infrastructure and the built environment.
Literature Review
Walking research generally theorizes that walkability, by definition, contributes to higher levels of walking ( 2 ). “Objective” walkability can be measured, frequently using built environment characteristics such as network density and destination proximity, and is associated with higher rates of walking ( 3 , 4 ). The factors included in this type of estimated walkability can be empirically selected and validated or chosen normatively. Most walkability studies have been conducted in North America, Europe, and other parts of the Global North, with a relative lack of research in the Global South ( 5 ). Because of this emphasis, objective walkability measures tend to focus on features of the built environment that are relevant to an urban-to-suburban built environment context, where network and destination density are among the most powerful explanatory factors of walking behavior ( 6 ). Conversely, in many developing cities, density may be high but other factors may have a significant impact on whether to walk, including the presence of walking infrastructure and environmental quality ( 7 ).
Perceived Walkability
In addition to objective walkability, research has increasingly focused on the perceptual dimensions of walkability ( 5 , 8 ). As with all travel behavior, the choice to walk is based on an individual’s perception of the ease of walking relative to other modes or not traveling ( 9 ). A 2023 survey of perceived walkability research by De Vos et al. provides a broad view of recent research ( 8 ). Their review examines 42 studies of perceived walkability between 2009 and 2022, and identifies links between objective walkability, perceived walkability, and walking behavior, health, and well-being. Perceived walkability itself can be disaggregated into perceptions of different features of the walking environment, including accessibility, safety, aesthetics, and density, as has been operationalized with the Neighborhood Environment Walkability Scale (NEWS). NEWS, which has been revised multiple times, has been validated across 14 countries globally and finds that walkability can be compared across countries ( 10 ). Only limited studies examine how demographic factors influence perceived walkability ( 8 ). For example, Adkins et al. found that perceived walkability varied within a given environment among Mexican American and non-Hispanic white survey respondents (N = 190) in Tucson, AZ ( 11 ) . With regard to a connection between perceived walkability and mental health, Hernandez et al. found that perceived walkability was not a long-run predictor of depression among older Latino adults in the Los Angeles region (N = 570), though perceptions of neighborhood crime (a component of walkability) specifically did affect well-being over time ( 12 ) .
Of the 42 studies in De Vos et al.’s extensive review of perceived walkability, only five are from developing countries. A study by Yin et al. of 782 respondents in Xi’an, China, identified links between perceived walkability, trip satisfaction, and overall well-being ( 13 ). In a study from Zhangzhou, China, urban regeneration efforts were found to influence perceived walkability and, in turn, the recreational walking of 23 residents ( 14 ). Lucchesi et al. studied the effect of perceived walkability on real estate prices, mediated by life satisfaction, in a study of 1,884 adults in Rio de Janeiro and Sao Paulo, Brazil; they found that perceived walkability was associated with increased real estate prices, but the effect varied between the two cities ( 7 ). In Bandung, Indonesia, Syafriharti et al., using logistic models of the choice to walk, found that perceived walkability can encourage motorcyclists to shift to walking (N = 1,349) ( 15 ).
Additional studies beyond the De Vos et al. review also examined perceived walkability in the Global South. Villaveces et al. undertook a study of 400 adults in Cali, Colombia, using intercept interviews and quantitative and qualitative methods ( 16 ). They found that pedestrians were generally dissatisfied with walking conditions, highlighting that walking is not always a positive experience. A study by Arellana et al. examining perceived walkability in Baranquilla, Colombia used multinomial logit modeling to estimate walkability of specific streets based on walkability preferences of 340 adults ( 5 ). However, the study does not examine how estimated walkability relates to walking behavior. Oyeyemi et al. validated the NEWS scale for Nigeria ( 17 ). A survey of 386 adults across multiple cities found the components of the NEWS walkability scale had low to moderate (r = 0.10 to 0.31) correlations with reported physical activity. Overall, these studies contribute to a growing understanding that perceived walkability has a significant connection to both objective walkability as well as behavior and well-being. However, few studies have addressed developing countries, and the limited research in those countries raises questions about the relationship between perceived walkability and walking behavior.
Environmental Stressors and Walkability
Although perceived walkability research has generally focused outside the Global South, other research on walking has generally documented that walking in urban environments can exact a toll in relation to safety, exposure to emissions and noise, and mental well-being. In Delhi specifically, researchers have observed how pedestrians are exposed to significant traffic safety hazards ( 18 ), air pollution ( 19 , 20 ), and noise ( 21 ). Rankavat and Tiwari examined perceptions of pedestrian facilities such as zebra striped crossings, underpasses, and overpasses in a survey of 500 pedestrians sampled at major street crossings in Delhi ( 18 ). They found that safety perceptions varied by gender, with females being less comfortable with underpasses and finding zebra crossing more convenient. Mishra et al. ( 19 ) and Sahu et al. ( 20 ) both examined emissions on Delhi roadways, finding significant impacts associated with high levels of vehicle traffic. Patsarika et al. extended environmental concerns to noise in a qualitative study that identified Delhi residents’ significant discomfort with high noise levels on roads and in neighborhoods ( 21 ). Despite ample evidence that major environmental stressors affect the walking environment in Delhi, as in many cities, the relationship between environmental exposures and hazards, perceived walkability, and walking behavior is not well examined. No studies were found during the literature review that emphasized these relationships. However, if urban residents are forced to walk, we observe impacts not only on physical health but also mental well-being, as exposures and their inescapability increase stress and reduce the sense of control ( 22 ).
The emerging literature on perceived walkability establishes linkages between local environments, perceived walkability, walking behavior, and outcomes; however, so far, environmentally stressed locations in the Global South remain underexamined. In particular, the relationship between perceptions of environmental quality and perceived walkability is understudied. In addition, whether these perceptions affect walking behavior remains inconclusive, with the study by Villaveces et al. finding that walkers were often more dissatisfied with the walking conditions in their own neighborhood ( 16 ). Further, no research was identified that explicitly examines potential conflicts between perceived walkability and walking behavior.
This study addresses these gaps with an examination of perceived walkability, walking behavior, and subjective well-being in two neighborhoods in Delhi. The study was structured similarly to other perceived walkability studies described above: measures of environmental perceptions, as well as walkability, were collected by survey, along with measures of walking behavior, subjective well-being, and other demographic factors. As described in this literature review, researchers have used a range of methods to examine relationships among these factors: bivariate correlation analysis and multivariate modeling of relationships between walkability, walking behavior, and well-being, controlling for other factors. These methods are used here as well, described in detail in the next section.
Setting, Data, and Methods
Research Setting and Design
This study is set in two neighborhoods in Delhi, India. The first neighborhood, Batla House, is in the southeastern National Capital Region (NCR). Bhalswa Dairy is in the north central NCR, lying along the polluted Najafgarh Drain, which directly drains into the Yamuna River (see Figure 1). Both are peripheral neighborhoods with relatively limited investment in either the public or private built environment. Much of the housing and pathways have been built informally, without regulation or support by government authorities (see Figure 2). Both neighborhoods have limited infrastructure that makes walking difficult, but where walking may still be the only type of mobility possible. Although the interiors of both neighborhoods are similar, their contexts within the region are somewhat different. Batla House is surrounded by a more urban area, and a new Delhi Metro station, part of Delhi’s rapidly expanding rail transit system, opened outside Batla House in 2017. Conversely, Bhalswa Dairy did not have a metro station at the time of the survey, but it lies alongside a major highway in North Delhi. Bhalswa Dairy is built alongside a lake and dairy farms, as well as the open—if polluted—Najafgarh Drain, providing relatively more open space than Batla House.
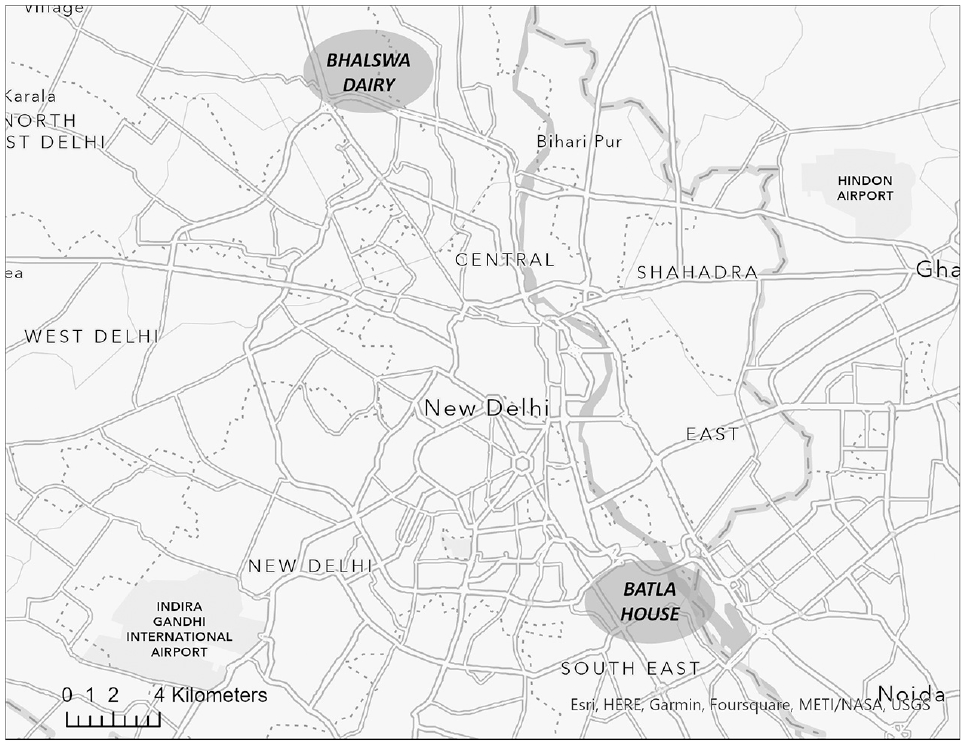
Batla House and Bhalswa Dairy in the Delhi region.
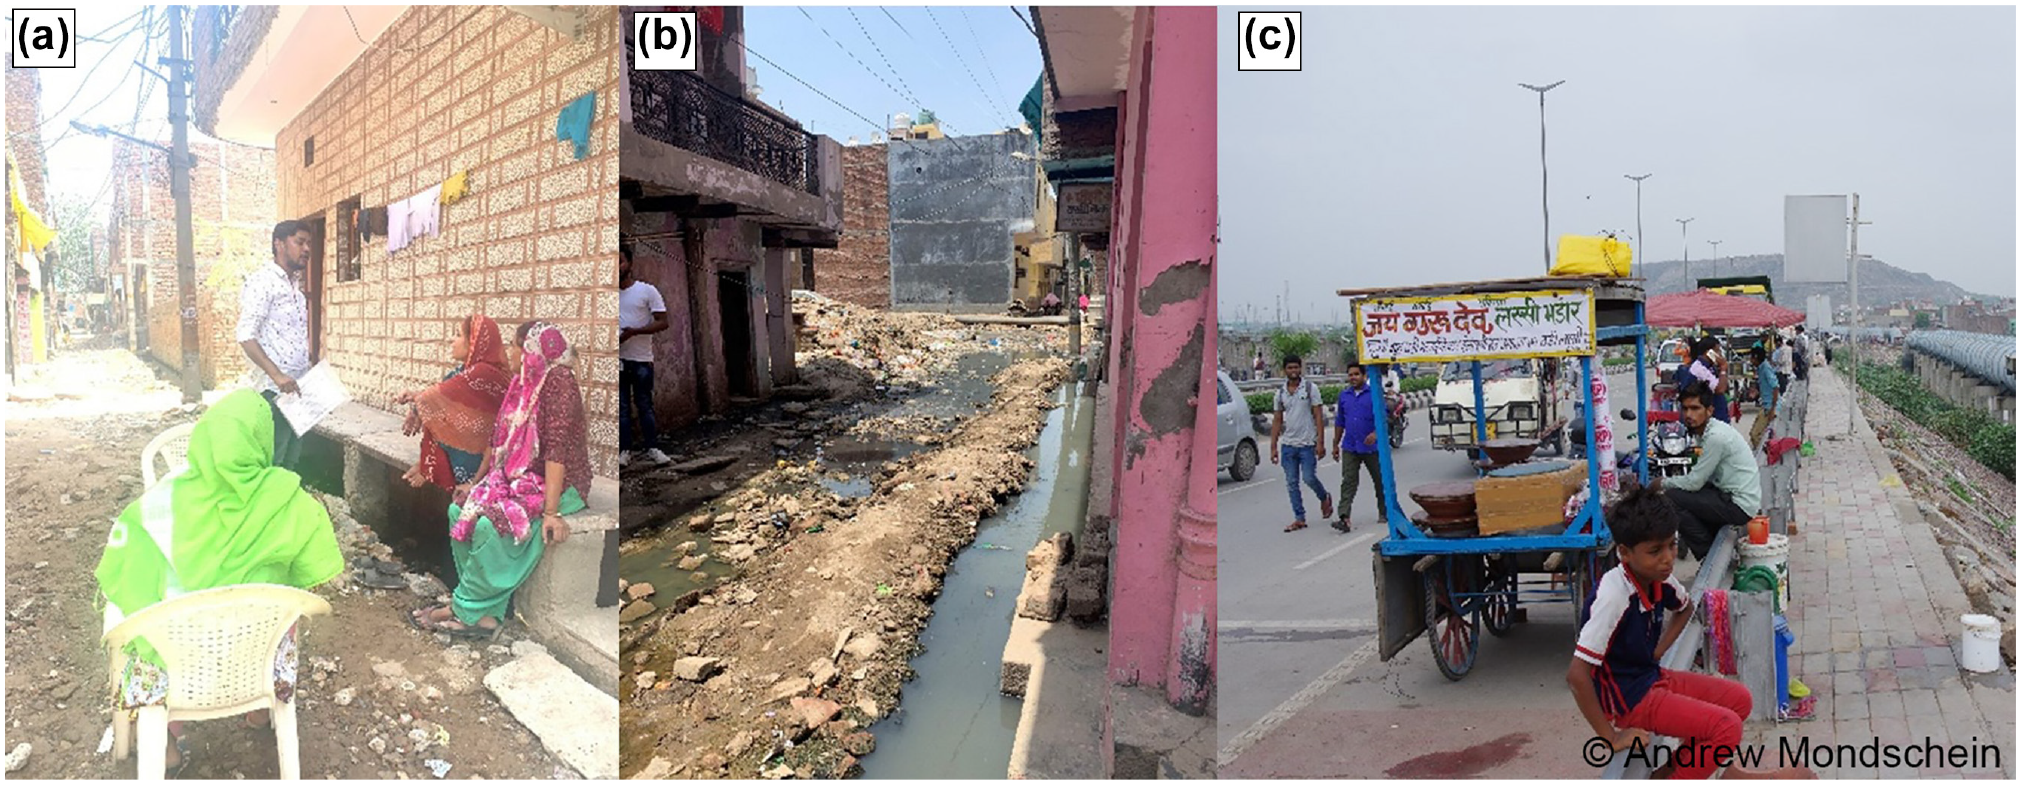
Built environment in Bhalswa Dairy: (a) Community members and survey taker on street, (b) Street within Bhalswa Dairy, and (c) New highway and verge outside Bhalswa Dairy.
Both neighborhoods represent conditions where environmental quality is objectively low, across air, water, and the built environment quality. Residents’ perceptions of their environment, as well as their travel behavior and perceptions of walkability, have gone undocumented by either the government or prior research. Focusing on these two distinctive neighborhoods, this study held objective environmental conditions and walkability constant across individuals, while still accounting for some differences between the neighborhoods. By surveying individuals in each neighborhood, variations in perceptions of environmental quality and walkability could be directly assessed. By asking residents about their perceptions, travel behavior, sense of well-being, as well as demographic factors, the following questions could be addressed: How do perceptions of perceived walkability affect walking behavior under conditions of environmental stress? What relationship, if any, exists between perceived walkability, walking, and well-being?
Survey Design and Collection
The survey used in this analysis was designed and implemented as part of the multidisciplinary Yamuna River Project research initiative, hosted at the University of Virginia. The survey captures information on walking, everyday travel modes, perceptions of walkability and environmental quality, subjective well-being, and other psychometric scales, as well as demographic factors including gender, income, work status, and age. The survey was distributed in May and June 2019 by Outline India (OI), a nongovernmental organization specializing in the collection of reliable survey results in communities across India ( 23 ). The study is cross-sectional and does not allow for comparisons to other neighborhoods in Delhi or beyond. Therefore, generalization to other contexts or to long-term behavior patterns is not possible. However, as described above, the study allowed examination of relationships between walking behavior and perceived walking in challenging environments.
Working with OI, Hindi translations of existing transportation and psychometric measures were piloted and then deployed with interviewers collecting responses in-person. Following the pilot, the survey was revised and streamlined to increase understandability and survey completion. Travel behavior questions were drawn from the Pedestrian and Bicycle Survey developed by Forsyth et al. ( 24 ). Environmental perception questions were added, addressing air quality, natural features, the Yamuna River, and neighborhood change over 5 years. In addition, perceived walkability was captured using a unidimensional question, “Is your neighborhood a good place to walk?” This question could be readily translated into Hindi and be clear to individuals with a wide range of backgrounds. Perceptions were measured using a five-point Likert scale ranging from “1 = Very bad” to “5 = Very good.”
Subjective well-being was measured with the Short Warwick-Edinburgh Mental Well-Being Scale (SWEMWBS), a set of 14 questions that measure mental well-being. SWEMWBS has been validated across a range of populations, including in India ( 25 ). In addition, the survey included the Connectedness to Nature Scale (CNS), which measures the closeness that individuals feel to nature, using a series of questions aggregated to a composite score ( 26 ). Collectively, these measures of psychological well-being and attitudes may be associated both with travel and perceived environmental quality. Although it has been used previously in India ( 27 , 28 ), the CNS has only been validated in European and North American contexts.
Once the survey design was finalized, OI collected a sample of residents in the Bhalswa Dairy and Batla House neighborhoods, stratified to be representative of gender and income in the neighborhoods based on Indian census data. Following their standard protocols ( 29 ), OI used a directed sampling approach in the informal settlements, with survey collectors walking down pathways and approaching individuals in the street to take the survey, as well as making connections to other individuals through previous respondents. OI recorded the locations already surveyed so as not to repeat locations. OI’s field surveyors proceeded systematically, collecting surveys until the goal of 1,000 complete surveys, stratified by gender and income representativeness, was satisfied. OI did not keep a record of survey refusals, so a precise response rate is not calculable. Of the 1,000 raw responses collected, 524 were in Bhalswa Dairy and 476 in Batla House. For the raw responses, distributions, outliers, and missing values for each variable were examined. The basic distributional characteristics of key variables are described in Table 1. Six responses with missing data were removed, resulting in a final sample of 994 respondents, 524 in Bhalswa Dairy and 470 in Batla House.
Respondent Characteristics and Travel by Neighborhood
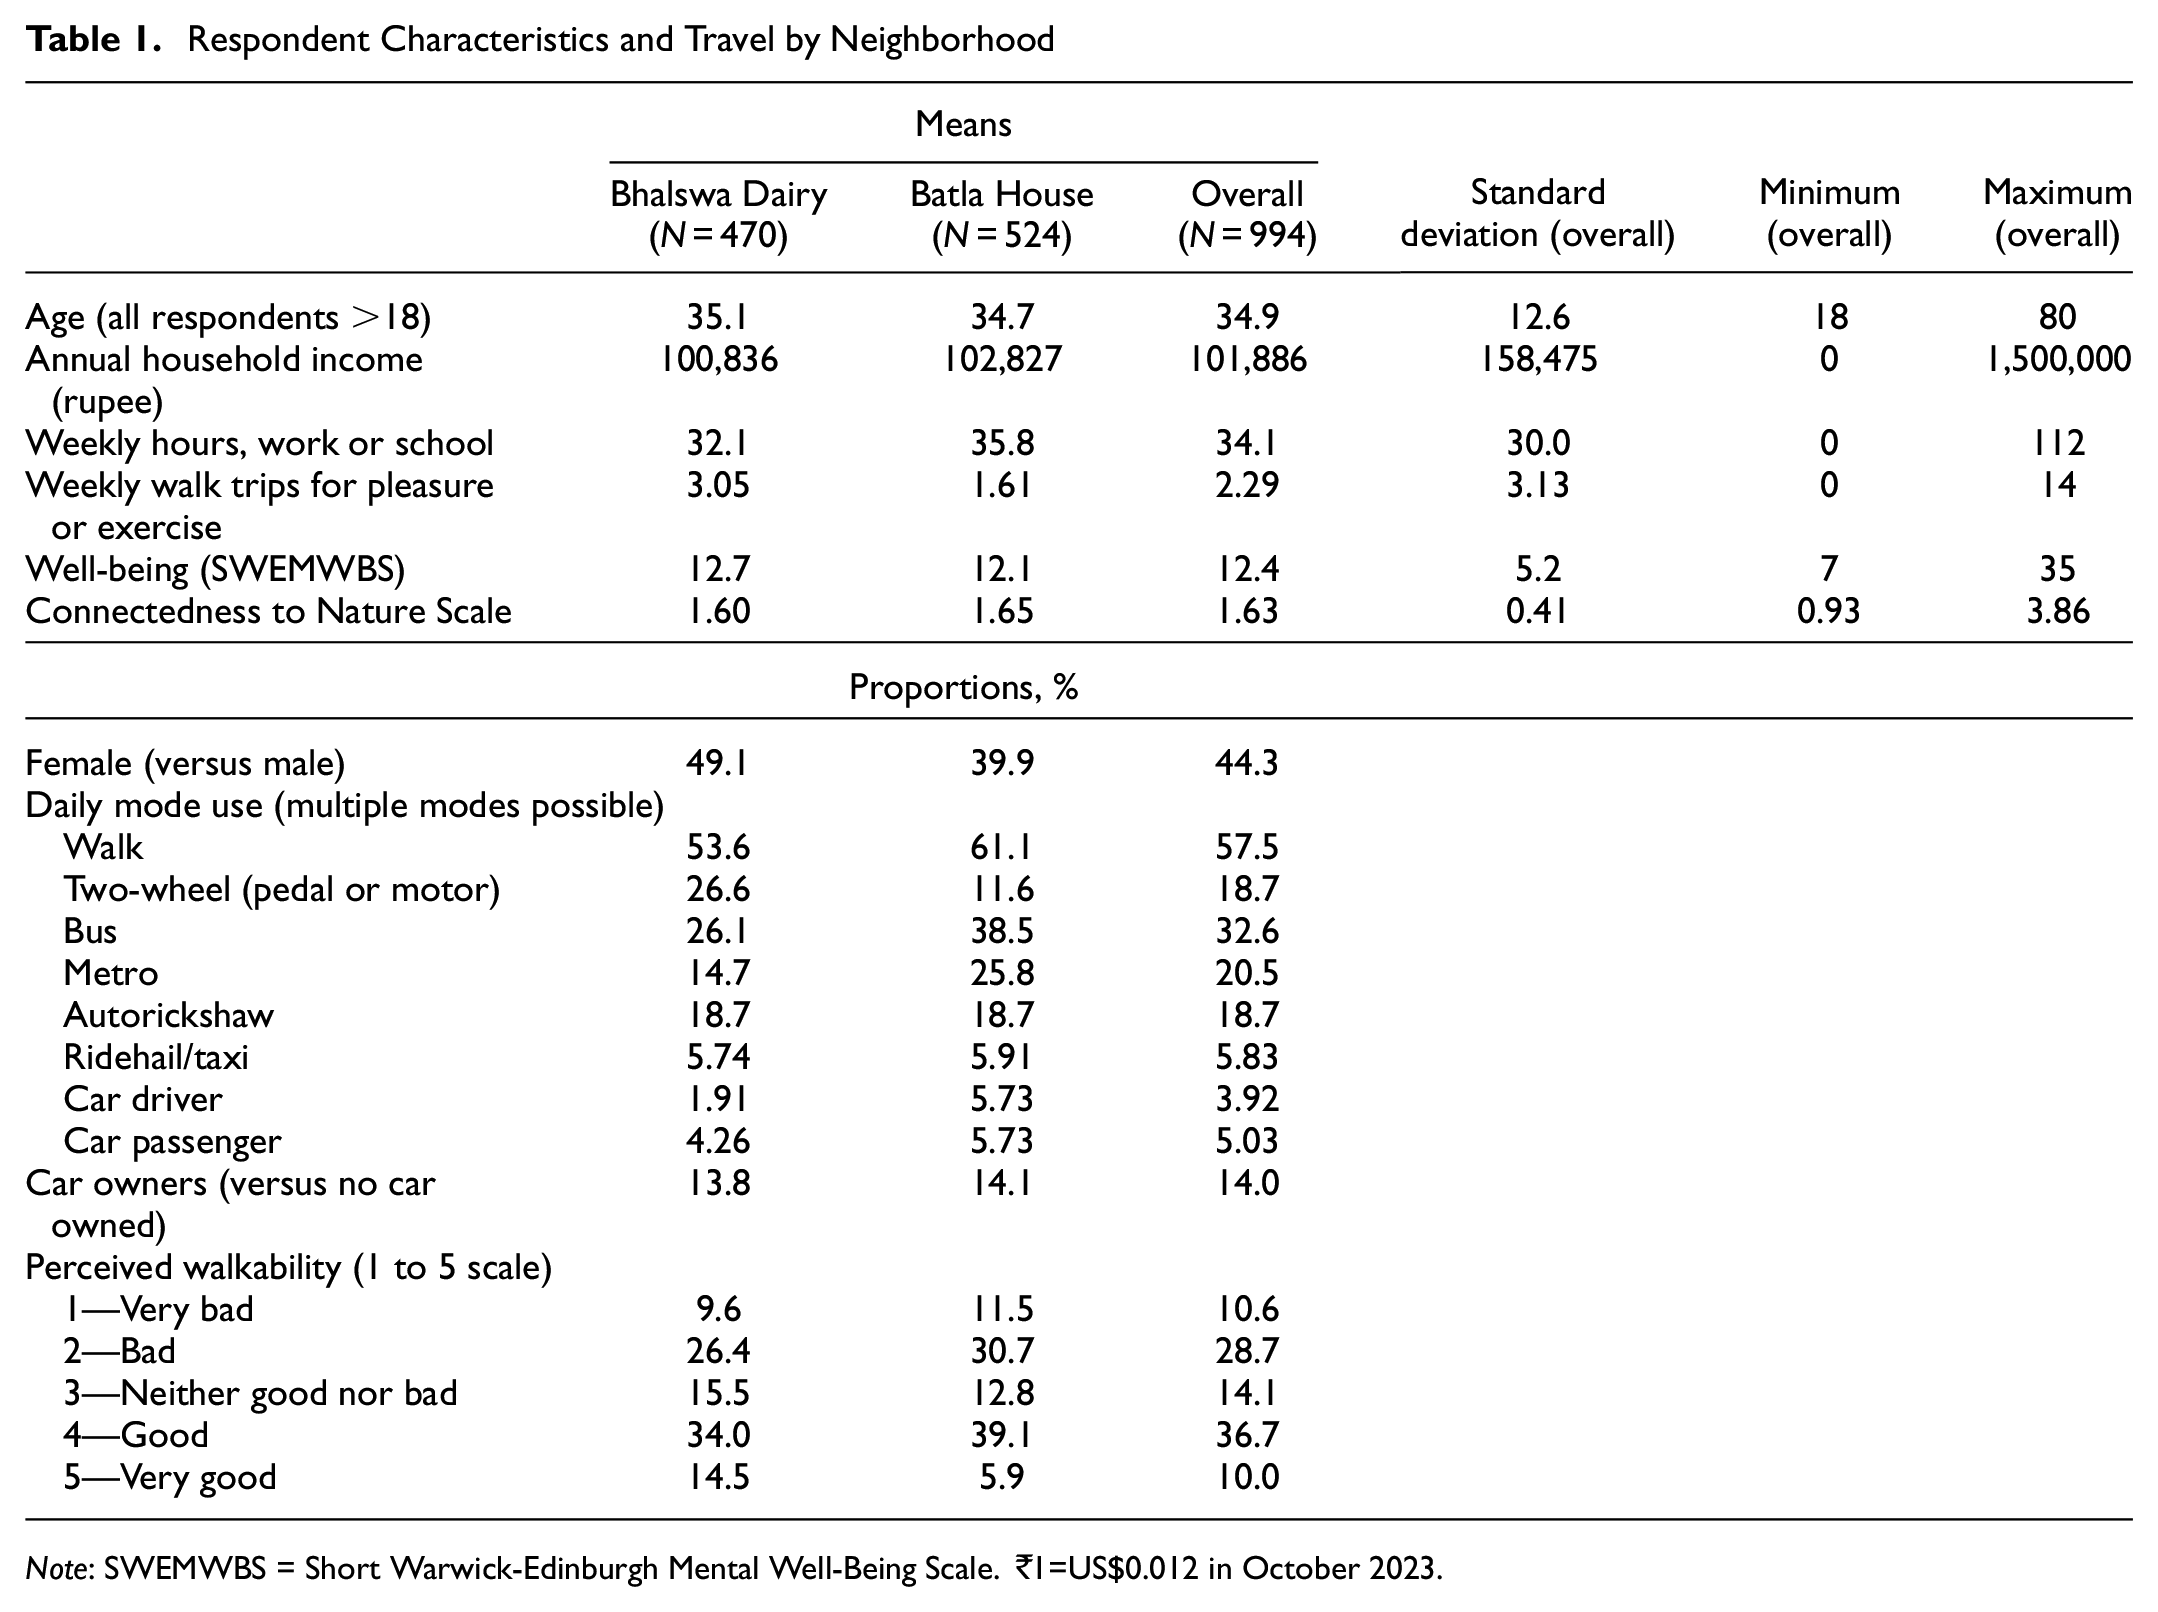
Note: SWEMWBS = Short Warwick-Edinburgh Mental Well-Being Scale. ₹1=US$0.012 in October 2023.
Analysis Methods
The analysis consisted of the following four stages:
Basic descriptive analysis of demographics and travel. For the two neighborhoods, document demographic patterns, travel by different modes, and well as perceptions of walkability. This information provides a baseline for understanding travel in these two neighborhoods.
Identifying associations between environmental perceptions, walkability, and walking behavior. Assess relationships between the ordered scales assessing environmental quality and walkability with Spearman rank correlation. Then, assess relationships between walkability and walking behaviors using rank correlation.
Identifying factors associated with WD. Given the complex relationship between perceived walkability and walking behavior, construct a standardized index of WD. Examine associations between WD and other factors using Wilks’ lambda and Spearman rank correlation.
Estimation of WD and subjective well-being. Utilize a multivariate linear regression model to estimate subjective well-being (SWEMWBS) as predicted by WD, controlling for other factors.
All analyses were conducted in Stata, Versions 17 and 18 ( 30 , 31 ).
Analysis
Baseline Demographics and Travel by Neighborhood
Table 1 describes the key respondent characteristics for the two surveyed neighborhoods, Bhalswa Dairy and Batla House. The distributional properties of the continuous variables are also included for the full sample. The Batla House respondents were skewed to male respondents, whereas the Bhalswa Dairy respondents were balanced between male and female. The gender imbalance in the Batla House population is likely to be the result of its cultural and economic characteristics, including hosting a religious university and a more transient population studying and working in the area. Average ages were similar in both neighborhoods. Both neighborhoods also had average annual household incomes that were lower than the Delhi NCR average of ₹389,143 according to the 2019/20 Economic Survey of India ( 32 ). Batla House respondents reported going to work or school on average for more hours than Bhalswa Dairy residents. For the continuous variables, standard deviations showed that variability across most measures was high, but minimums and maximums did not exceed reasonable ranges for age, income, work/school hours, or nonpurposive walking. The well-being (SWEMWBS) and CNS scores also varied within acceptable ranges ( 25 , 26 ).
Survey respondents could report using more than one mode on a typical day, so travel mode percentages do not add up to 100%. Walking was by far the dominant mode in both neighborhoods (illustrated in Figure 3), with over 50% of residents in Bhalswa Diary and 60% of residents in Batla House reporting daily walking. The most notable differences between the two neighborhoods were in the relative rates of bicycle usage, including motorized bikes, versus transit use, whether bus or metro. Bhalswa Dairy, which is not located on the metro network and has limited bus service, was far more reliant on two-wheeled travel, whereas Batla House residents have been able to take advantage of bus and metro since 2017. Vehicle usage, whether autorickshaw, ridehail, or private vehicle use, was similar and limited in both neighborhoods, though somewhat more common in Batla House. Both neighborhoods were quite similar in relation to car ownership rates, with about 14% of respondents owning cars in both neighborhoods. Bhalswa Dairy respondents reported walking for pleasure or exercise at nearly double the rate (3.0 versus 1.6 trips per week) of Batla House residents.
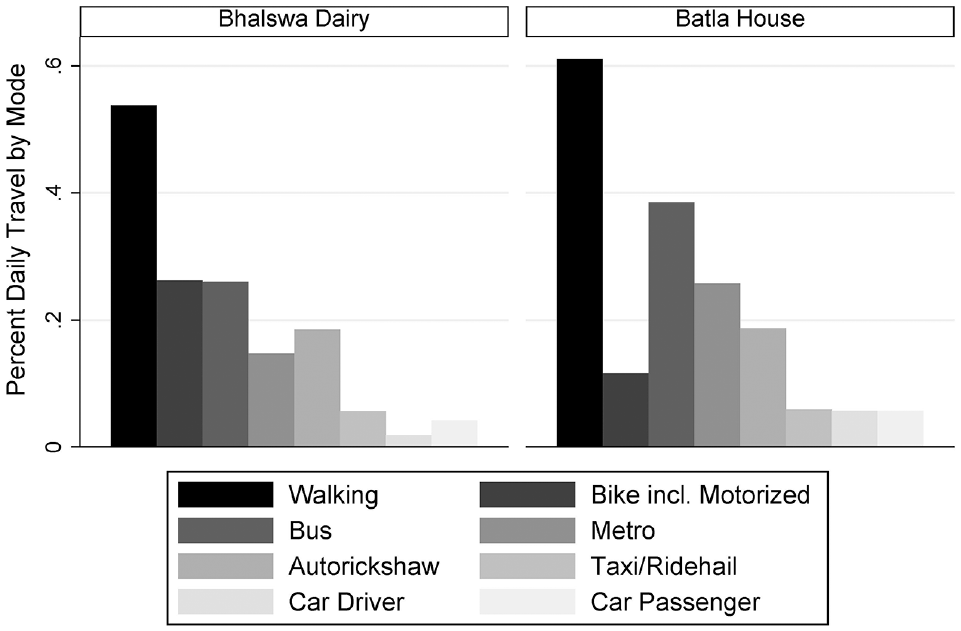
Daily travel modes by neighborhood.
Perceptions of Environmental Quality and Walkability
As shown in Figure 4, perceptions of air quality, natural features, and the quality of the Yamuna River were largely bimodal in both neighborhoods, with most residents avoiding a purely neutral stance at the middle of the scale. Residents in both neighborhoods were more likely to feel that their neighborhoods have been getting cleaner over time. In both neighborhoods, all four environmental quality measures had strong, statistically significant (p < 0.01) Spearman rank correlations with perceived walkability. Correlations were somewhat stronger in the Batla House- than the Bhalswa Dairy neighborhood. Perceptions of air quality and the quality of local natural features were particularly highly correlated with perceived walkability.
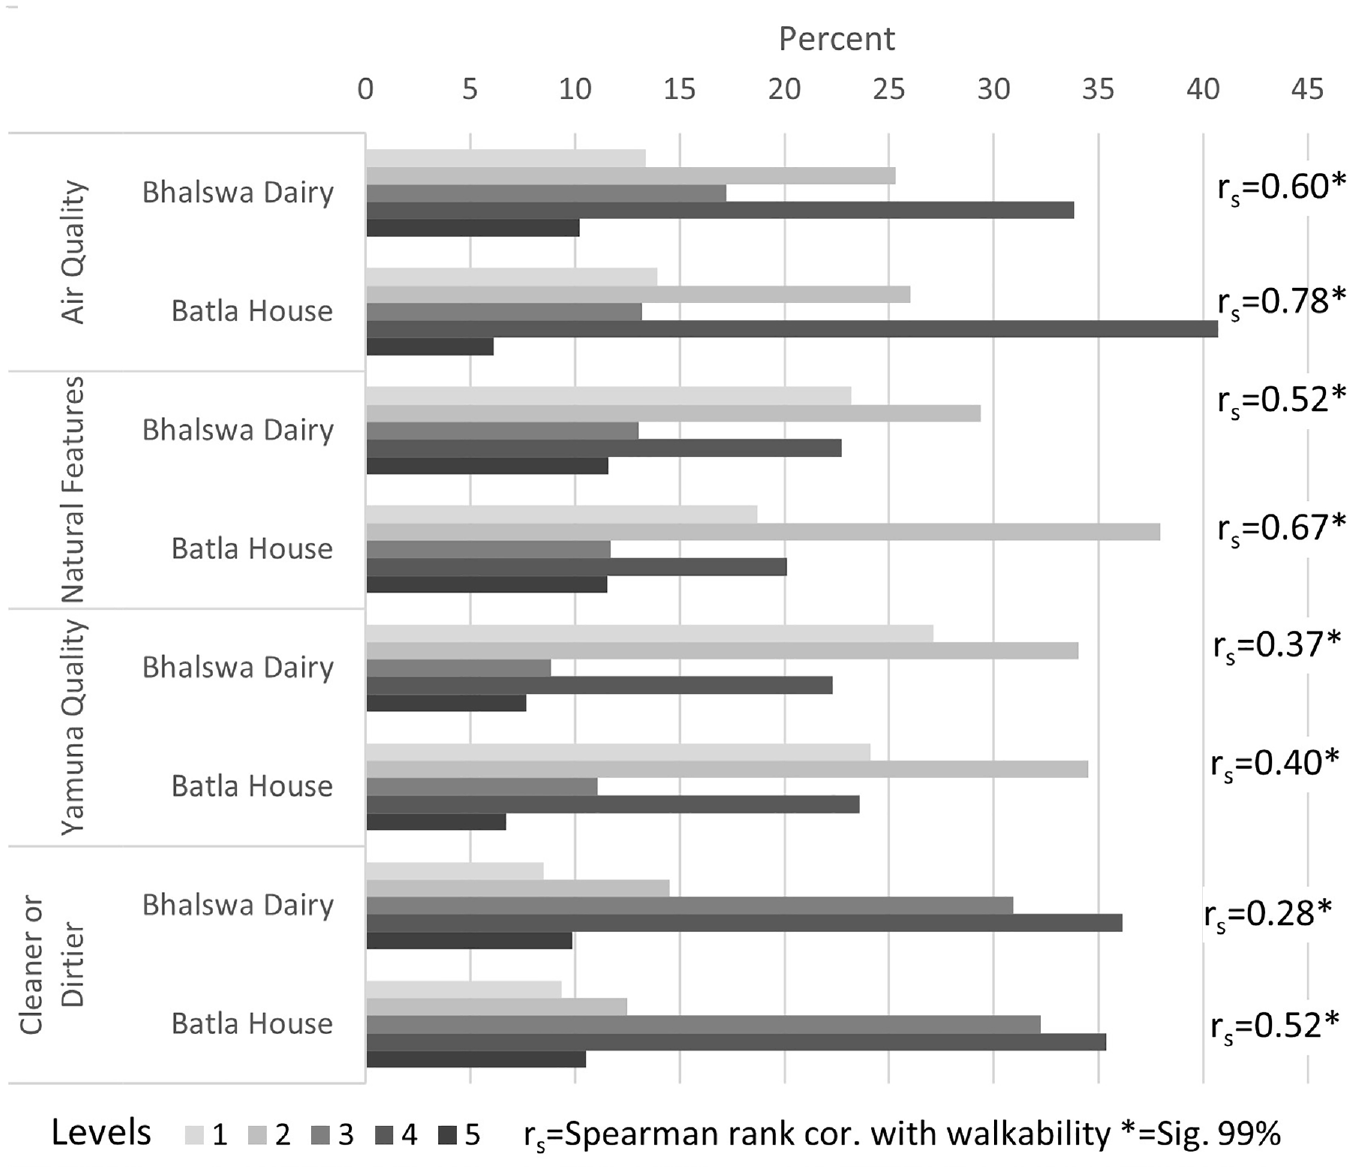
Environmental quality perceptions by neighborhood, including Spearman rank correlation with perceived walkability.
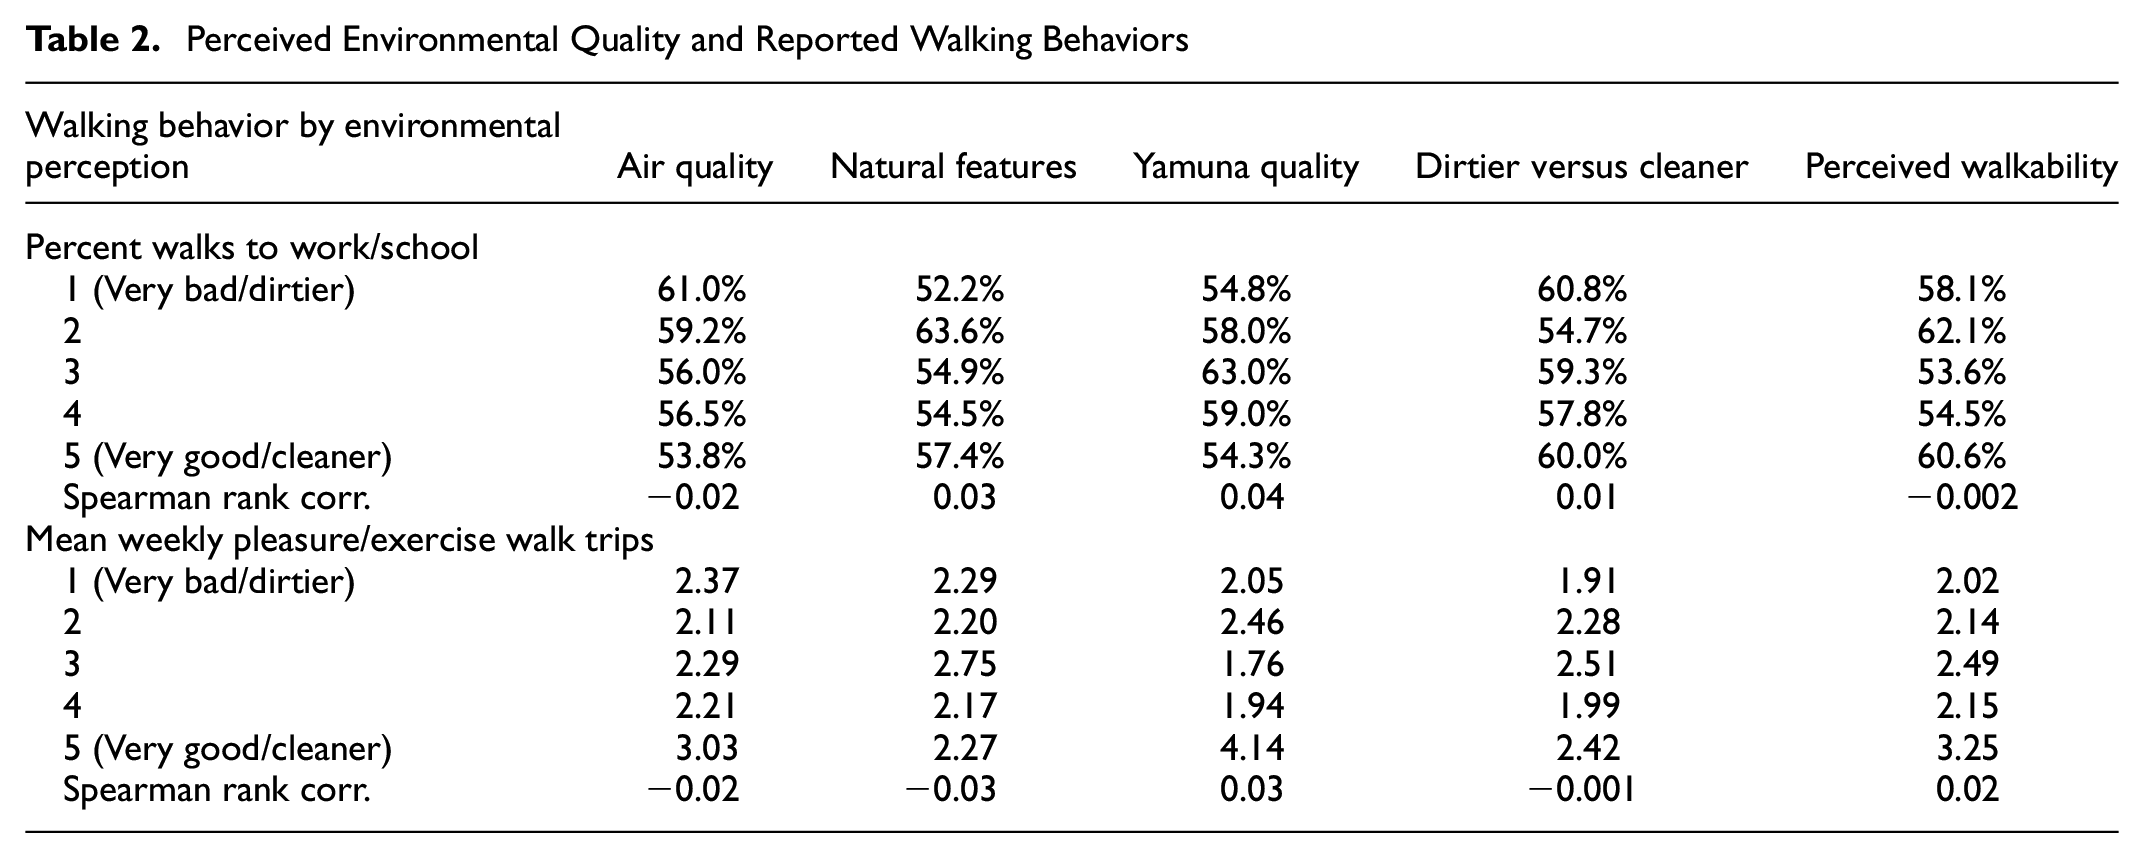
Because the correlation between perceived walkability and perceived environmental quality was strong, one might expect that actual walking behavior and environmental perceptions would be similarly correlated. Table 2 illustrates perceived environmental quality and walkability relative to reported walking behavior. The four environmental quality measures, as well as walkability, were assessed relative to being a regular walker to school or work (no/yes) and across the number of weekly nonpurposive (pleasure/exercise) walks reported. The results showed that purposive and nonpurposive walking varied little across levels of perceived environmental quality or walkability. In some instances, walking rates were higher at the highest level of each Likert scale, but these relationships were not consistent across all levels of the scales. Ultimately, Spearman rank correlations between walking behaviors and perceived environmental quality/walkability were all close to zero. This was in stark contrast to the strong correlations among perceived walkability and the environmental quality measures shown in Figure 4. Taken as a whole, the analysis showed that despite residents clearly associating poor environmental quality with reduced walkability, when it comes to actual walking behavior, the environment appeared to have little effect on whether residents walked regularly for purpose or for leisure.
Perceived Environmental Quality and Reported Walking Behaviors
Walking Dissonance: Differences between Walking Behavior and Perceived Walkability
As Table 2 shows, the Spearman rank correlation between perceived walkability and walking to work/school was near zero (rs = −0.002). Correlation was also low between walkability and weekly pleasure/exercise trips (rs = 0.02). In these generally low-income neighborhoods, walking may simply be the only way to get somewhere affordably for many residents. Indeed, a mild negative correlation between purposive walking and income (rs = −0.13) suggested that a lack of resources may encourage increased purposive walking. However, walking for pleasure or exercise should be far more sensitive to perceived walkability: this type of walking was not correlated with income (rs = −0.003). Given this disconnect, further investigation of the relationship between walking and perceived walkability was necessary.
The near-zero correlation between leisure/exercise walking rates and perceived walkability implied that there were many individuals in the sample who reported higher levels of walking despite their negative perceptions of neighborhood walkability. What are the characteristics of those individuals? A measure of WD, which quantifies the degree to which a person walks in environments that they perceive as unwalkable, could help assess this relationship,

WD is defined as the difference between a standardized measure of walking behavior (ZWalking Behaviour), in this case nonpurposive walking frequency (trips per week), and a standardized measure of perceived walkability (ZPerceived Walkability)for an individual in an area. The walking behavior and perceived walkability measures were standardized (i.e., transformed to a mean of zero and a standard deviation of one) to provide comparable scales for both measures. Perceived walkability, a Likert-scale measure, was treated as continuous in this calculation. Treatment of Likert-scale variables as continuous is reasonable when the variable comprises at least five levels and can be interpreted as an ordinal approximation of a continuous variable ( 33 , 34 ). Importantly, WD is a novel metric based solely on observations from these two neighborhoods. It may therefore not be applicable to other settings, but it allowed for comparison within this sample.
In this study, the WD measure focused on reported pleasure/exercise walking because this type of walking should be most sensitive to perceived walkability. The measure was constructed to be readily interpretable: high values of WD represent instances of high levels of walking combined with low perceived walkability, and low values of WD represent low levels of walking combined with high perceived walkability. Values near the WD mean of zero represent levels of walking behavior and perceived walkability that are equivalently high, moderate, or low. In this survey, WD = +3.2 for a respondent that walked 7 times per week for pleasure/exercise but rated walkability as 1; WD = −2 for a respondent that only walked once per week for pleasure/exercise but rated walkability as 5. Most importantly, larger deviations between behavior and perceptions resulted in larger absolute values of WD.
Table 3 compares how WD varied with respect to key variables in the survey. Wilks’ lambda tested whether mean WD was significantly different across factor levels, and Pearson’s correlation assessed the relationships between WD and the continuous variables. Significance levels of 0.05 or less are presented in bold. Higher levels of WD were associated with those living in the Bhalswa Dairy neighborhood and male respondents. Car ownership was not significant. Perceived air quality had a powerful relationship with WD, with poor perceived air quality being associated with high levels of WD. This relationship should be expected because walkability was highly correlated with perceived air quality, along with the other environmental measures (see Figure 4). Older adults had lower levels of WD. Notably, WD was negatively correlated with well-being on the SWEMWBS. This means that individuals who walk more in areas they perceive as poor for walking had lower well-being scores.
Walking Dissonance: Variability and Correlation
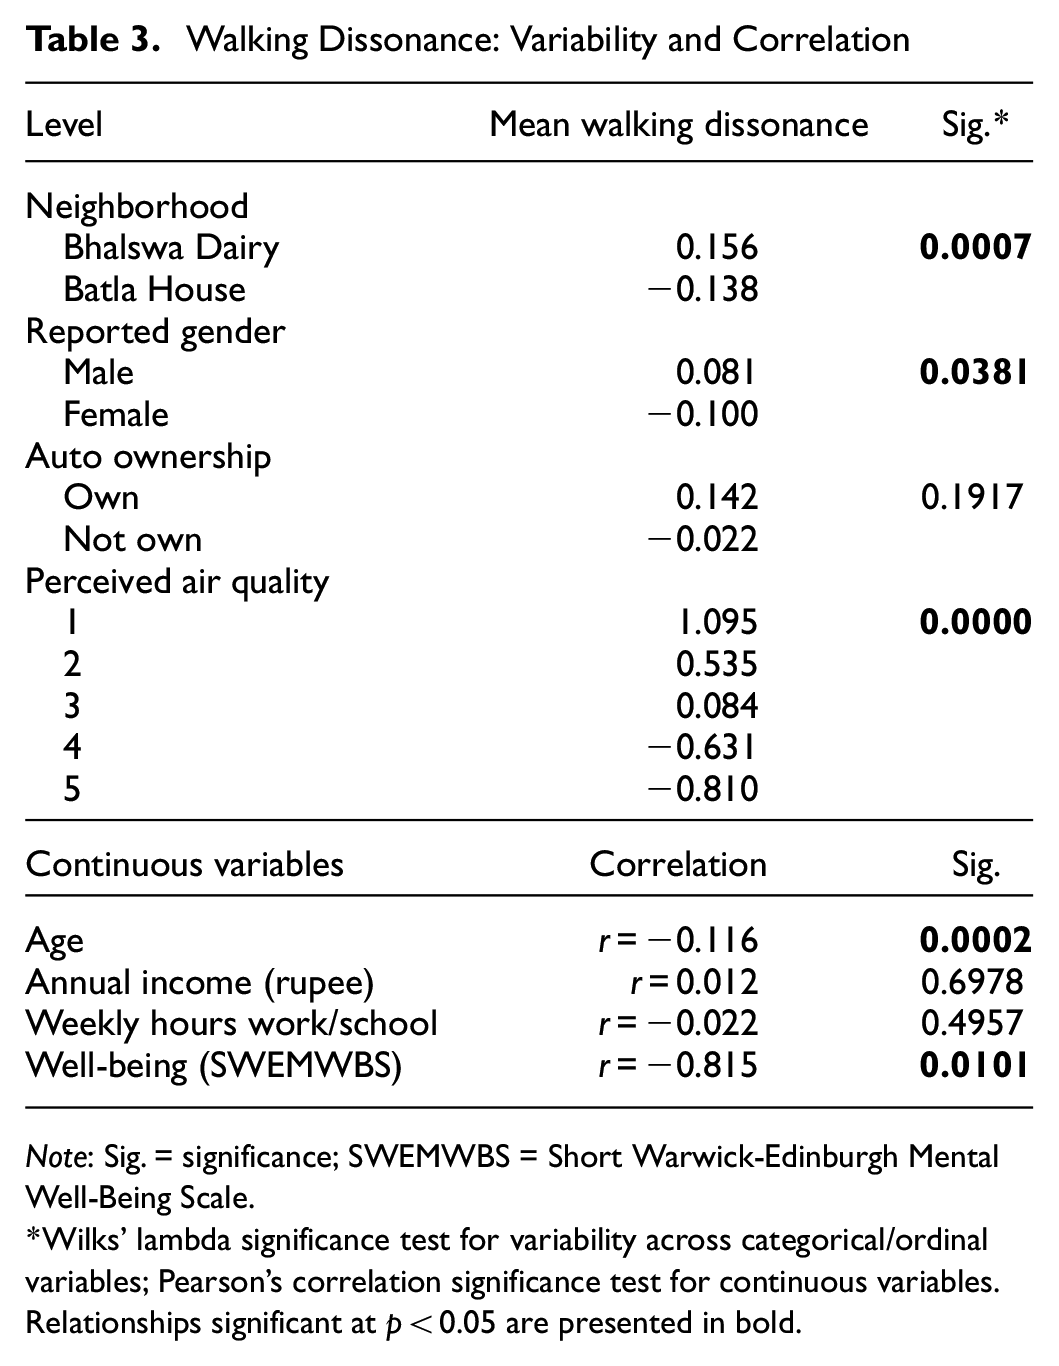
Note: Sig. = significance; SWEMWBS = Short Warwick-Edinburgh Mental Well-Being Scale.
Wilks’ lambda significance test for variability across categorical/ordinal variables; Pearson’s correlation significance test for continuous variables. Relationships significant at p < 0.05 are presented in bold.
Association between Walking Dissonance and Subjective Well-being
The negative relationship between WD and subjective well-being, suggesting that more walking does not always have a positive impact on well-being, is concerning. However, the comparisons and correlations in Table 3 do not control for the influence of other factors. Table 4 presents the results of a multivariate linear regression predicting subjective well-being, controlling for a range of factors including WD, resident demographics, and perceptions of local natural features. The outcome variable is ln(SWEMWBS), transformed to account for a right-hand skew in the distribution. Among environmental perception scales, the natural features scale was selected because it had the most significant effect on well-being. Two versions of the model are presented, with the second including an interaction between neighborhood and WD. The final models exclude insignificant explanatory variables, other than insignificant levels of ordinal variables. The models were checked for homoscedasticity, nonmulticollinearity, and normality of the residuals. Standardized coefficients (beta values) are presented to allow for comparison of the magnitudes of each predictor’s effect.
Predicting Well-being
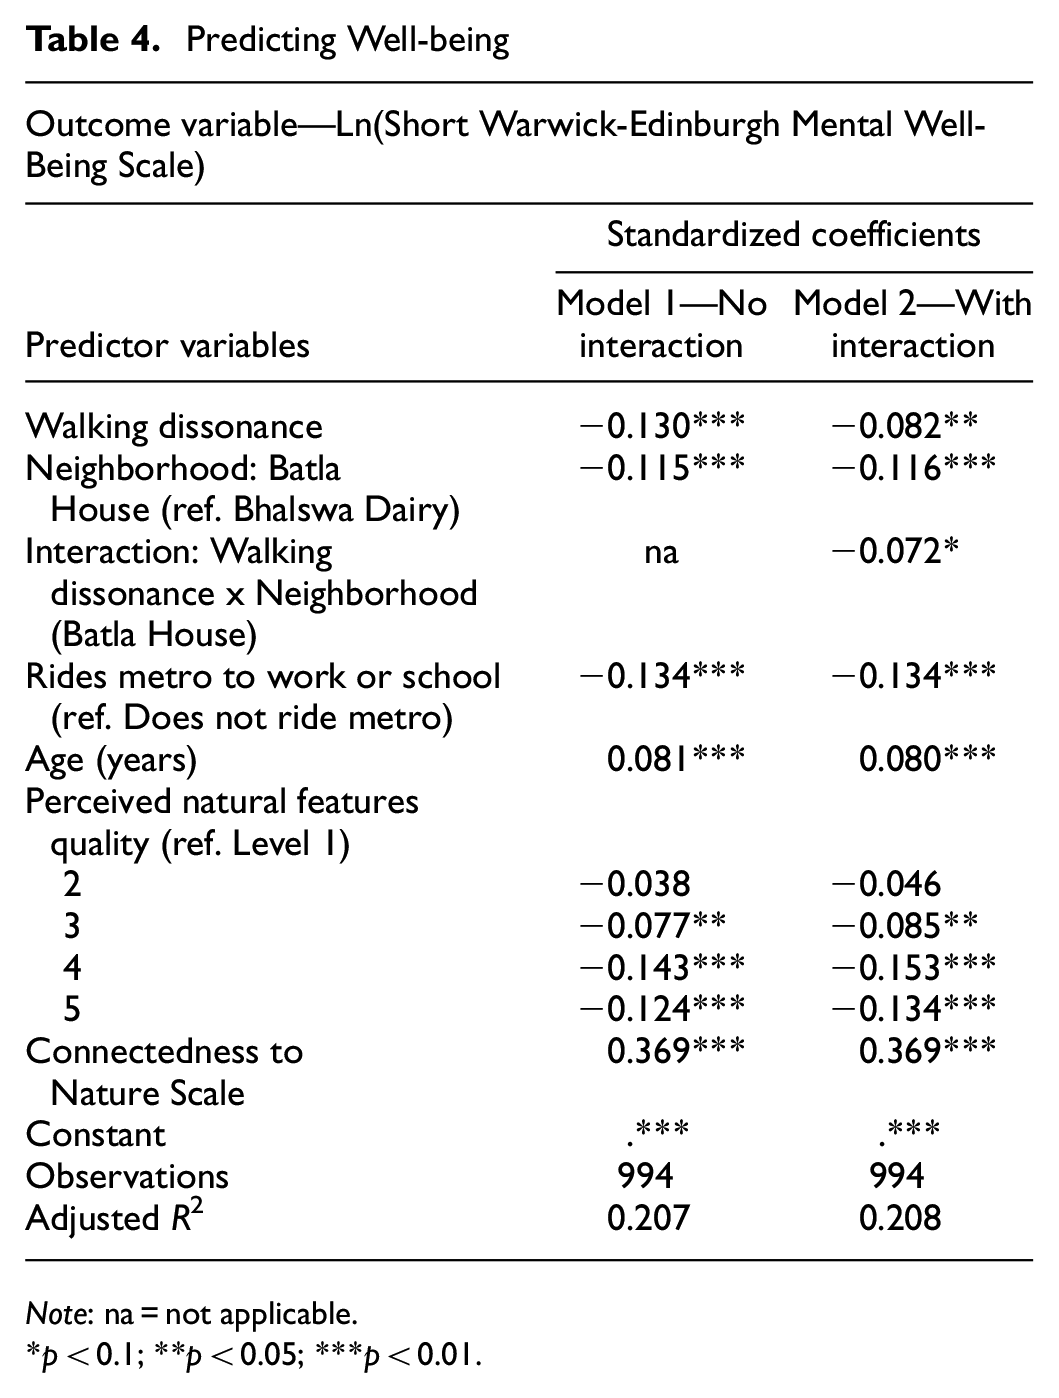
Note: na = not applicable.
*p < 0.1; **p < 0.05; ***p < 0.01.
Both models explained roughly one-fifth of the variability in ln(SWEMWBS), with the second model explaining minimally more variability: Model 2 adjusted R2 = 20.8% versus Model 1 adjusted R2 = 20.7%. WD had a significant, negative effect on well-being in both models. Neighborhood was also significant in both models, with well-being presenting as lower in Batla House than Bhalswa Dairy. In the second model, the interaction term between WD and neighborhood was significant. This relationship is illustrated in Figure 5, which estimates the marginal effects of WD and neighborhood on well-being, accounting for both main effects and the interaction term, while holding other independent variables at their means. Although negative in both neighborhoods, the estimated effect of WD was significantly stronger in Batla House than in Bhalswa Dairy. This result raises the possibility that WD may be modified by neighborhood factors, such as differences in the built environment or traffic.
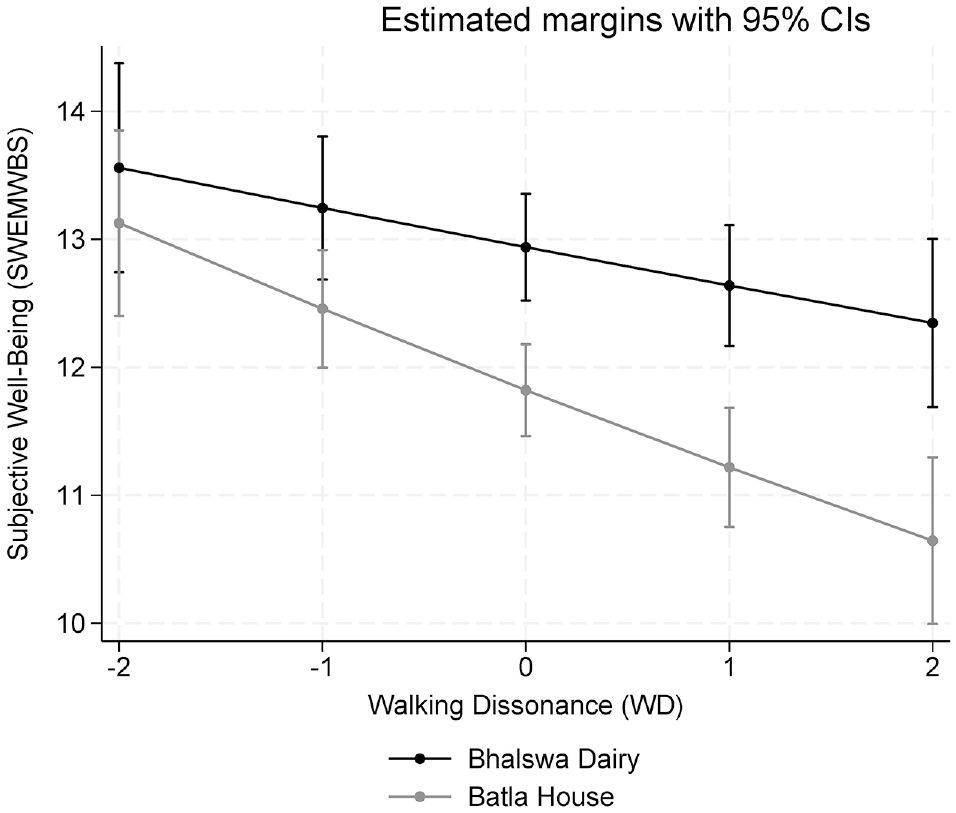
Walking dissonance and neighborhood interaction, controlling for other factors.
The model also estimated the effect of riding the Delhi Metro for daily work/school, which was significant and negative in both models. Among demographic variables, age was significant, with older respondents having higher levels of well-being. Other socioeconomic variables, including gender, income, weekly hours in work/school, and auto ownership, were not significant during model development and were therefore removed from the final models. A positive perception of the local natural environment was associated with poorer well-being. Although this effect is perplexing, these variables may be proxies for other psychological phenomena not directly measured in the survey. CNS had a significantly positive relationship with well-being and was, in fact, the strongest determinant of well-being.
Discussion
Key Findings
This study addressed walkability outside of its dominant context in the literature, which focuses on the objective density of networks and destinations. Focusing on the residents of Bhalswa Dairy and Batla House, walking and mobility was not just a matter of proximity to destinations. By that definition, these neighborhoods would probably be treated as objectively walkable. However, the analyses of association between environmental perceptions, perceived walkability, and actual walking behavior showed no direct relationship between perceived walkability and either purposive or nonpurposive walking.
Given the lack of association between perceived walkability and walking behavior, the second part of the analysis probed the apparent disconnect between perceptions and behavior for many of the respondents in these neighborhoods. The WD scale allowed empirical analysis of individuals who reported walking frequently, for nonpurposive reasons, in environments they perceived as nonwalkable. The bivariate analyses of WD and other factors showed significant differences in WD by neighborhood, gender, and age. Most notably, WD was significantly correlated with lower subjective well-being (SWEMWBS). A regression estimating subjective well-being controlling for WD and other factors confirmed this relationship. The interaction between WD and neighborhood suggested that local environmental factors modified the relationship between WD and well-being. The results underscored that walking frequency or walking mode choice may not always be the most relevant outcome of walkability analysis. Particularly in places where walking exposes individuals to environmental stressors or causes negative perceptions of walkability, critical outcomes may be related instead to personal well-being.
Limitations and Future Research
This study investigated a population and locations that have received little attention in transportation and walking research. The study and its analyses were geographically focused and similar studies should be undertaken in other locations to confirm and extend the findings presented in this paper. Furthermore, although the relationships in the analyses, including between well-being and WD, were statistically significant, these models do not prove causality, only correlation and significance of association. For example, whereas it is conceptually reasonable to assert that high levels of WD may result in reduced well-being, it may also be possible that low levels of subjective well-being encourage people to walk more, even in unwalkable environments.
The significant interaction term between neighborhood and WD suggests that WD may be modified by local built environment conditions. Because systematic built environment data were lacking in these neighborhoods, it was not possible to identify the specific elements of the built environment that interacted with WD, either at the individual trip or neighborhood scale. Future research would benefit from examining WD in a wider range of built environment contexts, as well as capturing more detailed characteristics at the trip level. This analysis should prompt use of other methodological approaches to understand the motivations and impacts of walking in neighborhoods like Batla House and Bhalswa Dairy. Qualitative and mixed methods studies, for example, could help build stronger understandings of the perceptual and decision-making pathways followed by residents.
Conclusion
In Batla House and Bhalswa Dairy, like so many other locales worldwide, substantial amounts of travel occur on foot, as well as by other modes that expose individuals directly to the environment. Even with high levels of walking, many residents did not perceive these neighborhoods as walkable, a perception that was highly correlated with other negative perceptions of the environmental conditions in the neighborhood. This result is the proposed phenomenon of WD. The significant physical health impacts of Delhi’s traffic and environmental degradation are already well known ( 19 ). This study has extended those physical impacts into the realm of mental health. For pedestrian and travel behavior research, the study reinforces the idea that walkability is a multidimensional concept, in which different dimensions take on varying importance depending on the geographic and demographic context. Furthermore, it underscores that perceived walkability is highly individualized and can deviate from objective walkability.
With walking behavior research, “more walking” is not always a positive result ( 22 ). Transportation infrastructure and built environment investments can and should address a multiplicity of human needs beyond undifferentiated mobility. Impacts on well-being, whether physical or mental, should also be considered. Perceived walkability, even if highly personal, can serve as an indicator of when existing infrastructures are not meeting the needs of all residents. Extending from the findings of this study, the increase in neighborhood walking during the COVID-19 pandemic, especially early on during the lockdown phase, was a moment in which many individuals experienced their local streets in a new way. WD might have increased, for some, as fears of exposure on sidewalks detracted from perceived walkability. This increased dissonance, in the long run, could detract from the desire to walk relative to traveling in a private vehicle. On the other hand, interventions like expanding walkable areas along streets may have reduced this fear-driven dissonance.
In Delhi itself, the lack of high-quality mobility choices available to residents of Bhalswa Dairy, Batla House, and similar neighborhoods is a matter of concern for transportation planners, allied practitioners, and communities. Researchers and local media regularly observe significant dysfunction in Delhi’s transportation system ( 1 , 35 ). To address these challenges, national, regional, and local governments continue to invest in mobility for the megacity, with major expansions of the Delhi Metro and the road network. These investments are likely to have strong positive effects on both economic and environmental conditions in the megacity, with significant implications for the region’s long-term viability and sustainability. However, investment in regional infrastructure will not be enough to meet the needs of the entire population if neighborhood-scale environments and pathways are not also considered and addressed. In marginalized neighborhoods, accessing the regional transportation system will remain difficult, and many local trips, purposive or otherwise, will continue to be oppressive.
The problem of WD underscores one reason investments in walkability and environmental quality must accompany regional infrastructure investment. There are two clear ways to resolve WD: decrease walking or improve walkability. Individuals with high WD may have, or feel that they have, little control over the surrounding environment. Like any form of cognitive dissonance, it causes mental discomfort and individuals will seek opportunities to resolve the dissonance. Without intervention, the easiest way for an individual to solve the dissonance is to walk less and reduce their exposure to negative environmental stressors. Unfortunately, for many this may mean using their resources to purchase or use a car, which will only add to the existing environmental burden. Governmental and collective action is necessary to address WD more sustainably and equitably, by increasing walkability through investment in regional infrastructure, neighborhood design, and pro-environmental policies. The benefits to well-being could be significant and are likely to manifest not just in people’s physical health but—as this study suggests—their mental well-being as well.
Footnotes
Acknowledgements
I am grateful to Carla Jones of the University of Virginia, Chris Neale of the University of Virginia, and Outline India for their contributions to the development of the survey instrument.
Author Contributions
The author confirms sole contribution to the paper as follows: study conception and design; data collection; analysis and interpretation of results; and draft manuscript preparation. The author reviewed the results and approved the final version of the manuscript.
Declaration of Conflicting Interests
The author declared no potential conflicts of interest with respect to the research, authorship, and/or publication of this article.
Funding
The authors disclosed receipt of the following financial support for the research, authorship, and/or publication of this article: This study was funded by the Yamuna River Project and the University of Virginia Center for Global Innovation and Inquiry.
Data Accessibility Statement
Data for this project are from a survey of individuals in two informal settlements in Delhi, India. Individual-level data are not available for sharing, per the consent agreement established with participants. Summary data are presented in this paper.