
Abstract
Public transit ridership was severely affected during the COVID-19 pandemic in 2020 and the effects have continued since. The present study examines changes to ridership immediately post-pandemic in 2021. Research investigating the effects of COVID-19 on disadvantaged population groups is limited and the present study addresses this knowledge gap. Ridership of socially-disadvantaged groups such as low-income, female, and ethnic minority people is examined using order logit regression models. The study uses data from an online travel survey conducted in Auckland, New Zealand, immediately after all COVID-19-related restrictions were lifted. This allowed the collection of revealed preference data for the post-pandemic period. The regression models included the effects of socio-demographic characteristics of individual riders, travel attributes, and built environment factors. Findings suggest that those with lower income and from an ethnic minority group are likely to continue using transit frequently post-pandemic. Younger riders from the ethnic minority group are less likely to use transit frequently, while pre-COVID-19 they were more likely. Access to transit stops near home and work are significant factors for the ethnic minority group. Higher land use mix near the residence and work locations are found to induce more transit trips for all. It is critical for transit agencies to understand how the usage has evolved post-pandemic. These findings highlight the importance of considering the effects of the pandemic on different disadvantaged groups. Public transport service providers are encouraged to consider equity as they develop strategies to improve transit ridership.
Keywords
Since the initial outbreak in Wuhan, China in December 2019, the coronavirus (COVID-19) has caused significant loss of human life and had a profound impact on public health globally. The World Health Organization (WHO) declared COVID-19 a pandemic on March 11, 2020. The outbreak forced governments to take drastic measures to stop spread of the virus. Many countries such as China, Italy, and Spain, among others, enforced strict social distancing, border closure, and even complete lockdown measures soon after the onset of the virus ( 1 ). Among these, New Zealand was one of the few countries which adopted a much more aggressive policy including an elimination strategy rather than a mitigation strategy against COVID-19 by enforcing a four-tier alert system (higher level alert indicates higher restrictions) depending on the spread of the virus ( 2 ). New Zealand was also among the very few countries which enforced “stay home” lockdown measures for several months after the declaration of a State of National Emergency on March 25, 2020. This restriction meant that a large proportion of the population was unable to make any trips by car and public transport for several months, placing New Zealand in a unique position in comparison to the rest of the world ( 3 ).
The transport sector worldwide was significantly affected by the pandemic. Strict mobility restrictions, work-from-home arrangements, and the advent of online shopping platforms, among others during the long lockdown periods caused a significant change in people’s travel patterns. The pandemic has provided transport researchers with a “natural experiment” to determine changes in travel behavior following disruption in commuting habits. One of the major shifts in travel behavior during the pandemic was the increased reliance on private vehicles for safety from virus transmission during the pandemic, which led to a significant reduction in transit usage ( 4 , 5 ). In 2020 and 2021, the use of public transport declined by as much as 80% in some countries with reduced work trips, and commuters being risk-averse to exposure to COVID-19 ( 6 ). This caused many transit agencies to reduce their service hours, causing a further decline in ridership ( 7 ). On the other hand, those members of transport-disadvantaged population groups, such as low-income people, women, older adults, and ethnic minorities, were less likely to hold employment that offered flexible working hours or the opportunity to work from home ( 8 ).
To date, very little is known about the effect of the COVID-19 pandemic on transport-disadvantaged groups and their ridership of public transport post-pandemic. For example, lower-income households tended to be more frequent transit riders before the pandemic, but it is unclear if this is the case post-pandemic ( 9 ). Among transit riders, the share of ridership by ethnic minorities was higher when compared with Caucasians in the United States, during the pandemic, whereas the opposite was found before the pandemic ( 8 ). A systematic investigation of this change in travel behavior and the factors affecting this change compared to the pre-pandemic period is missing. Although some studies have investigated mode choice ( 10 , 11 ) and transit ridership ( 9 ) before and during the pandemic periods, most of these studies did not explicitly analyze the ridership of transport-disadvantaged groups. Another knowledge gap is an understanding of the behavior post-pandemic when all pandemic-related restrictions were lifted. As cities and transit agencies prepare to provide transport services post-pandemic, it is critical to understand individuals’ preferences after the pandemic and to examine if their travel behavior has changed.
The present study aims to provide some understanding of this knowledge gap by examining transit ridership of transport-disadvantaged groups in the pre- and post-pandemic periods. An online survey was conducted between April and June 2021 in Auckland, New Zealand, immediately after all COVID-related restrictions were already lifted and normalcy resumed. This investigation adopts the concept of vertical equity to generate an understanding of how behavior might vary across different socio-economic groups such as age, gender, income, and employment status within the two population segments by ethnicity. Furthermore, this study tests the effects of mobility tool ownership, such as a vehicle, driver’s license, or transit pass, and built environment attributes such as land use characteristics and distance of transit stops from home and work.
Literature Review
Equity and Transit Ridership
Public transit riders are typically categorized into two groups: essential and choice riders. Individuals who do not have access to other travel alternatives such as private vehicles are identified as essential riders or transit dependents. On the other hand, choice riders are those who prefer transit over other accessible alternatives because of time and cost benefits. Essential riders are often found to belong to socially-disadvantaged population groups such as low-income, female, ethnic minorities, and unemployed individuals ( 12 , 13 ). However, they are not often provided with a fair distribution of transit resources such as higher accessibility, shorter travel and waiting time, extended service hours, and higher frequency of services ( 14 ). To reduce discrimination between the disadvantaged and well-off groups and move toward more equitable transit services, transit agencies should emphasize vertical equity in transit. Vertical equity refers to the fair distribution of resources by favoring different social groups according to their ability and needs rather than providing equal resources to everyone (also known as horizontal equity) ( 15 , 16 ).
During the pandemic, the contagious nature of the COVID-19 virus and consequent stay-at-home policies in many countries had a significant impact on travel behavior. However, transit ridership suffered the most as usage plummeted all over the world after the onset of the pandemic because of fear of virus spreading in confined spaces and proximity to other individuals ( 17 ). During the pandemic, people developed other habits, such as remote working and learning opportunities and online shopping for groceries, food, and other products ( 18 ). For those who have the option, the number of trips made daily was seen to reduce significantly, and in-home activity duration increased dramatically ( 19 ). On the other hand, during the pandemic, most socially-disadvantaged population groups did not have the same flexibility of working remotely and were still required to travel to work and other discretionary activities ( 20 ). As the world moves toward normalcy, transit agencies need to focus on vulnerable population groups to make transit ridership more equitable post-pandemic.
Impact of COVID-19 on Public Transit Ridership
Public transport ridership was adversely affected by the pandemic, with an 80% reduction of passengers across some major cities globally ( 6 ). During the pandemic, many people avoided the use of shared or public transport, reducing their need to travel either voluntarily or induced by policy ( 21 ). Restrictions were placed on the number of passengers allowed in public transport vehicles along with protective measures such as social distancing and wearing a mask ( 22 ). In Italy, maintaining a social distance of one meter reduced the vehicle capacity of trains by 20 to 50% during the pandemic ( 23 ). Waiting times at stations increased, as people were unable to board because of such restrictions. Globally, along with public transport restrictions, various policies encouraged people to use individual mobility, especially active modes, to reduce congestion ( 21 ). Besides, during the lockdown periods, private vehicles were perceived to be the most comfortable and safest transport mode for non-leisure activities and by those who were required to commute to work. Transit usage by individuals who had access to personal vehicles therefore declined during that period ( 24 ). In addition, alternative travel modes such as walking, cycling, and motorcycle riding emerged as some of the most viable and safest options for human mobility. This caused a large share of modal shift from public transport to other modes, mostly car, followed by walking, cycling, and motorcycle riding ( 22 ). Therefore, having a driver’s license, a vehicle, or a bike played a significant role in individuals’ mobility during the pandemic. In addition, land use and built environment characteristics were significant factors affecting active transport usage. For example, living within the central business district (CBD) and in diversified land use areas equipped with biking and walking facilities were found to encourage active transportation during the pandemic ( 25 ). As a result, individuals living in more walkable neighborhoods were found to avoid transit during that period ( 26 ).
Socio-economic characteristics such as age, gender, and income of households were found to be significant factors affecting transit ridership during the pandemic. For example, older adults were found to avoid public transport the most, while the change for younger adults (aged 29 and below) was the least ( 27 ). Almlöf et al. ( 27 ) investigated transit ridership behavior in Stockholm, Sweden, and found that change in travel behavior is dependent on socio-economic status. They found that areas with a higher proportion of socially-disadvantaged people had seen relatively less decline in transit ridership during the pandemic. On the other hand, a greater decline in ridership was observed in the areas where the majority of the people are of higher socio-economic status. A study conducted by Palm et al. ( 26 ) in two major cities (Vancouver and Toronto) in Canada also confirms that wealthier individuals have the privilege to stop using transit. Women were also seen to be more dependent on public transport use during the pandemic ( 21 ). Porter et al. ( 28 ) examined the mobility of women in low-income neighborhoods in three African cities: Abuja, Cape Town, and Tunis. Young women in these cities have lower access to work opportunities and motorized vehicles compared to men; as such they heavily rely on walking and public transport for their work trips. During the pandemic, women walked longer distances than men to reach their workplaces. Others continued to ride public transport despite the risk of viral transmission. Governments in some cities supported essential workers by providing free public transport services. Rajan et al. ( 29 ) revealed that self-isolation is a privilege of the affluent population groups. People from low-income households had to go outside to obtain a living, particularly in developing countries where financial support from the government was limited.
The effect of the pandemic on mobility has been adverse for disadvantaged population groups such as ethnic minorities compared with others. For example, Ma et al. ( 30 ) examined the travel behavior of Asians in Melbourne, Australia during the COVID-19 restrictions, and found that they were subjected to discrimination while participating in outdoor activities because of the anti-Asian racism induced by COVID-19. Thus, Asians faced significant stress during the pandemic and their walking activities reduced dramatically. Similarly, the overall transit ridership in cities having higher Asian populations in the USA experienced a significant reduction during the pandemic ( 31 ). Another study, by Hu and Chen ( 17 ), investigated the transit usage of different disadvantaged population groups in Chicago, USA, and found that people of color continued to have higher transit usage during the pandemic whereas transit usage was lower among Caucasians. The findings of the study also revealed that there was a significant decline in transit ridership in the regions dominated by Caucasian, educated, and high-income people. Parker et al. ( 9 ) further confirmed that ethnic minorities in the USA such as persons of color made fewer trips with transit compared with Caucasians during the pandemic.
As discussed above, the majority of the existing studies have focused on the changes in travel behavior and transit ridership during COVID-19. As the world prepares to emerge, putting this pandemic behind us, it is critical to understand the longer-term impacts of COVID-19 on travel behavior. In this line of investigation, several studies have provided insights into travel patterns after the onset of the pandemic and the future of mobility ( 4 , 22 ). For example, a shift in urban mobility toward private vehicles and away from shared and mass transportation systems might occur post-pandemic ( 4 , 5 ). A study in Canada showed that those who had access to a car pre-COVID-19, shifted their non-mandatory trips by public transport to car mode while those who were transit dependent continued to make non-mandatory trips by public transport post-pandemic ( 32 ). This post-pandemic change in behavior is also likely to be different for different socio-economic groups. For example, people with higher income might be willing to use shared mobility such as taxi/ride-hailing and might have a lower willingness to use public transport ( 33 ). Although the influence of socio-economic factors on travel behavior and transit ridership during COVID-19 is evident, whether a similar variability will pertain post-pandemic or not is still a research area missing from the literature. Particularly, it is important to undertake a systematic investigation into the existence of any difference in transit usage among socially-disadvantaged groups before and after the pandemic.
Contributions of the Study
The study contributes to the literature by investigating transit ridership of two population groups by ethnicity—ethnic minorities and Caucasians—for pre- and post-pandemic periods. This investigation adopts the concept of vertical equity, an approach that categorizes the population into different groups based on the interaction of individuals’ different identities such as ethnicity, gender, and socio-economic characteristics to examine the relationship between such identities and different activities of those groups ( 34 , 35 ). Several hypotheses were tested in this study for both groups relating to their socio-demographics and travel attributes, and the built environment characteristics of their residence and work locations. For instance, do ethnic minority transit users ride more frequently than Caucasians post-pandemic compared with the pre-pandemic period? How does the usage vary for different socio-economic characteristics within and across the two groups by ethnicity? What are the effects of travel attributes such as vehicle ownership and built environment characteristics such as diverse land use mix at the residence and work locations on the post-pandemic ridership?
Data
On March 25, 2020, the New Zealand government enforced “Alert Level 4 - Stay Home,” the highest of the four-tier lockdown measures following the declaration of a national emergency for the COVID-19 global pandemic. The entire nation entered into self-isolation and all forms of travel were banned except for commuting trips by essential workers and trips for necessities, including medical appointments, grocery shopping, and visits to support vulnerable family member(s). All schools, universities, and non-essential businesses were closed, and all public gatherings were prohibited. Such strict travel restrictions resulted in a steep decline in transit ridership in New Zealand. Since transit services were only accessible by the essential workers and for essential trips only (which indicates very few riders), they were operating at reduced capacity ( 36 ). Essential workers were required to carry some form of identification showing their job, employer details, or both, while traveling to verify their purpose of travel. Transit buses kept their front door closed and the rear doors were used for passenger boarding and alighting to minimize contact between passengers and drivers. During the lockdown period, transit services were operating free of charge while the riders were required to tag on and off so that the number of riders can be monitored ( 37 ). These measures helped the transit authorities to evaluate the demand for transit in different routes so that the supply of transit services can be modified according to demand. Gradually, the lockdown restrictions eased; and on June 8, 2020, all restrictions were lifted. Auckland, the most densely populated city in New Zealand, underwent more changes between Alert Level 2 and 3 depending on the spread of the COVID-19 virus between August 2020 and March 2021. After 12 March 2021, residents of all cities in New Zealand were not required to social distance or wear a face mask. The transit services along all the routes returned to their regular capacity as the travel restrictions were no longer in effect. Although during the pandemic, less demand for transit services provided opportunities to conduct maintenance works along different transit routes, there was not any significant overhaul of any routes observed post-pandemic. The supply of transit services after the pandemic was therefore similar to the pre-pandemic period.
Data for this study were collected in Auckland immediately after all restrictions were lifted and social activities resumed. An online survey was distributed in the city between April and June 2021. This was an opportune time for data collection as it was a chance to examine the initial effects of the pandemic on public transport ridership without any COVID-19 restrictions. The survey was distributed through a market research company using a random sampling technique. The first part of the survey included questions about the participant’s socio-demographic characteristics which included questions on age, gender, ethnicity, annual household income before tax, and the number of cars and people in the household. The next sections of the survey collected information for different time periods related to COVID-19 which were defined as follows:
Before COVID-19 or pre-pandemic period: Before the March 2020 lockdown period in Auckland.
During COVID-19: The period from March 2020 to March 2021, when COVID-19 restrictions were in place.
Immediately after COVID-19 or post-pandemic period: Immediately after 12 March 2021, when all pandemic-related restrictions were lifted.
The second part collected information on the participant’s employment before and after the pandemic, and changes that occurred during the pandemic such as a change in household income. The third section includes questions about their travel choices before, during, and after the pandemic. Among the travel choices, respondents were asked about their primary travel mode, transit usage frequency, safety perception while using transit, and so forth. This study also utilized some secondary data resources to derive land use and built environment variables. Neighborhood characteristics such as population, dwelling, and employment density were collected from New Zealand's official data agency StatsNZ. Location of transit stops and road network data were available on Auckland transport open data. Furthermore, land use data were extracted from Koordinates.com.
Differences in Transit Usage in the Data Based on Socio-Economic Characteristics
Statistical Testing
The decision to model transit usage based on ethnicity was taken through a systematic statistical investigation. Chi-squared analyses were used to explore the existence of transit usage differences among the key socio-economic groups based on income, gender, and ethnicity in both pre- and post-COVID-19 periods. Test results (Table 1) show that the difference in transit usage among low-income (annual household income < $74k), middle-income (annual household income $74k–$114k), and high-income (annual household income > $114k) is not significant in pre-pandemic (p-value = 0.51) and post-pandemic (p-value = 0.11) periods. On the other hand, transit usage across gender significantly differs before the pandemic (p-value = 0.06) but after the pandemic, the difference is not statistically significant (p-value = 0.92). In the case of ethnicity, there are significant differences in transit ridership between ethnic minority and Caucasian population groups in both pre-pandemic (p-value = 0.006) and post-pandemic (p-value = 0.078) periods.
Results of Chi-Squared Analysis
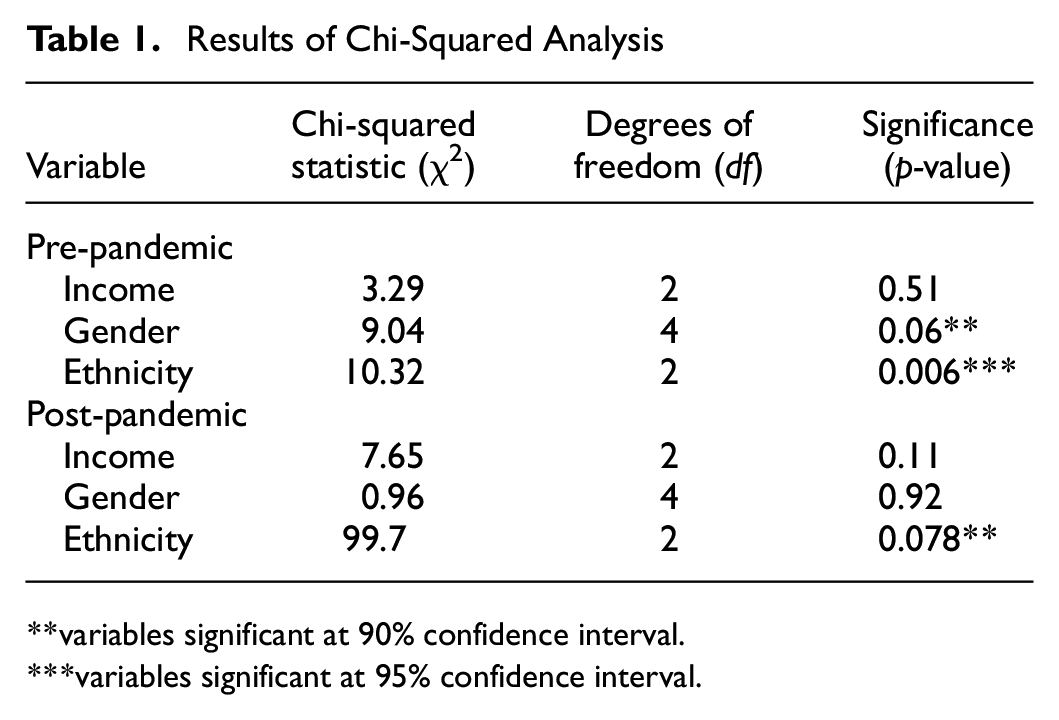
variables significant at 90% confidence interval.
variables significant at 95% confidence interval.
Changes in Transit Usage Based on Ethnicity
Figure 1 shows the changes in the transit usage frequency between pre- and post-pandemic periods among ethnic minorities and Caucasians. The thickness of each curved bar represents the relative share of transit riders for each category before and after the pandemic respectively. Each vertical bar on both sides has three branches which represent the share of riders whose transit usage frequency either remained the same or increased or decreased. Interestingly, a larger proportion of Caucasians were using transit less frequently (one to three times per week) before the pandemic compared with the ethnic minorities whereas the later group has a higher proportion of frequent transit riders (more than three times a week). Immediately after the pandemic, a significant decline in transit ridership occurred for both groups. A large proportion of less frequent and frequent transit riders transitioned to the “did not use” category after the pandemic. However, a larger proportion (i.e., about two times) of ethnic minorities were found to use transit more frequently than Caucasians.
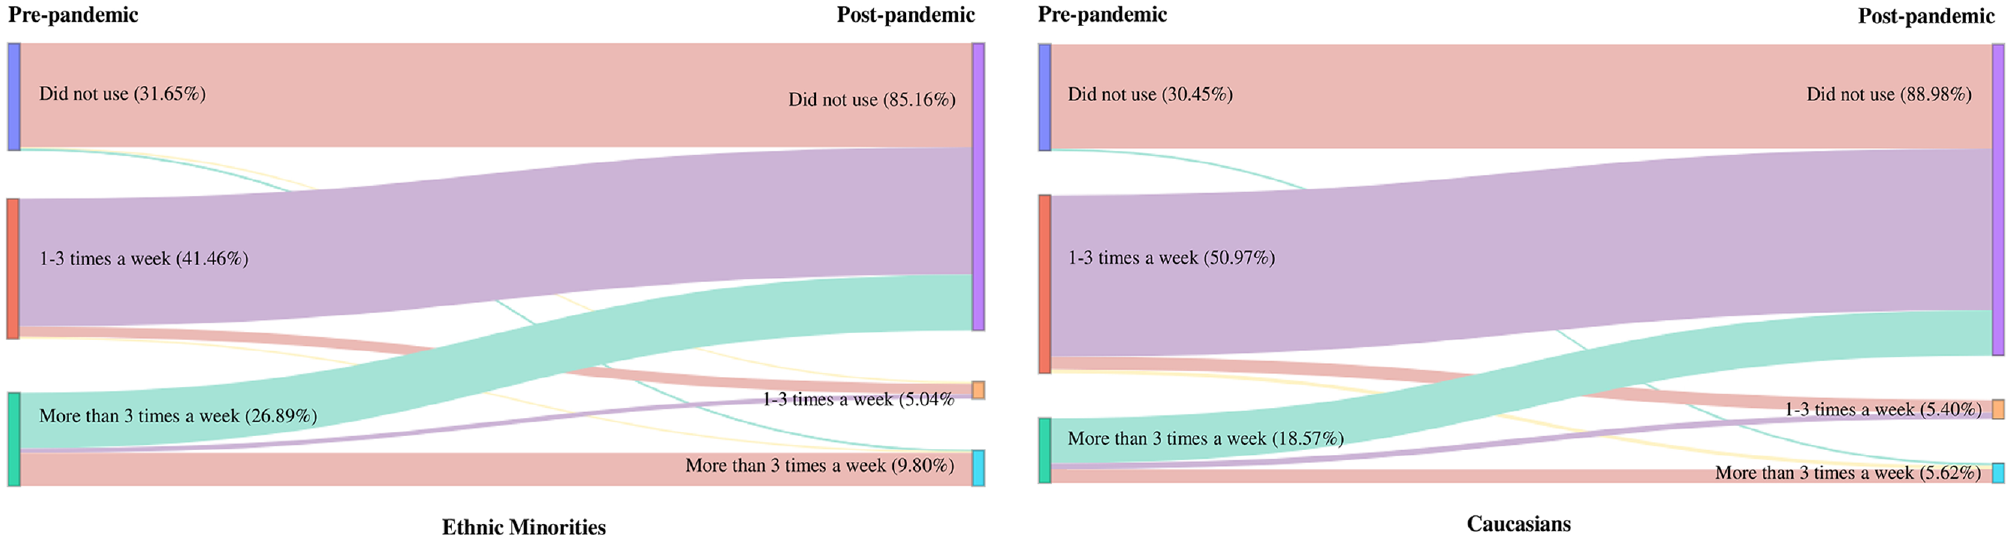
Changes in transit usage frequency of ethnic minorities and Caucasians in pre- and post-pandemic periods.
Descriptive Analysis
Data Validity
The sample includes 821 valid responses. The sample was compared with the census statistics for the Auckland region to test the representativeness of the sample. Figure 2 represents the comparison of the sample and census population with respect to age, employment status, and gender. The sample slightly under-represents the younger population. For example, the share of individuals aged 18 to 28 is under-represented by 4.96% in the sample (19.24%) compared with the census (24.20%). On the other hand, the sample over-represents individuals of age 29 to 39 and 72 to 82 by 3.14% and 5.97% respectively. In the case of full-time and part-time workers, the sample reasonably represents the population where the differences between the census and the sample are 0.48% and 2.38% respectively. The male population is slightly under-represented (3.24%) whereas the female population is over-represented (2.73%) in the sample. Furthermore, the sample over-represents those who are unemployed. This is because the census data is from 2018, while the sample was obtained in 2021 immediately after the COVID-19 pandemic during which a significant number of people became unemployed. Overall, the distribution of most of the sample attributes does not significantly deviate from the census and therefore the sample was considered representative of the Auckland population for modeling.
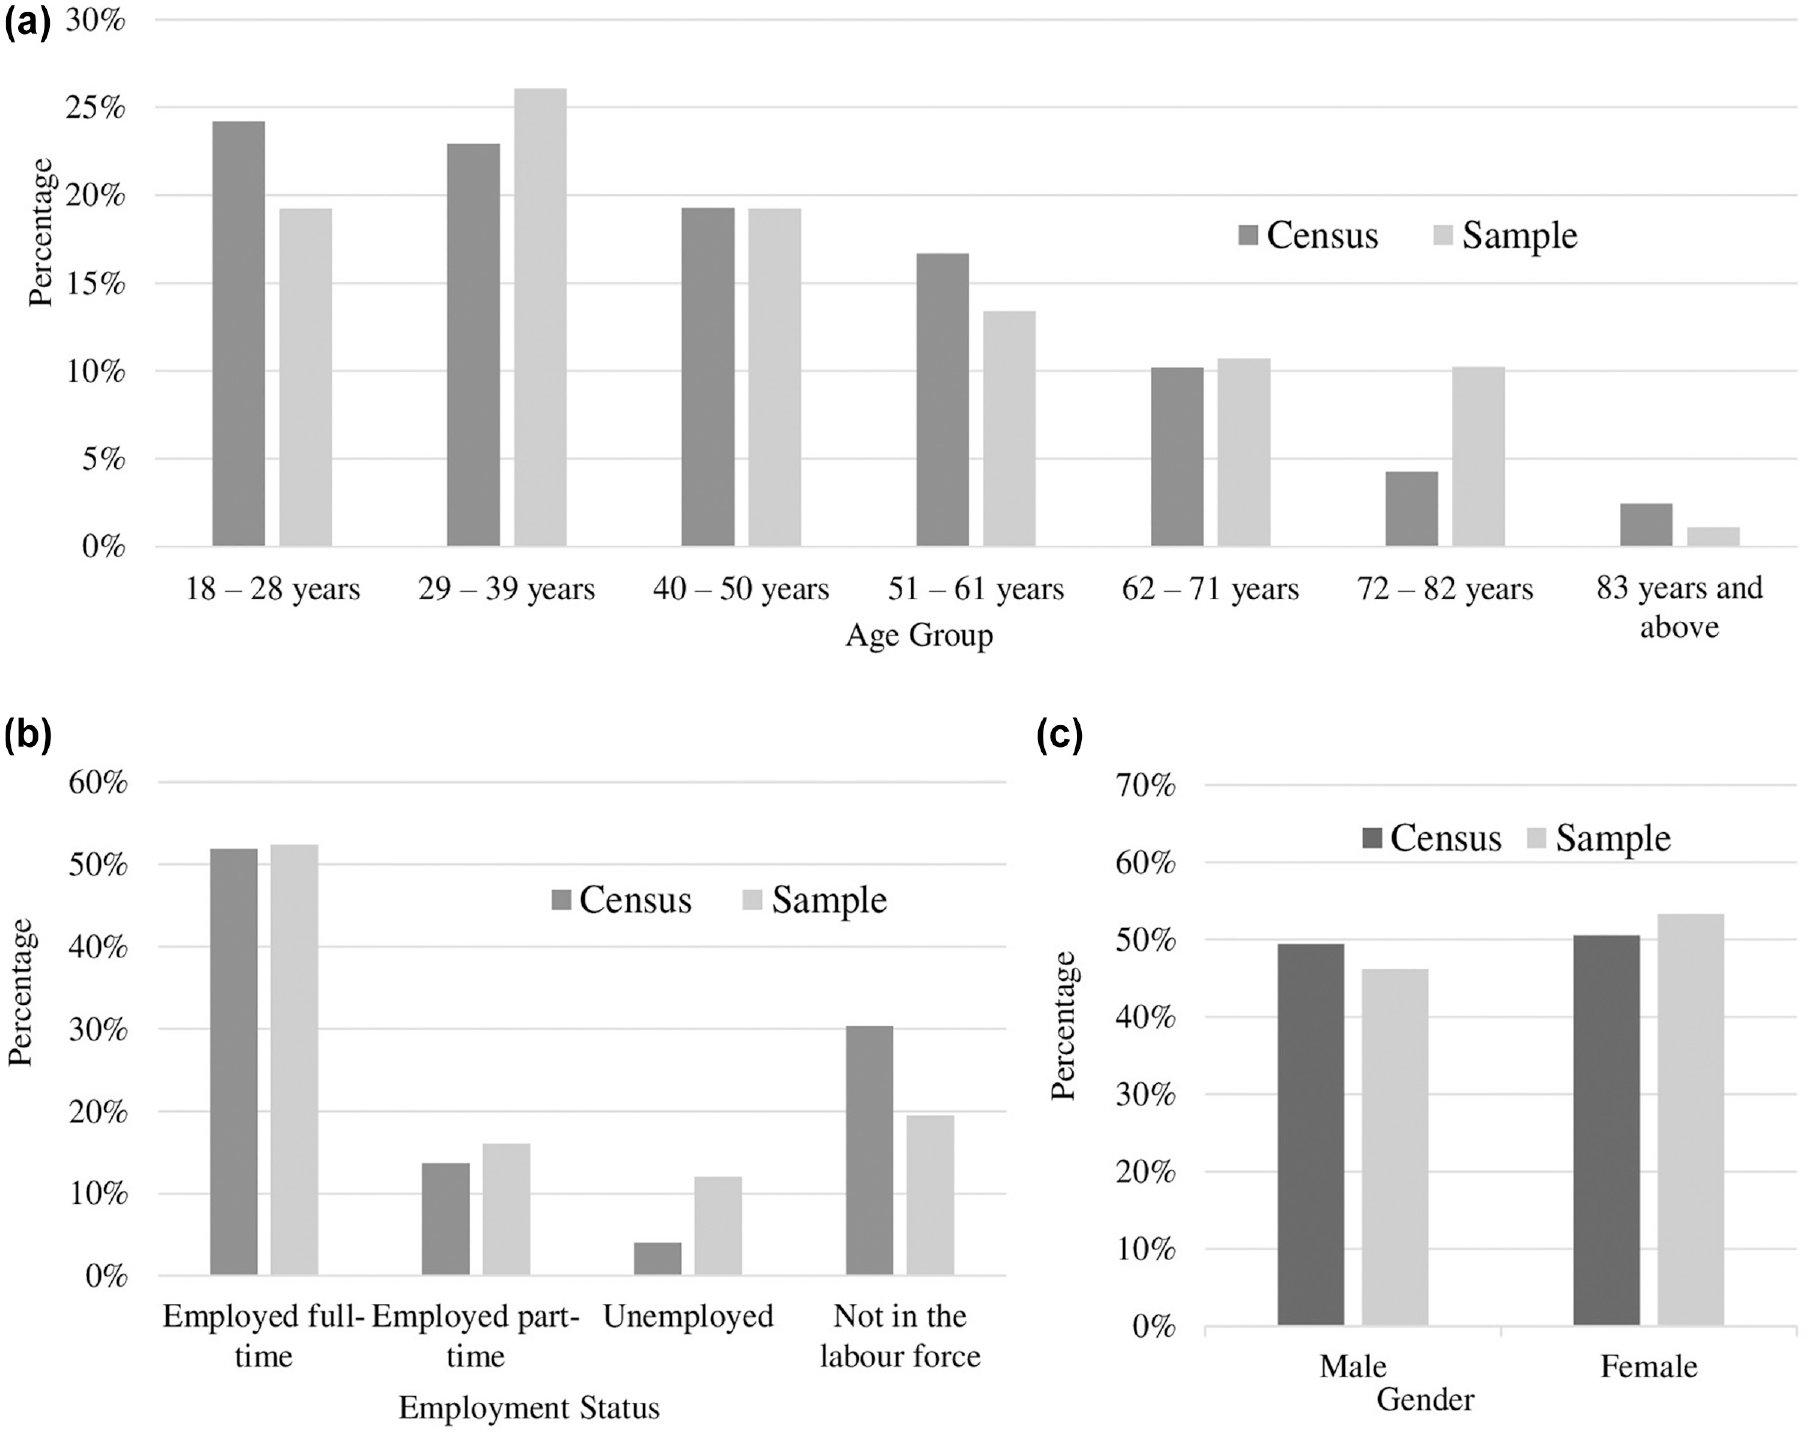
Comparison of census data for Auckland region and sample based on respondents’ age (a), employment status (b), and gender (c).
Sample Characteristics
The sample has a marginally higher representation of women (54%) than men (46%). The participants are between the age of 18 and 83. Also, about one-third of the participants are in the lowest annual household income group (<NZD 54,000); whilst more than half have a full-time job. After the pandemic, the percentage of people employed in full-time work reduced from 52% to 48%, the number of unemployed people increased to 14%, and those not in the labor force increased to 21%. More than half of the participants had a change in their total household income. The largest ethnic group in Auckland is NZ European (50.8%), followed by Chinese (9.3%) and Indian (9.1%). NZ European and other European people were identified as Caucasians while the rest were identified as ethnic minorities in this study which includes Chinese, Indian, Asian, African, and Maori, among others. Among the respondents, 463 (56.46%) were Caucasians and 358 (43.54%) were from ethnic minority groups.
The proportion of younger adults, aged between 18 and 39, is significantly higher for the ethnic minority group (56.58%) compared with Caucasians (36.50%). The majority of individuals from both groups (42.18% of ethnic minorities and 44.49% of Caucasians) are from low-income households with an annual income less than NZD 74,000. The share of respondents from the Caucasian and ethnic minority groups is 44.49% and 42.18% respectively. Among the Caucasians, 31% had an increase in household income, 12% purchased new vehicles, and 20.3% relocated to a new residence during the pandemic. Fewer households of the ethnic minority group had an increase in income (26.05%) and purchased new vehicles (10.64%) than Caucasians while a higher proportion of them relocated to a new residence (22.13%) during the pandemic. Figure 3 illustrates the distribution of different attributes across the Caucasian and ethnic minority groups.
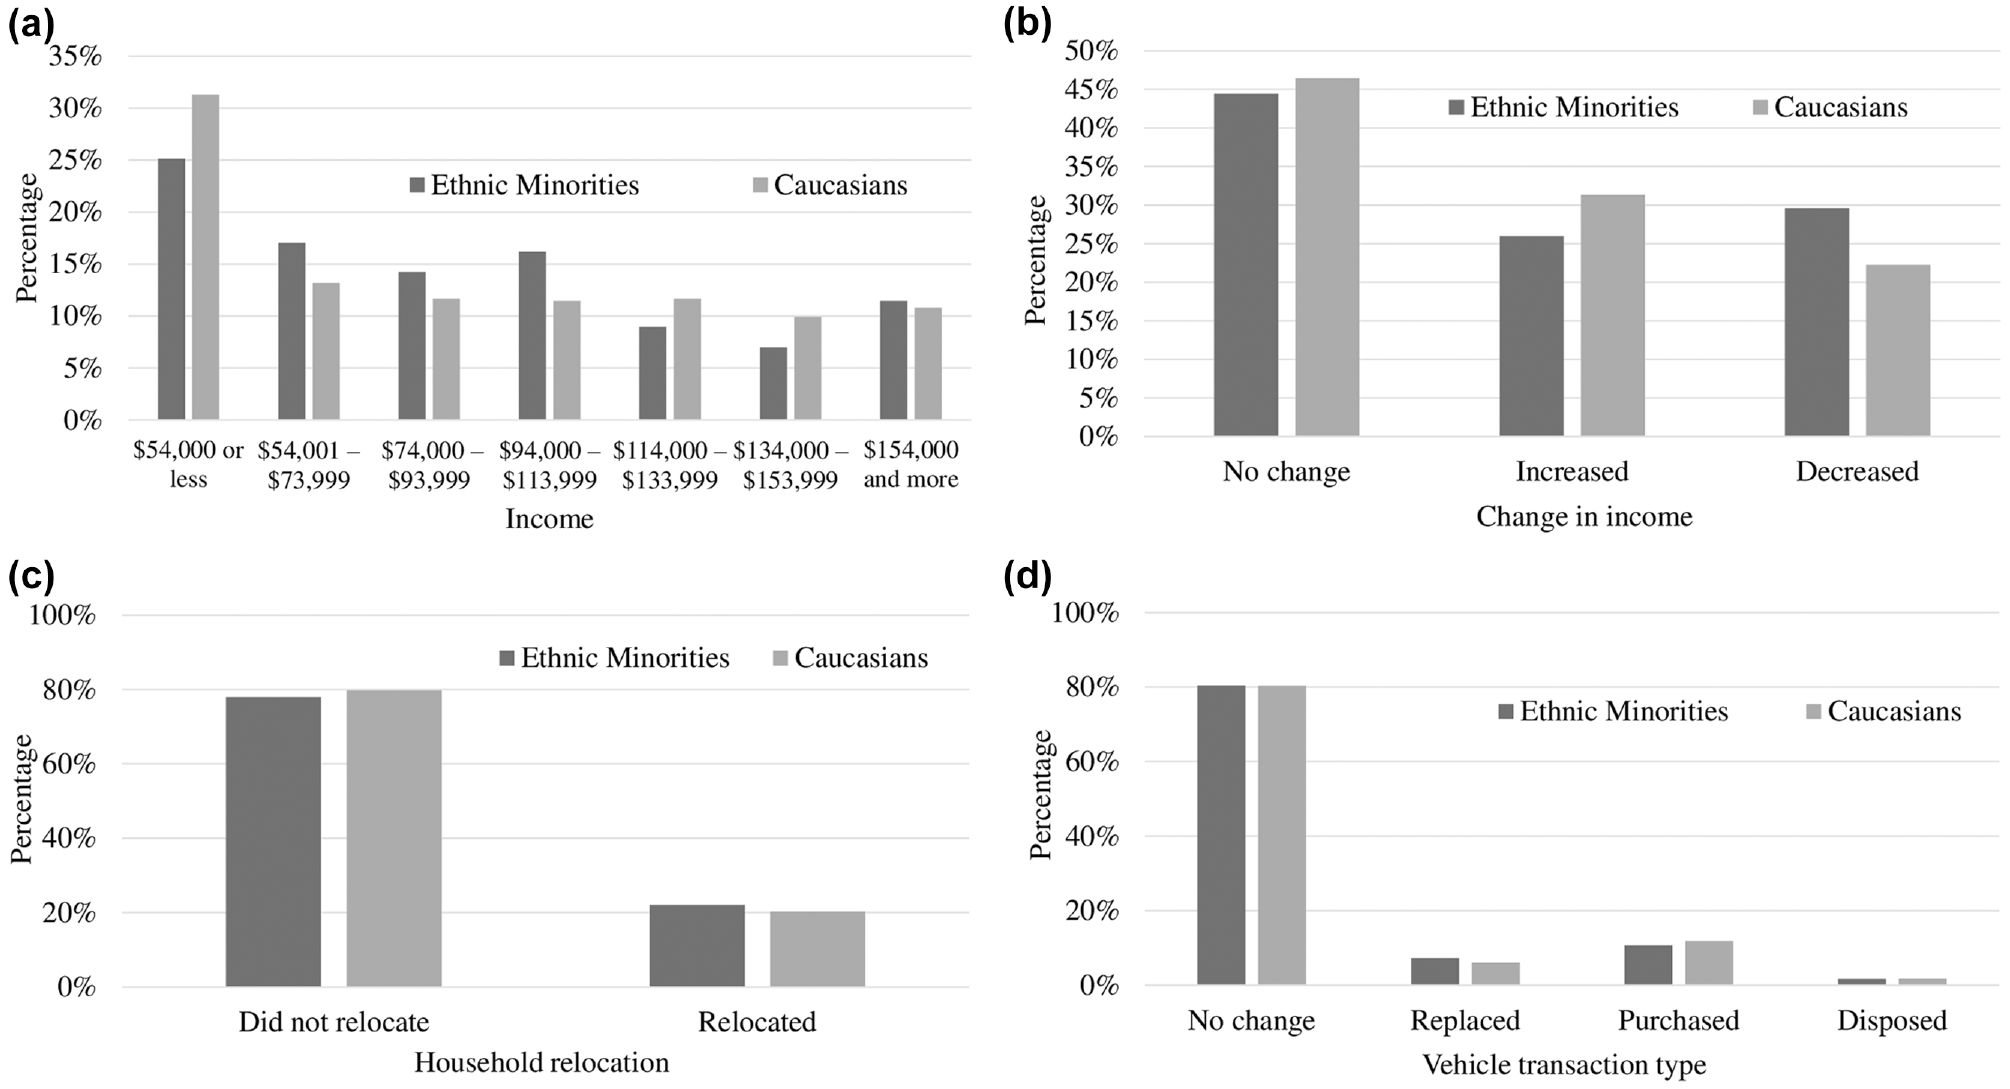
Changes in socio-demographics, residential location, and vehicle transactions across ethnicity: (a) changes in annual household income, (b) changes in household income, (c) household relocation, (d) vehicle transaction decisions.
Methodology
The study adopted an ordered logit modeling technique to investigate the transit usage behavior of ethnic minorities and Caucasians for the pre- and post-pandemic periods. The observed transit usage frequency of respondents is categorized as follows: did not use transit, one to three times per week, and more than three times a week. The latent propensity of transit usage

where

where µ is the threshold parameter. The probability of an individual

The following log likelihood function is maximized to estimate the co-efficients:

where
Results
Four ordered logit models were developed for the following groups and time-points: ethnic minorities pre-pandemic, ethnic minorities post-pandemic, Caucasians pre-pandemic, and Caucasians post-pandemic. Several variables were tested in the models which can be categorized into socio-demographic characteristics, travel attributes, changes in demographics and travel patterns, and built environment variables. Socio-demographic characteristics include age, household income, gender, presence of children in the household, and employment status. Among the travel attributes, the effects of transit pass and driver’s license ownership, number of vehicles, and commute distance were tested. The built environment attributes include employment density, dwelling density, population density, distance to the CBD, land use mix diversity, distance to the nearest bus stop from the residence and workplace, and the number of transit stops within 500 m radius of the residence and workplace. The land use index variable is generated following Bhat and Gossen ( 39 ) which is as follows:

where
Table 2 shows the summary statistics of the variables retained in the final models. The parameter estimation results of the models are shown in Table 3.
Summary Statistics of the Variables Retained in the Transit Usage Frequency Models
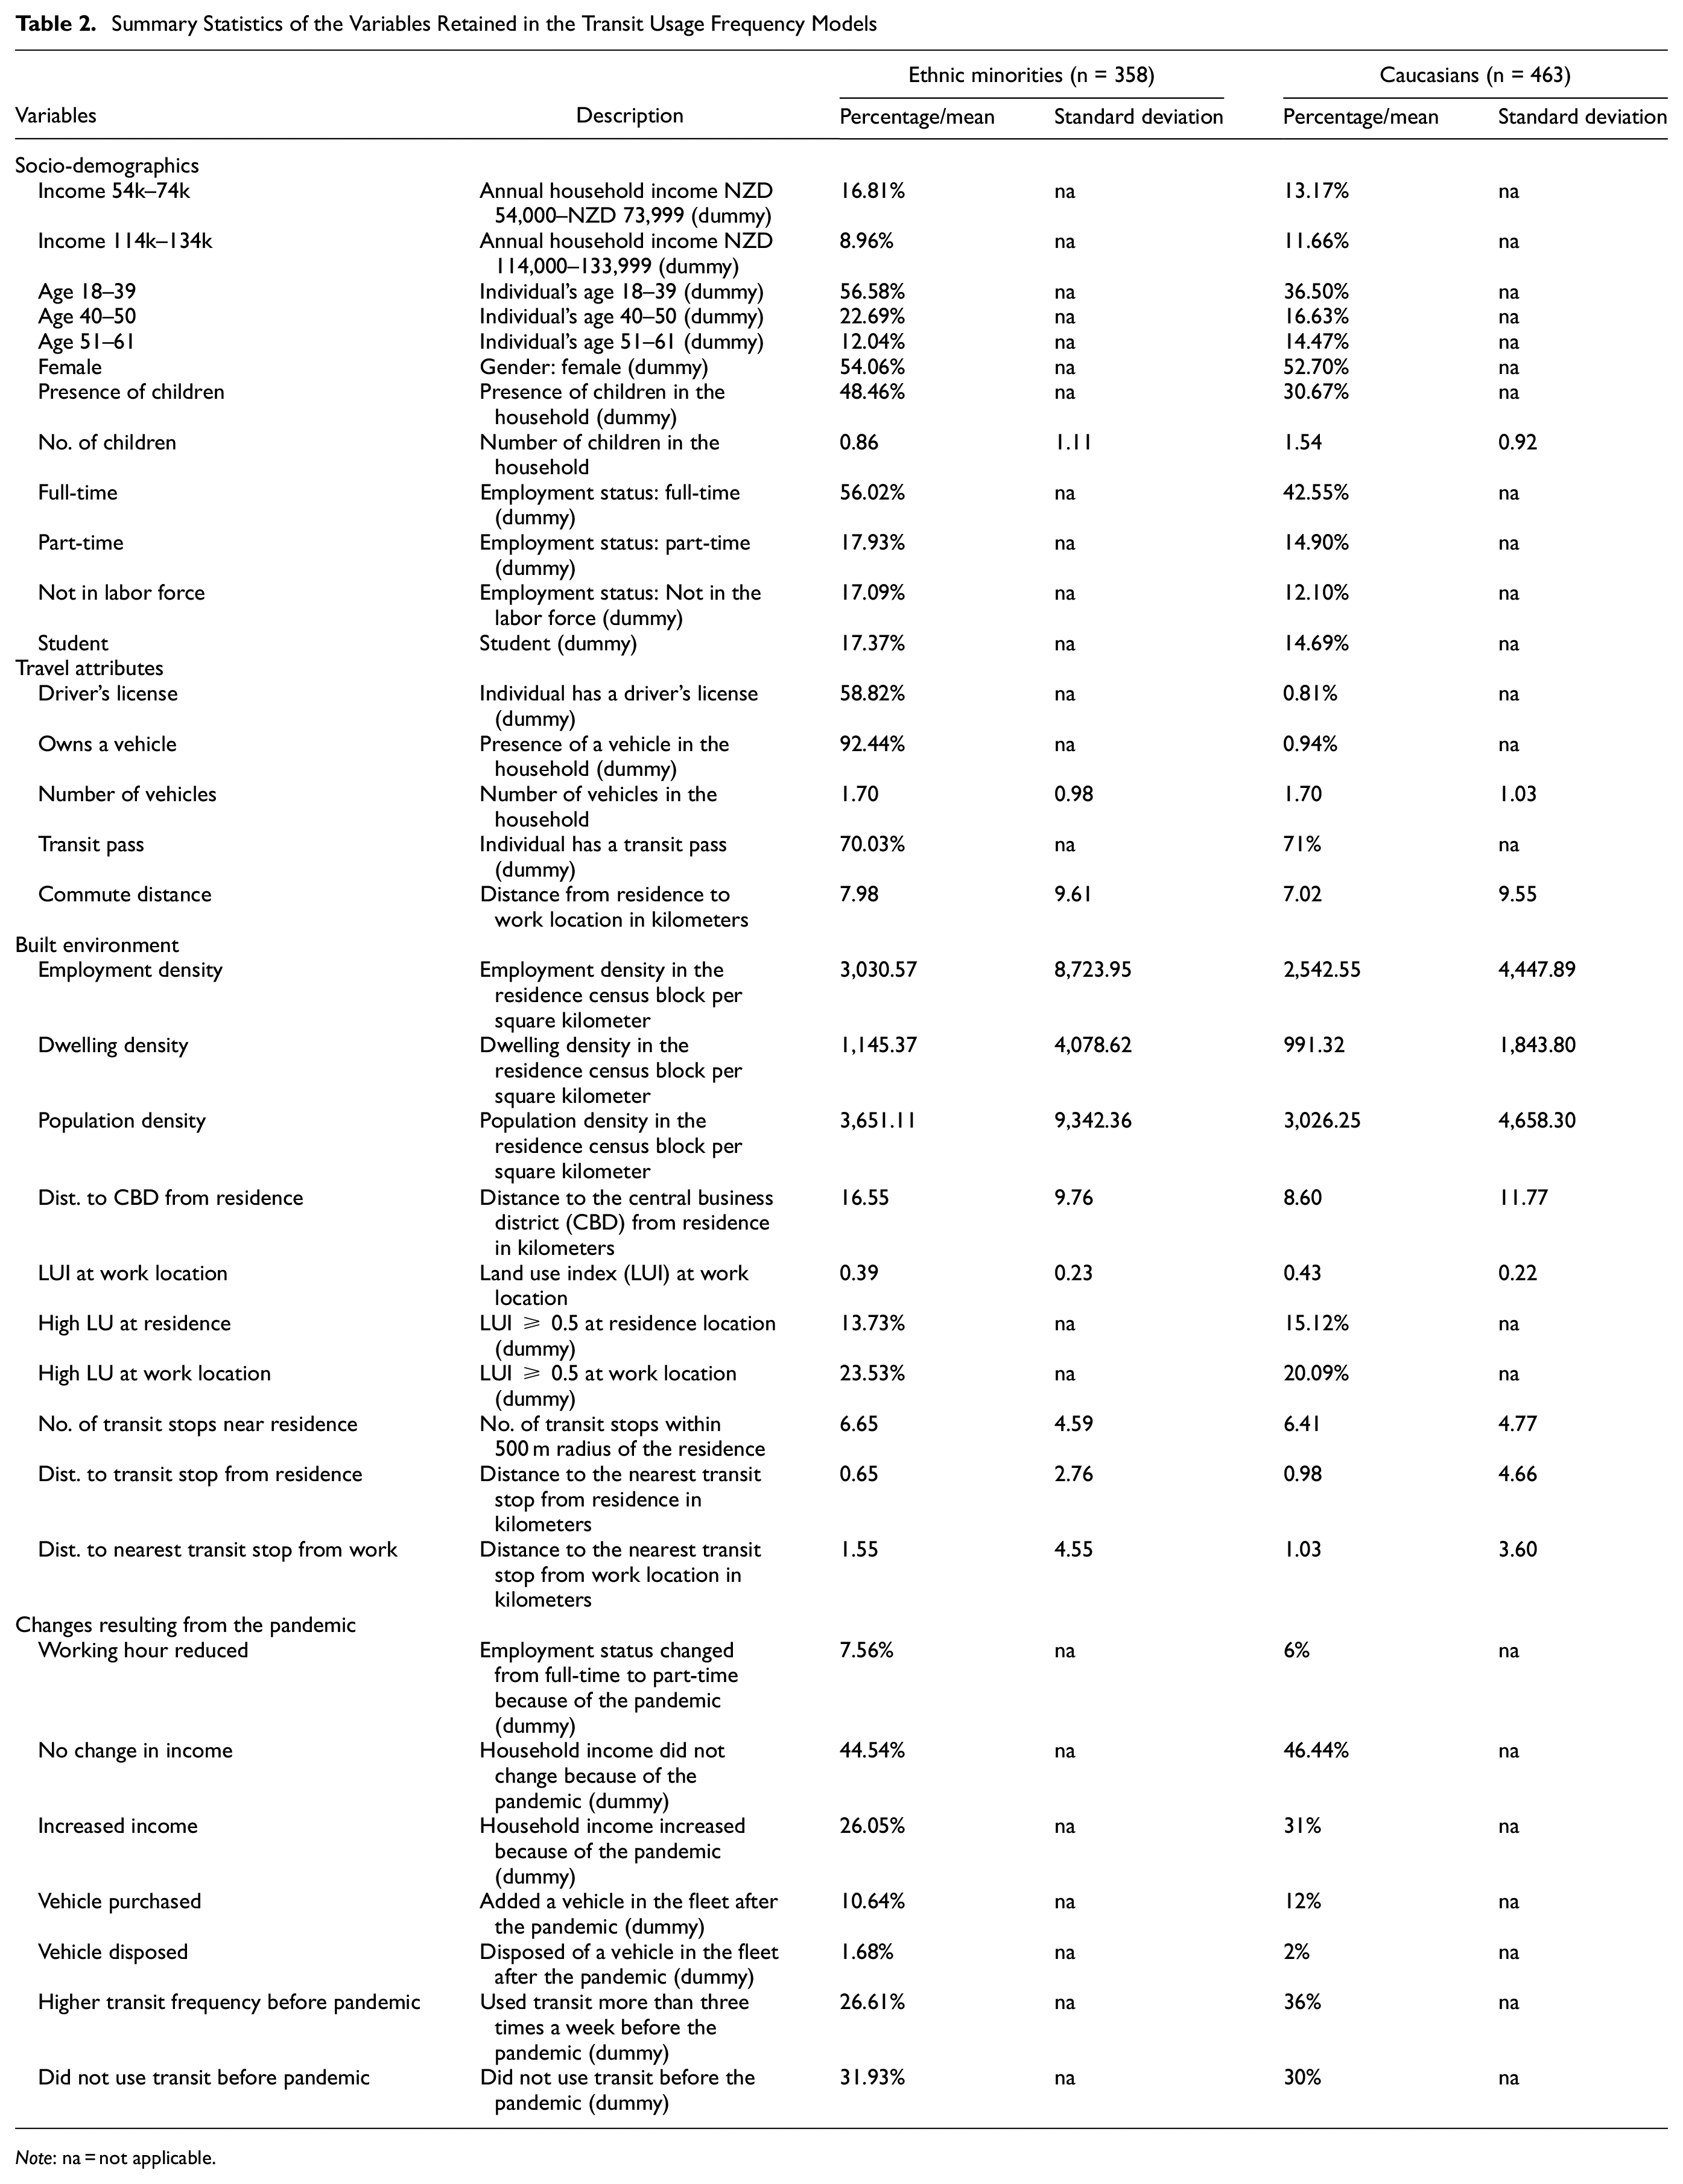
Note: na = not applicable.
Parameter Estimation Results of the Ordered Logit Models
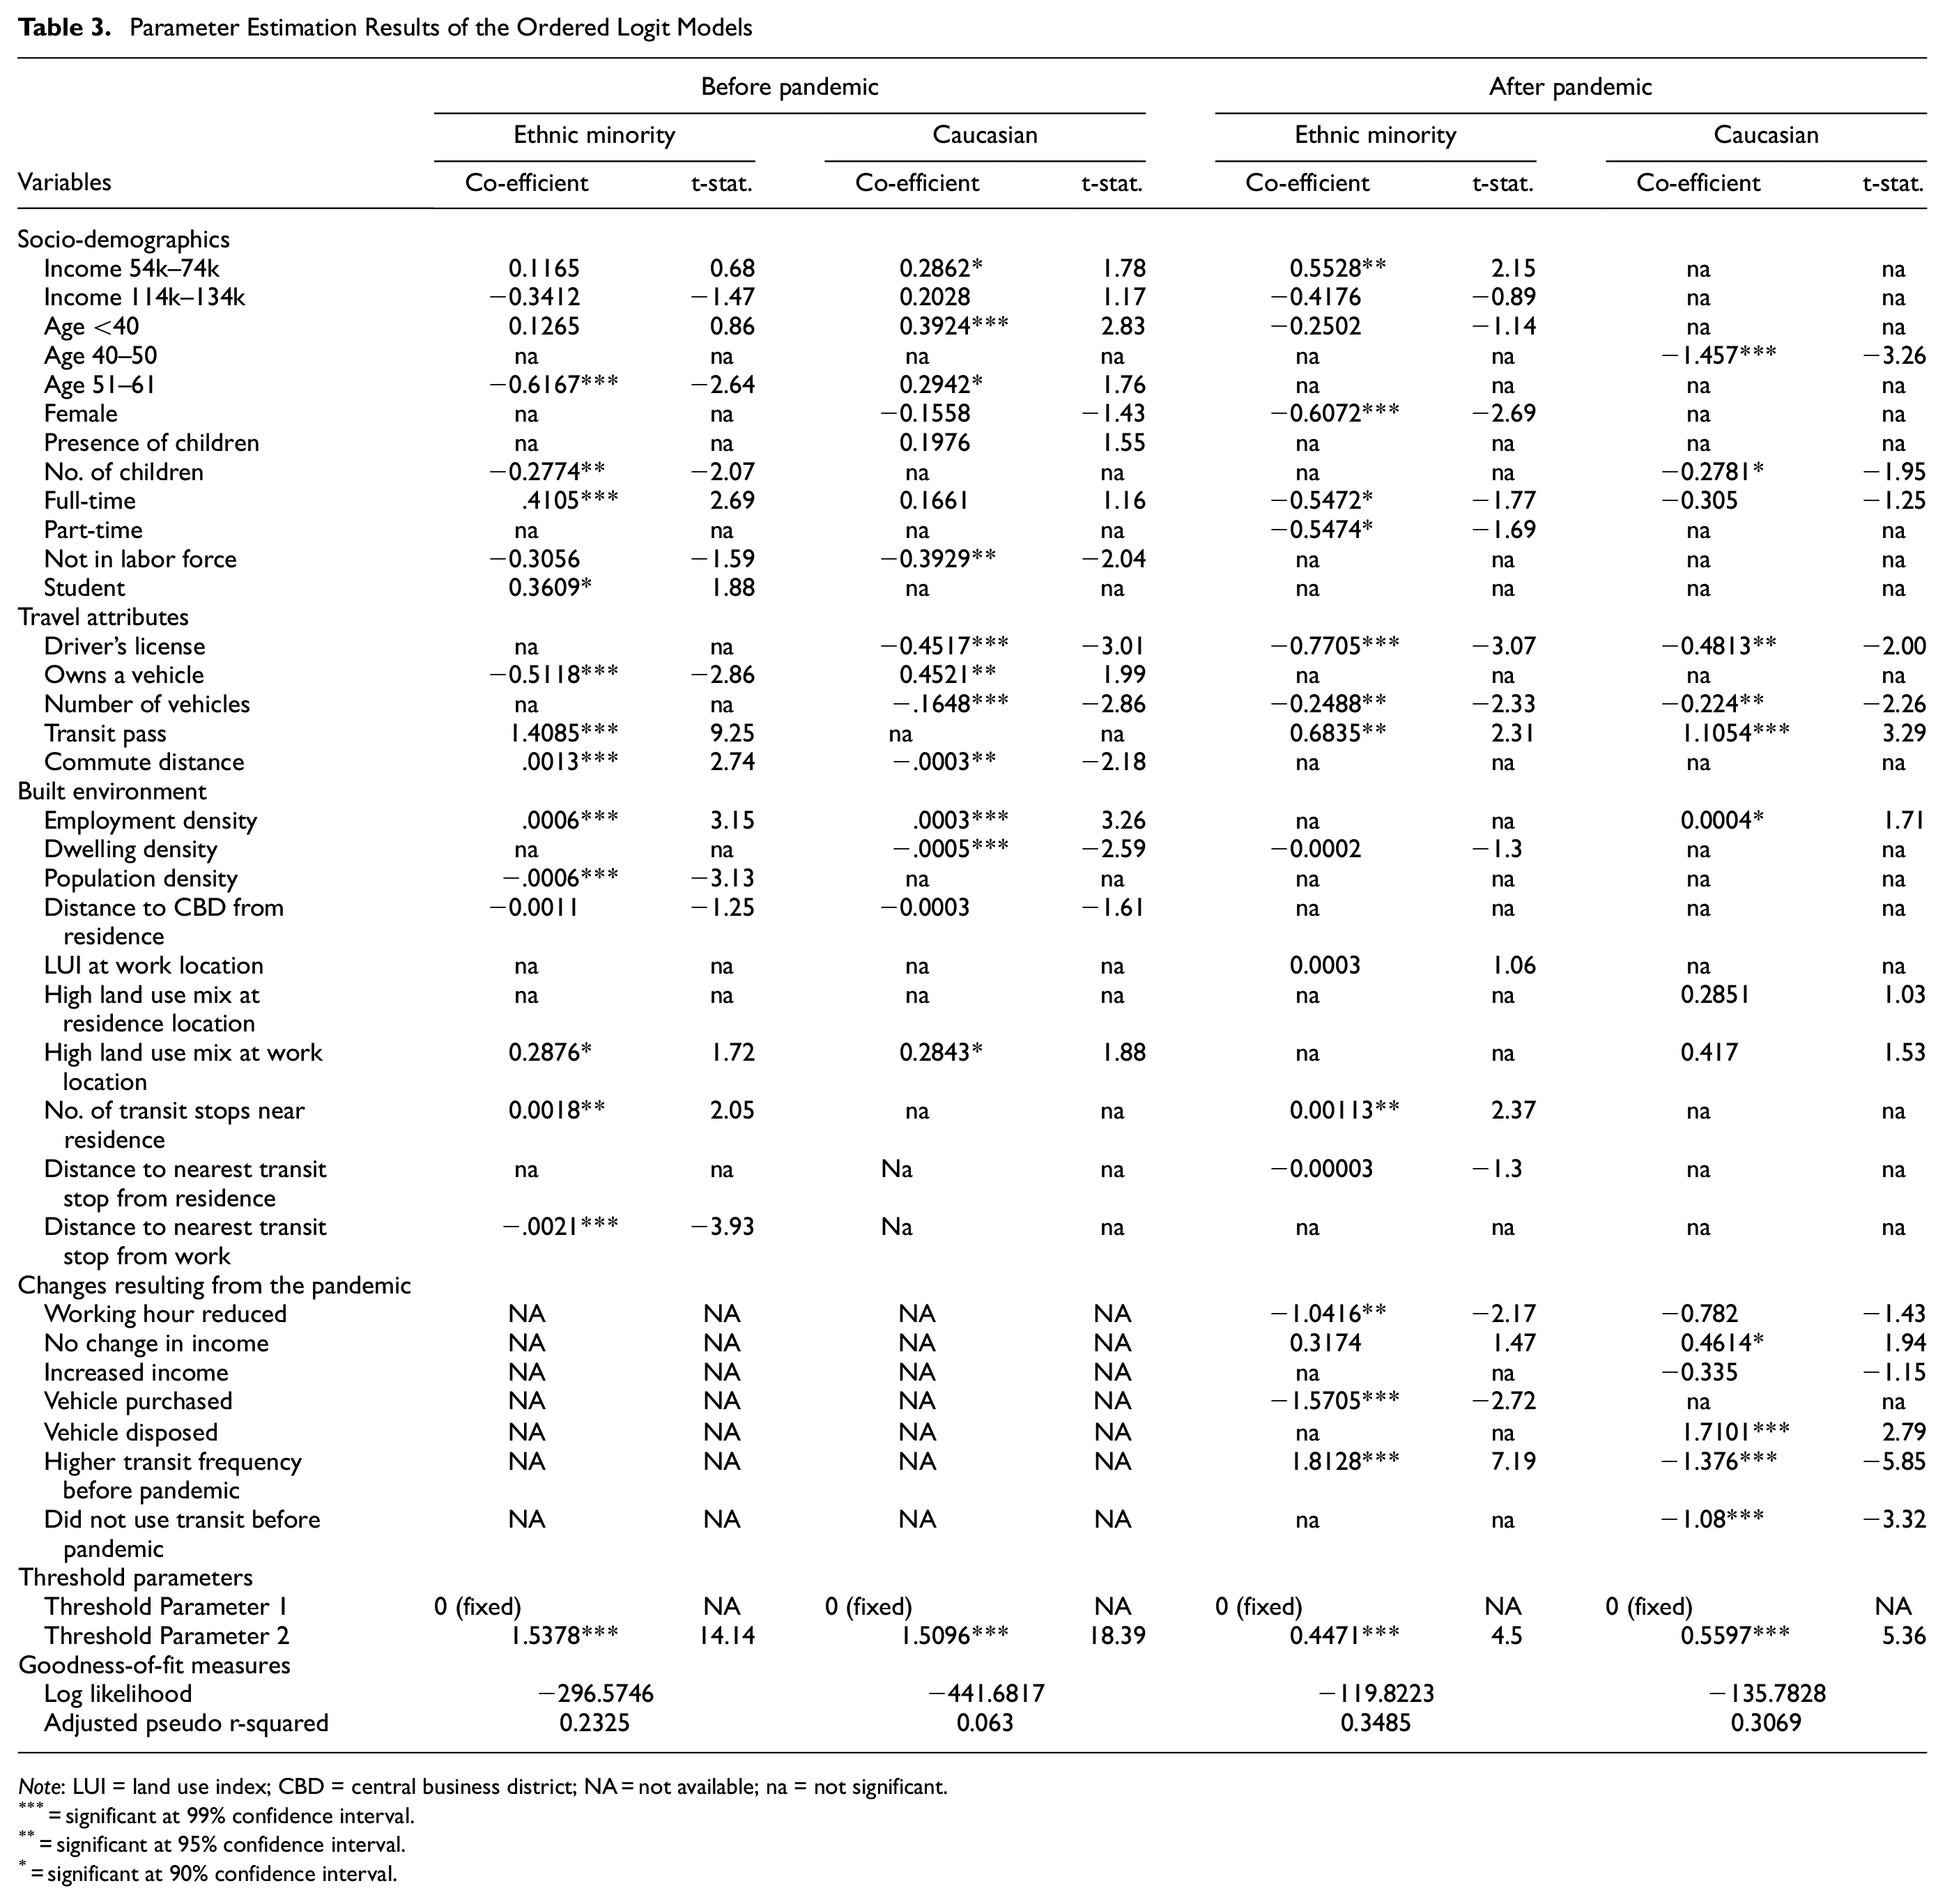
Note: LUI = land use index; CBD = central business district; NA = not available; na = not significant.
= significant at 99% confidence interval.
= significant at 95% confidence interval.
= significant at 90% confidence interval.
Pre-Pandemic Model Results
Riders from low-income households (annual household income from NZD 54,000 to NZD 73,999), for both population groups, were likely to use transit frequently before the pandemic. High-income (annual household income between NZD 114,000–139,999) ethnic minorities were less likely to use transit frequently whereas for high-income Caucasians there was a positive relationship. Younger individuals (aged 18–39) belonging to both groups were more likely to use transit on a frequent basis. Interestingly, older adults aged between 51 and 61 among the ethnic minorities showed a lower likelihood of using transit frequently. In contrast, older Caucasians were inclined toward frequent transit usage. The presence of children in the household was found to be a significant factor affecting the transit usage of ethnic minorities. They were less likely to use transit with an increased number of children in the household, whereas Caucasian households with children were more likely to use transit. The type of employment also had an influence on the ridership of both groups. Full-time workers and students among the ethnic minorities were more likely to use transit frequently whereas individuals not in the labor force were less likely to be frequent transit users. In the case of Caucasians, full-time workers and individuals who were not in the labor force showed very similar behavior to the ethnic minority population.
Mobility tools such as ownership of vehicle, driver’s license, and transit pass significantly influenced the likelihood of transit usage of both ethnic minorities and Caucasians before the pandemic. For ethnic minorities, having a transit pass significantly increased the propensity of using transit whereas owning a vehicle in the household significantly decreased transit usage frequency. Interestingly, Caucasians showed a higher propensity for transit usage even if they owned a vehicle. However, their propensity to use transit decreased with an increase in the number of household vehicles. Furthermore, the model results revealed that commute distance had a significant positive relationship (
The model results further confirm that built environment attributes significantly affect transit usage frequency for the two population groups. For example, with the increase in employment density in the home census block, the propensity of transit usage was found to increase for both groups by ethnicity. Individuals residing in residential areas with higher population density, higher dwelling density, and locations farther away from CBD, were likely to use transit less frequently, which is evident for both groups. In contrast, the urban environment represented by high diversity land use mix near the work location has a positive relationship with transit usage for both population groups. In the case of transit accessibility, more transit stops within 500 m of the residence tended to increase transit usage. Similarly, transit stops close to the work location also tended to increase transit usage.
Post-Pandemic Model Results
Ethnic minorities from low-income households are likely to use transit frequently after the pandemic whereas those from high-income households are less likely to do so. Within this population group, female riders are less likely to be frequent users in comparison to male riders. The number of children (
For the post-pandemic model, a new set of variables were tested which are related to the changes in household demographics and travel attributes during the COVID-19 pandemic. The factors have shown strong influences on transit usage in the post-pandemic period. For instance, individuals who experienced reduced working hours because of the pandemic are less likely to use transit frequently. Individuals whose income did not change as a result of the pandemic are likely to be frequent transit riders after the pandemic. Meanwhile, Caucasians who experienced an increased income since the pandemic are less likely to use transit frequently. Purchasing a vehicle (
Discussion
The aim of this research was to investigate transit usage behavior in Auckland before and after the pandemic by examining changes in ridership between gender, income, and ethnicity. The pandemic had an adverse impact on transit services because of the shortage of ridership. In many parts of the world (e.g., several regions in the USA), even after the social distancing measures were lifted in the post-pandemic period, many transit services were shut down in response to low ridership. The closure of transit services or supply shortage might affect the ridership behavior of the essential riders, which should be taken into consideration while modeling post-pandemic transit ridership. However, the region of this study, Auckland, avoided such a supply shortage of transit services in the post-pandemic period. Therefore, in this study, the transit ridership behavior might not be affected by such circumstances.
Findings from the two logit models suggest that lower-income individuals, who largely represent essential transit riders, are more likely to use transit services frequently both pre- and post-pandemic. The finding is consistent with Hu and Chen ( 17 ) and Parker et al. ( 9 ). Lower-income individuals might not have the financial ability to own vehicles as high-income households have and therefore are likely to be more dependent on transit for commuting. Further, the results also show that those with lower income and from ethnic minority backgrounds are more likely to continue using transit frequently post-pandemic. This may be because most are transit dependent and may not have opportunities for remote or hybrid working ( 41 ). On the contrary, higher-income individuals within the ethnic minority group were found to be less frequent users of transit both before and after the pandemic. One of the interesting findings was that the younger adults in the ethnic minority group who were frequent transit riders before the pandemic are more likely to reduce their frequency post-pandemic. Among the Caucasian group, households with children were more likely to use transit frequently before the pandemic. Their behavior changed post-pandemic, becoming less likely to use transit. The perceived risk of COVID-19 spread among children, who were largely unvaccinated at the time of data collection, could be an influential factor behind this shift in transit ridership.
Transit riders with full-time employment in both population groups significantly changed their behavior from a positive relationship in the pre-pandemic model to a negative relationship in the post-pandemic model. This decline in usage after the pandemic could be explained by the change in working arrangements that occurred widely during the pandemic. For example, the pandemic provided unique opportunities for flexible working hours and remote working which were not as widely available in the pre-pandemic period. Many employees as well as employers found this to be productive, and consider continuing some form of telecommuting arrangements in the post-pandemic period. Since commuting is one of the primary purposes to use transit for many riders, the reduction in the need for commute trips because of telecommuting might have resulted in a reduction in transit usage ( 42 ).
In the case of mobility tool ownership, individuals with access to vehicles such as owning a driver’s license and a vehicle are less likely to use transit frequently both before and after the pandemic, for all, which is consistent with the findings of Palm et al. (
40
). For Caucasians, the negative effect of the number of vehicles in the household was 1.5 times stronger after the pandemic (
The findings of this study have important policy implications for equitably offering access to transit services as transit agencies prepare to re-evaluate plans and policies post-pandemic. The results suggest that transit agencies need to target lower socio-economic groups to support their return to the labor market. This group of the population is often essential transit users and socially disadvantaged residents. Although many first-generation immigrants are well educated ( 43 ), they are still obliged to take low-income jobs initially ( 44 ). As a result, they have a higher tendency of being frequent transit riders because of not being able to afford to own a car ( 45 ). Through local training (i.e., education and job experience), they often quickly transition into higher-income jobs ( 46 ). For this high-income ethnic minority group, the model results suggested they are less likely to use transit frequently. Therefore, the targeted offering of more incentives to lower-income ethnic minorities might not only ease off their transport expenditure but also motivate them to become loyal transit users. However, they often tend to reside in areas that might not have good access to transit services ( 47 ). In this line of investigation, the model results suggest that proximity of transit stops and more mixed land uses at home and work are the critical factors to induce higher transit usage among ethnic minority people. Transit infrastructure investments and increasing land use diversity in areas with a higher share of ethnic minorities should be considered a priority.
Conclusions
The present study contributes to the wider knowledge of travel behavior after the COVID-19 pandemic by examining ridership of transit immediately after lockdown restrictions were lifted and normalcy of social interaction resumed. Ordered logit models were developed for pre- and post-COVID-19 pandemic periods for two population groups by ethnicity (Caucasians and ethnic minorities). The investigation adopted a vertical equity lens to further explore the effects of different socio-economic segments within Caucasians and ethnic minorities; for example, income and age. Data were collected in Auckland from April to June 2021, immediately after all COVID-19-related restrictions were lifted in New Zealand.
One of the key areas of investigation for this study was to examine the effects of changes in socio-economic and travel attributes, which occurred widely during the pandemic. The model results showed that the changes in work hours, such as a change in employment from full-time to part-time, are likely to decrease the transit usage for both groups. Many individuals lost jobs, worked reduced hours, or both, during the pandemic. This indicates that the reduction in working hours may result in making fewer trips and therefore less transit usage. One of the critical factors that was tested in this study was how frequent transit users before the pandemic are likely to use transit after the pandemic. The model results showed heterogeneous behavior across ethnicities. For example, frequent transit users among ethnic minorities are likely to continue using transit frequently after the pandemic. This may indicate that they are essential riders. On the other hand, Caucasian transit riders are less likely to use transit frequently after the pandemic, which indicates the availability of travel options for them.
These results indicate a need for re-evaluation of the applicability of pre-pandemic transit schedules, which are largely designed to meet the needs of commuters during peak periods. Given the success of the telecommuting strategies during the pandemic and the inclination toward offering similar flexibility to some extent post-pandemic, it is essential to collect more data on the daily travel pattern of telecommuters and adjust the transit schedule accordingly. Although the study provides important insights into the consideration of equity while making transit-related plans, policies, and infrastructure investment decisions post-pandemic, it has certain limitations. Some of the variables retained in the final models were not statistically significant, such as income and age. However, they confirm the prior hypotheses and are important policy variables. They are retained with the assumption that they might be significant with a bigger sample size. Another limitation is that the attitudinal attributes were not included in the study. Individuals’ attitudes toward transit usage, such as safety perception, might significantly affect their transit ridership post-pandemic; especially as the continuing spread of the COVID-19 virus placed a disproportionate burden on socially disadvantaged groups who are essential riders. Therefore, future research is encouraged to explore the effects of attitudes on transit ridership post-pandemic from an equity lens.
Footnotes
Acknowledgements
The authors would like to thank Trevor Nikodym for proofreading the manuscript.
Author Contributions
The authors confirm contribution to the paper as follows: study conception and design: M. S. Hossain, M. R. Fatmi, S. Chowdhury; data collection: S. Chowdhury; analysis and interpretation of results: M. S. Hossain, M. R. Fatmi, S. Chowdhury; draft manuscript preparation: M. S. Hossain, M. R. Fatmi, S. Chowdhury. All authors reviewed the results and approved the final version of the manuscript.
Declaration of Conflicting Interests
The author(s) declared no potential conflicts of interest with respect to the research, authorship, and/or publication of this article.
Funding
The author(s) disclosed receipt of the following financial support for the research, authorship, and/or publication of this article: The authors would like to thank the Natural Sciences and Engineering Research Council - Discovery Grant for their financial support.