
Abstract
Parking demand at university campuses has been an issue for decades and is gradually increasing each year. With limited capacity, space, and funds to expand parking facilities, there is a dire need to better understand parking behavior on a university campus so that universities can better utilize the limited resources available. One methodology that has been used by Metropolitan Planning Organizations to predict traveler behavior is known as travel demand modeling, where the most common modeling technique is a four-step procedure that utilizes socioeconomic data to predict current and future traffic volumes in a network (e.g., a city). This study focuses primarily on the trip generation step, and The University of Texas at Tyler campus was used as a case study. First, each parking lot on campus was assigned to a parking demand zone (PDZ) based on its proximity to classroom buildings, and the hourly arrival demand for each PDZ was measured using pneumatic tube counters. The course schedule and floor space utilization data for each building on campus were then extracted as input parameters to predict the parking demand at each PDZ. A linear regression model and two artificial neural network (ANN) frameworks were developed. One ANN model was recommended, as it had an R-squared value of 0.846. From the selected ANN model, an equation has been extracted, which has the potential to be used by course schedulers to modify the course schedule to better mitigate parking demand on campus without the need to develop new parking facilities.
Keywords
Parking facilities are a part of the transportation infrastructure. With an increasing population and vehicle ownership rate, the need for adequate parking facilities is greater than ever because every vehicular trip is associated with parking at the trip origin, at the destination, or both ( 1 ). Local, state, and federal agencies currently have regulations in place to design and use parking facilities ( 2 ); however, researchers, engineers, and planners are constantly developing new solutions to meet the increasing parking demand, such as Intelligent Transportation Systems (ITS) to monitor parking facilities and disseminate information to drivers ( 3 ).
Universities are no exception to the parking problem. Every university has its own parking issue, which is caused by a variety of trips (i.e., students, faculty, staff, and visitors) that generate parking demand, and they generally have limited space and funds to increase parking capacity on campus to provide enough supply for the overall demand ( 4 ). Students form the largest group of users of campus parking demand ( 5 , 6 ). Therefore, it is very important to better understand the parking behavior of university students, so that the supply can be better utilized. Furthermore, Krueger ( 7 ) found that university campuses have an increasing interest in using ITS to help manage parking issues.
The U.S. Institute of Transportation Engineers (ITE) has developed the Parking Generation Manual, which uses linear regression of an input (e.g., floorspace, dwelling units, employees, etc.) to predict parking demand ( 8 ). In addition to the type of facility, parking demand fluctuates based on the time of day and day of the week ( 9 , 10 ). Essentially every university is faced with the same challenges when it comes to parking: limited land and financial resources to serve an increasing number of students, faculty, staff, and visitors. Because of the complexity of use of land and trip characteristics of campus users, universities usually have special strategies to manage parking through university parking offices ( 11 ). Certain characteristics, such as campus size and growth, institutional policy, and financial consideration should be considered but are often neglected by consultants and design engineers hired for university parking planning ( 12 ). Past research has studied the effect of the course schedule on parking permit pricing ( 13 – 15 ); however, no model has been developed to directly correlate the course schedule with the parking demand. Moreover, one of the main factors that influences where an individual (i.e., student, faculty, staff, or visitor) will park on a university campus is the course schedule. By accurately modeling the relationship between the course schedule and students’ travel behavior, the parking demand and congestion within a university campus network may be improved without the need to expand the parking capacity on a university campus. This reasoning is what led to the objective of this research.
In this study, the trip generation (and trip attraction) step of the four-step procedure of travel demand modeling (TDM) is followed to predict the hourly arrival demand at each parking zone on a university campus. Similar to how socioeconomic data are used as inputs to predict trip generation and attraction rates, a university course schedule and floor space utilization data could be used to predict the arrival demand at each parking zone on a university campus. In particular, the following research questions will be answered in this paper:
Research Question 1 (RQ1): Can a simple linear regression model accurately predict the hourly arrival demand at each parking zone on a university campus?
Research Question 2 (RQ2): Can a more sophisticated model, such as an artificial neural network (ANN), be developed to better predict the hourly arrival demand at each parking zone on a university campus?
Research Question 3 (RQ3): Can an artificial neural network (ANN) model be developed using only the course schedule to accurately predict the hourly arrival demand at each parking zone on a university campus?
Research Question 4 (RQ4): What is the best model developed from the first three research questions, and what equation should be used by course schedulers?
Research Question 5 (RQ5): What are the changes in demand at each parking zone on a university campus if a modification is made to the course schedule?
The answer to RQ1 will inform the authors and users of the ITE Parking Generation Manual ( 8 ) how well multiple linear regression models predict the hourly arrival demand at each parking zone on a university campus. The answer to RQ2 and RQ3 will indicate if sophisticated, non-linear models can more accurately predict the hourly arrival demand at each parking zone on a university campus. The most accurate model from RQ1, RQ2, and RQ3 will be the answer to RQ4, as well as an equation of the most accurate model for university course schedulers to use. The answer to RQ5 will inform the authors and university course schedulers of how changes to the course schedule will affect and better accommodate the parking demand at a university campus. For this paper, the main campus of The University of Texas at Tyler (UT Tyler) is used as a case study.
This paper can be outlined as follows. After this introduction, university parking, the four-step TDM procedure, and the ANN framework are reviewed. This is followed by a description of the methodology and the data that was collected. The following section presents and discusses the results, specifically as it relates to the research questions. This paper concludes by highlighting the major findings and contributions of this research.
Review of the Problem and Related Works
The literature reviewed in this section provides an overview of parking. Parking may be defined as the act of stopping one’s vehicle and leaving it unattended at a designated location ( 10 ). A parking facility is comprised of parking stalls, which are designated spaces for a vehicle to park, typically marked with solid white or yellow lines. The capacity of a parking facility is the maximum number of vehicles that may be accommodated for a period of time. To determine the number of stalls required, engineers refer to the ITE Parking Generation Manual ( 8 ), where the number of stalls required is a linear function of one input, typically floor space area, number of students, number of hospital beds, number of theater seats, and so on, depending on the type of facility. One of the main limitations is that the number of stalls is a function of only one input parameter, and the user of the Parking Generation Manual must decide which input parameter is best to use.
University Parking
The literature reviewed in this section is specifically related to university parking. Shoup ( 1 ) discovered that the revenue from parking permits at a university covers only a small percentage of the cost per stall when a new parking facility is constructed. This means that the construction of new parking facilities is not a financially feasible option. In addition to the limited land use, universities have to effectively manage the demand of parking facilities on campus. Annual costs to operate and maintain a parking facility are additional expenses to be considered. Kenney ( 15 ) calculated that, for a facility with 1,000 parking spaces, the average annual cost of maintenance and operation varies between $400,000 and $1.2 million depending on the type of facility (i.e., open surface lot or parking garage).
Universities are unique in that the arrival rate of individuals is strongly correlated with the course schedule in addition to the floor space utilization. Therefore, the scheduling of classes is one of the primary factors that influences when a student will arrive, the time spent on campus, and the parking destination ( 12 , 14 , 16 ). Because of the different types of buildings on a university campus (e.g., dormitories, libraries, sports venues, classrooms, offices, etc.) universities attract different types of users.
Outside of the United States, universities worldwide struggle with parking issues, see Batabyal and Nijkamp ( 17 ) and Aoun et al. ( 18 ) as two examples. Batabyal and Nijkamp ( 17 ) conducted a probabilistic analysis of parking demand and parking violations at two university campuses. They made use of the mean arrival of vehicles to compute probability density functions of the number of occupied stalls. In a study conducted in Thailand, it was determined that students typically arrive at 9:00 a.m. and park their vehicles until 4:00 p.m. ( 19 ). Conversely, a more recent study in a public university in the United States reported that over 90% of the students surveyed arrive on campus within one hour before their first class starts ( 12 ).
Axhausen and Polak ( 20 ) suggested that the walking distance to the destination is more important than the time required to search for a parking space. On the other hand, Gurbuz and Cheu ( 12 ) surveyed college students and found that the cost of parking is the most important influence when they decide on purchasing a parking permit. The second most important parameter that affected their decisions was the walking time to the final destination. Barata et al. ( 21 ) analyzed different parking lots on campuses within The University of California System, which includes free on-street parking, and concluded that the elimination of free parking could reduce congestion and would thus increase revenue for the university. Therefore, knowing the demand to begin with helps to know the supply surplus, which, in turn, can create profit without over- or under-supplying.
Travel Demand Modeling (TDM)
The literature reviewed in this section provides an overview of TDM, which is a four-step procedure used by city planners and engineers to predict travel demand on major roads within an urban area using socioeconomic data ( 22 ). The four-step procedure, as followed by Metropolitan Planning Organizations nationwide, is listed as follows:
Trip Generation and Trip Attraction
Trip Distribution
Mode Choice
Traffic Assignment.
Parking is a factor in the trip destination and mode choice of students’ decision-making process. Before the first step, an area (e.g., an urban city) must first be zoned. To do so, an urban area is zoned into traffic analysis zones (TAZs), which are based on socioeconomic data and land use configurations. Each zone is drawn to be as homogeneous as possible ( 22 ). TAZs may be internal or external depending on their location with respect to the metropolitan region.
Once an area has been zoned into TAZs, the first step in TDM is trip generation and trip attraction, which typically uses linear regression models and socioeconomic data to predict the total number of daily person-trips leaving and entering each TAZ. More sophisticated modeling techniques have been widely used in the field of machine learning, including ANN, which will be described in more detail in the Machine Learning Models Subsection. Numerous studies have been included in the ITE Trip Generation Manual ( 23 ); however, only one input parameter (e.g., number of students, floor space area, etc.) may be used to predict the trip generation and trip attraction rates. Once the linear regression models have been developed, future predictions may be forecast to determine the number of trips generated from and attracted to each TAZ.
The second step in the TDM process is trip distribution, which determines the number of interzonal trips between each TAZ. Once the number of daily person-trips between each TAZ is known from the second step, the third step then further separates each interzonal trip into different travel modes. Finally, once the number of trips between each zone is determined for each mode, the fourth and final step of the procedure is the traffic assignment. This final step assigns each vehicle to a path in the network to travel from every originating zone to every destination zone.
Machine Learning Models
The literature reviewed in this section is related to the machine learning models, which are used to answer the research questions. In this research, several supervised machine learning models were considered, including linear regression. Linear regression is one of the most widely used models in supervised machine learning because of its simplicity and interpretability of the results.
More complex machine learning models include decision trees, support vector machines, random forest, and ANNs. ANNs are highly interconnected networks that have robust computational and pattern recognition capabilities ( 24 ). This machine learning model has also been widely used for its ability to model non-linear relationships in a non-complex way. ANNs were originally developed to emulate the human brain, which has led to a growing usage of ANNs in the engineering field for numerical and statistical methods, in lieu of traditional linear regression. In general, a three-layer feed-forward backpropagation ANN with a sigmoid activation function and one hidden layer is the most common type of ANN ( 24 ). In addition, one hidden layer is typically sufficient for solving most of the non-linear problems without network overfitting ( 24 ).
In recent years, machine learning techniques have been used extensively for modeling and predicting parking demand. These techniques offer the potential to improve the accuracy and efficiency of parking management systems, leading to reduced parking congestion and improved urban mobility. One common approach for modeling parking demand using machine learning is to use regression algorithms. For instance, Gurbuz et al. ( 4 ) developed a Tobit regression model to estimate university students’ parking demand. Another approach is to use clustering algorithms, which group similar data points together based on their characteristics, such as the number of parking spaces required at a particular time of the day. This can help identify patterns and trends in parking demand. Shao et al. ( 25 ) used a clustering algorithm to predict parking occupancy and duration time estimation. Recently, deep learning techniques, such as convolutional neural networks (CNNs) and recurrent neural networks (RNNs), have been used for modeling parking demand. These techniques have shown promising results by capturing complex, non-linear relationships between input features and parking demand. Gkolias and Vlahogianni ( 26 ) proposed a CNN-based method that uses a large dataset of parking lot images to predict parking availability. Similarly, Yang et al. ( 27 ) extended their CNN model by utilizing RNN with long short-term memory to capture the temporal features for their real-time parking occupancy prediction model. Overall, machine learning techniques have the potential to significantly improve the accuracy and efficiency of parking demand modeling and prediction.
Summary
It has been concluded after a thorough review of all the available literature that parking is an issue for university campuses because of growing population and demand along with the limited resources to accommodate more parking. In previous research, machine learning techniques have been used to model parking demand. While these techniques have shown promising results, they have limitations. CNN-based methods require a large amount of images of parking lots to train the model, which may not be available in all cases. Additionally, RNNs may not be suitable for modeling parking demand since parking behavior may not always follow a clear pattern over time at university campuses, especially those without a repetitive parking demand pattern. Furthermore, previous studies primarily rely on historical parking data to predict parking demand, which may not accurately reflect future demand.
This study aims to address these limitations by using only course schedules and floor space utilization data for each classroom building on a university campus as input parameters to model the hourly arrival demand at each parking zone by following the trip generation and trip attraction step of the TDM procedure.
Methodology
For this research, the UT Tyler main campus was used as a case study. Each academic year, UT Tyler sells permits to students, faculty, staff, and visitors at flat rates for each user type. Students with permits may park for free in any parking zone on campus. Typically, students park in the zone closest to their classroom building so as to minimize the walking time to the destination ( 12 ).
To complete the objective of this research, first, the UT Tyler campus was divided into parking demand zones (PDZs), which is the same concept as TAZs used in the TDM four-step procedure. The PDZs were drawn to be as homogeneous as possible. That is, they were drawn based on adjacent classroom buildings. One or more parking lots (or zones) on campus were assigned to each PDZ based on its proximity to various buildings on campus. Therefore, every trip was generated from or attracted to one PDZ. Figure 1 presents the nine PDZs and adjacent classroom buildings.
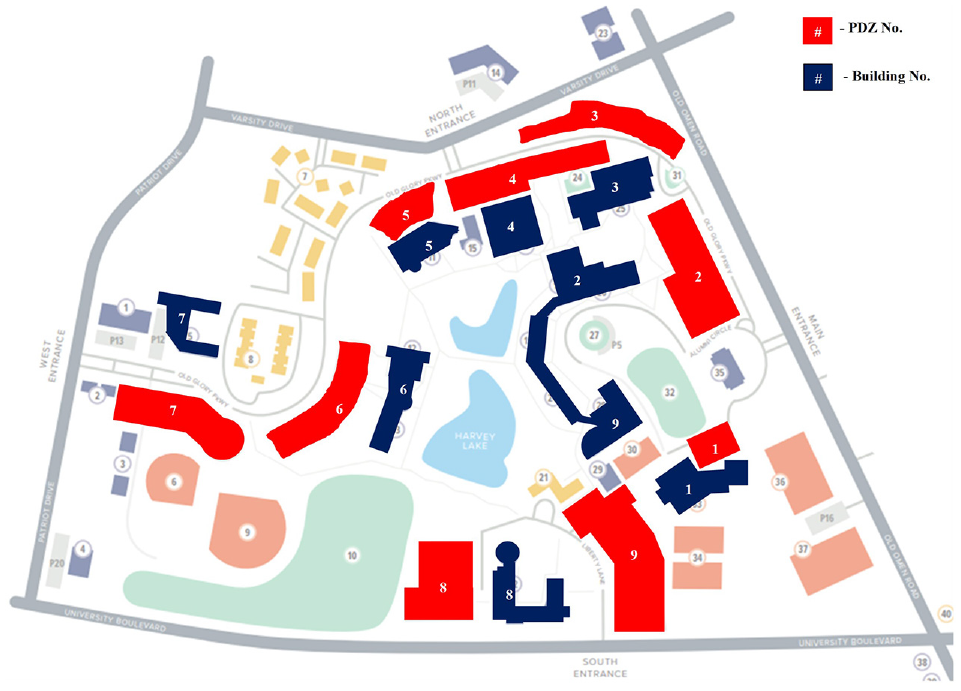
Map of The University of Texas at Tyler campus with parking demand zones (PDZ) ( 28 ).
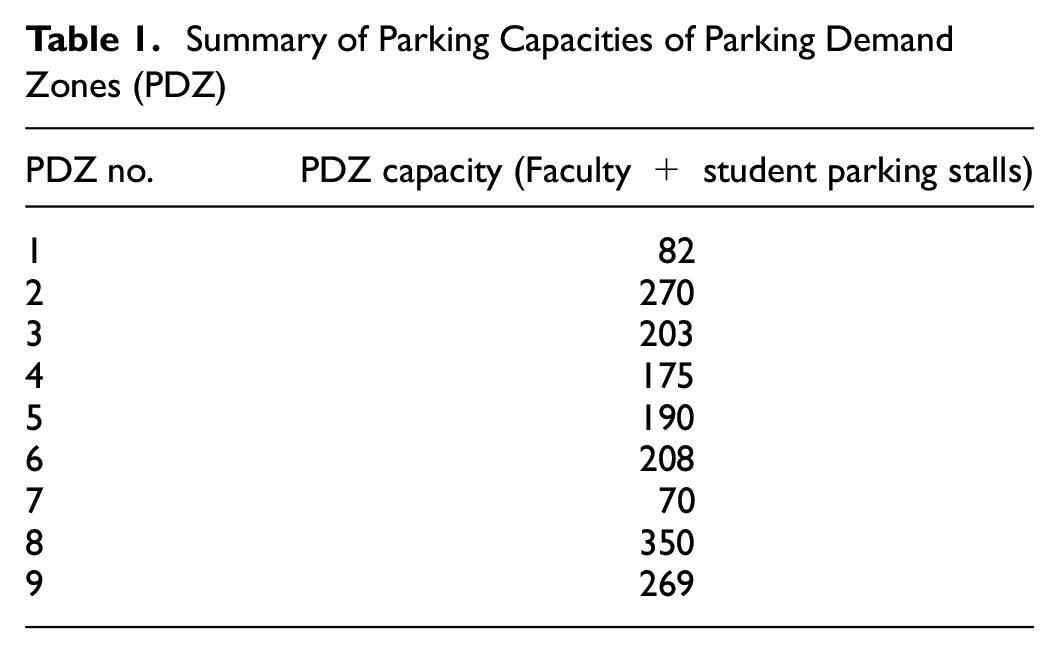
Table 1 presents the capacity of total stalls available in each PDZ. This number includes the total number of student and faculty/staff parking stalls. The number of stalls reserved for persons with a disability was omitted, as that is beyond the scope of this paper. The number of stalls for each PDZ was provided by the UT Tyler Parking and Transportation Division Office.
Summary of Parking Capacities of Parking Demand Zones (PDZ)
The next step was to utilize input parameters that are easily obtained by the end-users (i.e., parking officials, course schedulers, etc.), and parameters that are not unique to one specific university. Furthermore, the trip generation and trip attraction step of the TDM procedure utilizes socioeconomic data and floor space utilization data as inputs to predict the number of trips generated and attracted to each TAZ ( 23 ).
The first four input parameters used are related to the floor space utilization of the nearest buildings adjacent to each PDZ. Intuitively, the larger classrooms, buildings, laboratories, and offices attract more students, faculty, staff, and visitors, and the presence (or absence) of such facilities is unique to each classroom building on a university campus. In addition, it was discovered that the walking time from the PDZ to the nearest classroom was an important characteristic when deciding where to park (
12
,
20
). To generalize the model, the walking time from the centroid of the PDZ to the nearest building may be used. Lastly, the enrollment for each class and laboratory in a building adjacent to a PDZ plays a major role in where students will arrive when they park. Furthermore, it was discovered that most students arrive to campus within one hour of their first class (
12
); therefore, the enrollment at the same hour (i.e., time
Data Description
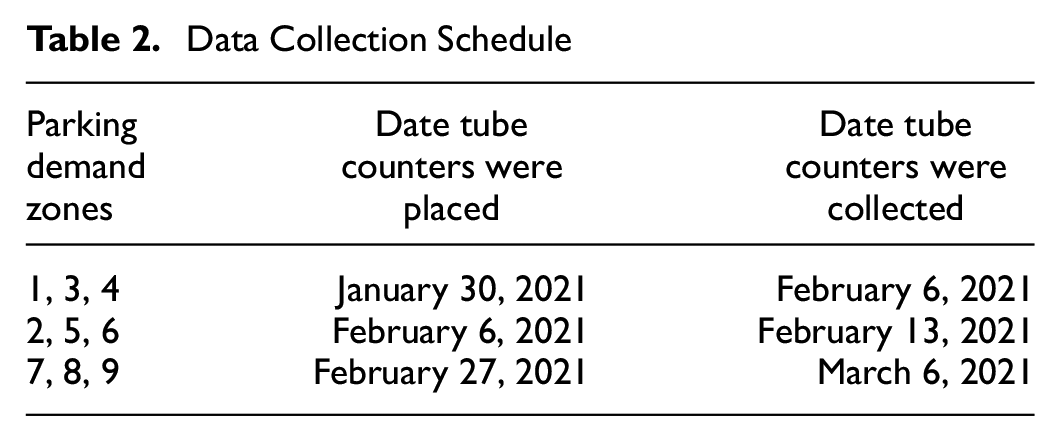
To collect data on arrival demand, pneumatic tube counters were placed at the entrances and exits of each PDZ over the course of a one-week period to determine the hourly demand for each day of the week (i.e., Monday through Friday) originating from and arriving at each PDZ. The data for each PDZ was collected, as presented in Table 2.
Data Collection Schedule
Once the hourly arrivals at each PDZ for each day of the week were collected, the course schedule and floor space utilization data were then extracted for each classroom building presented in Figure 1. The course schedule data was provided by the UT Tyler Office of the Registrar for the Spring 2021 semester, and data on the floor space utilization for each classroom building were provided by the UT Tyler Facilities Management Office. The descriptive statistics for the seven input parameters and the hourly arrival demand are presented in Table 3.
Descriptive Statistics
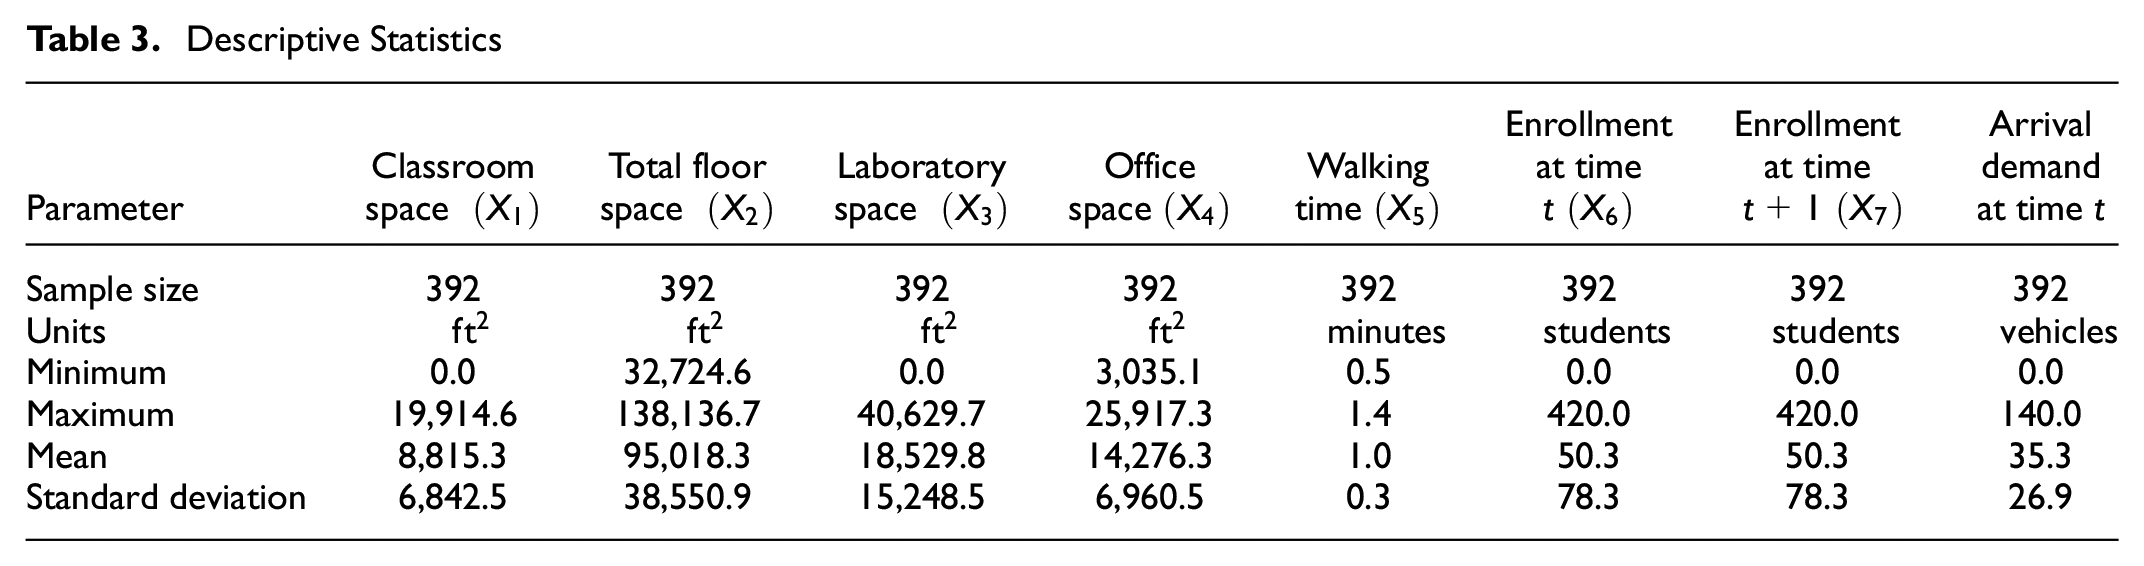
Based on the results presented in Table 3, there were some buildings that did not have classroom space, laboratory space, or both. This means that the building was comprised primarily of office space and/or floor space with different utilization characteristics, which still attracted trips to that particular PDZ. Once the data was processed, the next step was to answer the five research questions.
Results and Discussion
The first research question asked if a simple linear regression model could accurately predict the hourly arrival demand at each PDZ on a university campus. This was chosen since linear regression models are commonly used in the ITE Parking Generation Manual ( 8 ) and the ITE Trip Generation Manual ( 23 ) as part of the trip generation and trip attraction step of the four-step TDM procedure. Typically, only one input parameter is used; however, for this study, all seven input parameters were utilized. The multiple linear regression results from this study are presented in Table 4, where the total data set was divided into a training and test data set using a stratified 85/15 random sampling split. The linear regression model was trained using the training data and tested on the test data set.
Linear Regression Results
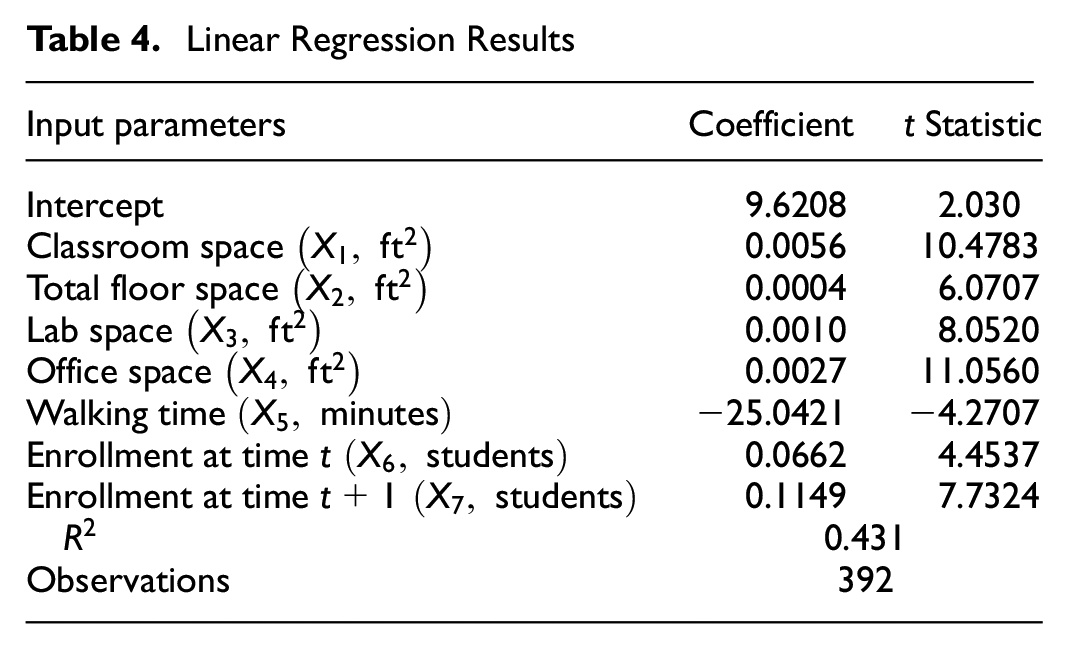
In Table 4, the coefficients are implicitly correct in that all input parameters are positive with the exception of walking time. This makes sense, intuitively, as the larger buildings with more space and higher enrollment should attract more vehicles. On the other hand, the coefficient for walking time is negative, indicating that as the walking time increases, the parking demand decreases, as expected. Although all of the input parameters, including the intercept, are highly statistically significant, the
The second research question asked if a more sophisticated model, such as ANN, could be developed to better predict the hourly arrival demand at each PDZ on a university campus. This research question was asked because of the unsatisfactory results using a simple linear regression model in RQ1. Therefore, for the purpose of this study, a three-layer feed-forward ANN, with the hyperbolic tangent activation function, and Levenberg-Marquardt backpropagation-error calculation algorithm was utilized in MATLAB ( 29 ). MATLAB, by default, randomly separates a data set into a training data set (70%), a validation data set (15%), and a testing data set (15%). We call this ANN a Parking ANN model (PANN). The developed PANN model was trained utilizing the training portion of the extracted 392 data points in MATLAB ( 29 ) by feeding the seven input parameters into the input layer. The training process began by assigning the lowest number of hidden layer neurons (i.e., one), and training the model. Essentially, when an ANN is developed, there needs to be a starting point so that the link weights and bias terms may be adjusted to improve the ANN’s accuracy by reducing the root mean square error (RMSE) ( 24 ). These starting values are generated using the computer’s random number seed generator. Therefore, several attempts were made with only one hidden layer neuron, each time receiving different training, validation, and test data set RMSE results because of the different random number seed starting values. Since the results were not satisfactory using only one hidden layer neuron, several more attempts were made, each time raising the number of hidden layer neurons until satisfactory results were obtained. The idea was that, by using the minimal number of hidden layer neurons, the PANN and stand-alone equation (which will be discussed in a subsequent section as part of RQ4) may be made as simple as possible. This process of ANN development has also been done by Stewart et al. ( 30 ). The final PANN architecture had only seven hidden layer neurons. Figure 2 demonstrates PANN’s architecture, and its main components may be summarized as follows:
Input layer
Weight factors
Hidden layer
Weight factors
Output layer
The PANN model was developed using only the training data. The testing and validation data were unseen to the PANN model. As shown in Figure 3, as an effort to avoid overfitting and maintain network generalization, the training was stopped when the RMSE of the validation dataset stopped decreasing ( 24 , 29 ).
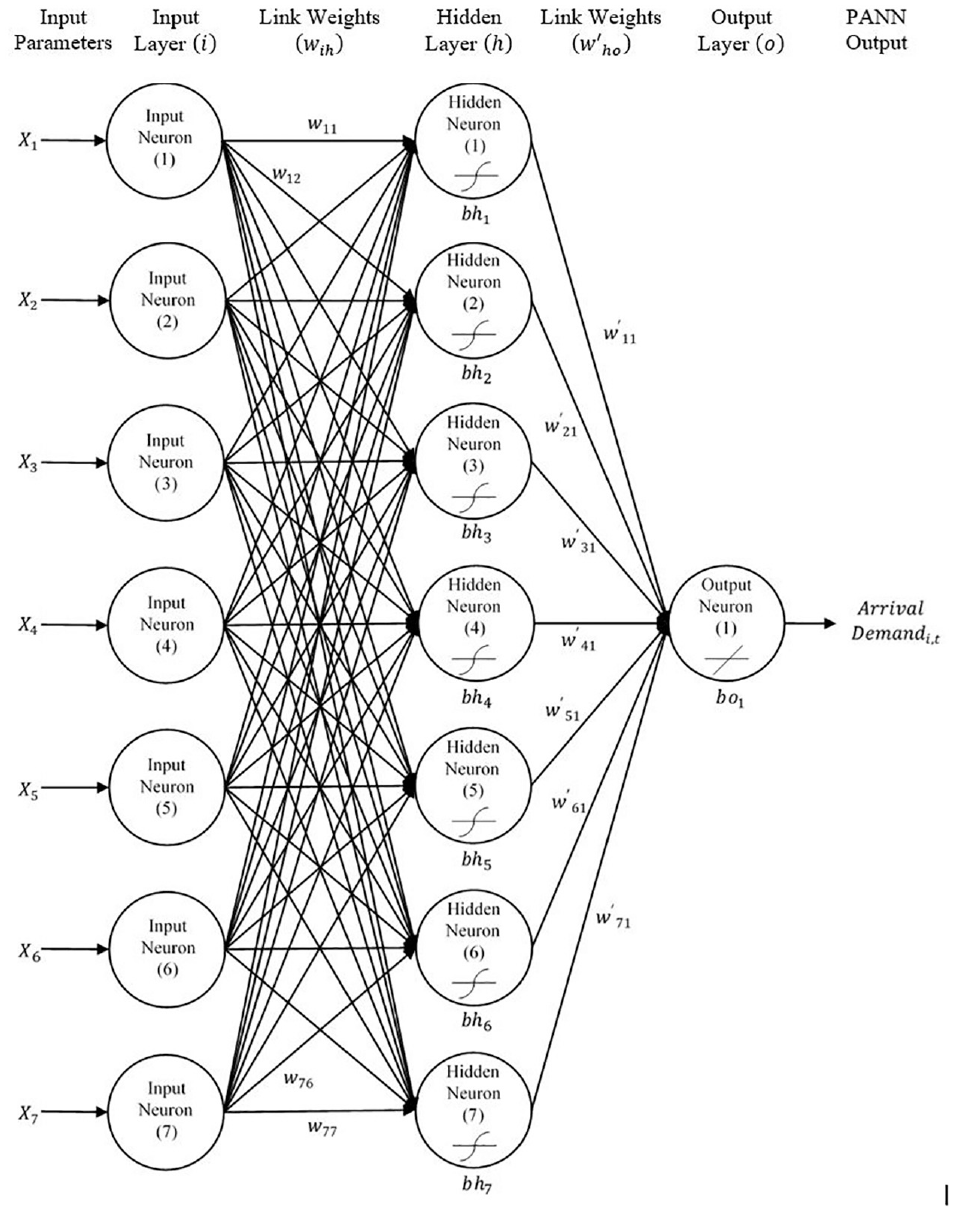
Architecture of Parking Artificial Neural Network (PANN).
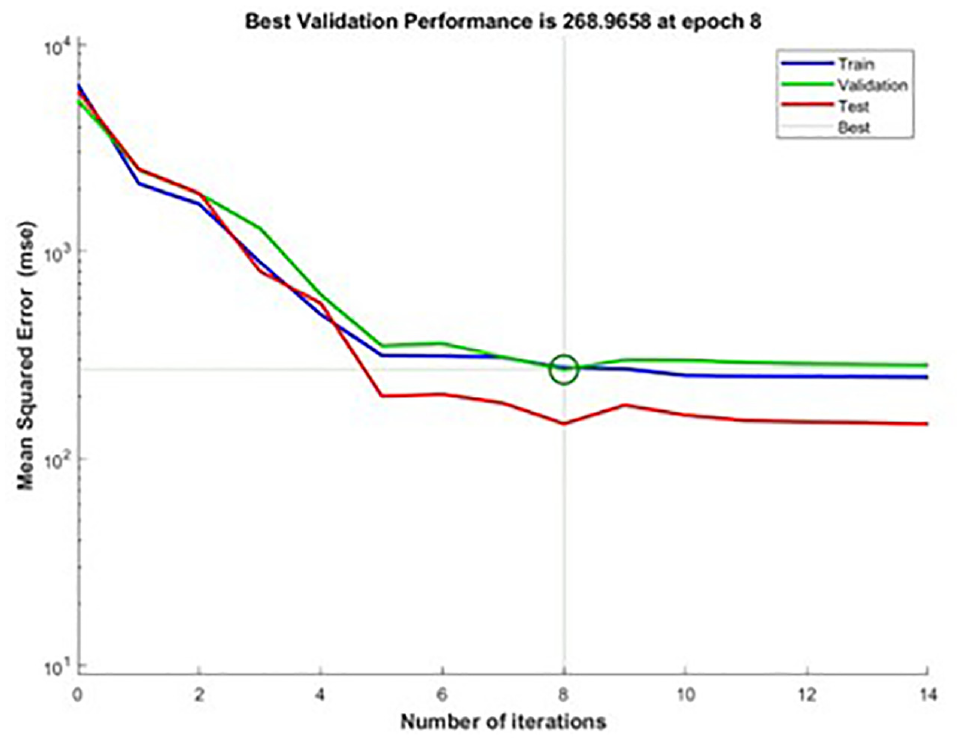
Number of iterations/epochs required for training Parking Artificial Neural Network (PANN).
PANN’s performance, once calibrated, was then evaluated in MATLAB, as presented in Figure 4, which demonstrates PANN’s ability to predict arrival demand.
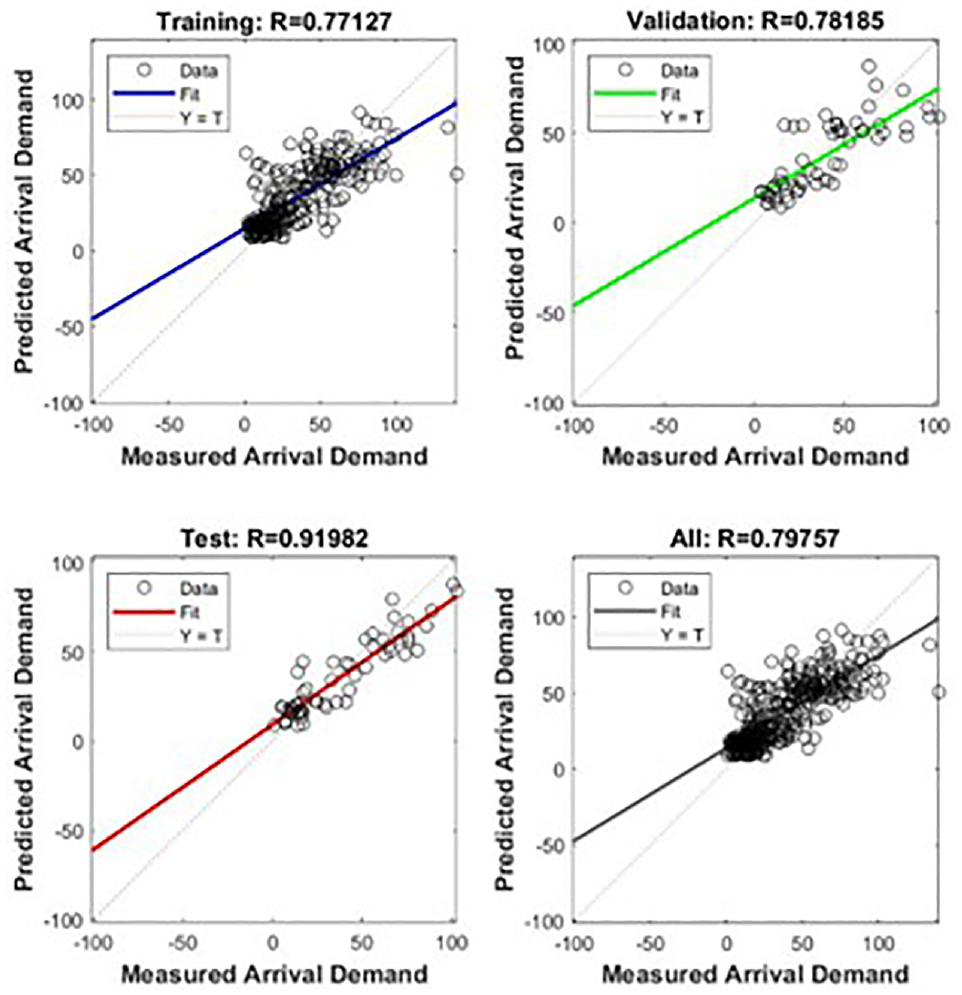
Predicted versus actual hourly parking demand for training, validation, test, and overall data sets using Parking Artificial Neural Network (PANN).
As presented in Figure 4, the test data yielded the highest
The importance of each input parameter in PANN was then analyzed. Table 5 presents the importance of each input parameter.
Importance of Input Parameters for Parking Artificial Neural Network (PANN)
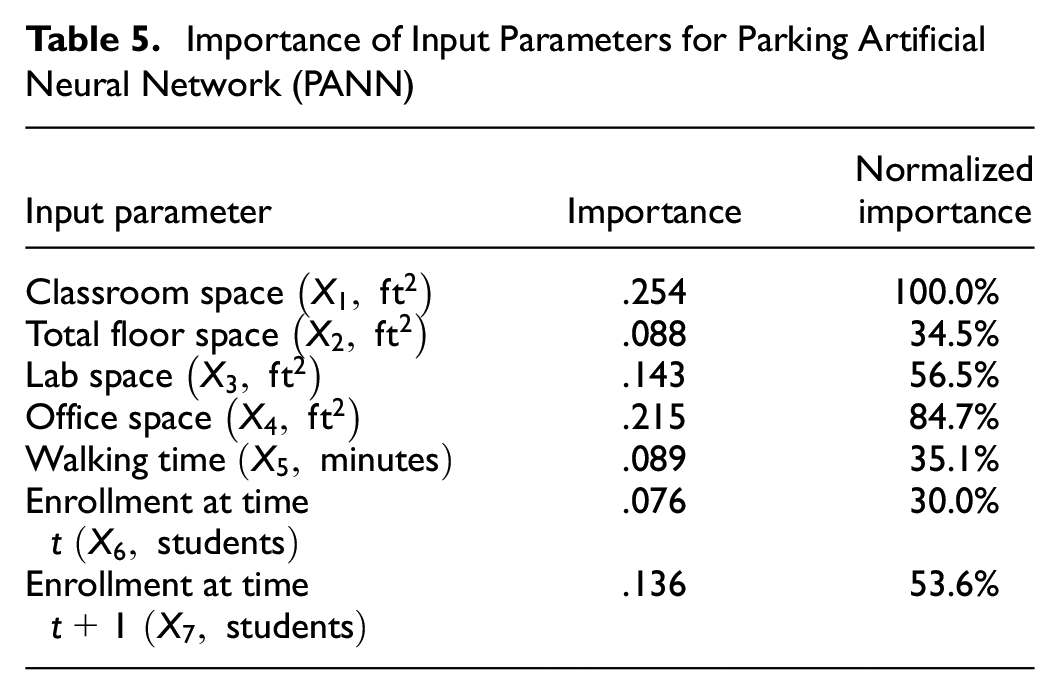
In Table 5, the importance values describe the importance of each input parameter in PANN. Values close to 1.0 are the most important, and values close to 0.0 are the least important (
24
). Therefore, the most important input parameters in PANN are classroom space, office space, lab space, and enrollment at time
The third research question asked if a simplified ANN model could be developed using only the course schedule and achieve similar results to PANN. If so, a university parking office may use the course schedule alone to predict parking demand at each PDZ, without the need to include the floor space utilization and walking time information. Therefore, a new ANN was developed, which only utilizes the course schedule enrollment data (i.e., input parameters
The EANN model was developed similarly to PANN in that the data set was randomly divided into training, validation, and test data sets. Even after utilizing nine hidden layer neurons, the overall
The fourth research question asked which model from the first three research questions most accurately predicts the hourly arrival demand at each PDZ on a university campus, and which equation should be used by course schedulers. To select the best prediction model for hourly parking demand at each PDZ, the
Comparative Results of Three Models Developed
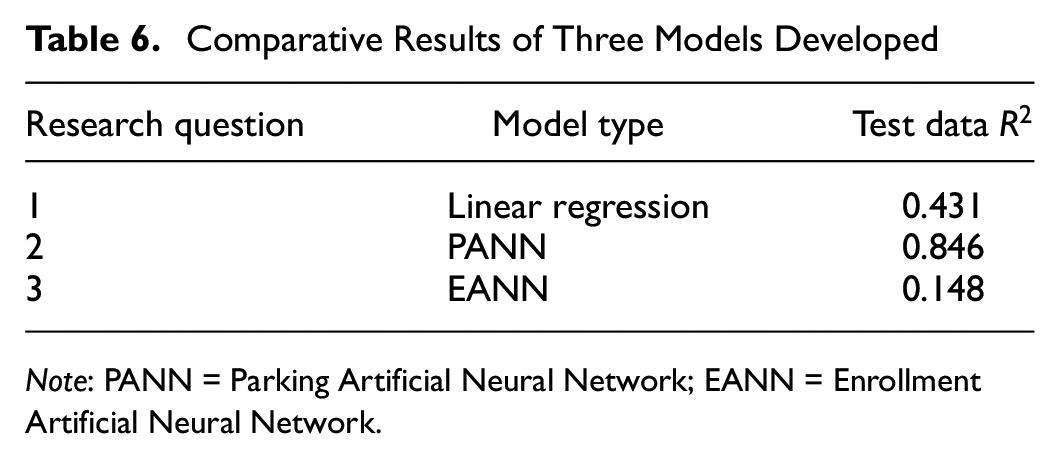
Note: PANN = Parking Artificial Neural Network; EANN = Enrollment Artificial Neural Network.
Based on the comparative evaluation results presented in Table 6, PANN should be used, as it yielded the highest
Essentially, inside PANN, first each input parameter is normalized to fall within the range of [−1,1]. This is recommended for most ANNs developed, so that the link weights and biases do not become very small ( 24 ). Utilizing the minimum and maximum values in Table 3, each input parameter is normalized to fall within the range of [−1,1]. Then, the normalized input parameters are multiplied by the link weights to all seven of the hidden layer neurons. Therefore, each hidden layer neuron has an input of each normalized input parameter multiplied by its respective link weight. The bias for each hidden layer neuron is then added to the equation to obtain one final input value to each hidden layer neuron. Next, the hyperbolic tangent activation function is used to truncate each hidden layer’s output to fall within the range of [−1,1]. Each hidden layer output is then multiplied by its respective weight to the single output neuron. The output neuron receives the output from each hidden layer multiplied by its respective link weight, as well as a bias term. This produces the normalized output, which falls within the range of [−1,1]. This is because the input parameters used also fell within the range of [−1,1] when normalized. The output neuron value is then denormalized, so that it falls within the correct range for the predicted hourly parking demand (see Table 3 for the minimum and maximum ranges).
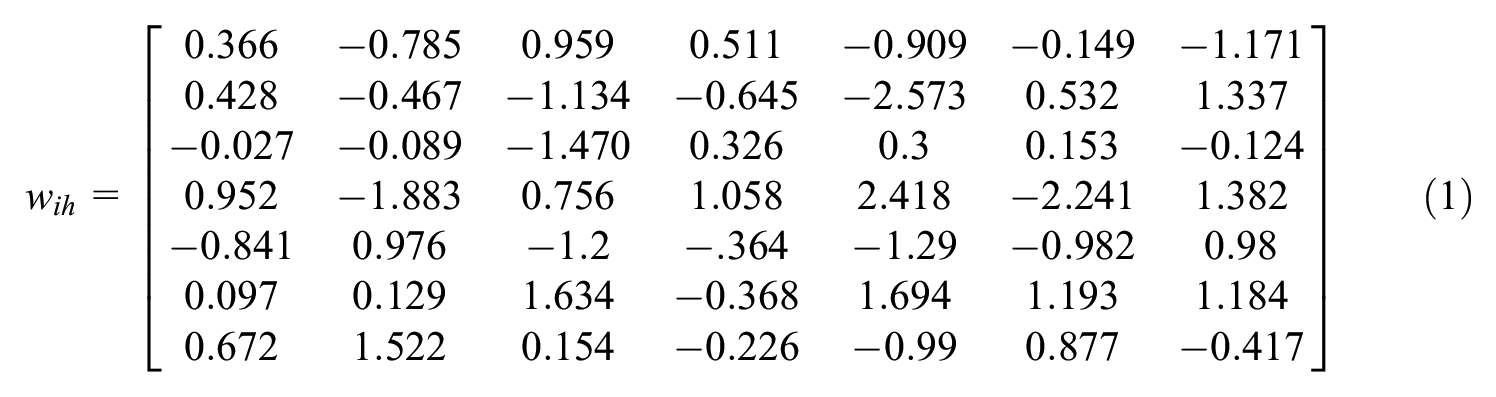
From the utilized PANN structure, as shown in Figure 2, it can be concluded that the weights from the input layer to the hidden layer, the bias values in the hidden layer, the weights from the hidden layer to the output layer, and the bias values in the output layer are needed to extract a stand-alone equation from the trained PANN model. The values of the weights and biases are emphasized below, as extracted from MATLAB ( 29 ).
With seven input layer neurons and seven hidden layer neurons, this yields 49 link weights between the input layer and hidden layer. The optimized link weights
In addition, there is one bias term
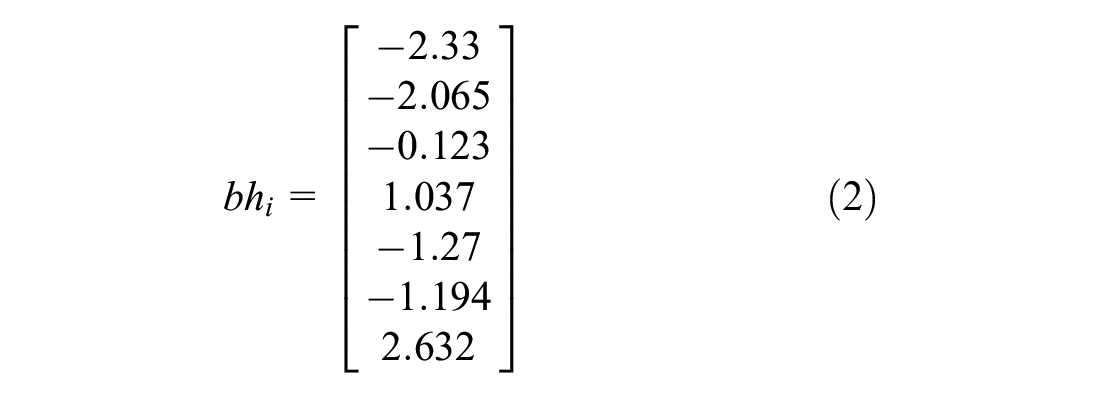
Each hidden layer output is then multiplied by a link weight
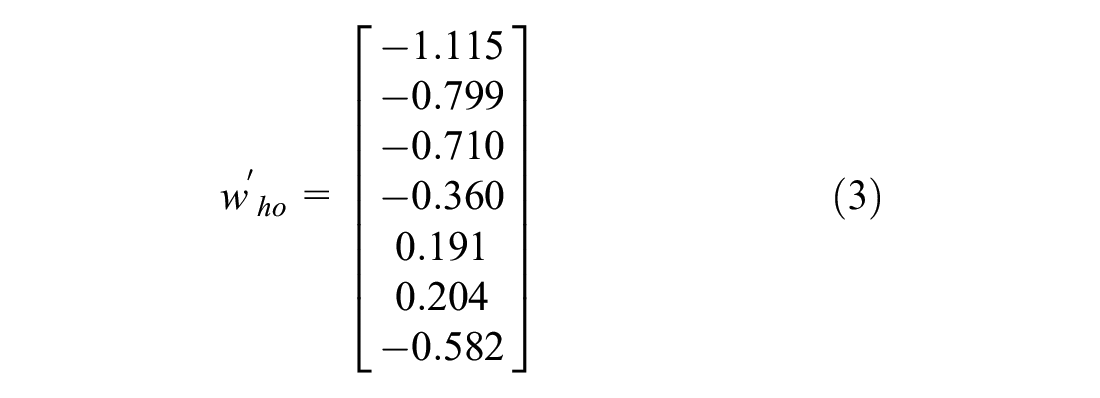
Similar to the hidden layer neurons, a bias term

Based on the optimized link weights and biases presented in Equations 1–4, an equation was extracted, which follows the architecture of PANN and includes the normalization and denormalization processes. The extracted equation computes the same output as PANN and is presented in Equation 5:
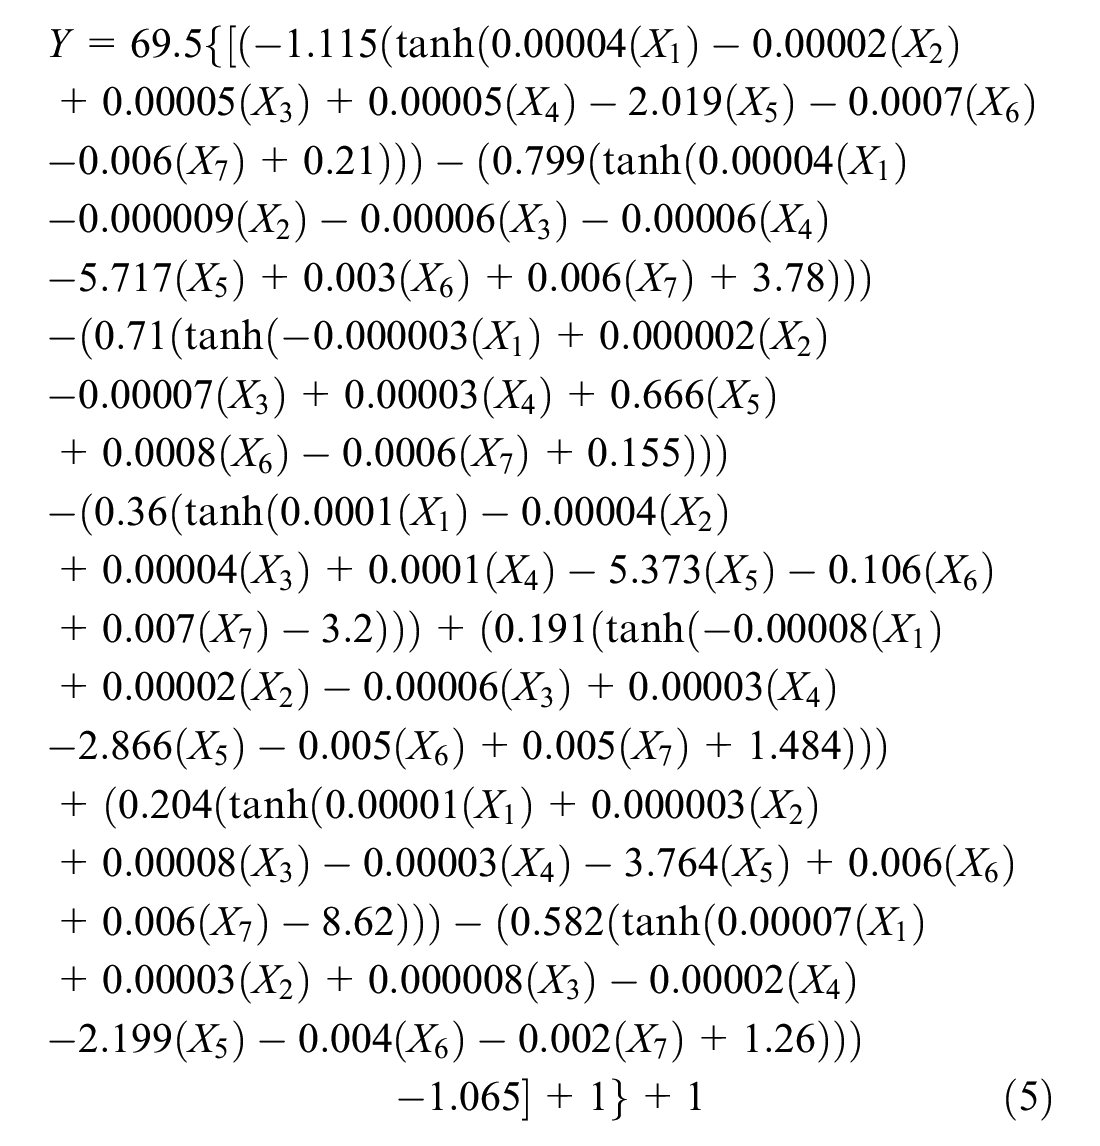
where
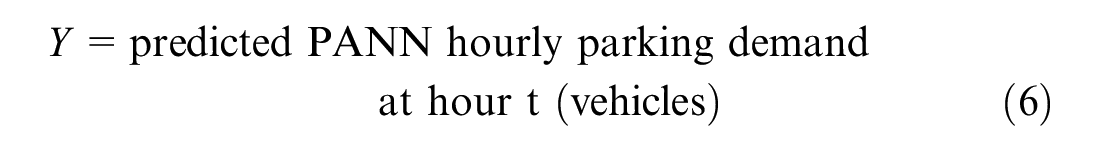
In the extracted Equation 5, the seven hidden layers can be seen along with the hyperbolic transformation functions for each hidden layer neuron. The normalization and denormalization according to the minimum and maximum values of each parameter, as presented in Table 3, are incorporated into the equation. The equation was extracted and developed so that PANN may be used as a tool by university decision-makers and course schedulers outside of the MATLAB environment.
The fifth research question investigated the changes in parking demand at each PDZ on a university campus if a modification were made to the course schedule. To illustrate the power of the extracted Equation 5, first, the peak hourly demand was determined by plotting the cumulative arrival and departure plots for each PDZ and for each day of the week (i.e., Monday through Friday). With nine PDZs and for five days of the week, this yielded 45 different cumulative plots. The idea was that the largest gap between the cumulative arrival and departure curves would indicate the peak demand and at what hour that peak demand occurred for each PDZ and for each day of the week. The peak demand was then compared with the capacity of each PDZ (see Table 1) to determine if the PDZ was over capacity. If so, university course schedulers could then relocate one or more of the courses listed for the adjacent classroom building to another classroom building where the PDZ has capacity. An example of one of the 45 plots developed is presented in Figure 5.
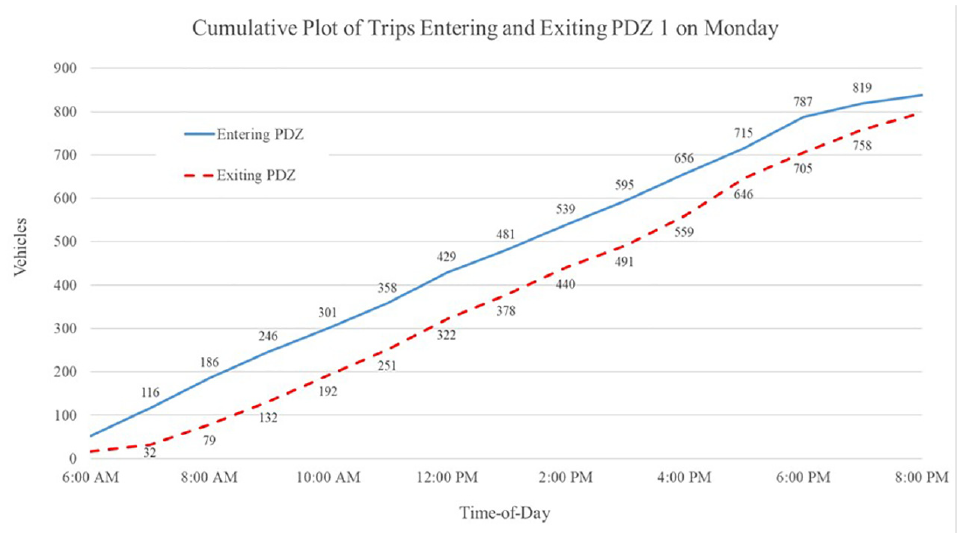
Cumulative arrival and departure rates for PDZ 1 on Monday.
Not every PDZ had a parking issue where the demand exceeded capacity. For the PDZs where the demand did exceed the capacity, this indicates that there is a parking issue. All of the PDZs that had a parking issue where the peak demand was greater than the capacity are presented in Table 7. In Table 7, Net Demand is the net difference between the peak hour demand and capacity. This may be viewed as the number of vehicles that are searching for a stall in that PDZ during that time period. Furthermore, for the “worst case scenarios” presented in Table 7, the actual demand at that peak hour is compared with the prediction made by the extracted Equation 5, and the prediction for these worst case scenarios is fairly similar to the actual demand.
Summary of Parking Demand Zones (PDZs) with Parking Demand Greater than Capacity
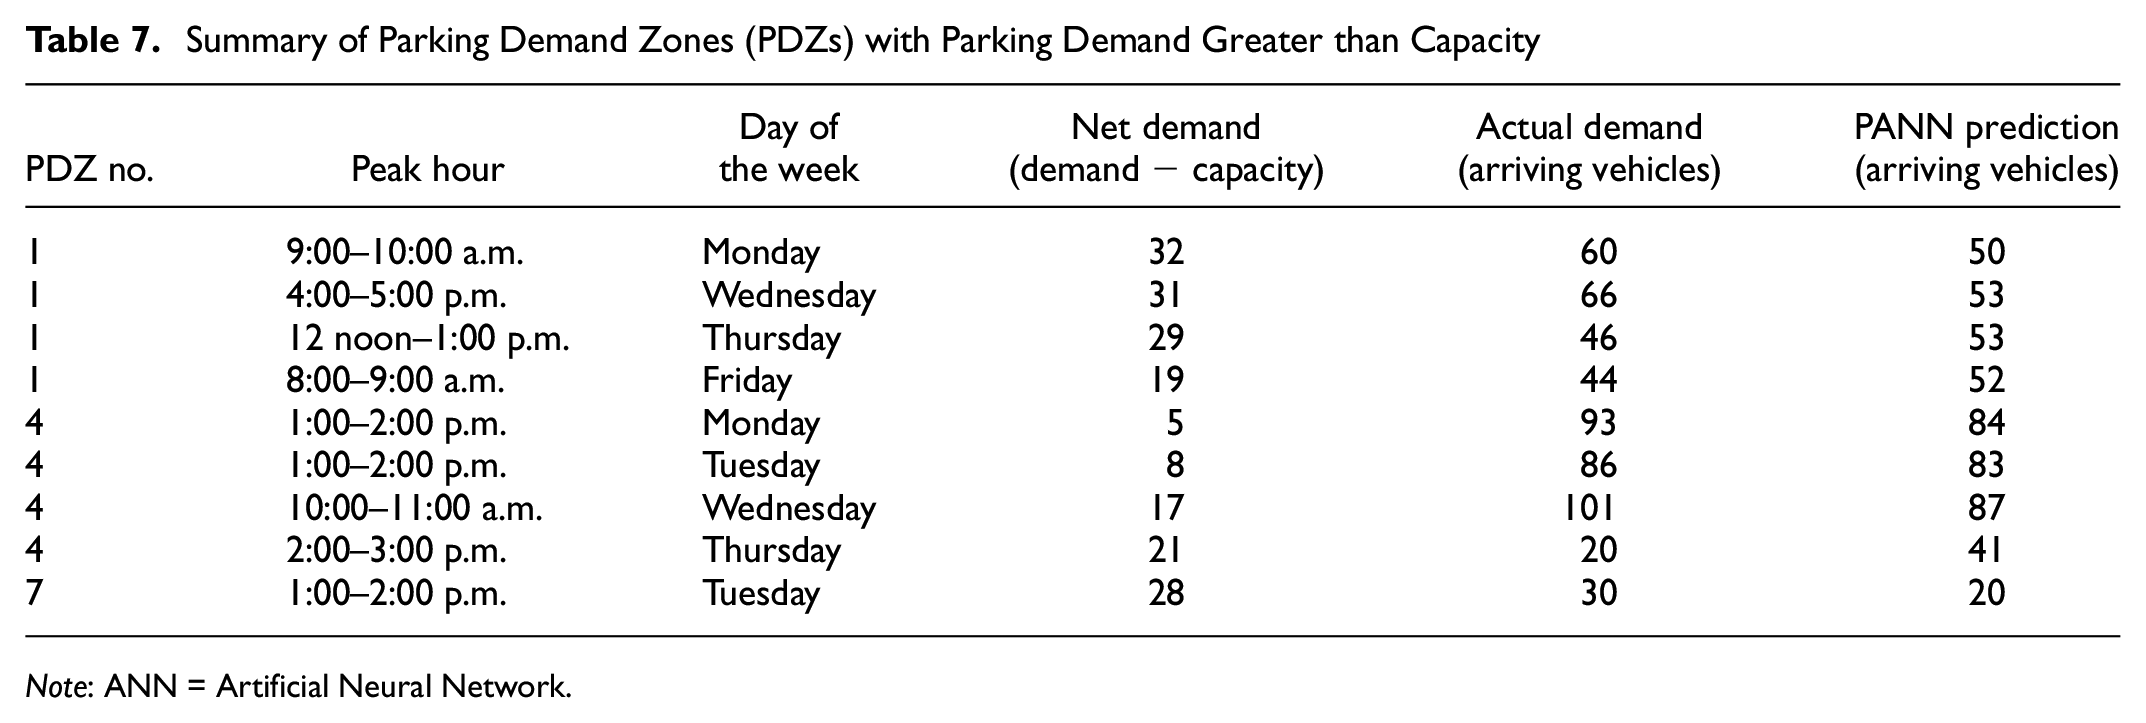
Note: ANN = Artificial Neural Network.
The results from Table 7 further illustrate that the parking issues are located at PDZs 1 and 4 for four out of five days of the week, and at PDZ 7 for one day of the week. PDZ 1 is located near the center of campus and is adjacent to multipurpose buildings, which house classrooms, a gymnasium, and a cafeteria. PDZ 4 is adjacent to the engineering buildings, which have large amounts of floor space, classroom space, laboratory space, and office space, in addition to the many classes scheduled. PDZ 7 is only closely adjacent to one classroom building; however, it is also very close to the baseball and softball fields, which could explain the parking issue for that PDZ.
To determine the power of the extracted equation, a change to the course schedule is made, and the extracted Equation 5 is utilized to predict the before-and-after arrival demands. For one of the scenarios listed in Table 7, PDZ 4 on a Wednesday had a demand that exceeded the capacity by 17 vehicles from 10:00 to 11:00 a.m. One course from the course schedule, which had an enrollment of 19 students, was relocated to PDZ 8 where there was sufficient capacity on the same day and at the same time. As expected, this resulted in a decrease in demand at PDZ 4. The demand in both PDZs before and after the relocation of the course is presented in Table 8.
Effects of Altering Course Schedule on Parking Demand
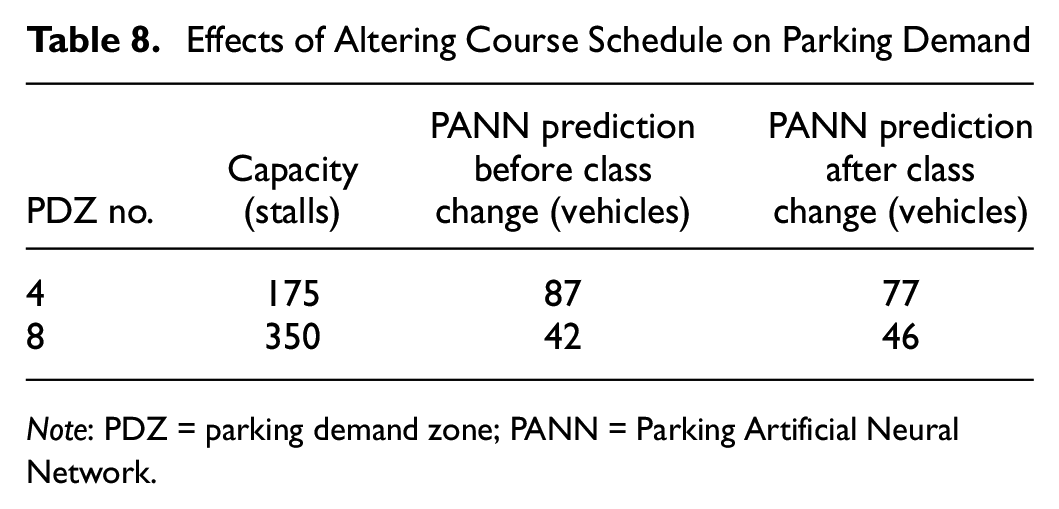
Note: PDZ = parking demand zone; PANN = Parking Artificial Neural Network.
From Table 8, we can observe that a minor alteration in the course schedule reduced the arrival demand of students in PDZ 4 by 10. This means that 10 vehicles that would normally arrive at PDZ 4 now arrived at PDZ 8 instead, where there was more capacity. More changes to the course schedule could be made to ensure that all PDZs remain under capacity. This would thus optimize the course schedule to ensure the most efficient use of the existing parking facilities without the need to develop more parking infrastructure.
Conclusions
Major Findings and Recommendations
Parking has been an issue at universities for decades, and with limited funds, space, and capacity, universities are looking for better ways to utilize their existing parking facilities. The course schedule is one of the primary factors in determining where students, faculty, staff, and visitors will park on a university campus. Other important factors include the floor space utilization of each building on campus as well as the walking time from the PDZs to the buildings.
This research has made use of the course schedule, walking time, and floor space utilization information to predict the hourly parking demand at each PDZ on a university campus by answering the five research questions. For this paper, the UT Tyler main campus was used as a case study. By following the trip generation and trip attraction step of the TDM four-step procedure, a linear regression model was developed, which had unsatisfactory results. Two ANN models were developed: PANN and EANN. PANN is recommended because of its higher
Future Research
One of the main limitations of this research is that the extracted equation was developed using data collected only from UT Tyler. The use of the extracted equation has not yet been tested on other universities. The research team plans to test the extracted equation presented in this paper on other universities to determine its accuracy as part of future research.
The research team is also concurrently studying how changes to the university course schedule affect the distribution of interzonal trips within a university campus ( 31 ). Changes to the course schedule will affect the arrival demand at each PDZ, as presented in this paper; however, the same changes will also affect the interzonal trips on a university campus, which could cause congestion within the campus.
Footnotes
Acknowledgements
This research is funded by an internal grant from The Office of Research, Scholarship, and Sponsored Programs at The University of Texas at Tyler (UT Tyler). The authors would like to thank the UT Tyler Office of the Registrar for providing the course schedule data as well as the UT Tyler Facilities Management Office for providing the floor space utilization data for each classroom building on campus.
Author Contributions
The authors confirm contribution to the paper as follows: study conception and design: S. Paudel, M. Vechione, O. Gurbuz; data collection: S. Paudel; analysis and interpretation of results: S. Paudel, M. Vechione; draft manuscript preparation: S. Paudel, M. Vechione, O. Gurbuz. All authors reviewed the results and approved the final version of the manuscript.
Declaration of Conflicting Interests
The author(s) declared no potential conflicts of interest with respect to the research, authorship, and/or publication of this article.
Funding
The author(s) disclosed receipt of the following financial support for the research, authorship, and/or publication of this article: This research is funded by an internal grant from The Office of Research, Scholarship, and Sponsored Programs at The University of Texas at Tyler.