
Abstract
The international community has been actively addressing the issue of reducing carbon dioxide (CO2) emissions, as evidenced by various initiatives such as Rio 92, Rio +20, the Paris Agreement, and the 2030 Agenda. These endeavors aim to promote sustainability worldwide. While air transport accounts for only 2% of anthropogenic CO2 emissions, its projected growth has spurred the exploration of new technologies to enhance aircraft efficiency. Consequently, further studies are necessary to assess the efficiency and impact of air transport on CO2 emissions in most countries. A methodology utilizing data envelopment analysis (DEA) is proposed in this study for this purpose. This methodology correlates the structure and annual air movement of 21 countries with CO2 production, considering it an undesirable output. The clustering method establishes the relationship between DEA efficiency, the number of airports, air traffic movements (landings and take-offs), and annual economic factors such as gross domestic product in these countries. Additionally, a regression analysis is conducted to examine the influence of air transport on CO2 emissions from transport systems. The findings reveal that the U.S. and China exhibit low efficiency as outliers because of their significant economic disparities. Other countries are grouped based on economic similarities, with South American nations such as Colombia and Chile showing lower air traffic movement efficiency compared with economically powerful European countries such as the UK and Germany. However, the impact of air transportation variables on CO2 emissions remains substantial.
With an annual growth rate of 5%, the global aviation industry not only generates more than 87 million jobs and accounts for 3.5% of the global gross domestic product, having considerable importance for the economic development of a country, but also plays an important role in climate change ( 1 , 2 ).
Pollutant emission from burning fuel by aircraft contributes to the greenhouse effect and climate change, and affects the environment and human health by deteriorating air quality ( 3 ). In 2019, civil aviation emitted about 915 million tons of CO2, equivalent to a little over 2% of all carbon emissions generated by human activities ( 1 ).
The highest growth rates of demand for air transport—and associated CO2 emissions—have been especially noted in developing countries. If no measures are taken to mitigate CO2 emissions in the global aviation sector, emissions will be almost six times the current amount in 2050 ( 4 – 6 ).
Considering this, several initiatives have been adopted to reduce environmental impacts in major global economies. It stems from the achievement of milestones such as Rio 92 and Rio+20, which stipulated the reduction of total CO2 emissions in all sectors of participating countries (such as transportation, industry, etc.). Additionally, the creation of the 2030 Agenda identified 17 sustainable development goals (SDGs), which established the Carbon Offsetting and Reduction Scheme for International Aviation (CORSIA) to control and reduce sector-specific emissions in the aviation industry.
Given the focus on environmental issues and the efforts to generate sustainable development, studies that address CO2 emissions are of great importance for the airline industry. Thus, this work seeks to measure the efficiency of the air transport sector in CO2 emissions in different countries.
In this context, this work sought to measure air transport relative operational and environmental efficiency in different countries with regard to CO2 emissions from transportation systems, operational aspects, and economic variables. Thus, data envelopment analysis (DEA) and the clustering and regression methods were applied to establish the grouping of the countries analyzed by ranking the relative environmental efficiency of air transport and to identify the correlation with the input data used.
Atmospheric Emissions in Air Transport
In 2019, civil aviation emitted about 915 million tons of CO2, equivalent to just over 2% of all carbon emissions generated by human activities ( 1 ). The study of sustainability in air transportation is a growing field as there are factors that contribute to environmental impact. For example, there is a trend toward increased pollutant emissions as air transportation becomes more widely used. The International Civil Aviation Organization (ICAO) estimated that air transportation emissions would approximately triple between 2019 and 2050, worldwide.
The highest growth rates in demand for air transport—and associated CO2 emissions—have been especially observed in developing countries. Consequently, the environmental impacts of the airline industry will continue to grow if there are no significant technological and operational changes ( 4 , 5 , 7 ).
The main aviation emissions are carbon dioxide (CO2), nitrogen oxides (NOx), sulfur oxides (SOx), carbon monoxide (CO), water vapor, and aerosols (dust). The emission of these gases is associated with the trapping of infrared rays, raising the greenhouse effect and, consequently, the earth surface temperature ( 8 ).
Even though aircraft do not release ozone (O3), NOx emission promotes the formation of this gas, increasing the greenhouse effect ( 8 ). CO2 is the main greenhouse gas generated by air transport, since the emissions of this gas are much higher in volume when compared with other emitted and formed gases ( 4 ).
Among the consequences of climate change is the more frequent incidence of extreme events, such as heatwaves, droughts, intense precipitation, flooding, forest fires, rising sea levels, and melting glaciers ( 9 ). These factors increase the risk of extinction of some species, modify ecosystems, and damage human food sources and water quality ( 10 ).
Efforts are underway to safeguard the environment through integrated measures in global aviation management. ICAO launched the Long-Term Global Aspirational Goal (LTAG) in 2022, aiming to address climate change by reducing emissions from international civil aviation ( 11 ). The resolution emphasizes the importance of leadership in curbing aviation emissions without hindering air transport growth, especially in developing economies. Furthermore, it sets global targets for improving fuel efficiency and encourages collaboration among states and organizations to achieve these goals. ICAO’s environmental initiatives align with multiple SDGs, including combating climate change, and promoting sustainable infrastructure, clean energy, and responsible consumption and production.
Policies and business decisions are essential for reducing CO2 emissions in the aviation industry. While some may not have a direct focus on limiting CO2, they can still indirectly affect emissions by offsetting the projected outcomes of emission reduction policies. Factors such as aircraft and network carrier management, as well as liberalization in the EU market, can influence CO2 emissions in air travel. For example, the liberalization in Europe that led to the development of low-cost carriers has had the collateral effect of reducing the CO2 externality per passenger ( 12 ). These factors highlight the need for a comprehensive approach considering both direct and indirect influences on emissions.
The impact of aviation emissions on climate change cannot be understated. Addressing these emissions is of utmost importance to mitigate the environmental consequences. It is crucial to recognize that various policies and business decisions can potentially influence CO2 emissions in air travel ( 13 ). By understanding these factors, stakeholders in the aviation industry can make informed decisions to minimize the carbon footprint associated with air transportation. It requires a collaborative effort involving governments, organizations, and industry players to implement effective strategies and initiatives.
In conclusion, government authorities have a vital role in promoting sustainable development within the air transportation sector. They can utilize performance evaluation measures to assess the effectiveness of policies and initiatives to reduce CO2 emissions. By monitoring and analyzing the outcomes, authorities can strategize and adjust their approaches to ensure progress toward sustainable aviation. Additionally, governments can incentivize the adoption of cleaner technologies and sustainable practices, facilitate international collaborations, and support research and development in the aviation industry. Through these actions, government authorities can contribute to a greener and more environmentally responsible future for air travel.
Data Envelopment Analysis (DEA)
DEA is a technique used to measure productivity in business units. It is based on linear programming and identifies the most efficient units in a sample, not finding absolute efficiency, but comparing productive units among themselves and ordering them, considering the inputs used and products generated ( 14 – 18 ). The systems that present a set of inputs and outputs are called decision-making units (DMUs), in which the DMU is the unit belonging to the group in which the production efficiency will be evaluated ( 19 ). Among the techniques used to assess the efficiency of each DMU is DEA, a non-parametric technique from which an efficiency frontier is established, comparing the relative performance with the other DMUs of the set analyzed ( 15 ). The efficiency frontier established by the DEA technique defines which DMUs are efficient within the analyzed set. The efficient ones are represented by the number 1, while the inefficient or less efficient ones are different from 1 ( 19 ). The efficient DMUs are represented by points in the maximum productivity curve, while the inefficient ones are below the frontier. DEA presents more than one model of relative efficiency to be chosen according to the reality of the system to be studied ( 20 ).
The BCC (Banker, Charnes e Cooper) model established the hypothesis of variable returns to scale, and the frontier presents a convex shape, formed by a set of straight lines with different angulations ( 21 ).
The convex frontier allows DMUs with low input values to generate increasing returns to scale, and those with high input values of to bring decreasing returns. In addition, the model can also be both input and output oriented ( 19 , 22 ).
The efficiencies obtained by the BCC method may need tie-breaking criteria for DMUs with similar efficiencies. It has a weighted methodology that generates a relative efficiency (EfSAVAGE) with the model’s standard benchmark frontier (Fo), with its result inverted (inverted frontier, Fp, with inputs and outputs inverse to the classical model), where the weights are assigned to each efficiency; optimality coefficients (α) will define a composite efficiency described by Equation 1 ( 23 ).

Methodology
The research was developed according to the following steps. First, the data were collected, then the DEA and the exploratory data analysis (correlation matrix, principal component analysis [PCA], and clustering) were performed and, finally, the regression was applied.
Data Gathering
For this research, the countries selected belonged to the BRICS economic groups (Brazil, Russia, India, China, and South Africa), G-8 (U.S., Japan, Germany, UK, France, Italy, and Canada) and the countries from South America—the continental region where Brazil is located—except Uruguay, Guyana, and Venezuela, because of lack of data. Besides these groups, Australia, the most developed country in Oceania, was also included, so every continent had countries included in the analysis.
The countries under analysis serve as DMUs in the tested DEA models, which provide insights into the specific environmental efficiency of the national aviation sector. Despite variations in internal air regulation policies across these countries, the interplay between available infrastructure, local socioeconomic factors, and annual movement (measured as both cargo and passengers) alongside observed emissions suggest similarities among the selected countries. This similarity allows a comparison and hierarchical ranking of these countries based on their environmental efficiency.
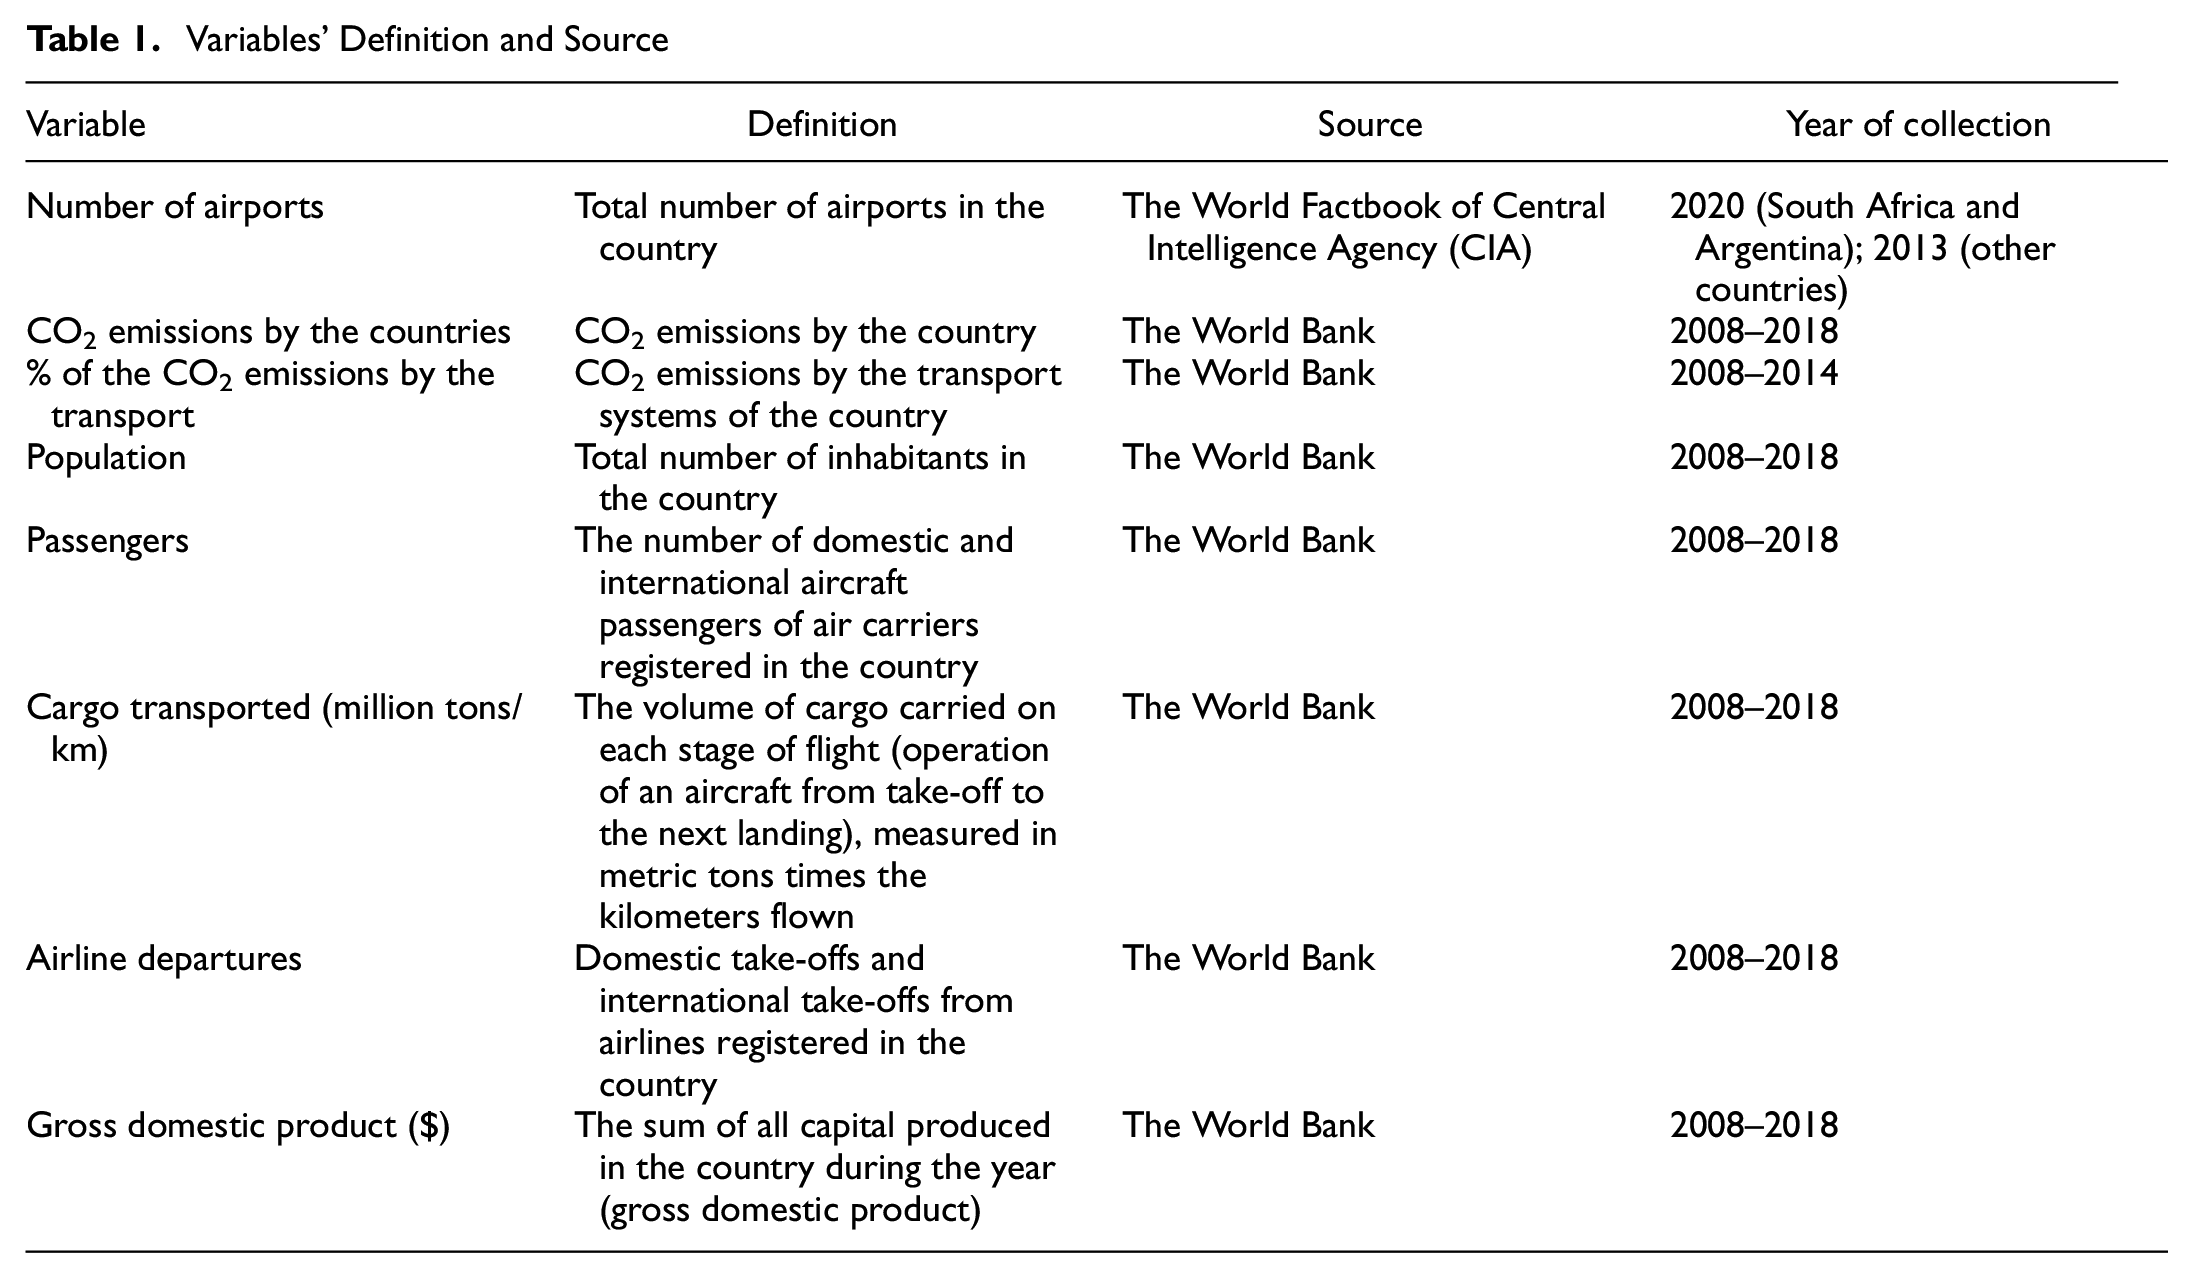
The number of airports and population were chosen as input variables. CO2 emission from transportation (percentage to total fuel combustion) was considered an undesirable output. However, the number of passengers, cargo transported, carrier departures, and gross domestic product (GDP) were used as output variables. The data was collected from the World Bank database and the Central Intelligence Agency (CIA) database. They covered the data from 2008 to 2019 for most countries, except for Argentina and South Africa, where the data for airports was from 2020, while for others, data were from 2013. These were the most recent data available because the number of airports in a country did not change much over the years analyzed.
The selected variables were carefully chosen based on their representativeness for the theme under study. The objective was to portray the prevailing infrastructure conditions and socioeconomic aspects such as population and GDP, as well as the specific annual trends of each country. Furthermore, the emissions reduction targets primarily target countries rather than airlines directly. Therefore, we intend to examine the capacity of countries as regulators of civil aviation transportation to implement policies that encourage the adoption of more efficient fleets, alternative biofuels, and other reduction measures. These efforts fall within the scope of national policies, which have the potential to influence and drive sustainable practices within the aviation industry as a whole. Table 1 summarizes all the variables used in the study, their definition, source, and the collection year.
Variables’ Definition and Source
The results were obtained from the MaxDEA software, using the output-oriented BCC model, and DEA, which aimed to maximize the results obtained, with the DMUs represented by the countries under analysis ( 24 ).
Exploratory Data Analysis
Knowing that the data on CO2 emissions were related to all modes of transport, we decided to establish an exploratory data analysis to verify the influence of air transport. Thus, a correlation matrix was produced with all the variables. Then, an analysis was conducted using the primary components, focusing solely on variables related to air transport, such as passengers, aircraft movements, and air cargo. Using the principal component that contained the most significant information about the phenomenon, a regression was performed. The dependent variable in the regression was CO2 emissions, while the independent variables included the principal component 1 (representing approximately 95% of all air transport variables), GDP, and population. PCA was used to extract the most informative component among the four variables collected from air transport. PCA was applied to this study for the absence of any decision related to group structure ( 25 ). The PCA method can explain the variance structure of a data matrix by linear combinations of its variables, consequently reducing the variables to a few key components usually responsible for describing 80%–90% of the variance in the data. If most of the variance in a population can be attributed to the principal components, they could replace the original variables without much loss of information ( 25 ).
The linear regression was used to verify the influence of air transport on CO2 emissions, ( 26 – 30 ). The dependent variable is CO2 emissions, and the independent variables are GDP, population, and the main component. It was applied the Gretl software (2019) to process the data.
Cluster
A cluster analysis was performed using the non-hierarchical K-means method, where the data is partitioned into K clusters so that the sum of the squares of the points at the centers of the assigned clusters is minimized. The method also involves choosing the number of clusters that will be formed ( 31 ). The R-Studio software was used for the cluster analysis. Clustering aims to analyze whether countries of similar efficiency groups were grouped in the same cluster.
The variables used for the model were: 1) efficiency obtained by DEA in the BCC method, 2) CO2 emissions concerning transport, and 3) number of registered aircraft movements of the 21 countries under study. Variables 1 and 2 were selected to represent the scenario of CO2 emission of transport, and variable 3 to represent the action of air transport on CO2 emission. Concerning the period of the data, the data from 2008 and 2018 were used to represent the initial situation and the final situation of the countries during the period analyzed.
Analysis and Discussion of the Results
Emissions Estimation
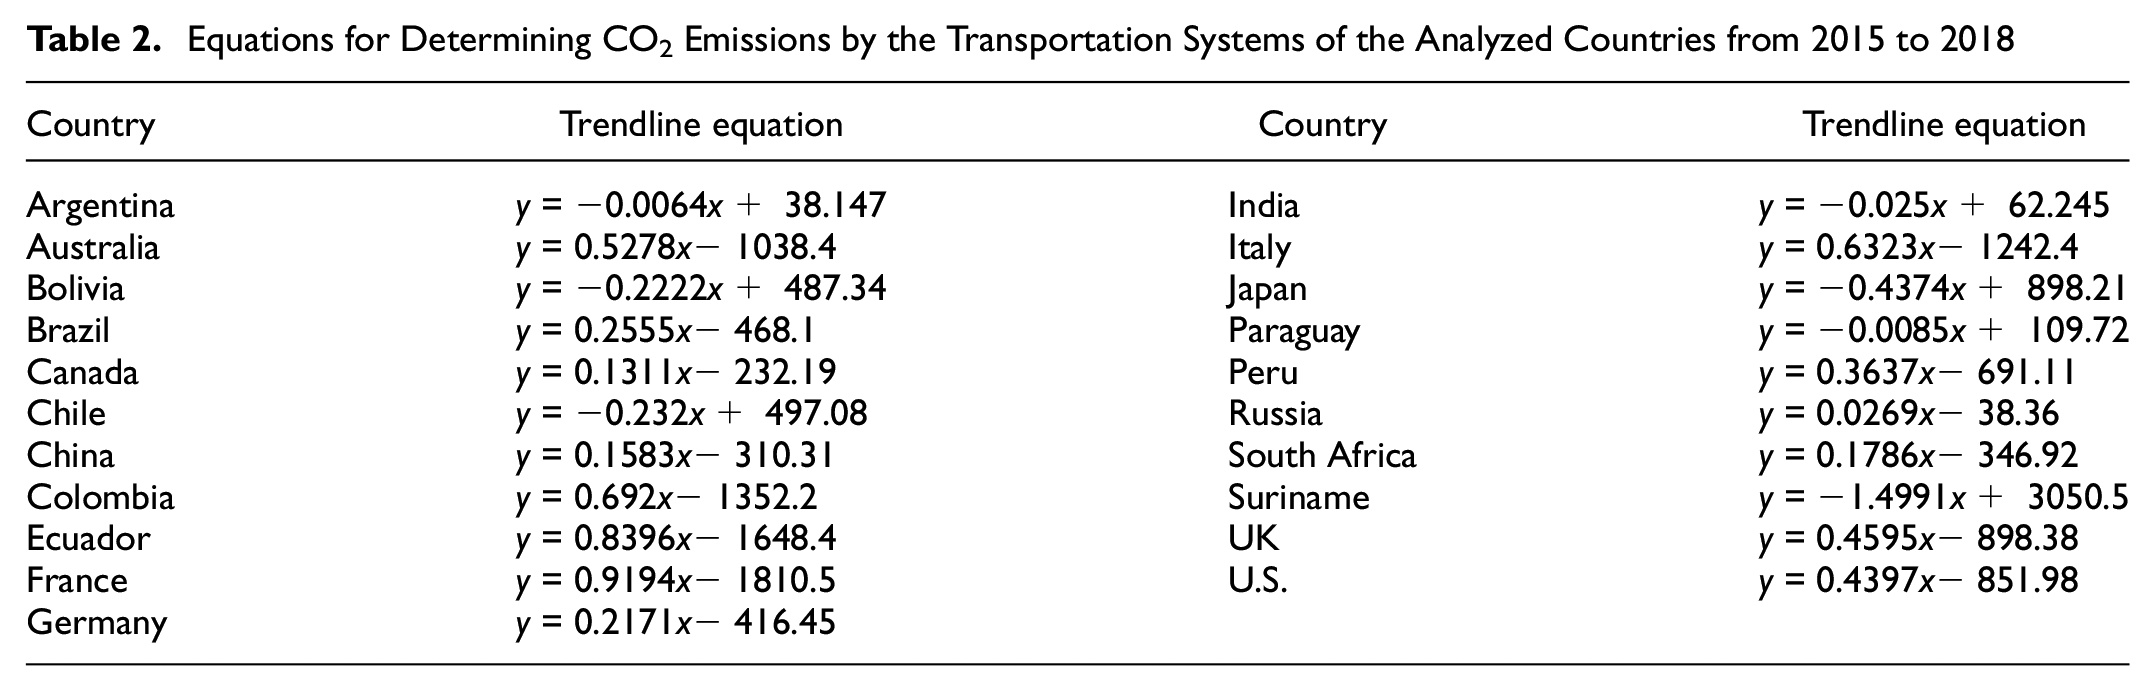
As the World Bank does not present data on CO2 emissions for the countries’ transport systems (only the percentages of the total system emissions up to 2014 were presented) the estimates for the percentages from 2015 to 2018 were calculated with the extension of the trend line of the known data.
Table 2 presents the future trend line equations for the 21 countries analyzed. Figure 1 presents the trend lines formed with data from China, France, and Italy.
Equations for Determining CO2 Emissions by the Transportation Systems of the Analyzed Countries from 2015 to 2018
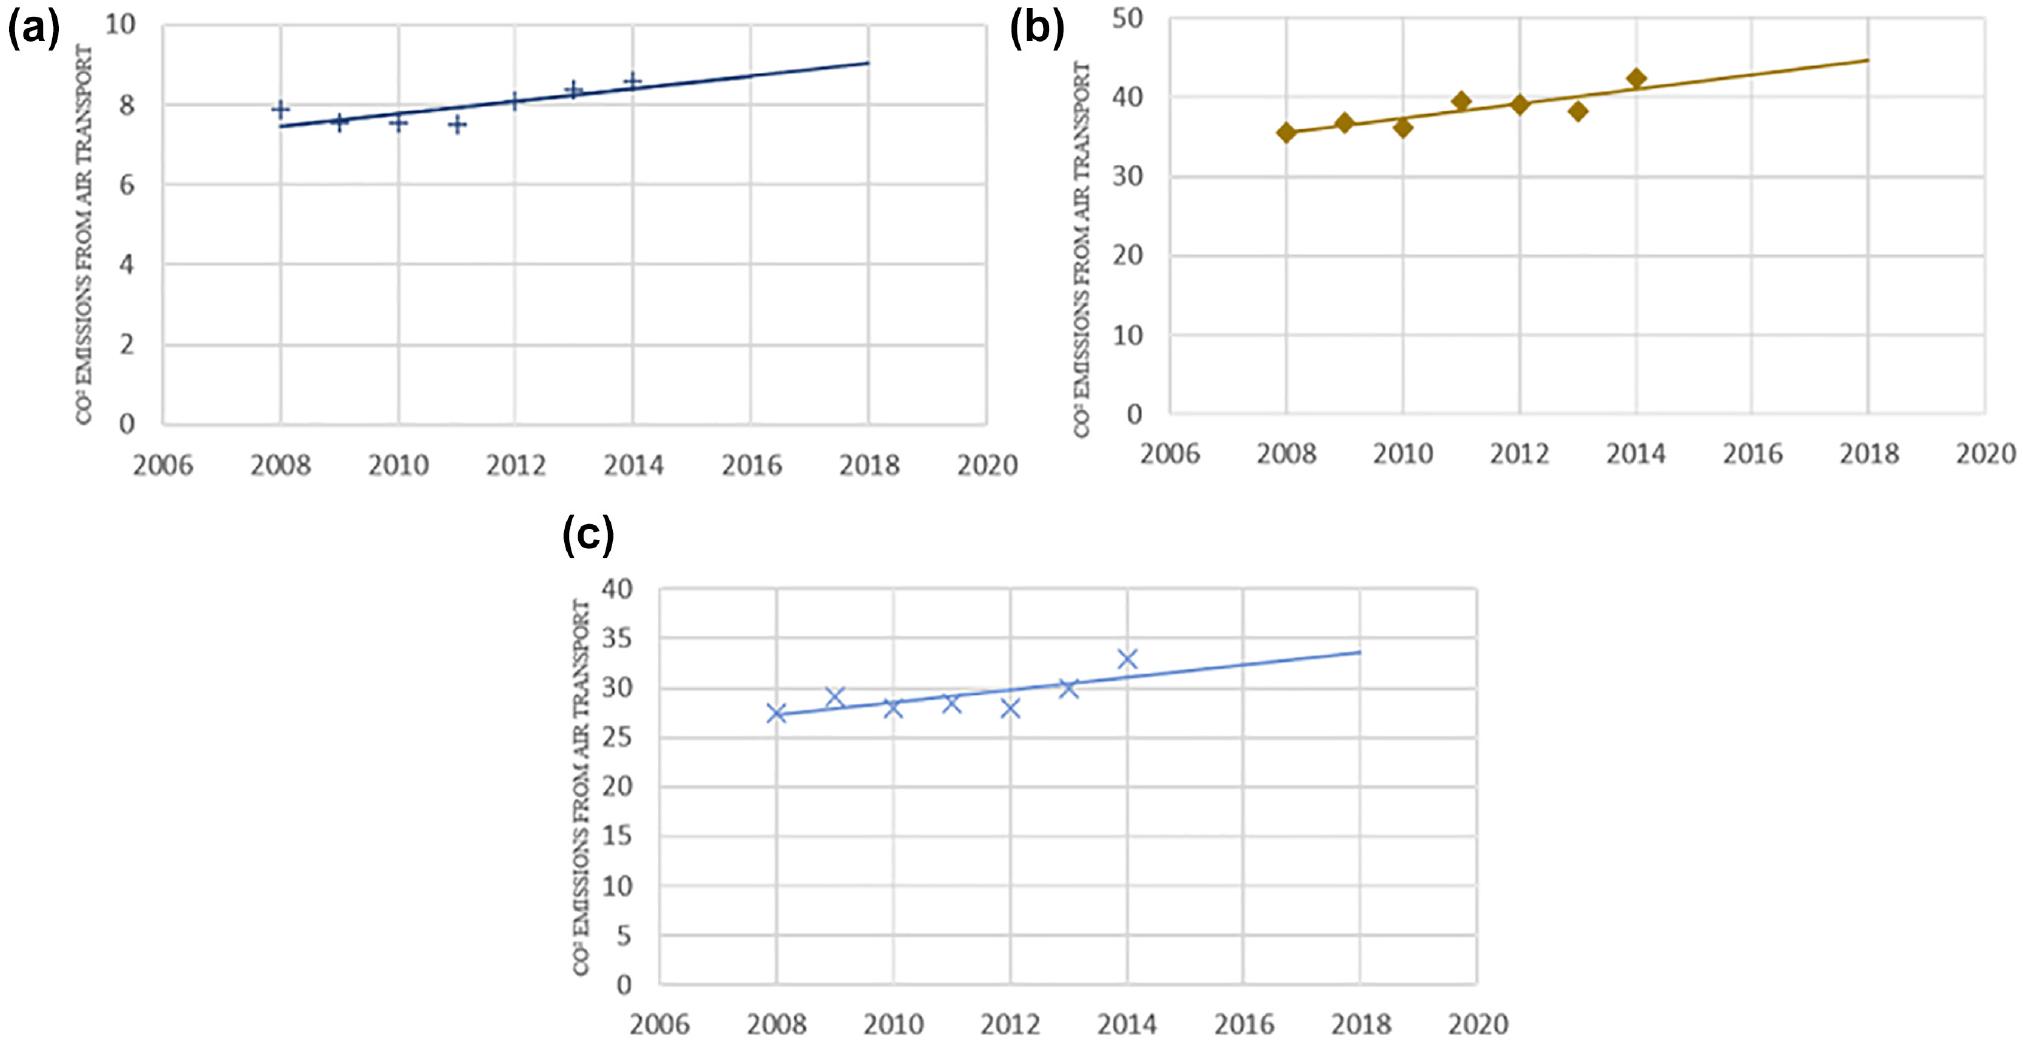
CO2 emissions trendlines from transport systems for: (a) China, (b) France, and (c) Italy.
Thus, the calculation of emissions for the transportation system alone followed the schematization presented in Figure 2.
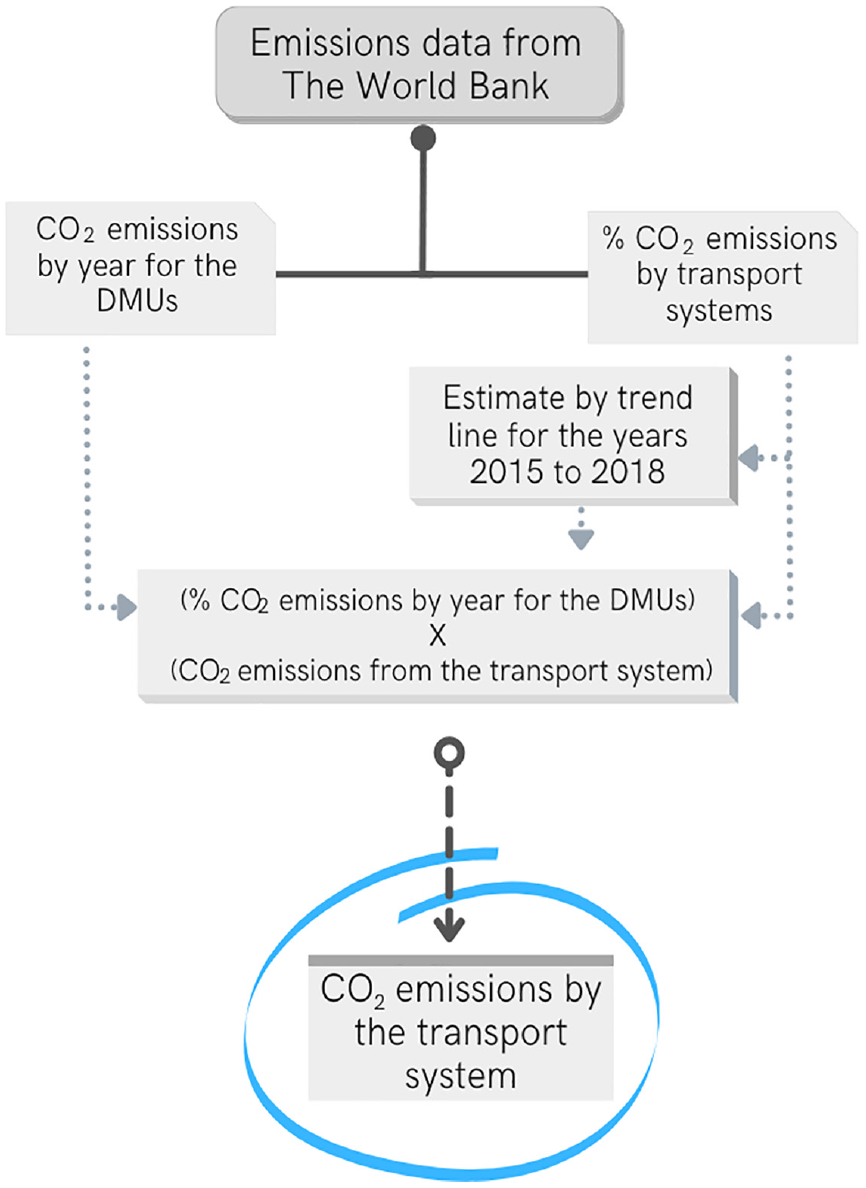
Flowchart of the CO2 emissions calculation by transport of the analyzed countries.
Data Envelopment Analysis (DEA)
The output-oriented BCC model was applied to define the efficiencies of the countries analyzed in relation to the CO2 emission by air transport. It was applied with the configurations presented in Table 3.
Scenarios Analyzed by Data Envelopment Analysis, with the Classical BCC-O (Banker, Charnes e Cooper – output oriented) Frontier and the Inverted Frontier by the Savage (1950) Method
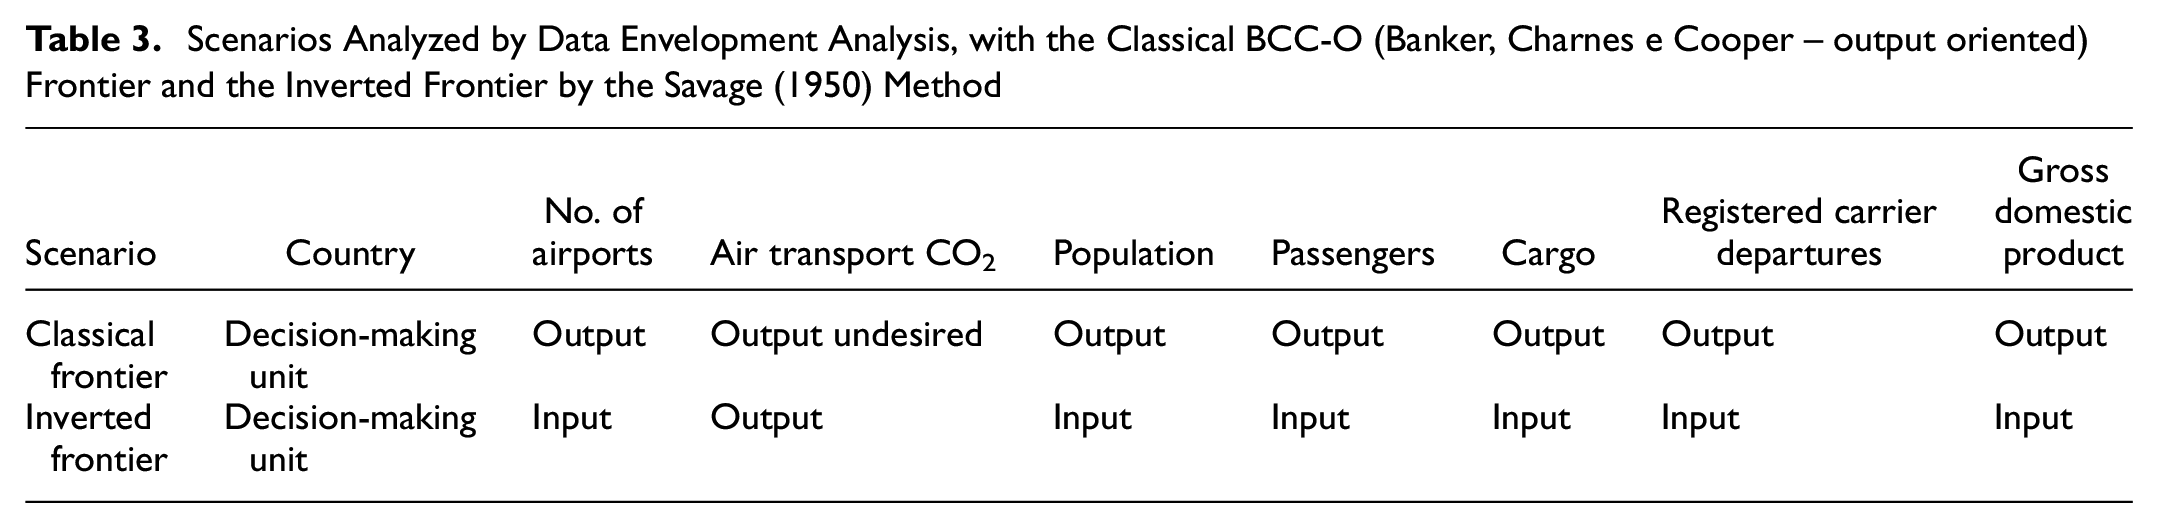
The classical frontier defines the scenario in which the highest efficiency represents the lowest production of pollutants by the system about the country’s socioeconomic level, infrastructure, and movement of passengers and air cargo.
The results of the classical model have revealed that more countries moved off the maximum efficiency line in 2018 (see Figure 3c) than at the beginning of the analyses, with a reduction in average efficiency of 1.5%. In contrast, emissions by air transport peaked at 15% higher in 2018 than in 2008. Model results are presented in the Table in the Appendix of the paper.
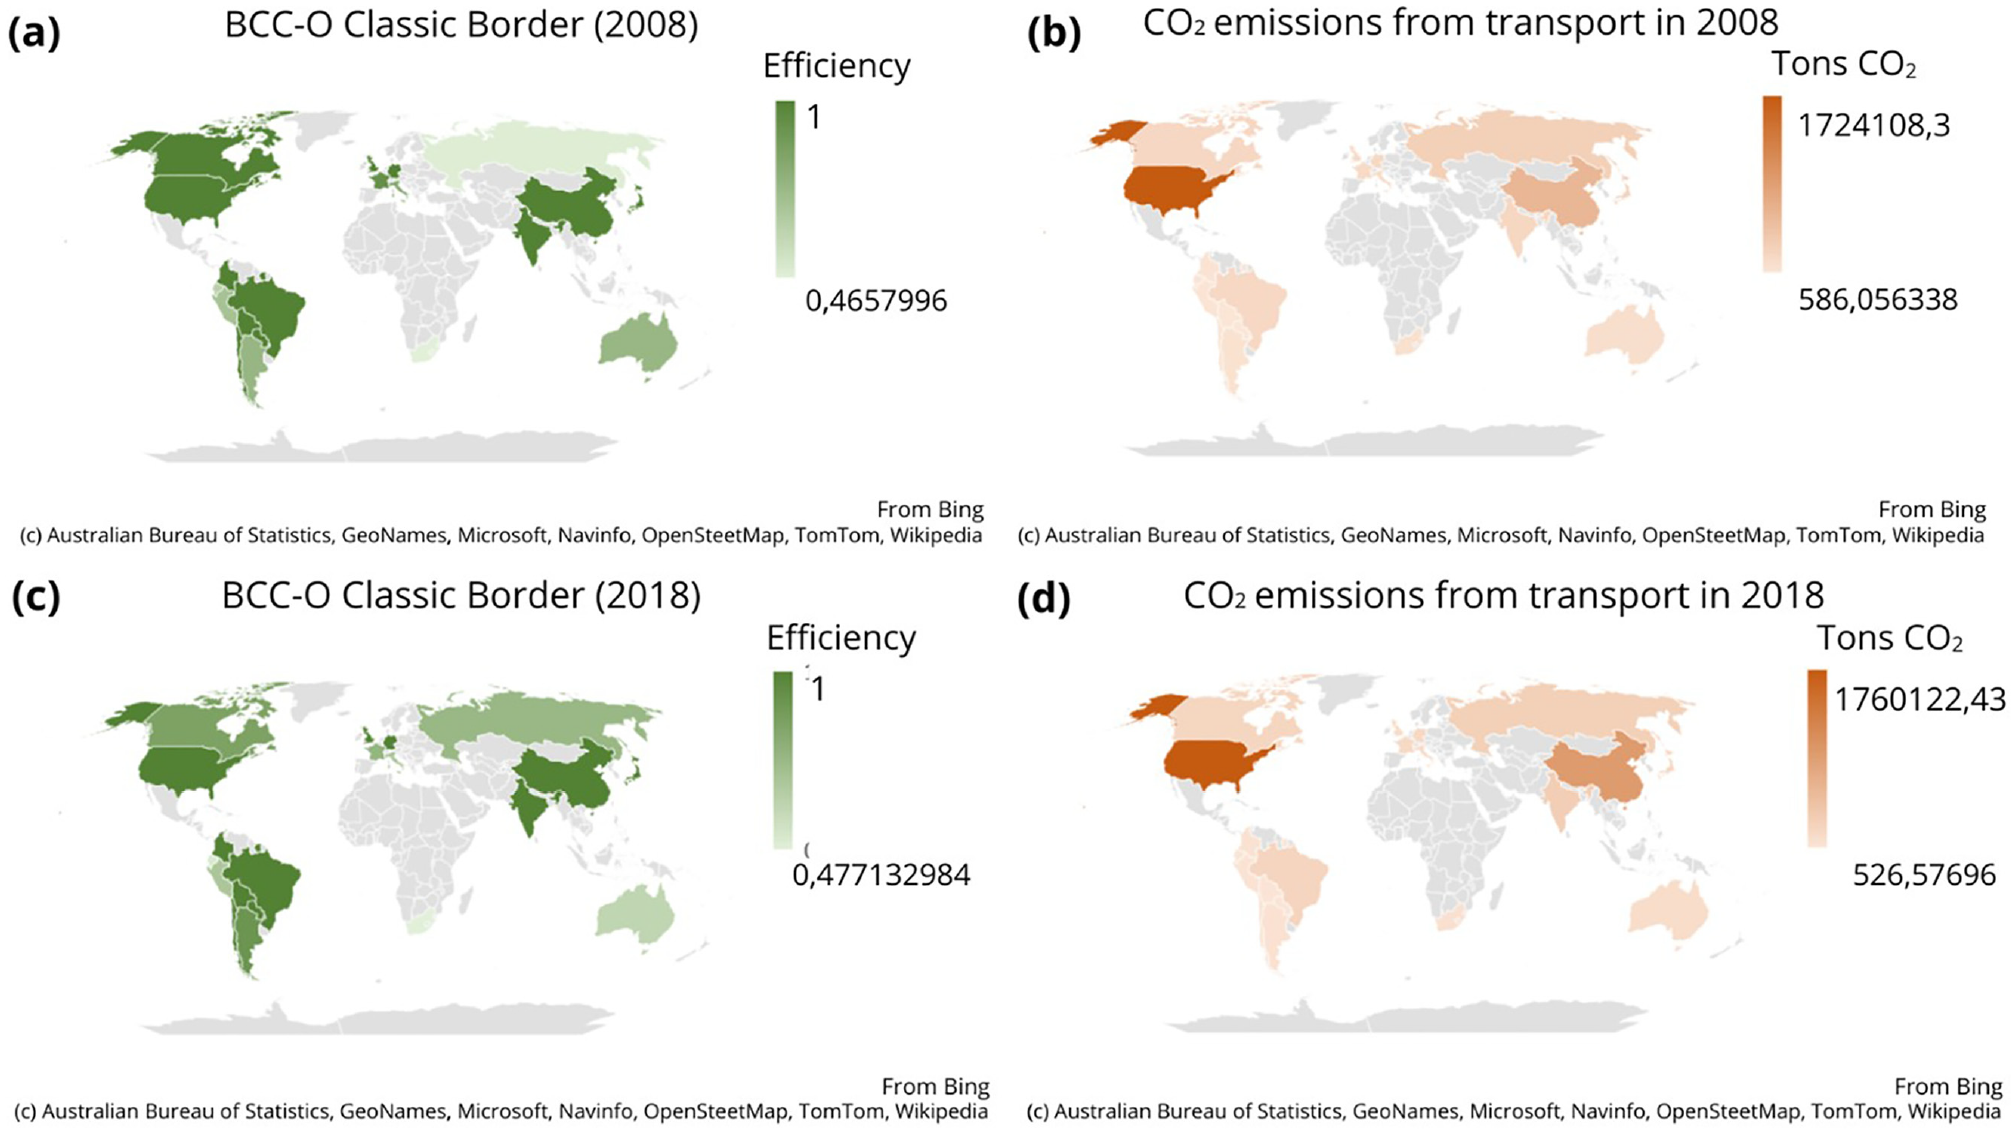
Results of the efficiencies of the classic BCC-O (Banker, Charnes e Cooper – output oriented) model for: (a) 2008 and (c) 2018, with the CO2 emissions by air transport by each decision-making unit at: (b) the beginning and (d) the end of the analyzed period.
However, this behavior was not scalar over the years, with several countries reaching the benchmark line or efficiencies above 80%. The efficiencies presented were used as a tie-breaker criterion, since more than 60% of the DMUs reached efficiencies higher than 90% in the years analyzed. The inverted frontier was constructed, based on the Savage method (1950).
The composite index was calculated with optimism coefficients (α) of 50% for both borders, allowing us to define the ranking of the five best and five worst countries for each of the analyzed years (see Figure 4).
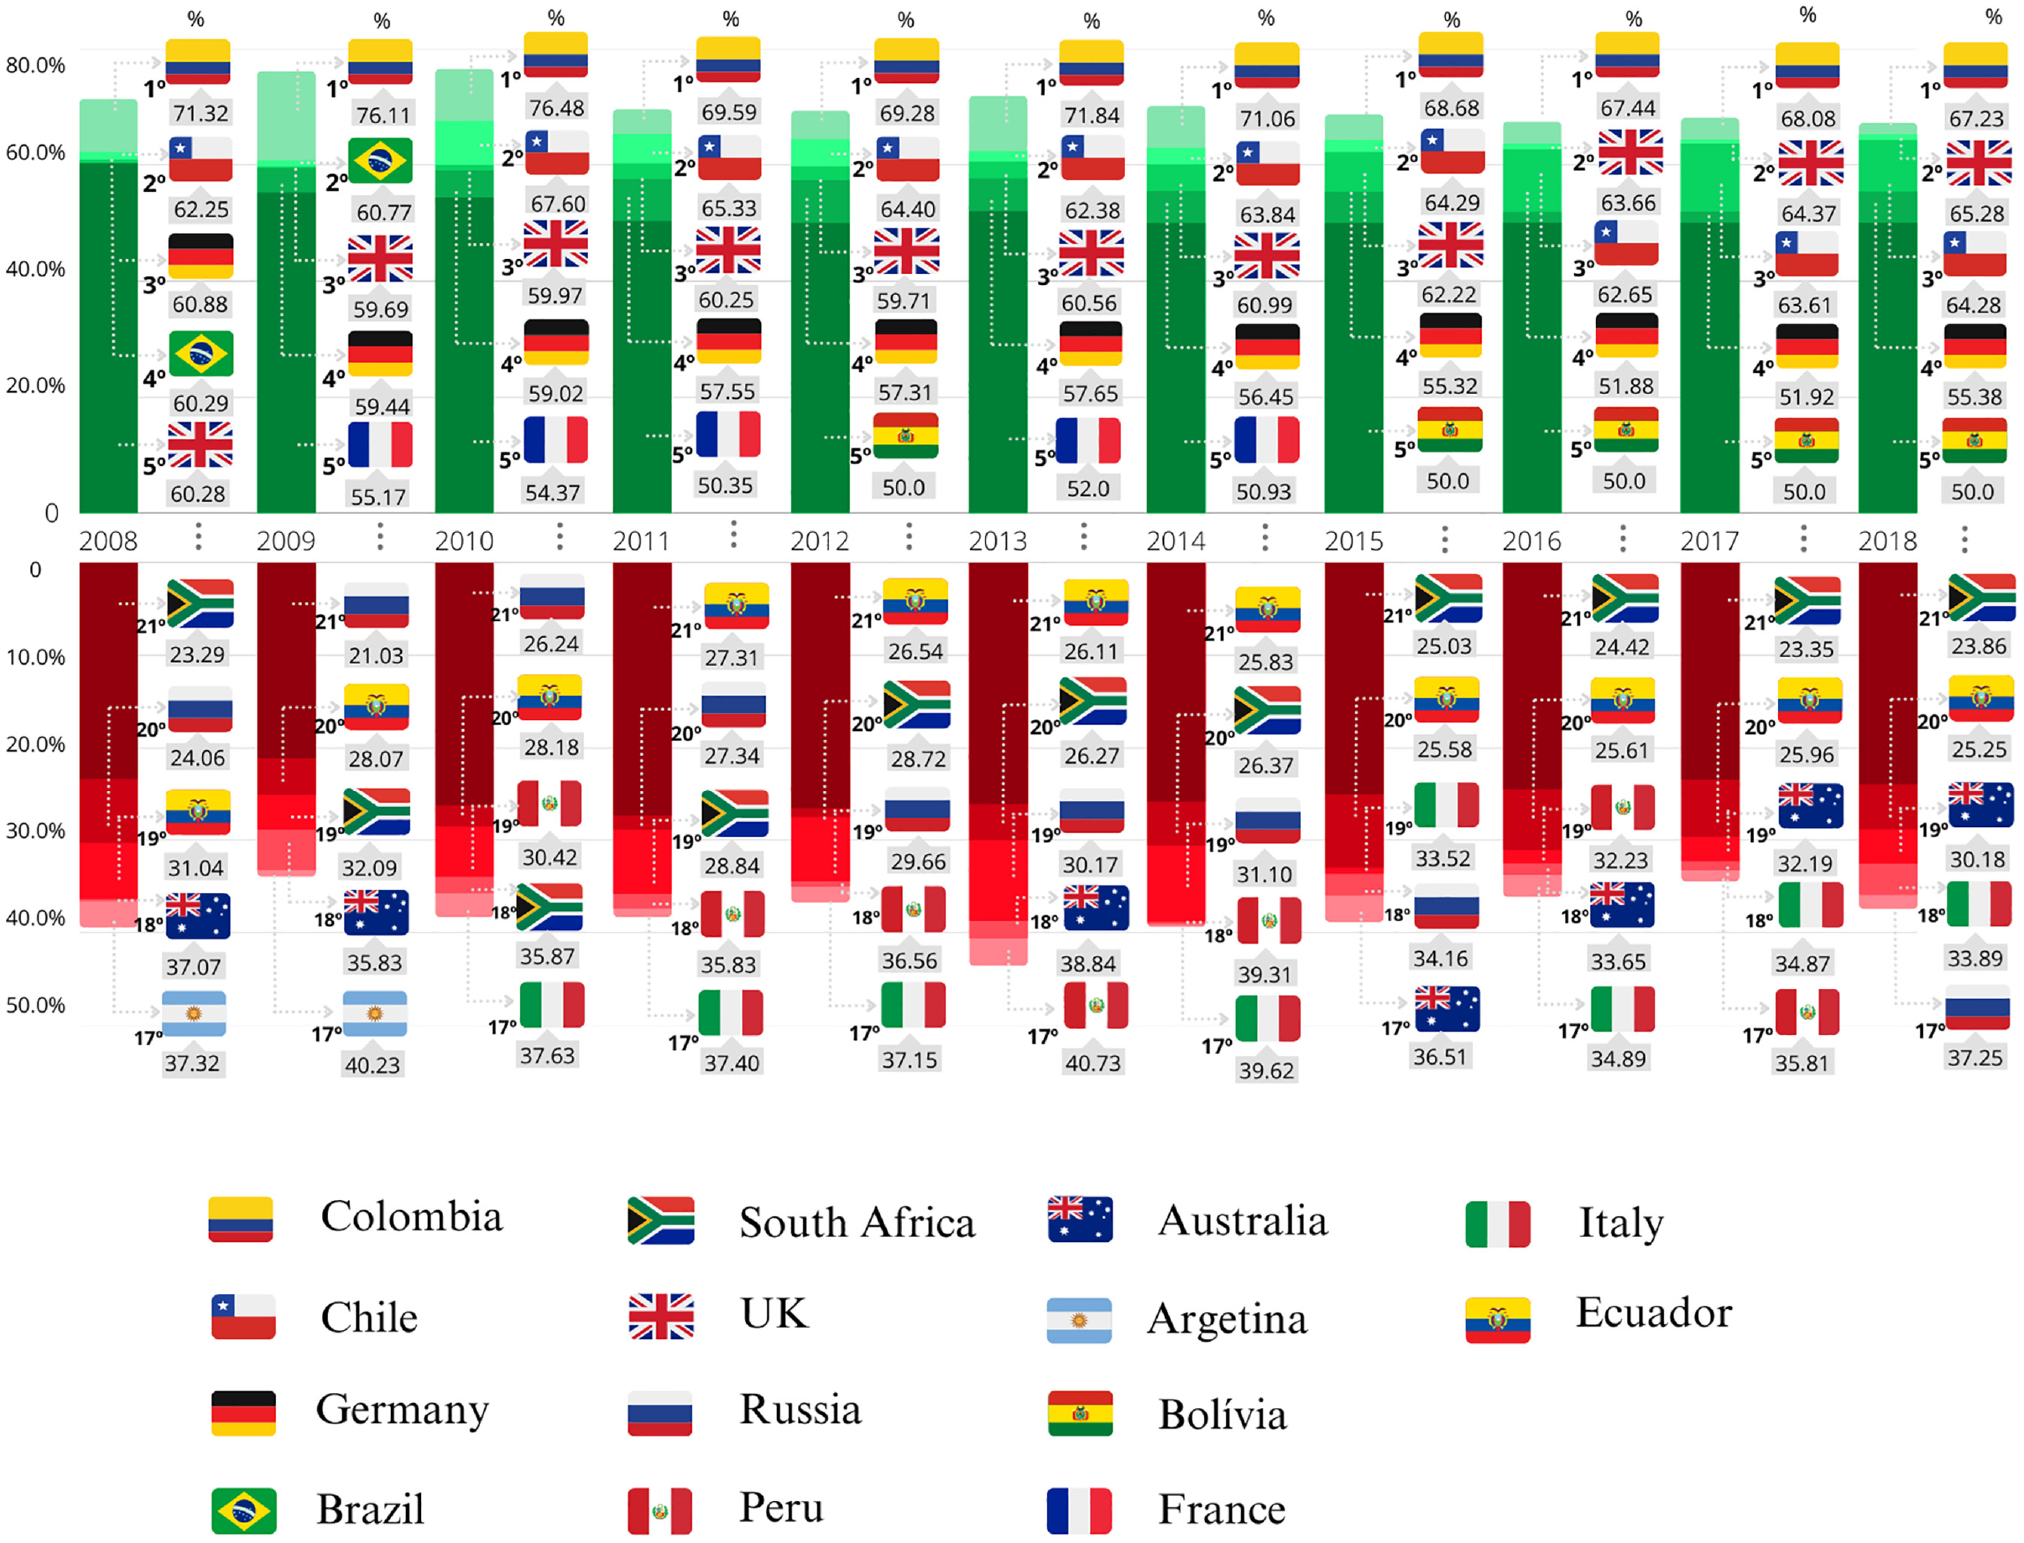
Ranking of the five best and worst countries from the efficiencies calculated by the composite index from 2008 to 2018.
Colombia is characterized by the established ranking as the most efficient country with regard to emissions by the transportation system in all the analyzed years, sharing the first positions with European countries with high socioeconomic indices, such as the UK, Germany, and France.
Other South American countries, such as Brazil and Bolivia, appear at the top of the ranking but lost positions over time, unlike Chile and Colombia, which remained at the top. Even if the efficiencies of the well-positioned South American countries tend to induce a positive interpretation with regard to the region’s airline models, Ecuador, Argentina, and Peru at the opposite end of the ranked table show a contrary hypothesis, with individual policies taking credit for the answers.
The same interpretation can be made for countries for developed and developing economic groups, such as G20 and BRICS, which have representatives at both extremes of the chart. This shows that joint policies to reduce emissions must, in the first place, come from the individual solutions of the countries which are members, with policies that aim to reduce the gap of more than 50% between the least efficient countries and the benchmarks. Thus, other methods are then applied to the data, seeking to define the relationship between the selected input and output variables with the efficiency or inefficiency of the countries studied.
CO2 Emissions and Air Transport
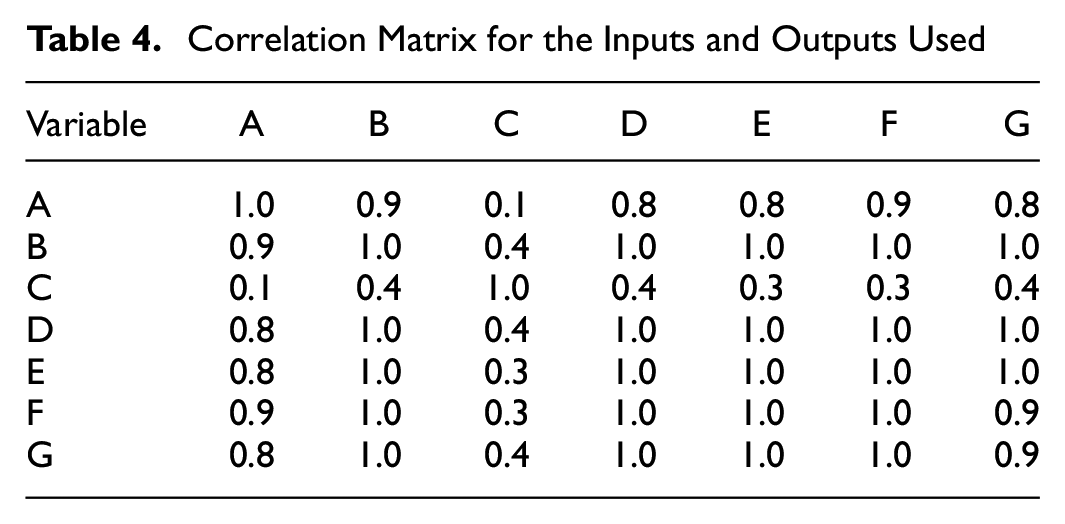
The result of the correlation matrix reveals what was already expected, which was shown in Tables 4 and 5—a high correlation between the variables related to air transport. However, it also relates positively to the variables related to air transport and CO2 emissions. The fact is that the correlation matrix, despite giving a good idea of the relationship between the variables, still cannot provide the real influence of the air transport parameters on CO2 emissions.
Correlation Matrix for the Inputs and Outputs Used
Analyzed Variables and their Corresponding Codes
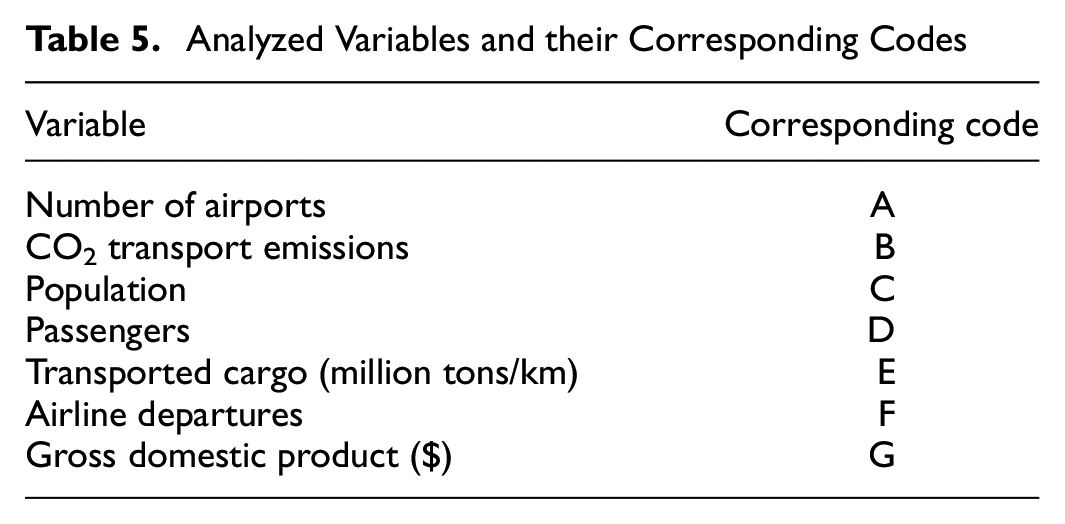
The result of the correlation matrix revealed the expected high correlation between the variables related to air transport shown in Tables 4 and 5. However, it also relates positively to the variables related to air transport and CO2 emissions. Even though the correlation matrix gives a good idea of the relationship between the variables, it still cannot provide the real influence of the air transport parameters on CO2 emissions.
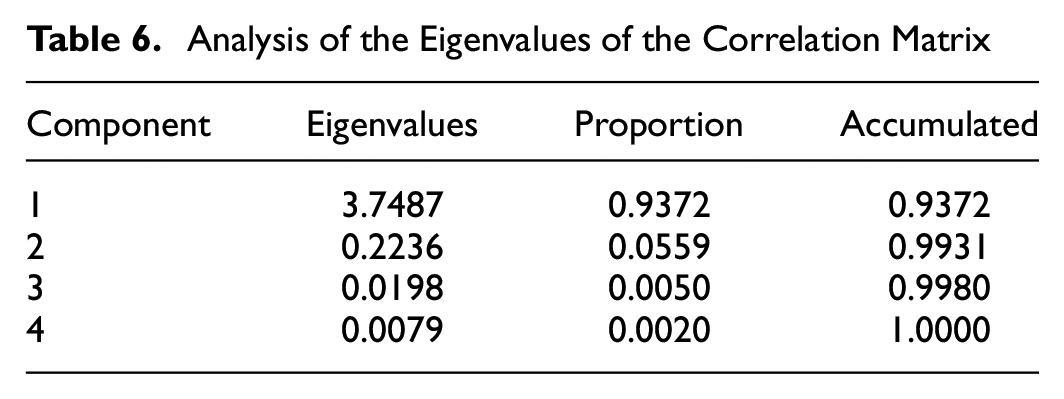
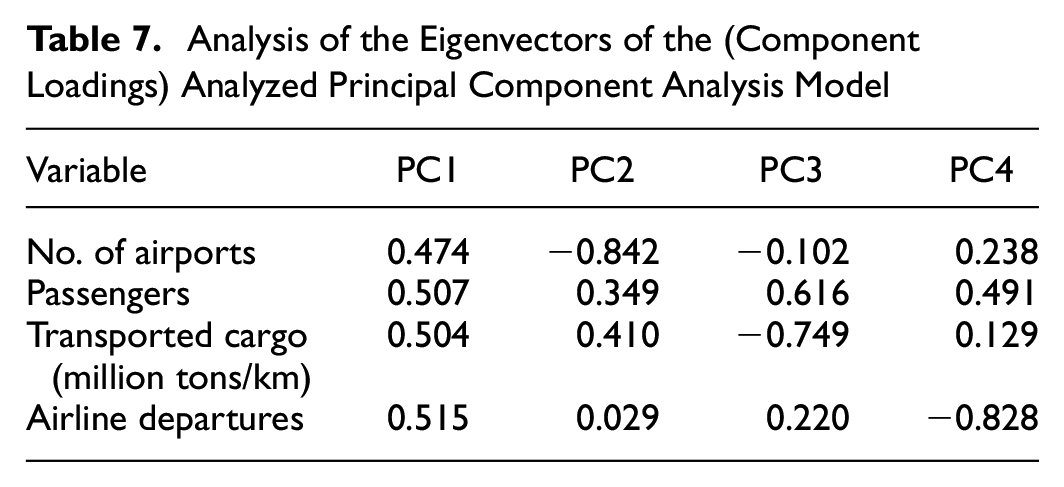
With the results of the correlation matrix, PCA was carried out considering the variables related to air transport to reduce the number of variables and also avoid multicollinearity problems in the regression. As a result of PCA, the first component was able to explain about 94% of the phenomenon, as shown in Tables 6 and 7. Therefore, it was decided to consider PC1 as the independent variable in the regression with CO2 emissions. Still, when analyzing the PCA, the analysis of the loadings of component 1 showed that the variables with the largest representativity were: aircraft movements, passenger movements, cargo movements, and quantity of airports, as shown in Table 7.
Analysis of the Eigenvalues of the Correlation Matrix
Analysis of the Eigenvectors of the (Component Loadings) Analyzed Principal Component Analysis Model
Thus, the PCA brings a result corroborating that the variables are closely correlated. Finally, the regression model was made with the variable CO2 emissions as the dependent variable (see Table 8) and the variables population, GDP, PC1 (representing air transport) and the time dummy variables to measure the effect of time on CO2 emissions.
Clustered OLS (Ordinary Least Squares) Model Performance
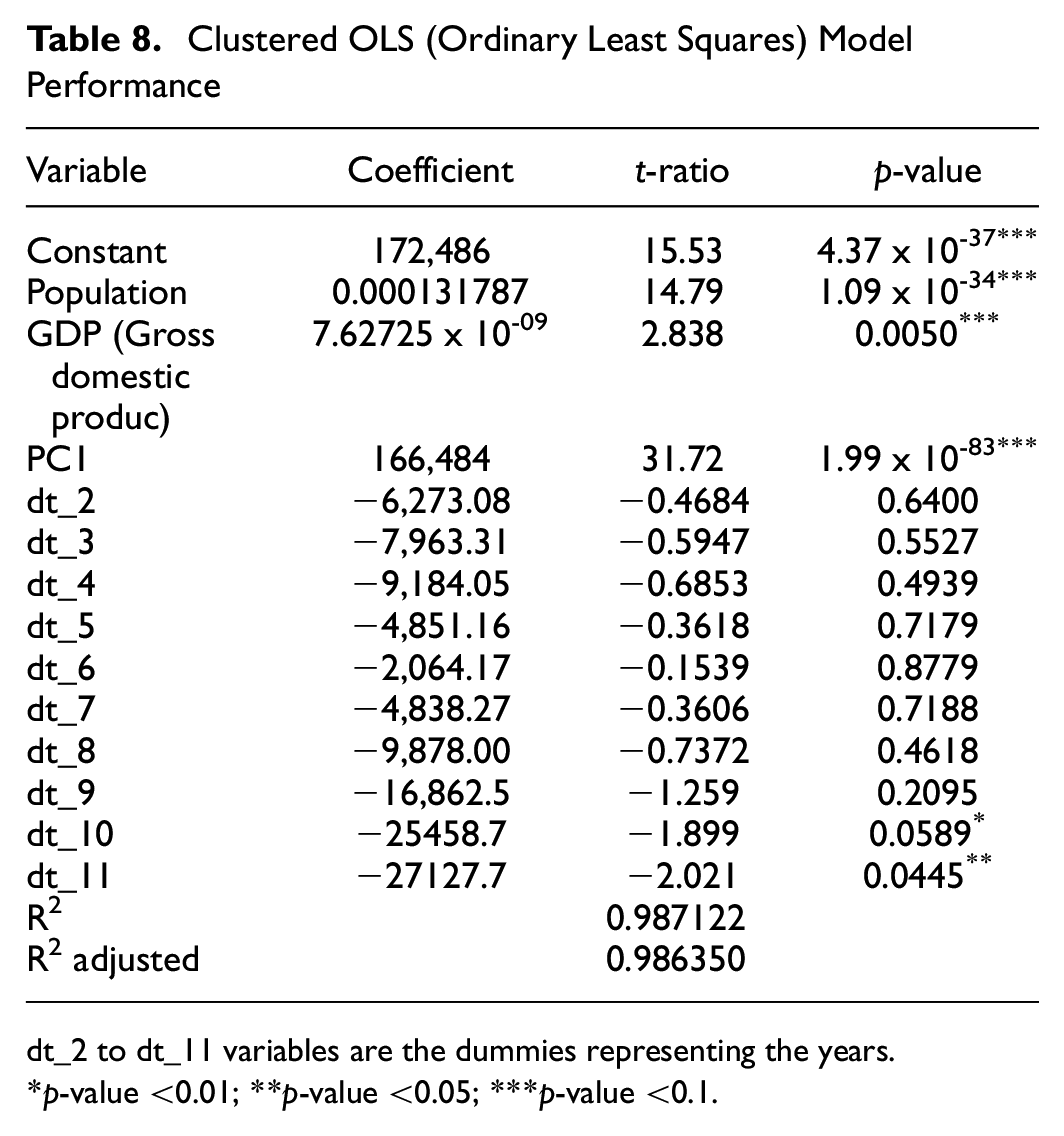
dt_2 to dt_11 variables are the dummies representing the years.
p-value <0.01; **p-value <0.05; ***p-value <0.1.
The model brings important results. Although it is not possible to confirm causality, it can be inferred that air transport has a positive influence on CO2 emissions, since the coefficient of PC1 is positive, as well as the size of the country and the economy represented by population and GDP, respectively. The seasonality variable indicates a decreasing trend in emissions over the years—a significant and positive outcome. This decline may be attributed to the improved fuel efficiency of newer aircraft. However, it is essential to acknowledge that there are still various challenges and opportunities for further progress toward sustainable practices in the aviation industry. In line with this, ICAO is actively working for sustainable advancements in civil aviation ( 32 ). The optimization of flight procedures to reduce fuel consumption, the increased production and implementation of sustainable aviation fuels and clean energy, and the implementation of CORSIA are key areas of focus. Furthermore, since 2015, researchers have highlighted the responsibility of airport operators in adopting measures to minimize environmental impacts. By adopting performance evaluation measures, airport authorities can strategically plan and implement strategies that promote sustainable development and protect the environment ( 33 – 35 ).
Cluster
Figure 5 shows the first step of the K-means method, which consists of choosing the optimal number of clusters, where the optimal value for clustering the data was obtained as four clusters.
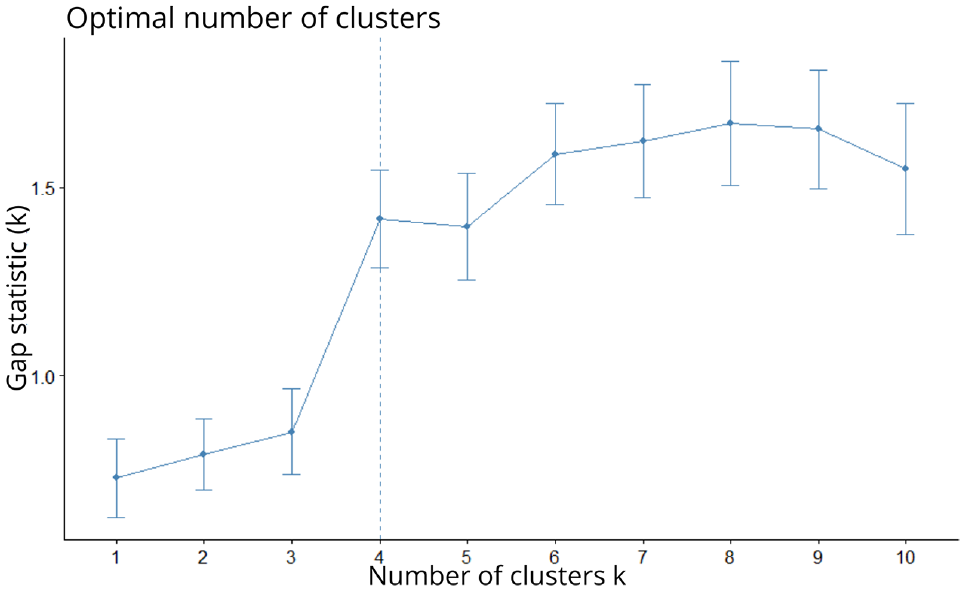
Clusters formed by the K-means method.
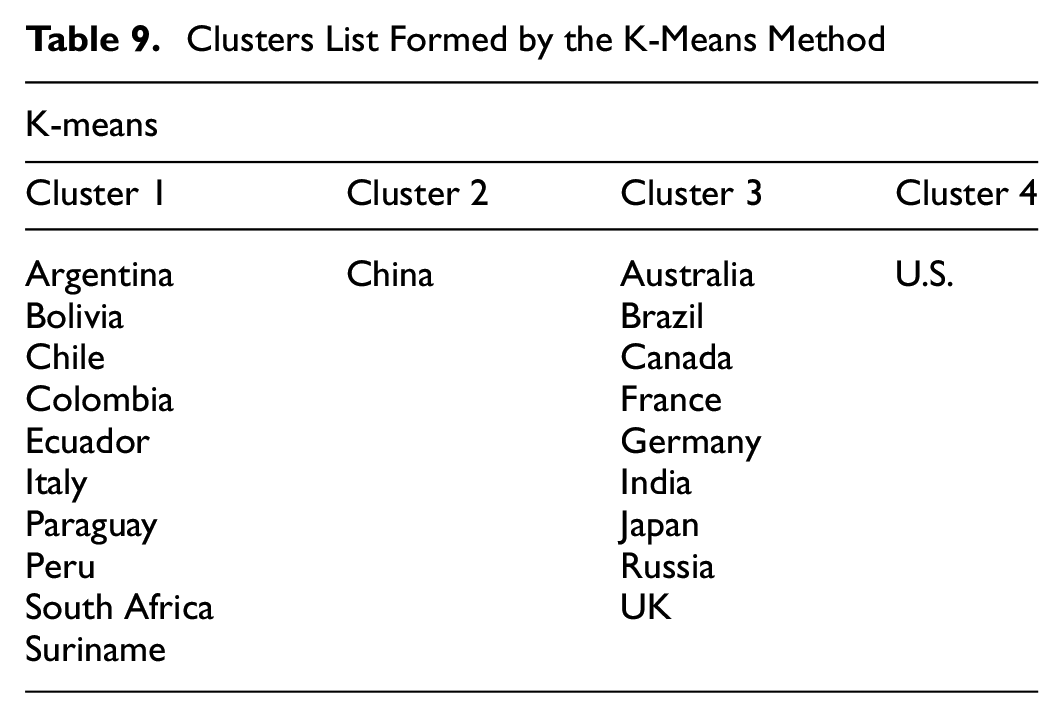
Table 9 and Figure 6 show the result of the 21 countries grouped into the four clusters.
Clusters List Formed by the K-Means Method
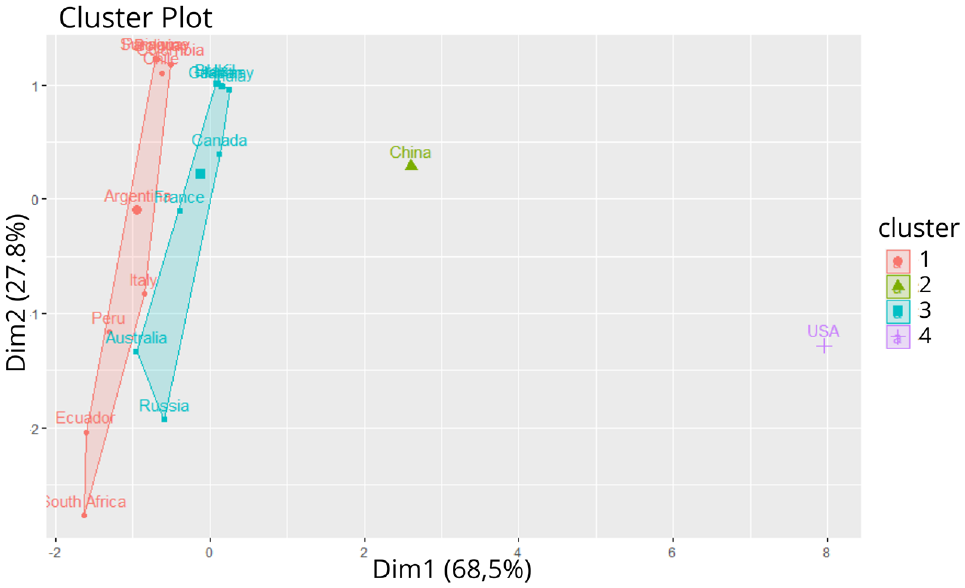
Clusters formed by the K-means method.
Analyzing the results of the clusters presented in Table 9, clusters 2 and 4 were highlighted, representing China and the U.S., respectively. The separation of the two nations from the rest of the clusters is given, because of their notable difference in CO2 emissions and aircraft movements of these countries. Despite their prominence with regard to their infrastructure, the two major economic powers were not among the most efficient countries in any of the years. Concerning cluster 1, it is important to note that, on one side of the group, Colombia is the country with the highest efficiency in all the years analyzed. On the other hand, South Africa and Ecuador are present as the worst countries in 4 and 5 years, respectively. In cluster 2, the same situation is noticeable, in which countries such as Germany and the UK were among the top five countries in all years, while Australia and Russia were among the worst countries in most years.
Therefore, it is noticeable that the cluster groups were grouped based on their infrastructure and emission data. Thus, the cluster was not able to group countries of similar efficiency. Therefore, it is important to emphasize that the difference within the groups points to measures of greater efficiency adopted by the better-ranked countries, and that could be the basis for study and even implementation in the countries with the worst rankings.
Conclusion
In this work, 21 countries belonging to the groups G8, BRICS, and South America, besides Australia, were analyzed (except for Uruguay, Guyana, and Venezuela, because of the lack of data). The DEA method was used to analyze the efficiency of CO2 emissions in air transport using data from 2008 to 2019.
Using the BCC method, it was found that, of the 21 countries under study, 10 achieved maximum efficiency in all years (South Africa, Suriname, UK, U.S., India, China, Japan, Germany, Canada, and Australia), four achieved efficiency above 50% (Russia, Italy, France, and Chile), and seven achieved efficiency below 50% (Colombia, Argentina, Brazil, Peru, Ecuador, Paraguay, and Bolivia).
The results obtained were coherent when comparing the G8 and South American groups. For example, most of the countries of the first group reached maximum efficiency in all years, while, of the nine South American countries analyzed, seven obtained efficiencies below 50%, showing that efficiency in CO2 emissions in air transport is related to the country’s development.
Analyzing the performance of Brazil, which showed good efficiency in the first years’ analyses, it lost positions compared with other countries from 2010. It could not reach the first marks since then, indicating the loss or stagnation of the effectiveness of environmental policies and actions for reducing CO2 emissions in Brazilian air transport.
This work highlights the limitation for choosing the input and output variables used. Some possible variables did not have available values for all years in the countries under study because of the long period of analysis from 2008 to 2018. Thus, it is suggested that, for future studies, the analysis should be done only with the most updated data available, also using social development variables of the countries, such as Human Development Index (HDI) and Gini coefficient, for example.
Supplemental Material
sj-docx-1-trr-10.1177_03611981231193407 – Supplemental material for CO2 Emissions in Air Transport: A Comparative Study Using Data Envelopment Analysis
Supplemental material, sj-docx-1-trr-10.1177_03611981231193407 for CO2 Emissions in Air Transport: A Comparative Study Using Data Envelopment Analysis by Hélio da Silva Queiroz Júnior, Marcos Araújo de Souza Celestino, Carolina Farias Ferreira de Souza, Viviane Adriano Falcão and Flávia de Castro Camioto in Transportation Research Record
Footnotes
Acknowledgements
The authors would like to express their sincere gratitude to the National Council for Scientific and Technological Development (CNPq) for the financial support provided.
Author Contributions
The authors confirm contribution to the paper as follows: study conception and design: V. Falcão, F. de Castro Camioto; data collection: V. Falcão, C. de Souza; analysis and interpretation of results: H. Queiroz Júnior, M. de Souza Celestino; draft manuscript preparation: F. de Castro Camioto, H. Queiroz Júnior, M. de Souza Celestino. All authors reviewed the results and approved the final version of the manuscript.
Declaration of Conflicting Interests
The author(s) declared no potential conflicts of interest with respect to the research, authorship, and/or publication of this article.
Funding
The author(s) disclosed receipt of the following financial support for the research, authorship, and/or publication of this article: the National Council for Scientific and Technological Development (CNPq) through the Universal Call 436236/2018-4.
Supplemental Material
Supplemental material for this article is available online.
References
Supplementary Material
Please find the following supplemental material available below.
For Open Access articles published under a Creative Commons License, all supplemental material carries the same license as the article it is associated with.
For non-Open Access articles published, all supplemental material carries a non-exclusive license, and permission requests for re-use of supplemental material or any part of supplemental material shall be sent directly to the copyright owner as specified in the copyright notice associated with the article.