
Abstract
This study aims to present a method to analyze the problems that arise from the increasing use of shared mobility systems to solve the current problems of congestion. The use of shared and/or autonomous vehicles (SAVs) is beneficial since it could reduce the number of vehicles on the roads. On the other hand, the increased usage of SAVs to fulfill the same transportation needs would affect the total life of those vehicles. Current cost models are based on average values and life cycles of 15 years; they may not be useful in the case of increased daily travel miles of vehicles when subscription-based shared mobility systems become prevalent. In this paper, we present a comprehensive framework which considers the interactions of new cost structures and the system performance under new mobility schemes. This paper envisions the scenarios that will exemplify the importance of considering the changing costs because of the increased mileage of vehicles. Cost functions are properly designed to assess the new scenarios, a pricing scheme is introduced from the service provider’s point of view to adjust the demand for the services and the profits, an agent-based simulation platform is presented, and a framework is demonstrated to consider the interactions and optimize the system.
Keywords
Transportation systems of the world are undergoing a transformation through three major revolutions: electrification, shared and on-demand mobility, and automation ( 1 ). These are presented as the future of transportation, to solve current problems of congestion, safety, and pollution; however, they also represent a new set of challenges, and their impacts on the transportation system should be analyzed ( 2 ).
These transformations are changing the way transportation is envisioned, with new possible systems and mode combinations (micro-transit, autonomous vehicles [AVs], vehicle fleets from subscription services), new mobility paradigms where vehicles are shared between the users, and even new ownership schemes where the user only pays for the time of usage of the vehicles “on the fly.”
As the usage patterns and life cycles of the vehicles can also change significantly, the current cost and objective functions are not sufficiently sophisticated to capture the possible system transformations in the future. The cost calculations appearing in current literature generally do not consider the implications of the interactions among the elements of the new transportation paradigms. In this research, we analyze the topic, focusing on the use of shared mobility solutions and the new challenges of increased mileage in shorter time spans, and showing how we can analyze and optimize such mobility systems with agent-based simulations that incorporate proper cost functions.
We consider the importance of these future scenarios and the use of subscription services to manage the different modes and services. We study the impact of increasing the number of shared vehicles and give details on how we can analyze their cost. The cost models are then used in simulating different scenarios in which subscription services are considered to serve the demand in a network, and to analyze the interactions among different transportation modes, including shared and/or autonomous vehicles (SAVs). The framework developed allows the study of these new mobility options and the incorporation of the new paradigms. In particular, we present a case study with a ridesharing system to evaluate the further implications of systems of SAVs.
Motivation
Research has shown that cars are known to be parked 95% of the time and used only for less than an hour each day in the U.S. ( 3 ). This, combined with the low seat utilization rate, represents a vehicle seat efficiency rate lower than 4%. For a simple explanation, cars are used only about 1/6th of the productive time when they can be used (conservatively about 6 peak hours when travel is most in demand), and often only about 1/4th of the seats are used as well, resulting in 1/24 efficiency (less than 4%). Perhaps the public should be made to appreciate how stunningly inefficient that is, but we hardly find much highlighting of this aspect in the literature.
The new transformations are expected to solve the above problem to some extent. As shown in some studies (see Sheppard), the full level of current mobility in the U.S. can be alternatively achieved at a much lower cost with only 12.5 million shared AVs, which is less than 10% of the vehicles currently used for personal travel ( 2 ). While it is possible that the number of required SAVs in Sheppard’s study is substantially underestimated, it is quite evident that significant reductions in the number of vehicles are possible with newer paradigms of usage and ownership ( 2 ).
The aim of this study is to comprehensively model and analyze the interactions between demand, supply, and performance, to arrive at more reliable estimates of vehicle usage and costs. Of special interest is studying the importance of costs in new transportation systems and their effects on ownership and usage patterns. To meet this goal, we analyze the current situation and simulate the use of vehicles in shared mobility scenarios.
In the modeling study, we incorporate a transportation service provider system that acts as a ride-matching company for the users of a ridesharing system. We must point out that the modeling system can also be easily adapted to study a non-profit public agency for mobility services. We focus on the business sustainability of the subscription-based service model assumed for the service providers. Then, we implement a more specific cost function for each vehicle of the agent-based modeling system. Finally, through simulations, we analyze the interaction of supply, demand, costs, performance, and pricing of a company offering subscription services, to present insights on how we can better optimize the mobility system and evaluate it through proper benefit-cost analyses.
The framework proposed allows for a better understanding of the implications of new mobility systems and how we can consider new changes in ownership and subscription paradigms as well. In particular, the modeled ridesharing system incorporates new and more realistic vehicle cost implications as well as new agents managing the shared mobility system, which is an advance over the simplified assumptions found in typical ridesharing system studies.
In the following sections, we describe: the background needed; the transportation costs and variables; the methodology proposed with the framework to study the interactions of the elements in the system; and the simulation with initial results of shared systems and future scenarios considered of SAVs.
Background
In this research, we focus on analyzing the impacts of new shared and/or autonomous systems that offer better system and vehicle usage efficiencies. A consideration of the effects of electrification, especially as it relates to modeling the life-cycle costs of different energy sources, is beyond the scope of this study.
The focus is on modeling the new mobility scenarios and the interactions between the mobility systems and user demand, to examine how they could affect the usage of vehicles and the costs. Naturally, it is important to consider potential changes in vehicle ownership paradigms that might affect these interactions.
AVs should replace personal vehicles only in a judicious manner. It is clear to see that replacing each conventional personal vehicle with an AV will result in the same number of vehicles, and nothing much will be achieved ( 4 ). While it is true that efficiency and security could increase and in-vehicle time could be used more efficiently ( 5 ), it has been well established that the total vehicle miles traveled (VMT) per person could significantly increase ( 6 ). Deadheading movements of the AVs without passengers is one reason that is commonly understood for this excess VMT. Much higher efficiency could be obtained if we switched the ownership scheme from the users to public/private companies ( 7 ).
Therefore, the objective of this change of ownership is to make use of a more efficient system, where the total number of vehicles used will be substantially reduced, but their usage will be higher so as to offer the same level of service. Most of the currently used models are based only on average costs, considering vehicles with an annual average of 15,000 mi and total lifetime usage up to 200,000 mi. Our research focuses on analyzing the impact of much higher intensity in the use of cars to develop appropriate cost functions that better address the changes brought by new mobility systems.
Current cost functions make use of average values and are mainly based on the cost associated with travel time. There are many studies that have attempted to evaluate partial or full transportation costs, such as in Litman, Van den Bossche et al., and Small which offer useful insights for our problem ( 8 – 11 ). Other studies similarly use average values to draw conclusions on agent-based simulation models, such as in Hörl, Bauer, and Wang, which are very helpful to the model preparation and the definition of the characteristics of the SAV system ( 12 – 14 ).
Concerning the full cost of the vehicle, we are aware of no current model that considers a cost function for the life of a vehicle under the new usage scenarios that ensue with new mobility systems. As opposed to the purchase cost of the vehicle, our focus is on the cost during its use. It is important to take into account the significantly increased daily usage under the new mobility options, and to pay attention to identifying the variables that have the strongest effect on the model.
Methodology
The rise of the sharing economy has led to the development of the well-known concept of the Smart City, where people can move around by making use of integrated shared transportation systems. We analyze the changes in the travelers’ usage with a new cost function that also considers different ownership paradigms, and how their interaction can affect new mobility systems of SAVs, which can also include systems of fleets of vehicles.
There are many algorithms for cost optimization and fleet management, but rarely, if ever, do they consider the efficiency of the system using the total cost of the vehicle during its life. Some of the reasons are that, in the current situation, vehicles have a long life cycle, and the impacts of their usage in transportation network companies (TNCs) have not been comprehensively analyzed. However, this scenario could change with SAVs, so we present a framework that models vehicle movements in networks with associated time-dependent demand inputs, and implements the real-time operation of ride-matching algorithms within the simulation. The latter is necessary to capture opportunities for efficient (increased) use of the vehicles as well as seats in those vehicles. The framework is developed with an appreciation that determining vehicle usage levels requires sufficiently detailed dynamic supply-side modeling of vehicle movements, as well as the associated ridesharing/carsharing opportunities that lead to cost savings possibilities. The performance of the system and the level of sharing determine the prices from the mobility provider, and the prices then cause demand-side changes that make the shared-mobility system efficient, measured as the number of vehicles used and the propensity for shared usage. Capturing this interaction and, thus, the increase in vehicle usage, is the key aspect of our methodology. We admit that the user response behavior in such a future system is difficult to ascertain because of a lack of data; however, we posit that such systems will be essentially controlled by user-side apps that can be expected to be rational actors to optimize the user response with regard to minimal cost and disutility.
Cost Optimization Function
This research considers the increasing importance of the cost of the vehicles, and that the variability of vehicles and user-demand may increase in the future (i.e., different types of trips or requests may be addressed with different types of vehicles). In that case, we can differentiate between a system that has an overall optimization of the system, or a more individualized situation in which there are practical subsystem optimizations where each vehicle belongs to a company and the vehicle usage is adjusted in response to real-time conditions.
The cost function gives a more individualized view where the objective function can be split into multiple objective functions depending on the different variables, groups of people, or fleet(s) of vehicles. This is reflected in Equation 1. Note that we also consider the case of a given car being part of multiple fleets, such as when an owner leases the usage of the vehicle to any service provider’s fleet in real-time; thus, we have the summation over j as a possibility.

where
Ci = the cost for vehicle i, from fleet j, at time step t,
Cf ijt = depreciation cost of the vehicle, and
Cv ijt = insurance + maintenance + repairs + fuel.
The most important aspect of this system is the identification of the variables that have the highest impact on costs, depending on the vehicles, users, or fleets. It would also be limited by the constraints of the network and the control of the fleets and vehicles. There are many variables that could be involved with the usage of vehicles and the associated costs, but the ones selected are considered the most important. Depreciation is separated as a fixed cost because it can be combined (using standard present worth calculations) with the cost of purchasing the car. Fuel includes the cost of gasoline or electricity. Travel time also needs to be considered important for the optimization from the user’s side; however, it is considered in another step to compare different scenarios and the difference between driving and being a passenger in a vehicle.
Vehicle Cost and Type Distribution
For the vehicle cost function, we analyzed the dataset from the National Household Travel Survey (NHTS) from 2017 and determined the predominant types of vehicles owned and used, and their distribution ( 15 ). This information is also used later to generate vehicles for the network simulation. We obtained that regular car (sedan) is the most common type with about 50%, followed by sport utility vehicle (SUV) with almost 30%, and then the pickup and van with 15% and 6%, respectively (Figure 1).
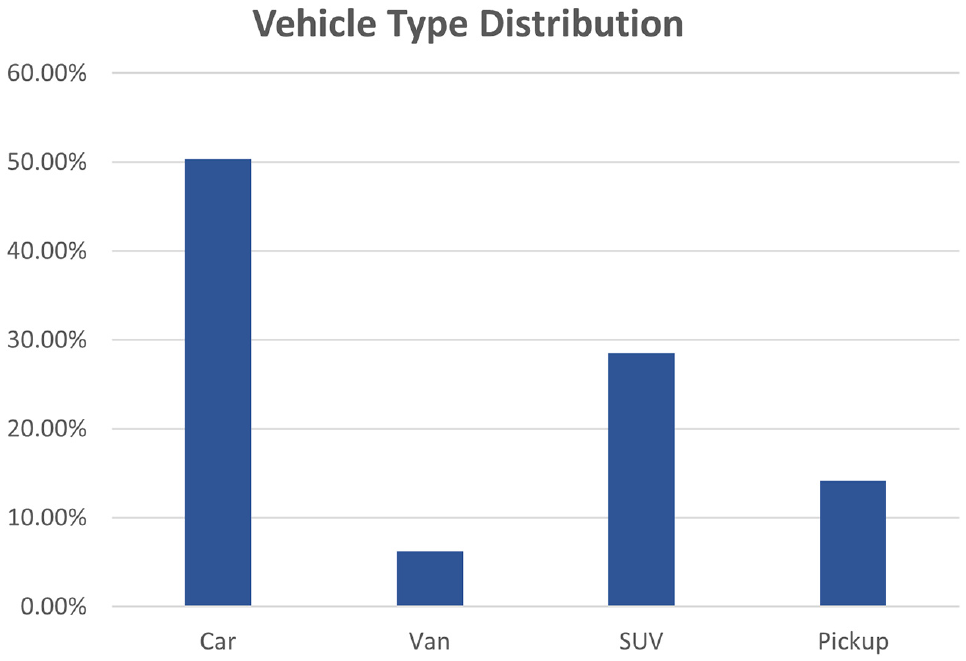
Vehicle type distribution, data obtained from NHTS 2017.
With the above types, we generated a cost function. There is a crucial problem of finding a clear database or information source for the real cost of vehicles; in particular, how it adjusts year by year and how it depends on the model of the vehicle and the region. For this purpose, we have referred to the database information from Edmunds True Cost to Own. For each vehicle type, we selected the most common vehicle models purchased for the year corresponding to the survey (Kelley Blue Book), and then we averaged the cost of the variables considered for each year of a 5-year period. We also added another vehicle type, electric vehicles, using the same process. Even if it is not very representative in the NHTS 2017 survey, it is a vehicle type on the rise lately and needs to be considered for its impact in our simulation ( 15 ).
Then, we adjusted the cost function to consider the use of the vehicles (miles associated) as the independent variable, assuming a ratio of use of 15,000 mi per vehicle per year. This mileage was extrapolated to consider the effect of the increased use of ridesharing/carsharing vehicles, which is the focus of this research. We can observe (Figure 2) that all vehicles initially have a high cost, obviously because of the high initial cost of the purchase, and that all vehicles have high depreciation in the early years. Then, the depreciation decreases, and the other variables start having more importance. The result has a very similar shape across all vehicle types, with an inflection point at around 22,500 mi associated with the first 2 years of use and then a positive slope. These observations are no surprise; however, incorporating it as a function in the modeling is important.
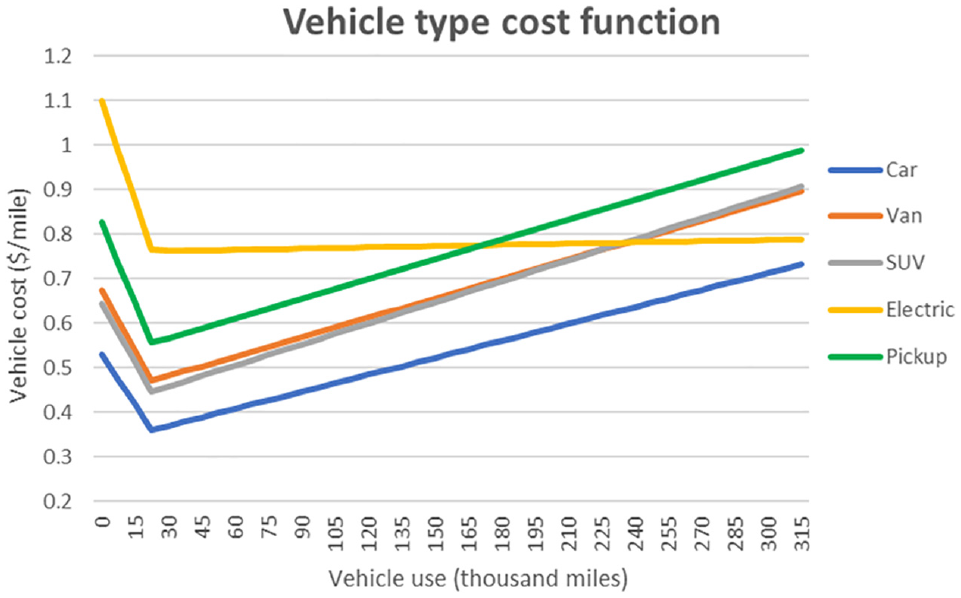
Vehicle type cost function distribution for a higher lifetime cycle scenario.
Vehicle Usage Cost Framework
The analysis framework for the new mobility systems includes the cost model of lifetime vehicle usage. The framework presented (Figure 3) is divided into five blocks that cover all the aspects, namely, the generation, matching, simulation, and analysis of the vehicle movement and traveler experience in a network, and the benefit/cost of the managing agent.
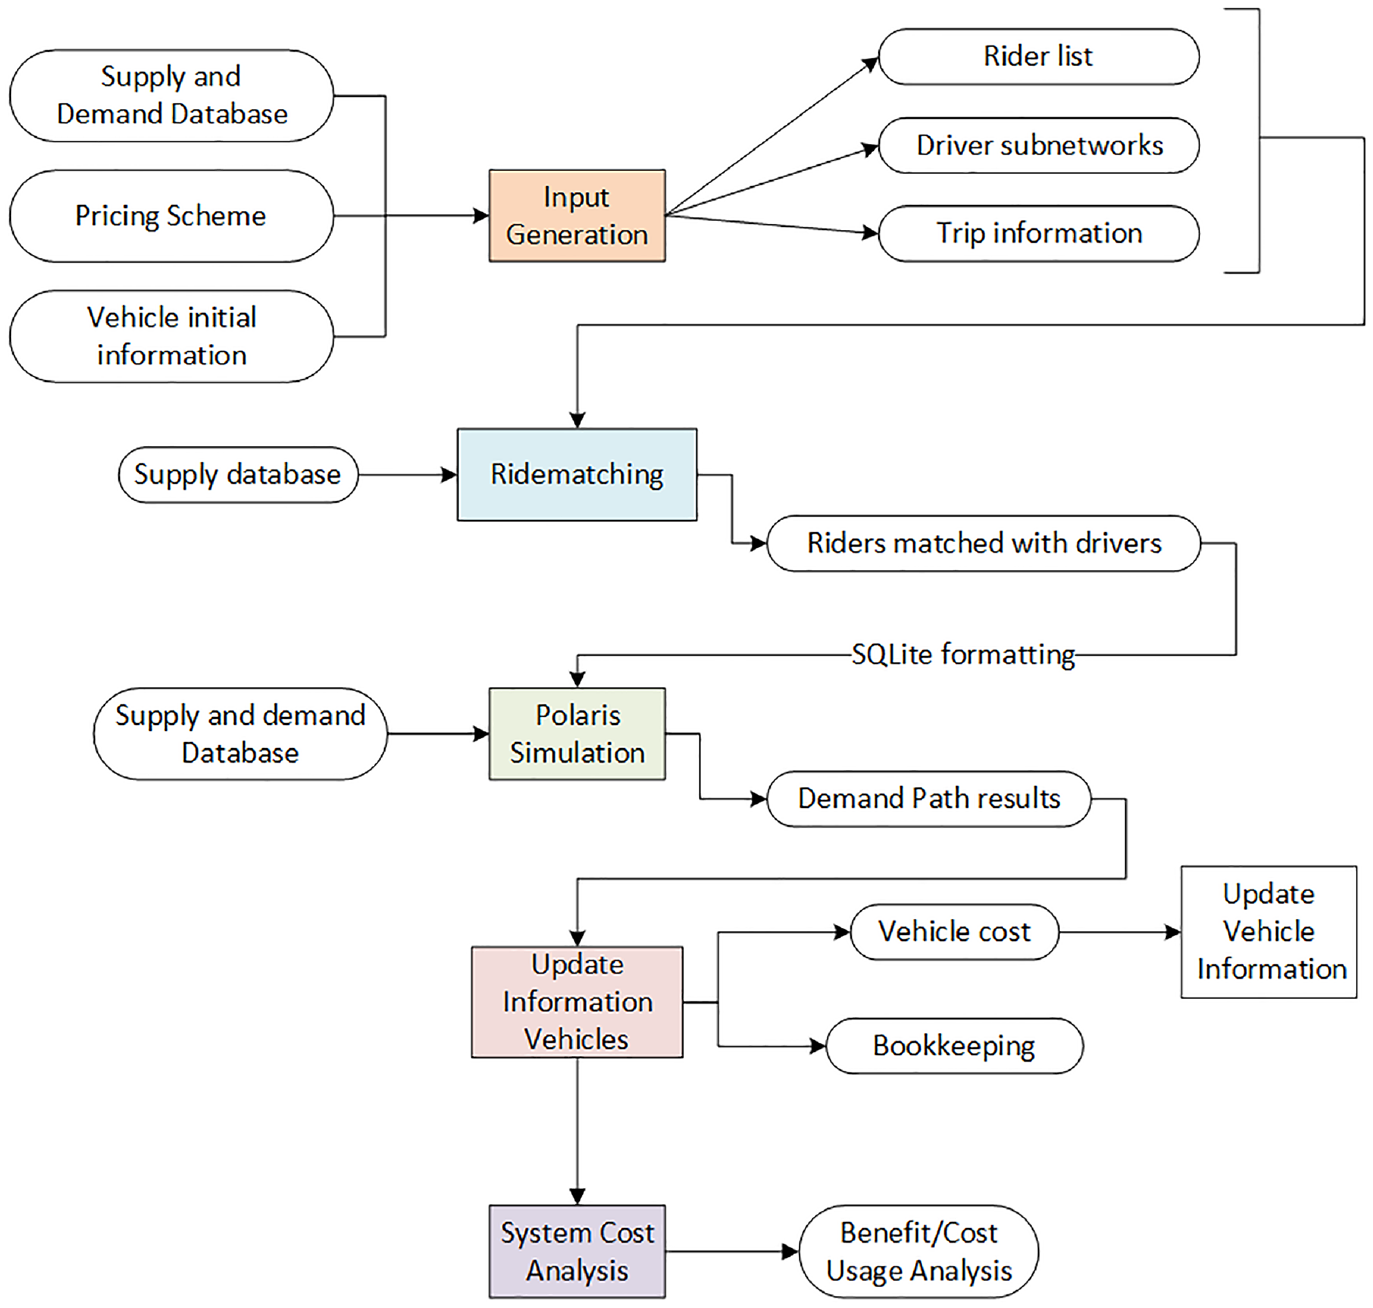
Vehicle-usage-cost-based framework.
This structure is based on a heuristic optimization, where, for each situation, some candidate rules are set and compared. The parameters of each scenario are analyzed to improve the rules and determine what kind of operation is optimal for each shared system considered. All the elements of the framework are coded and/or integrated using Python. The supply and demand databases are analyzed in SQL format. The processing of the information about the agents and their trips, and the matching algorithm, are carried out in Python. The mobility simulation system is coded in C++ and integrated into the Python code. Finally, the framework updates the vehicle information and finishes with the system analysis in Python as well.
This framework can be applied to different situations depending on the characteristics and specifications of the mobility system in each case, and the process can be summarized in the following steps. First, it analyzes the trip and network information from the demand and supply databases considered, and includes the pricing scheme considered for that mobility scenario. This information is fed into a ride-matching algorithm, where riders are matched with drivers following an optimization to improve the system. Then, the new trip information is formatted to be used in an agent-based simulation called Polaris, where we obtain all the results from the mobility scenario. Finally, we use this new data to update the characteristics of vehicles for the following ride matching and step of the optimization, and we analyze the benefit and cost of the mobility system, given the usage obtained from the vehicles. In the following paragraphs, we further describe the characteristics of each module.
Input Generation
The role of this module is to preprocess the trip and network information to make it suitable for the ride-matching and simulation steps. As it is unnecessary to consider the many inefficient and suboptimal ride-matching alternatives among agents in the network, this module reduces the problem by limiting the size of the relevant network for each system participant, and thus reduces computational time for peer-to-peer ride matching. The technique used is an ellipsoid spatio-temporal accessibility method that reduces the size of the original time-expanded network for each system user, considering reachable spatio-temporal links within their respective travel time windows (algorithmic details can be found at Masoud and Jayakrishnan) ( 16 ). In this process, we generate limited networks for each agent according to the possible nodes they can visit in the network.
Then, we place each person into a subcategory where they can be a part of the ridesharing system without using their personal vehicle (i.e., rider) or choose to use their own vehicle for their trip and might be part of the sharing system to offer rides to others (i.e., driver). We also include the pricing scheme considered for that mobility scenario, which charges agents for using the ride-matching service, as further explained in the modeling section.
The Ride-Matching Algorithm
The information about the trips is fed into a ride-matching algorithm, where riders are matched with drivers following an optimization to improve the peer-to-peer (P2P) ridesharing system. Our analysis is performed on an abstraction of the real network, where origins and destinations are defined by nodes and connected by links, and people travel to develop an activity at a location.
We build a time-expanded network where nodes have time and location aspects. Each node n i is considered as a tuple (t i , s i ), where t i is the time interval during which a user may be located at station s i . In turn, a link can be represented as a tuple of nodes (n i , n j ) = (ti, s i , t j , s j ) ( 16 ). We discretize the study time span into a set of indexed time intervals of a small duration Δt, expected to be 5 min or less (we use 1 min) so that time-dependent travel time matrices can be used for analysis. Every iteration of the process is a different step, and each one of them is connected by the route of the passenger, as we can see in Figure 4.
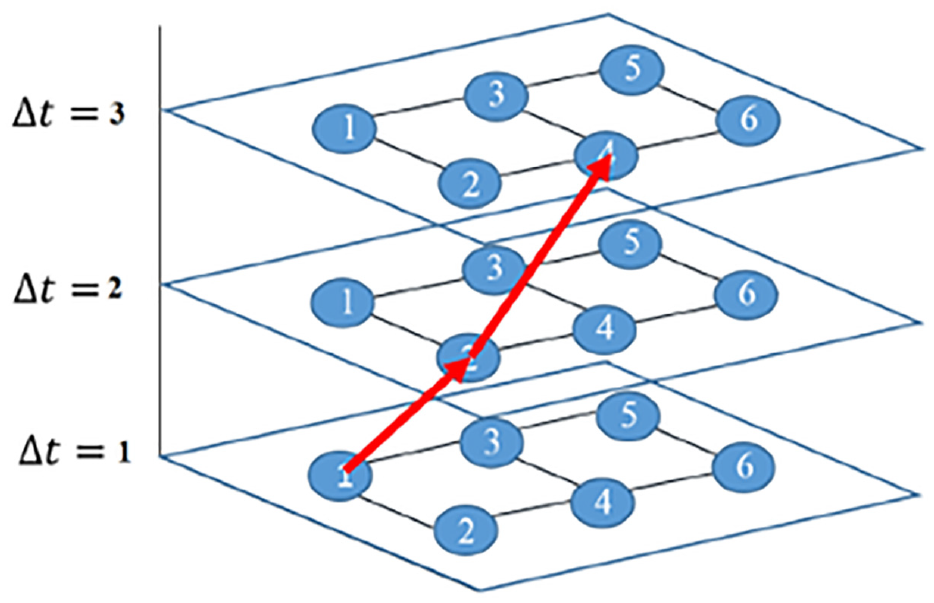
Links on a time-expanded network ( 16 ).
The algorithm used is based on the solution presented by Masoud and Jayakrishnan that mathematically formulated and solved a real-time P2P ride-matching problem with a dynamic programming (DP) approach, matching as many participants as possible ( 16 ). The optimization is solved using an algorithm that takes riders to their destination by optimally routing drivers. These itineraries have to comply with the characteristics of the vehicles and the travel specifications of the riders, and the algorithm optimizes the matching rate of riders to drivers. The full description of the original algorithm is in Masoud ( 16 ).
Ride-Matching Solution Algorithm
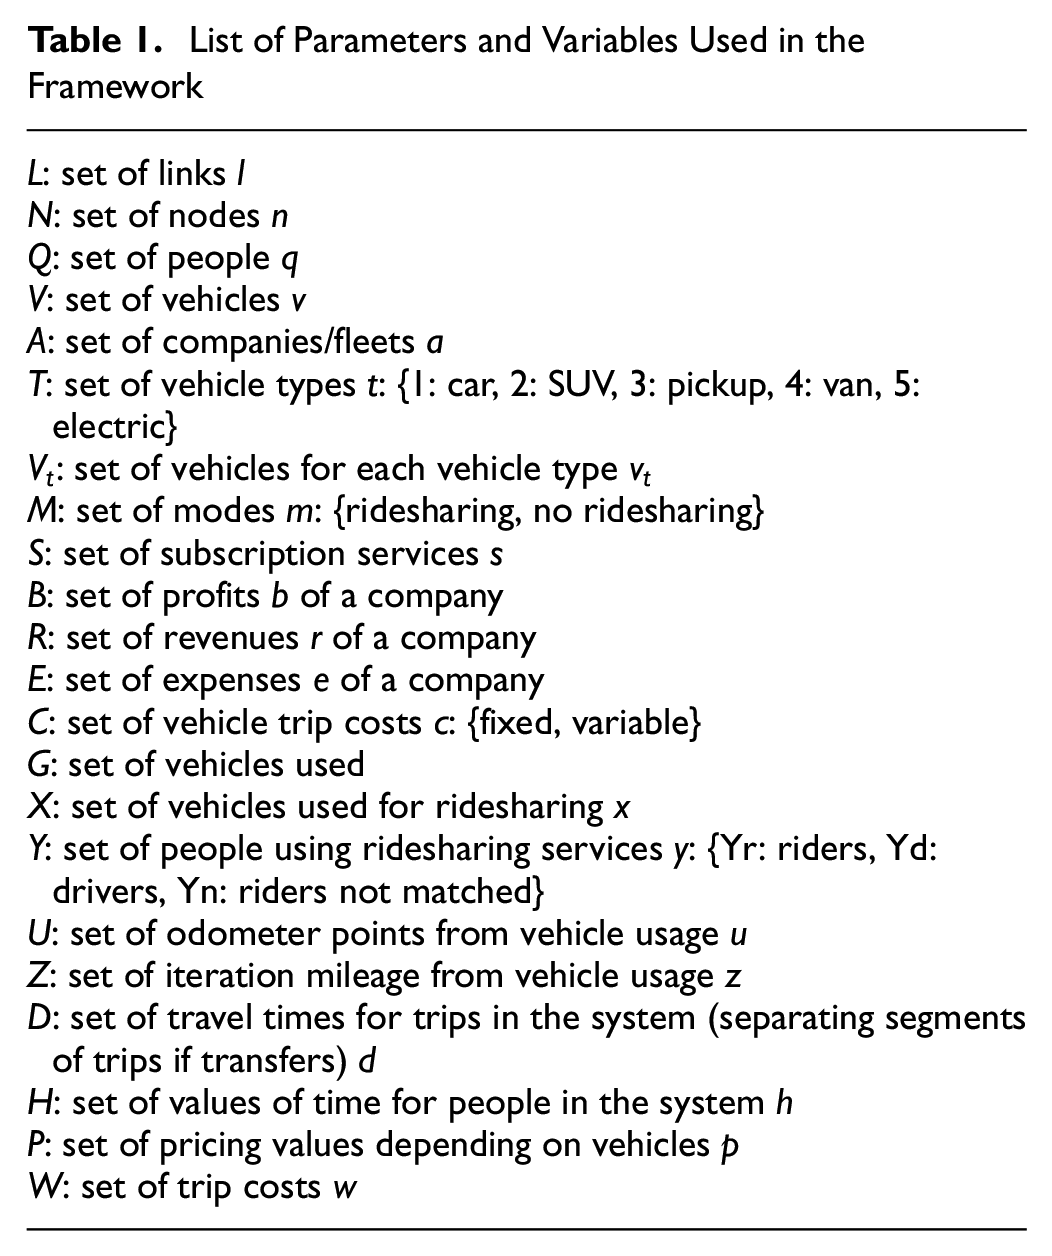
To analyze the interactions between the elements of our framework, we modified the original ride-matching problem to account for the vehicle usage cost function that considers the increased usage of vehicles and their heterogeneity in characteristics and costs. This function is used to optimize the cost of the transportation system in the new scenarios. For that purpose, it is implemented as an objective function in the ride-matching routing algorithm, changing the maximum matching objective in ( 16 ). The description of the parameters of the solution and following formulation can be observed in the Table 1:
List of Parameters and Variables Used in the Framework
The presented ride-matching algorithm provides the best trip (lowest trip cost) for each user of the sharing system according to their necessities, characteristics, and the possibilities of the network and services available (Figure 5). During the matching process, we assume that users of the service want to initiate their trip with their alternative from the shared mobility service as soon as it becomes available and within their flexibility and time restrictions. Most of the modeling of this process is done offline, where we use the information from the demand and supply databases to generate the framework for the sharing mobility provider system, and then draw conclusions on how it would operate. The ride-matching process intends to simulate a real-time process where requests are considered according to the trip starting time as described in the algorithm section of the framework. The algorithm prepared for this purpose is adjusted for each scenario depending on the requirements of the shared system. It is modified to reduce the computational time needed, but efficiency is not the main focus of the work presented.
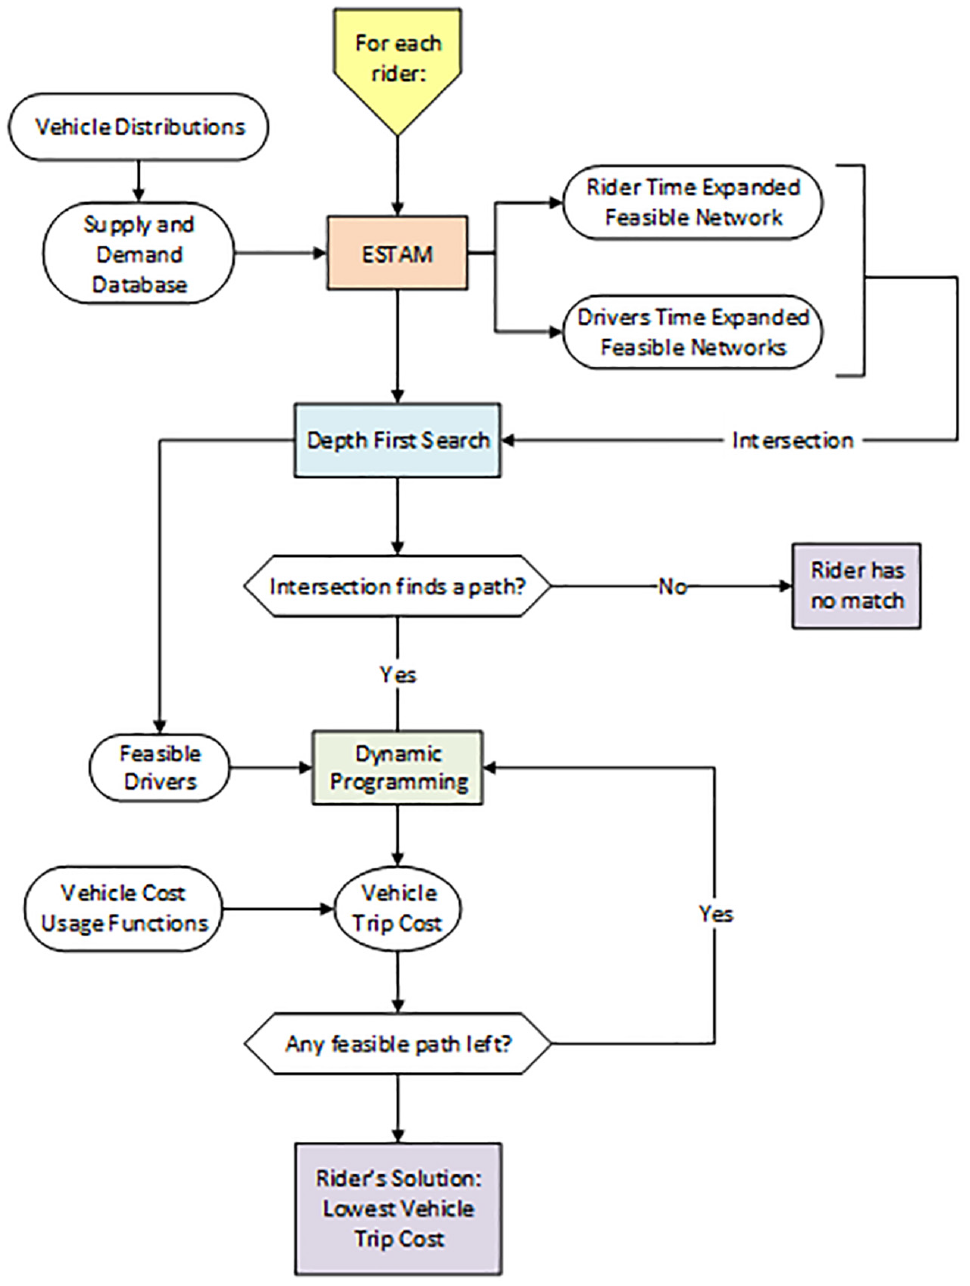
Ride-matching solution algorithm scheme.
In the solution algorithm presented (Figure 5), the entire process is followed for each rider to find the best solution, defined as the lowest-cost trip. We first select a rider with the earliest departure time, and we conduct a depth first search (DFS) on their reduced-size time-expanded network to find whether any driver can serve their entire itinerary. If none is found, we can discard that rider assuming that there is no match for them and that they will use their own vehicle. If DFS finds paths that are spatially and temporally feasible, we use a DP method to consider all the feasible alternatives and find the best path for that rider, defined as the minimum vehicle trip cost (Equation 2).
This trip cost (W) is obtained by considering the vehicle usage cost function of each alternative at that moment of its life cycle, and their trip distance (z). We select that match as the rider’s solution and repeat the process with the rest of the agents considered to be riders. This vehicle cost function adjusts the cost per mile depending on the vehicle’s usage status, and is updated after each use. With this improvement, we can include a more realistic minimum cost itinerary and also capture the effects of having vehicles with different characteristics and usage stages of their life cycle.
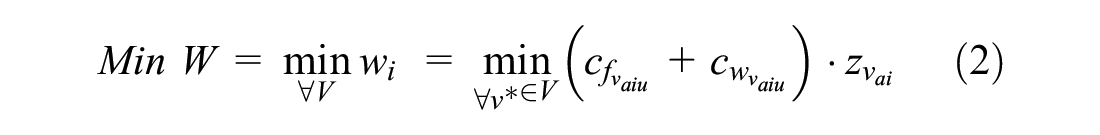
for the set of possible vehicles i (v*), which have mileage usage u, from fleet a.
Agent-Based Modeling (Autonomicity)
Currently, there is no mathematical model that can analyze the new changes in the transportation situation. To consider the increase in vehicle usage and how a new cost model could affect the decision-making, we need to simulate different scenarios for these vehicles and a demand that could be useful for this system to observe these changes.
The tool selected for this purpose is an agent-based transportation simulation modeling software called Polaris, developed by the Argonne National Laboratory ( 17 ). This type of simulation has the advantage that users and vehicles can be created as agents with their own characteristics and present individualized information to observe how their transportation patterns change depending on the scenario. It integrates transportation networks and demand generation, and it is an open-source program that also has specific tools for traffic flow simulation, geographic information systems, and result analysis (7, 14, 17– 19 ). This means that we can include our optimization framework within a Polaris-based platform and see the changes in the system’s performance through simulations.
Polaris implements an integrated travel-demand and network operations agent-based microsimulation system, which allows us to overcome some limitations of traditional aggregated transportation models. It includes demand estimation, network simulation, and Intelligent Transportation Systems (ITS) operation components, which are implemented as agent capabilities in the general framework. Some of the advantages of Polaris over other agent-based models are: it has the capability to model large scale networks in a computationally efficient manner; it is a completely integrated agent-based model where agents persist throughout the simulation instead of having agents operating in shared memory space; and it has a software development kit that creates an open source development environment, where we can create and integrate new mobility elements ( 17 ).
The research team at the University of California, Irvine (UCI) is currently developing an agent-based simulation platform for modeling a comprehensive set of future mobility paradigms (rideshare, carshare, AVs, micro-transit, etc.). An important element of the system is an ownership paradigm called “mobility portfolio,” which allocates each traveler in the system with a portfolio of mobility options with associated prices, which are then expended by the driver ( 20 ). Named “Autonomicity,” the agent-based platform is currently being developed based on the network of Irvine, CA. The network uses current demand levels for travel desires and includes activity generation capabilities that are based on the California Statewide Travel Demand Model.
In this framework, the optimization includes feeding the Polaris simulation with the shared trips obtained from the ride-matching algorithm, named as shared mobility modules: SAVs, micro-transit, and mobility portfolios. In future steps of this research, we will use our ride-matching algorithm, which has determined certain fixed inputs to be used from those types of modules. Because of that, we consider the implementation of the subsystems as a part of our optimization, to be used as inputs for the ride-matching algorithm, and not directly to Polaris.
Vehicle Update Module
The next step of the framework consists of the data management of the results obtained from Polaris. This research is based on the increased usage and costs of vehicles; thus, we would obtain the usage information of the vehicles on the system for each scenario and update the information that we already have. The process of updating information includes keeping track of the cost and usage information of all the vehicles in the system, not only the ones currently used in each iteration of the framework, but also the ones that are not. This second group of vehicles might have been used in previous iterations or will be used in later iterations of the process. As the focus of this framework is on the mobility provider and its vehicles, we also created a bookkeeping system that stores the usage of every vehicle on each iteration and updates the cost as vehicles are used. This information will be used in the following step, where we analyze the benefits and costs of the system.
System Cost Analysis
The last module of this framework analyzes the interactions between the agents and the costs derived from the simulation. It allows optimizing the system at a higher level based on the point of view of the ridesharing provider. We consider a pricing scheme associated with the use of the vehicle in this system and the benefits and costs associated with the user’s mobility. We analyze the fleet and scenarios that give better results, and the impact of using the vehicle trip cost usage function to obtain a better-performing transportation system, which not only considers the increasing use of vehicles but also its associated costs.
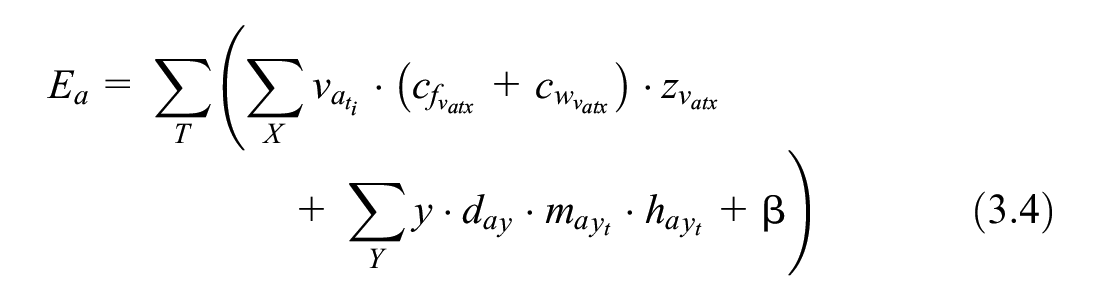
For any company considering (a) acting as a ridesharing service provider, we can analyze their profitability by subtracting the expenses (costs derived from providing the mobility service) from their revenue obtained from riders using the system. The expenses come in the form of costs derived from using the vehicles and travel time to pay the drivers (Equations 2, 3.1–3.4). Here,
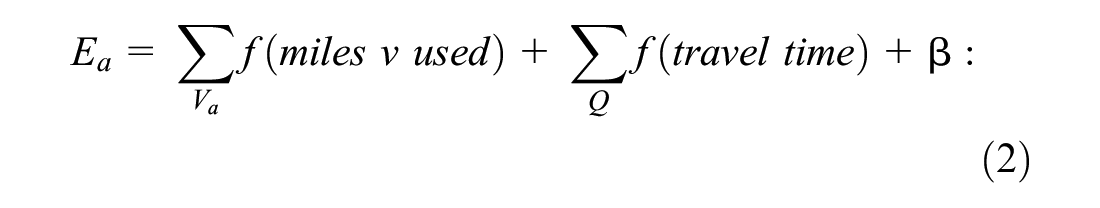
where we have the costs of the vehicles used for ridesharing (f[miles]) as a function of their cost function at each moment, which is based on their life-cycle mileage at the moment and the miles of the shared trip,
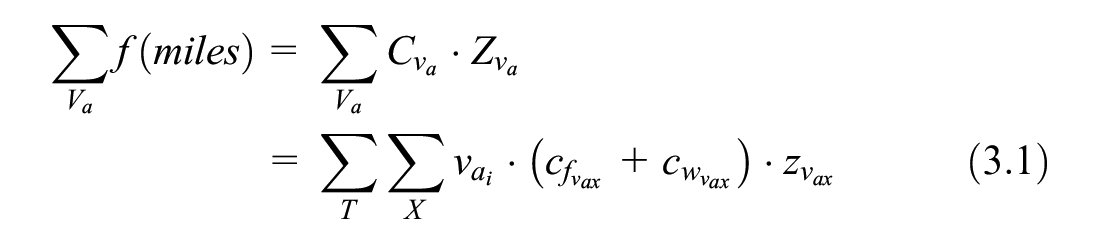
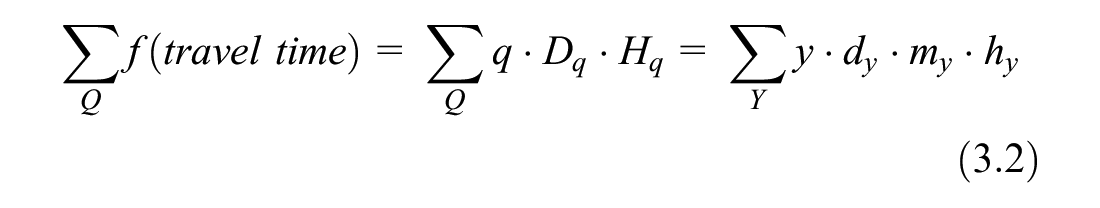
the labor costs (depending on the travel time) as a function of the driver and the shared trip (travel time and value of time),
and the costs of the riders not being served (in the set of riders not being matched Yn), which is a function of their cost of their trip measured as their vehicle usage and their travel time as a driver.
If we combine the elements, we can obtain the total expenses:
Revenue is defined as the sum of all the income from the service provided. This can be linked to the mobility portfolio scenario, where we can introduce plan payments. In that case, users pay a certain amount to use the mobility service for a period of time, with limitations on the number of hours for each mode. In this research, we focus on the increased use of vehicles, and, as such, we would work with a limited form of payment where riders pay for each trip service that they are getting
Pricing Scheme
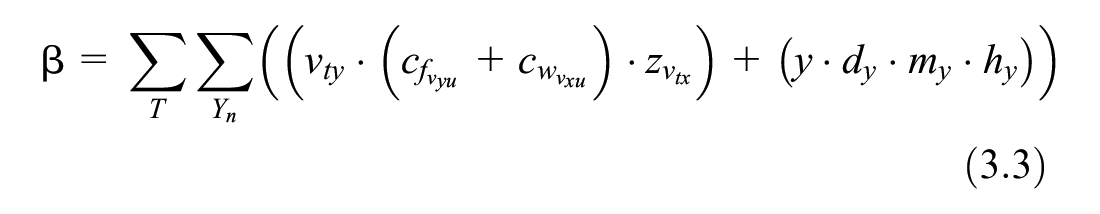
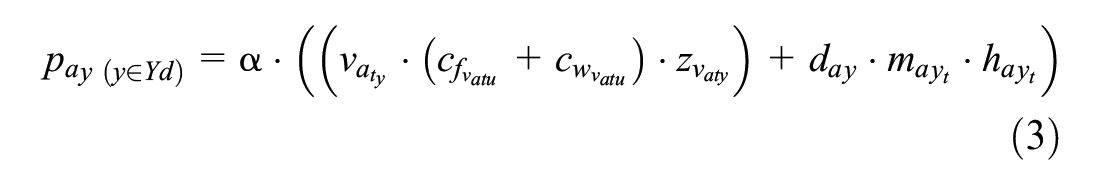
We introduce the idea of a mobility sharing provider that organizes services between potential riders and drivers. The interactions between costs and benefits are considered from the point of view of the company in charge of that service. The revenue is obtained from a pricing scheme associated with the cost of using the shared vehicles. It consists of a parameter that weights the costs of using the service (measured as vehicle usage and labor costs) and increases revenue accordingly (Equation 3). This parameter is formulated as

where
To include the importance of an interaction between pricing and demand, we also consider an elasticity of the demand as a function of
The number of riders in the system is obtained as a linear function of the profit parameter. Then, the rest of the agents who want to be part of the system, but not the riders, are considered as potential drivers. This model is adopted for the simplicity of the system; however, we noticed the possibility of including more complex relationships, which we would expect to yield similar results. The profit is obtained from the difference between revenue and costs, and we will analyze the interaction between the different values of
Results, Interactions, and Scenarios
Up until now, we have described all the tools needed to generate a model and analyze the interactions between the elements in new transportation systems. We have the platform for simulation, which allows us to obtain a more accurate cost of each vehicle based on the resulting usage, even if most of the studies as of now are based on current information along with common-sense hypotheses. The framework is designed to consider new mobility systems. With the objective of focusing on the interactions of elements of the framework, we present a simplified scenario where we focus on a subscription mobility service scenario through a ridesharing system in a rectangular network. This allows us to focus on the impacts of considering new ownership and subscription paradigms through new life-cycle cost functions, and we minimize the contextual effects of more complex scenarios.
For the test study, we created a 10 by 10 node symmetrical network that can be used as an example for future zones of bigger networks. All 100 internal nodes are considered traffic analysis zones, which can generate traffic demand and are separated by 1 km. Then, we considered 100 agents with their origin and destination randomly assigned, who could be interested in changing their vehicle or thinking about initially adopting the ridesharing system, or maybe even not buying a new one. The trips are generated to simulate the morning peak commuting transportation of the network and are also timely randomly distributed.
To analyze the impact of the cost function, we proposed a ridesharing system in which a mobility company manages the trips and the users. We divided people into two groups: (a) ridesharing drivers (i.e., those who are willing to share empty seats in their vehicle while traveling) and (b) ridesharing riders (i.e., those who are willing to use their own car or travel in others’ cars’ empty seats). We randomly selected people as either a ridesharing driver and a ridesharing rider, and the rest of the unselected people traveled the network with their own vehicle.
This study considers four different types of vehicles—conventional vehicles, SUVs, pickups, and vans. We also randomly set each individual’s vehicle type and initial mileage according to the distributions obtained from the NHTS. Using the cost function and the variables considered, we provide a cost for each vehicle type per mile. With that information, we conducted the ridesharing scenario.
In this study, travel times are assumed not to be affected by the performance of the shared mobility system, as it is still not a very large network. Travel times are used, but we are not looking at those changes because we consider static travel times on the links for ride matching. We present illustrated studies from an idealized case, where we want to show the interactive effects between pricing and ridesharing, when a proper optimal ride-matching algorithm is used.
Profit–Pricing–System Interaction
The process of analyzing the interactions between profit, pricing, and the system is based on the formulation presented in the ride-matching solution algorithm and system analysis. We consider a different scenario for each value of the profit parameter, which goes between zero and three, discretized to one decimal. This value gives us the proportion and the number of riders and drivers considered. Then, for each value of the profit parameter, we run the entire simulation based on the initial information on the vehicle and trip distributions. The agents develop their trips, and we analyze the information and the changes with vehicles’ usage. By including the vehicle usage cost function, we can obtain more accurate interactions and analysis from the simulation. In particular, this has the advantage that we can start to include a life-cycle control of vehicles, which would be very useful for more intensive mobility options, such as AVs’ systems.
Given the variability of the results for each case resulting from the selection of agents, we considered an iteration variation scheme that reduced the number of iterations needed to get stable results. As a conclusion, each simulation is the result of averaging the results of 10 iterations with the same initial information and a different set of riders and drivers. We obtain the costs of using the vehicles for the users and the related costs of the company, and then, we calculate the revenue and the profit for the service provider. With that information, we can compare and analyze the interactions of a different pricing with the profit of the company.
After running this framework and analyzing the results from all the scenarios, we can present the most important results and interactions of the different elements. We can observe that profit is always negative for
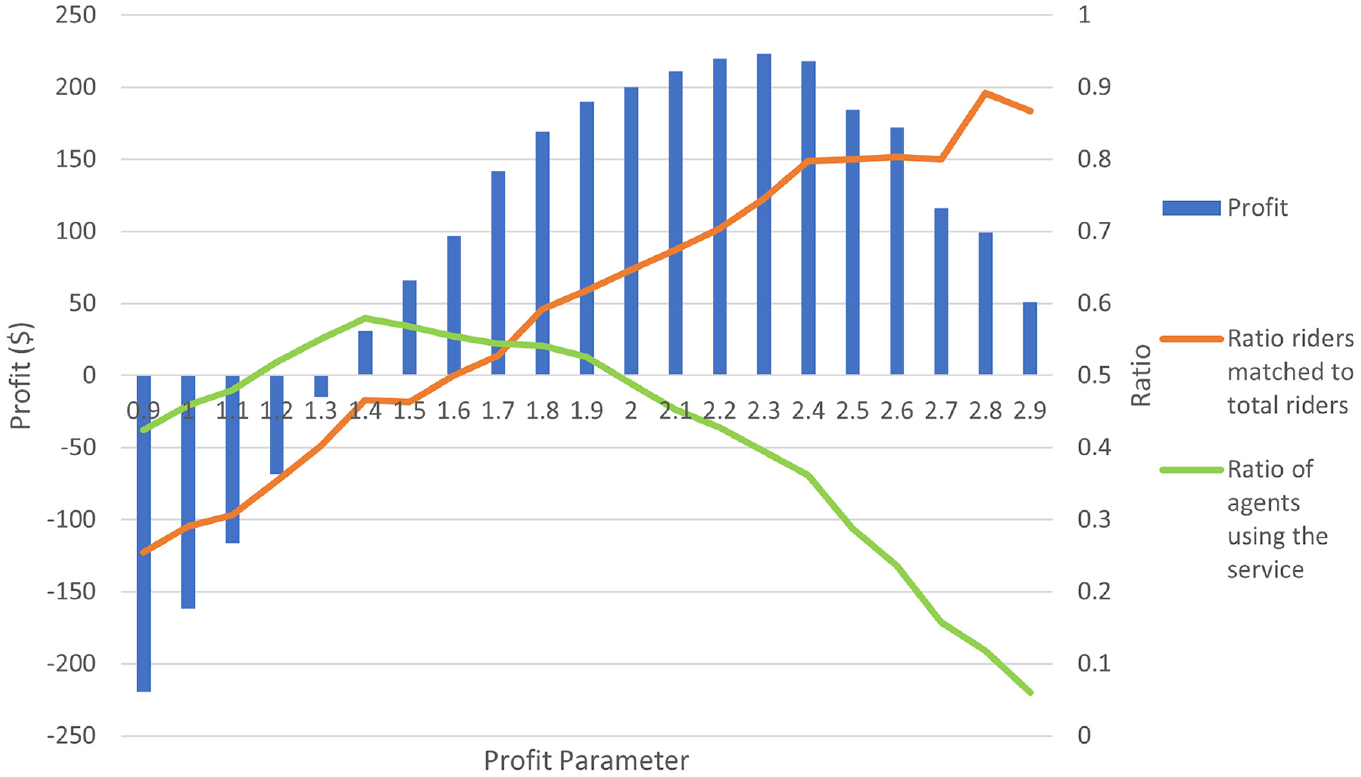
Profit distribution as a function of the profit parameter and ratio of agents and riders.
In addition, if we compare the percentage of agents using the system (the number of riders and drivers matched divided by the total riders and drivers participating), we can observe a curve for the percentage of agents using the ridesharing system (Figure 6), indicated in green. In this case, the optimal value is 1.4–1.5, where we have the same number of riders and drivers. Before this point, there would not be enough drivers to serve all the riders, and, after that, we find the opposite, where there might be too many drivers for the set of riders and only a few drivers being matched. We can also compare the ratio of riders matched with potential riders (shown in orange in Figure 6). This ratio is very low for lower values of
We can obtain the optimal pricing scheme for such a model from the point of view of a private company that has the objective of maximizing revenue, but a lower ratio of agents using the system. We can also consider a case for optimal agent usage at 1.4 that has lower profitability, which could be the case of a public company. With this type of analysis, interactions, and results, we can see how we can obtain and analyze different situations depending on the focus of our management system, such as increasing the number of users of the ridesharing system while still considering profitability.
Conclusions
In this paper, we focus on a framework to model new shared and/or autonomous mobility systems with the corresponding supply, demand, cost, and price interactions. The research relates to the new price-cost paradigms given new ownership schemes through subscription services and the associated changes in mobility and vehicle usage patterns. We have also presented the methodology to analyze the complex interactions between agents, using ride-matching algorithms modified for the purposes and an agent-based simulation. We also provided test results of a network with initial considerations of the cost per mile of usage of vehicles in different scenarios, focusing on ridesharing mobility systems with life-cycle costs and pricing optimization.
Furthermore, we considered a representative group of different types of vehicles and used the agent-based modeling platform Polaris, which can simulate the mobility and vehicle usage in the test network. From the test results, we notice that, depending on who is making the decisions and what the objective is, we could have different potential outcomes. The framework is capable of modeling both the public administration controlling a fleet of SAVs, minimizing the cost, and offering a good mobility option, or private companies trying to minimize the cost and maximize their revenue.
While the formulation and vehicle types allow for different scenarios of SAVs and new mobility systems, the results presented are based on the benefits of the ridesharing of vehicles between users of the system. Considering mileage-based vehicle type costs, we can optimize the performance of the system for different pricing situations and include their lifetime situation. Following studies are focused on the interactions and implications of fleets of AVs and carsharing, achieving higher efficiencies, and considering new ownership and pricing paradigms. The cars would be owned by a fleet manager, and the mobility service providers would belong to another company. This situation would be especially important for mobility providers more focused on having fleets of only AVs, and the focus of future research.
We have focused on situations where SAVs could cause improvements, and we can achieve this by creating fleets of SAVs that can be much better optimized. By considering their cost, the number of vehicles needed to meet certain demand can be reduced, which would increase the usage of these vehicles (their mileage). As a result, the life of the vehicles being used would be drastically reduced, which is a detail that current optimization models do not properly account for. By creating a cost function for each vehicle, we can consider the individual characteristics and update them as they are used. This brings new situations in which we go from a centralized optimization system to a more decentralized situation in which we can obtain information from the point of view of the vehicle. By improving the average cost model and the simulation system, we could have individual optimizations for each vehicle’s operation, where every car would try to get their best mobility solution.
Footnotes
Author Contributions
The authors confirm contribution to the paper as follows: study conception and design: E. Marino, R. Jayakrishnan; data collection: E. Marino, R. Jayakrishnan; analysis and interpretation of results: E. Marino, R. Jayakrishnan; draft manuscript preparation: E. Marino, R. Jayakrishnan. All authors reviewed the results and approved the final version of the manuscript.
Declaration of Conflicting Interests
The author(s) declared no potential conflicts of interest with respect to the research, authorship, and/or publication of this article.
Funding
The author(s) disclosed receipt of the following financial support for the research, authorship, and/or publication of this article: This study was made possible through funding received by the University of California Institute of Transportation Studies from the State of California through the Public Transportation Account and the Road Repair and Accountability Act of 2017 (Senate Bill 1).
The contents of this paper reflect the views of the authors, who are responsible for the facts and the accuracy of the information presented. This document is disseminated under the sponsorship of the State of California in the interest of information exchange and does not necessarily reflect the official views or policies of the State of California.