
Abstract
Measuring public opinion about the quality of transit services is a key factor in understanding and addressing customer dissatisfaction and increasing customer loyalty and ridership. Sentiment analysis using social media—in particular Twitter—is a relatively cheap and potentially powerful complement to traditional survey methods, which are expensive and limited in sample size. This study aims to evaluate customer response to the introduction of Calgary Transit’s MAX routes. We compared customer satisfaction expressed on Twitter with measured service reliability in the form of on-time performance. We also employed a qualitative research approach using content analysis from Twitter to gauge rider satisfaction over several service attributes before and after the service change. A transit-specific sentiment lexicon was developed to support this study using a hybrid approach. This lexicon outperformed generic sentiment lexicons traditionally used in transit studies with regard to both accuracy (18.4%) and F1-score (7.1%). We found that the overall perception of on-time performance from riders using Twitter was similar to the actual performance in the field. This was also observed for one individual route on which stops with poor schedule adherence were linked with negative feedback. This study concludes that combining customer-oriented measures from Twitter with operational-oriented ones would enable transit agencies to make better-informed decisions for planning and operational purposes.
Keywords
Transit agencies dedicate much attention to understanding the attitudes and opinions of their riders to improve loyalty and increase ridership. Customer satisfaction surveys are the primary tool that agencies rely on for this purpose, but these surveys are usually undertaken infrequently, costly to conduct, and typically confined to the scope intended ( 1 ).
A new complementary source for assessing customer opinion that has been gaining popularity in the research field is Twitter, the widely used social media platform ( 2 ). Users post tweets frequently, often in real time ( 3 ), and are willing to express their feelings about their interactions and experience with transit systems. Tweets convey very concise messages because of the imposed character limit, and they can be easily obtained. To date, transit agencies mainly use Twitter to communicate with customers and have not yet harnessed the platform to its full capacity, either because they lack clear goals or a strategy for utilizing it ( 4 ).
This paper examines the use of Twitter as a complementary source of information to customer satisfaction surveys when evaluating customer sentiment toward a service change, with relatively little direct expense for transit agencies. The proposed methodology involves investigating a common service quality attribute—on-time performance—by comparing it with the opinions and sentiments of users on Twitter before and after a major service change. Our hypothesis is that if on-time performance improved, we would expect the sentiment on Twitter to improve as well after the service change. In addition, we assess the effect of a service change on the overall sentiments of transit patrons on Twitter before and after the change for several service attributes. Another major contribution of this paper is the development of a transit-specific sentiment lexicon to improve the accuracy and reliability of the Twitter analysis. We examine our hypothesis in the context of the introduction of bus rapid transit (BRT) routes in Calgary, Canada in November 2018 and an accompanying network reconfiguration.
Literature Review
The analysis of social media sentiment in public transit is a recent but rapidly growing field. Twitter is used as the main source of data analysis because of its relatively large user base and its text-focused nature.
There is an inherent trade-off that comes with introducing increasing amounts of automation and quantification into the analysis of social media posts. Although text mining, semantic analysis, and sentiment quantification techniques allow for the processing of much larger and potentially more representative data sets, they can also limit the amount of nuance and restrict the complexity of the topics discussed and quantified.
Previous research falls in various positions on the manual–automated and qualitative–quantitative spectra. In this section, we highlight and categorize several studies on the use of Twitter for sentiment analysis of public transit, in roughly increasing order of complexity.
Qualitative, Manual, and Semi-Automated Sentiment Analyses
One way to gauge sentiment and satisfaction via social media is to analyze tweets or other posts manually. Typically, this involves reading the content of the posts and manually classifying or coding semantics and sentiments of items to match the goals of either a particular study or a transit agency. Transport Focus conducted such an analysis ( 5 ) of the Network Rail service during disruptions at King’s Cross station in London, comparing their results with the National Rail Passenger Survey and finding similar results between the opinions of Twitter users and the surveys. This suggests that tweets may prove to be a valuable resource for mining users’ opinions. However, after some automation, the study failed to reproduce similar results, achieving an accuracy of only 50% to 60%. This suggests that automated approaches need to be carefully constructed and relatively sophisticated to add value.
Casas and Delmelle ( 6 ) combined a two-step process of data mining and the application of a qualitative-focused structured data analysis to gauge discussion of a BRT system in Cali, Colombia. Quantitative analyses were limited to counting occurrences of words and producing word cloud diagrams. The authors found that the topics discussed corresponded largely to the primary service quality indicators identified in previous literature: delays, service reliability, and coverage, followed by safety and security issues.
Automated Topic Classification and Sentiment Scoring
Sentiment scoring generally requires comparing the words that appear in the sentiment text with established libraries of pre-scored words. One popular example for general English (and Spanish) is the one produced by Hu and Liu ( 7 ), which was used by Schweitzer ( 8 ) to demonstrate the potential of Twitter feeds in comparing the sentiments of users traveling by public transit and those traveling by air. Schweitzer ( 9 ) later extended this analysis with a mix of machine learning and text mining techniques with 82% accuracy with the aim of understanding the general opinions of transit riders. The common set of English words was extended to include transit-specific or currently popular words and phrases to provide a more refined scoring technique. Manual input from the author was required to make the final decision about whether to include words in the set.
Semantic Analyses over Space and Time
Several studies have focused on classifying the topics of social media posts, with a particular focus on how topics vary over space and time. Some, but not all of these studies include sentiment analysis in addition to semantic analysis.
Liu et al. ( 10 ) built an open-source sociotransportation analytic toolbox that measures network efficiency and access equity using General Transit Feed Specification (GTFS), job density, and Twitter data to assess system operations. Sentiment analysis is conducted using convolutional neural networks to classify tweets, and the authors’ focus was on extracting semantic and location information from tweets to place them on a map. The results revealed that many of the complaints originated near downtown areas, and that stops with higher complaint rates were correlated with lower accessibility.
Collins et al. ( 11 ) evaluated the sentiments of transit users on the Chicago Transit rapid transit system, showing that they are more biased toward reacting to negative incidents in comparison with positive ones. The authors relied on a generic sentiment analysis program called SentiStrength, which allows for some calibration in relation to specific sources of data (e.g., blog posts versus tweets) but does not use a transit-specific lexicon. They identified a correlation between service disruptions and large volumes of negative tweets. Osorio-Arjona et al. ( 12 ) analyzed the spatial distribution of feelings experienced by Madrid Metro transit commuters using the geolocation of tweets and urban factors such as population or income. The findings showed many Twitter users live on the outskirts of the urban areas and are mid-income earners who usually tweet when traveling to work. Luong and Houston ( 13 ) developed an interactive tool showing the evolution of sentiments and the topics being discussed in relation to to the different rail lines located in Los Angeles over time. They also conducted word clustering analysis to identify more common themes and transit-specific and Los Angeles-specific terms that could be useful for further lexicon development.
In an approach involving graph theory and network analysis, Hosseini et al. ( 14 ) studied the connections made between users on Twitter and the topics discussed as a community for three different transit agencies found in Canada. The results showed that the networks formed for each agency resembled small-world network behavior, indicating that communities are well connected and these networks are not formed randomly. They also found uniqueness in the topics of discussion for medium-sized networks in particular, and pointed to these as places for further analysis on community opinion. This research was further expanded by El-Diraby et al. ( 15 ) in which a social network analysis, a semantic analysis, and a sentiment analysis were combined to understand how communities’ discussions and sentiments developed over time.
Most of the sentiment analyses above relied largely on generic or mostly generic sentiment lexicons. This means that transit-specific words (e.g., “wait,” or “queue,” or “crowded”) may not be given the appropriate sentiment during the scoring process.
Several studies have addressed transit lexicons more comprehensively, but have not explicitly developed sentiment values for transit-specific works. Hosseini et al. ( 14 ) drew on industry reports and surveys on customer satisfaction to develop a large set of transit-specific terms that were linked with themes such as spatial availability, safety and security, and service delivery. This lexicon was further extended by Kabbani et al. ( 3 ) in their spatial, temporal, semantic, and sentiment analysis of a real-time stream of tweets in Calgary, Canada.
These lexicons can be expanded or developed algorithmically as well. Haghighi et al. ( 16 ) propose using an unsupervised topic modeling approach called Latent Dirichlet Allocation to develop a framework for sentiment analysis with which to capture relevant transit tweets instead of keywords.
Although the three studies above extend the lexicon to include transit-specific terms, they do not explicitly assign sentiment values in a transit-specific way. This is one of the contributions of our study.
Analysis of Specific Change Events
There is only one recent study that has investigated specific changes made to the transit network with respect to social media sentiment. Chang et al. ( 17 ) studied the causal effect of adding new transit stations in Hong Kong on sentiment and user activity on Twitter using the difference-in-differences quasi-experimental method. The authors concluded that the introduction of these transit stations had a positive influence on Twitter activity, which became significant in the long run. The sentiment of users varied depending on the area where the transit station was located, but this was not significant in the long term.
The current body of literature has already established several case studies that have employed Twitter data to measure customer satisfaction in the transit field, and more recent studies have advanced their applicability. In particular, the development of transit-specific sentiment lexicons for more nuanced and focused sentiment scoring presents an opportunity for analysis of policy or operational changes implemented by transit agencies; however, there is a lack of studies in this area.
We compared customer satisfaction expressed on Twitter with measured service reliability in the form of on-time performance before and after the introduction of a major transit service improvement. To the authors’ knowledge, this is the first time a comparison between the sentiment communicated on Twitter and measured operational performance has been undertaken. Moreover, several service quality attributes were identified and evaluated pre/post the service change using content analysis. Another major contribution of this paper is the development of a transit-specific sentiment lexicon to improve the accuracy and reliability of such analyses. This study aims to examine the feasability of adopting Twitter as a complementary source to customer satisfaction surveys with guidelines that align with agencies’ goals and objectives.
Methods
Figure 1 presents the research framework proposed to evaluate a particular service change. It includes the following: data collection from Twitter; customer-oriented analysis of on-time performance and different service attributes (including the development of a transit-specific sentiment lexicon); operational-oriented analysis of on-time performance using GTFS and automated passenger counter (APC) data; and finally, a comparative study between the two analyses for on-time performance. The proposed framework would require several days to execute. The time encompasses the manual labeling and the computational time of the remaining processes.
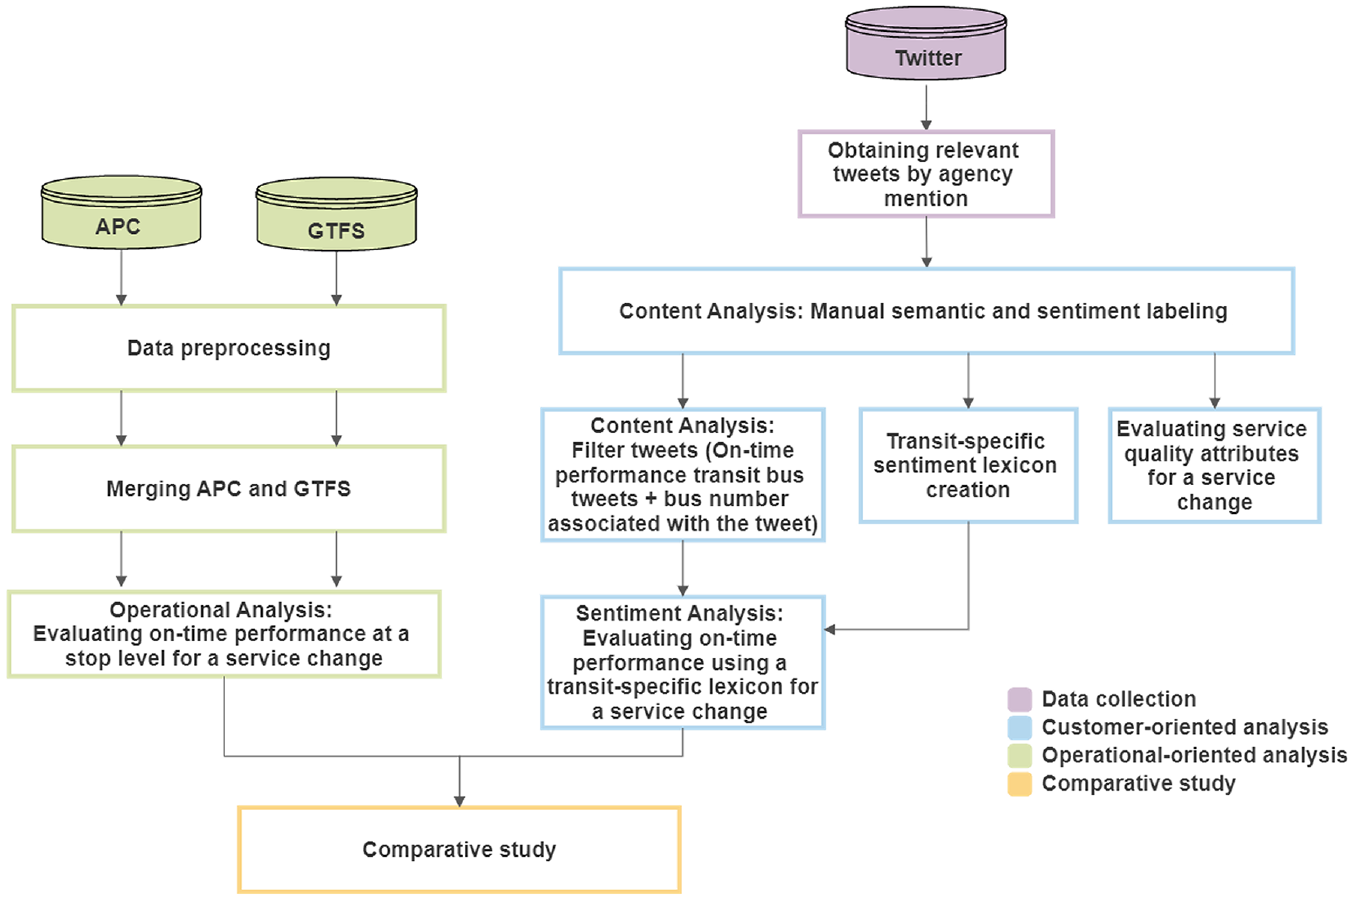
Research framework.
Study Area
Calgary Transit is one of the most used transit systems in Canada, boasting an estimated ridership of around 106.5 million in 2019 as stated by Calgary Transit’s statistics for 2019 (https://web.archive.org/web/20210119032321/http://www.calgarytransit.com/about-us/facts-and-figures/statistics). It also has a strong social media presence on Twitter, where it actively posts service updates or disruptions and replies to customers’ questions and concerns. Calgary Transit’s network consists of two light rail transit lines called CTrains and 169 bus routes comprised of standard bus routes, express routes, and BRT routes.
A major overhaul of Calgary Transit’s bus network was implemented on November 19, 2018 because of Calgarians wanting a city with convenient, affordable, and accessible transportation options. Three new BRT routes were introduced called MAX Transit: MAX Orange (Route 303); MAX Teal (Route 306); and MAX Purple (Route 307). A total of 48 routes were either removed, added, or adjusted, and we will call these treatment routes. One hundred thirty routes remained unchanged, and we will call these control routes. The stated goal of this service change was to deliver a transit service with MAX Comfort, MAX Convenience, and MAX Connections ( 18 ). Because of the large scale of the service change, a considerable amount of feedback ensued on Twitter, making it an ideal case to study.
Twitter Data
Historical tweets can be extracted using the Python module twitterscraper ( 19 ), which overcomes limitations imposed by Twitter’s application programming interface. Although the module only captures original tweets and not retweets, this is not expected to have an impact on the results because most retweets are concerned with news and announcements that are not related to customer satisfaction and are classified as noise. We considered a four-month period straddling the service change, from September 20, 2018 to January 17, 2019. The period was inspected to make sure there were no other service changes that might influence the outcome. To ensure that only transit-relevant data about the Calgary Transit service were captured, only original posts (not replies) made by users (excluding Calgary Transit) that mentioned @calgarytransit were extracted, totaling 4,627 tweets.
Customer-Oriented Analysis
Content Analysis
Content analysis examines media language (e.g., newspaper articles, online forums, and social media platforms) to interpret the tone and underlying meaning of the text being analyzed ( 20 ). This technique was used to capture bus-related tweets and assign them a sentiment classification (positive, negative, neutral) and semantic labels (service quality attributes). An extensive list of service quality attributes was constructed so that at least one semantic tag could be assigned to each tweet. The European Standard EN 13816 ( 21 ), the Transit Cooperative Research Program Report 88 ( 22 ), and the 2016 Calgary Transit Customer Satisfaction Report ( 23 ) were used as a basis to identify service quality indicators. The list was then extended with a manual examination of the tweet themes. This resulted in the identification of 18 different service attributes: travel time; on-time performance; transit integration; customer service; accessibility; capacity availability/crowdedness; cleanliness, safety and security; ride experience/comfortability; service information availability; maintenance; service disruptions; temporal availability; service availability; external nonservice factors; fare; fare collection; and overall/general. The classification and labeling process of tweets is shown in Figure 2.
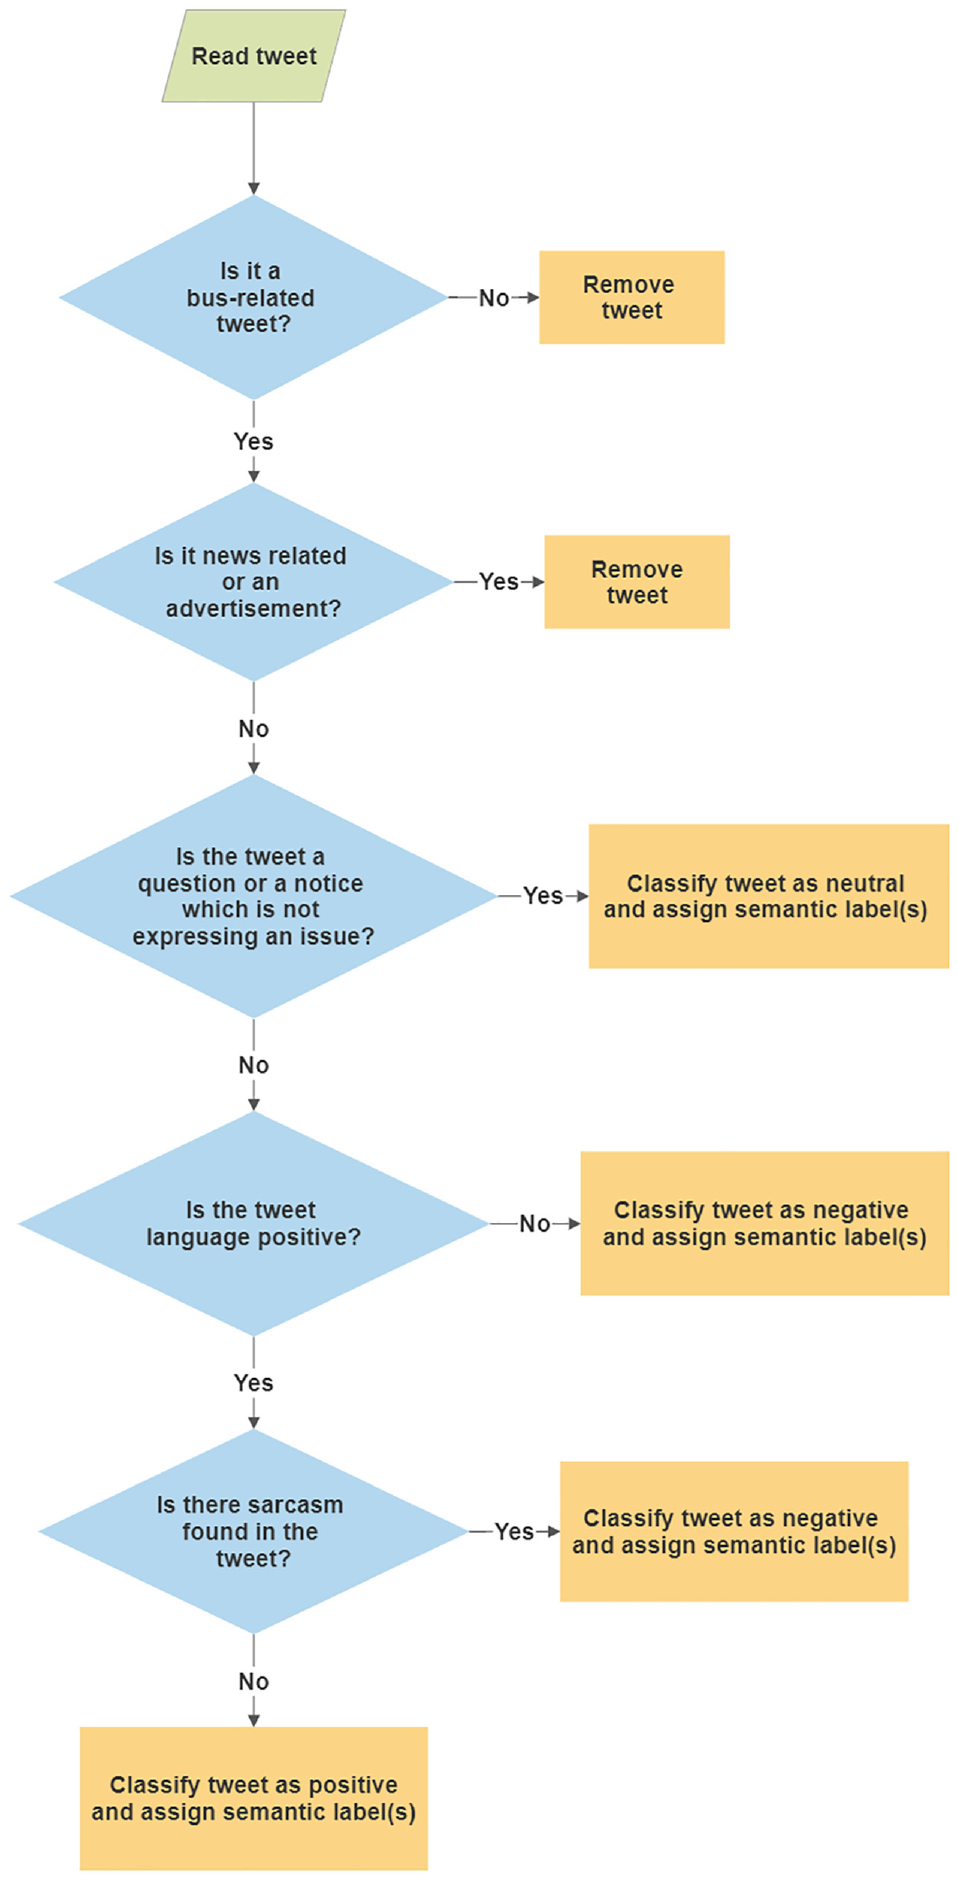
Classification and labeling process of tweets.
We employed control measures to minimize the introduction of system error into the analysis. Days with unplanned service disruptions (e.g., major blizzard) could cause major disruptions to transit operations. Such days would usually see a significant increase in tweets about the disruption ( 14 , 15 ), which would unfairly influence riders’ perception of the service being delivered. Other types of days that would result in similarly biased views about the service include days with irregular service operations (holidays) and days in the initial transitional period (hiccup period). Therefore, we have identified and removed these days to eliminate bias and only considered normal operation days. Unplanned service disruption days were identified by using a box plot to detect outliers falling beyond the upper limit (days with a high number of tweets), and these were manually checked afterward to confirm whether there was a disruption. Figure 3 depicts the time series trend for the counts of tweets about buses before and after the service change. Outliers were any points above the maximum score (upper limit of a box plot shown as the green dashed line), and these were October 2, October 3, October 9, and November 5. Manual investigation revealed that these outlier days had inclement weather, further justifying their removal because they contain a high volume of tweets about a specific subject instead of a baseline set of tweets containing general sentiment.
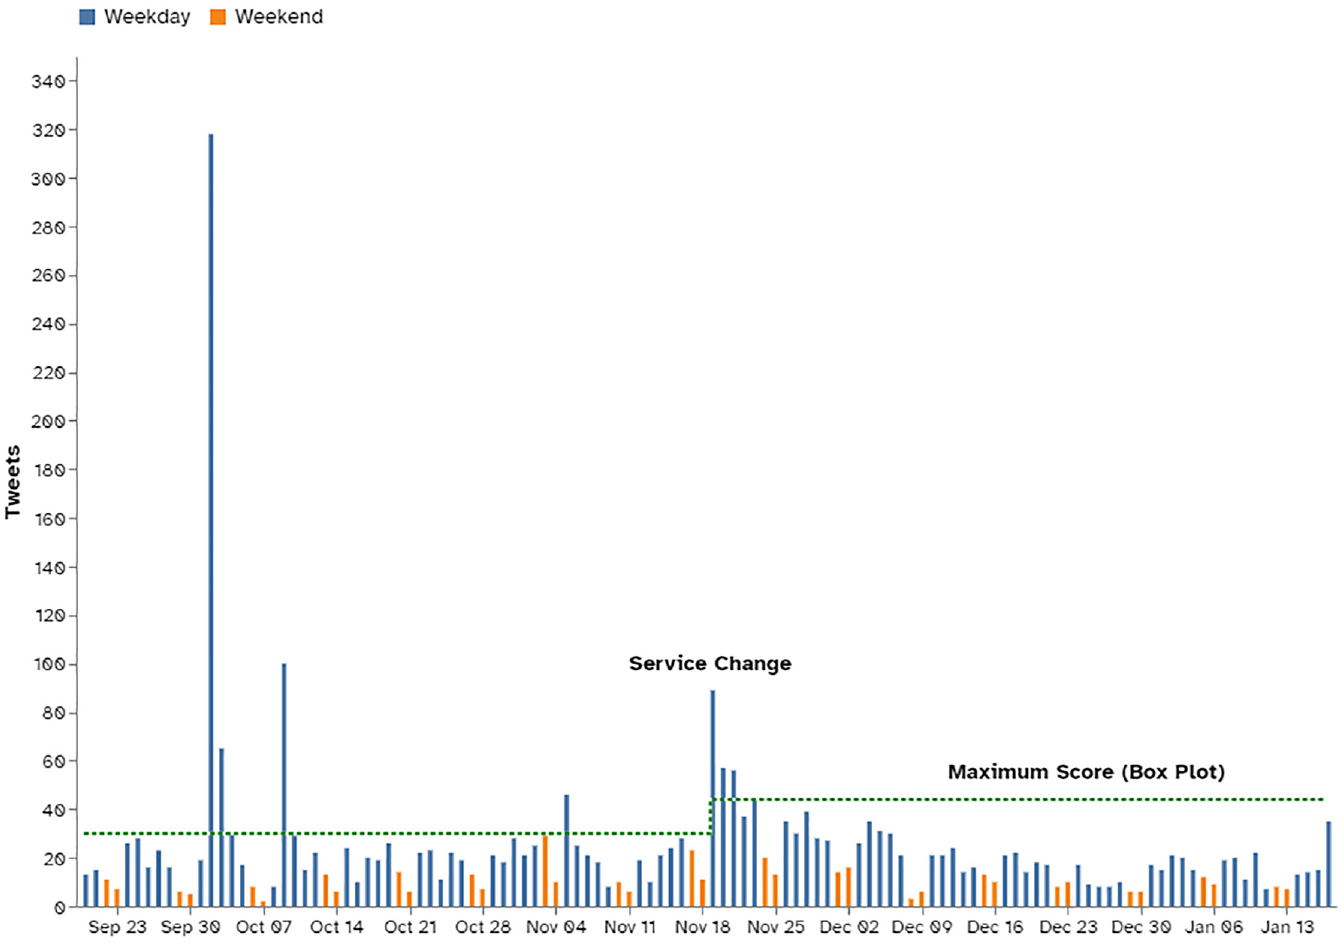
Time series of bus tweet counts before and after the service change.
The time series trend for the counts of tweets about buses after the service change is also shown in Figure 3. An initial ‘transition phase’ occurs after the introduction of the service change from November 19 to 23, after which the volume of tweets falls below the acceptable maximum volume (upper limit of a box plot shown as the green dashed line). Tweets on these transition days were also removed along with tweets on Christmas Day, December 25 and New Year’s Day, January 1, which were the only holidays during the analysis period. This resulted in 3,169 tweets being used in the analysis.
Transit-Specific Sentiment Lexicon
Traditional assessment of sentiment or customer satisfaction via social media employs a generic sentiment lexicon in the transit domain. Several authors have acknowledged that these types of generic lexicons are context dependent and can have a severe impact on the accuracy of the sentiment analysis if not used for a suitable topic ( 3 , 5 , 15 ). To improve the accuracy of the transit sentiment analysis, we used a hybrid approach to develop a transit-specific sentiment lexicon, adopting different techniques from recently conducted research on domain-specific sentiment lexicons ( 24 – 27 ). The process for developing the lexicon and the order of magnitude of time for each step are summarized in Figure 4.

Transit-specific sentiment lexicon development process.
Data Collection and Preprocessing
A subset (1,844 tweets) of the total tweets (3,169 tweets) initially collected for this study between October 19, 2018 and November 18, 2018, and between December 1, 2018 and December 31, 2018, was used to develop the lexicon. This was done to keep the learning size manageable with a reasonable number of tweets that would not require reconfiguration when the analysis dates were eventually extended to examine more tweets. This subset of tweets had an 80:20 train/test split ratio, in which the training set was used to build the transit-specific sentiment lexicon and the test set was used for performance evaluation. Tweets were cleaned to remove noise and inconsistencies so that useful terms could be isolated. Hyperlinks were removed, HTML characters were converted to ASCII format, accounts mentioned were removed, and punctuation and contractions were removed. Word tokenization (splitting a tweet into individual terms) was conducted using the Python library Natural Language Tool Kit (NLTK) ( 28 ). We also corrected spelling and carried out sentence parsing using NLTK. Finally, we removed stop words (such as “a,”“or,”and “and”), the names of transit stations and stops, words with two characters or fewer, and non-English words.
Lexicon Generation
We adopted a dictionary-based method to generate our transit-specific sentiment lexicon. This approach requires a starting list of sentiment words called a seed list, which was created using a corpus-oriented approach capturing only verbs, adjectives, and adverbs, because they are associated with a sentiment value ( 29 , 30 ). These words will be referred to as corpus-captured words. Typically, a thesaurus is used next to extend the seed list of words; however, based on manual inspection, terms from conventional thesauri would rarely be used in transit-related tweets. Instead, the seed list was expanded by collecting other word forms of the corpus-captured terms, excluding nouns, using a Python library called word_forms ( 31 ), which obtains these word forms through a dictionary. These words will be referred to as additional captured words. Finally, a rule-based approach, as shown in Figure 5, was used to convert the part of speech (POS) labeled by the word_forms library to match the NLTK library labeling.
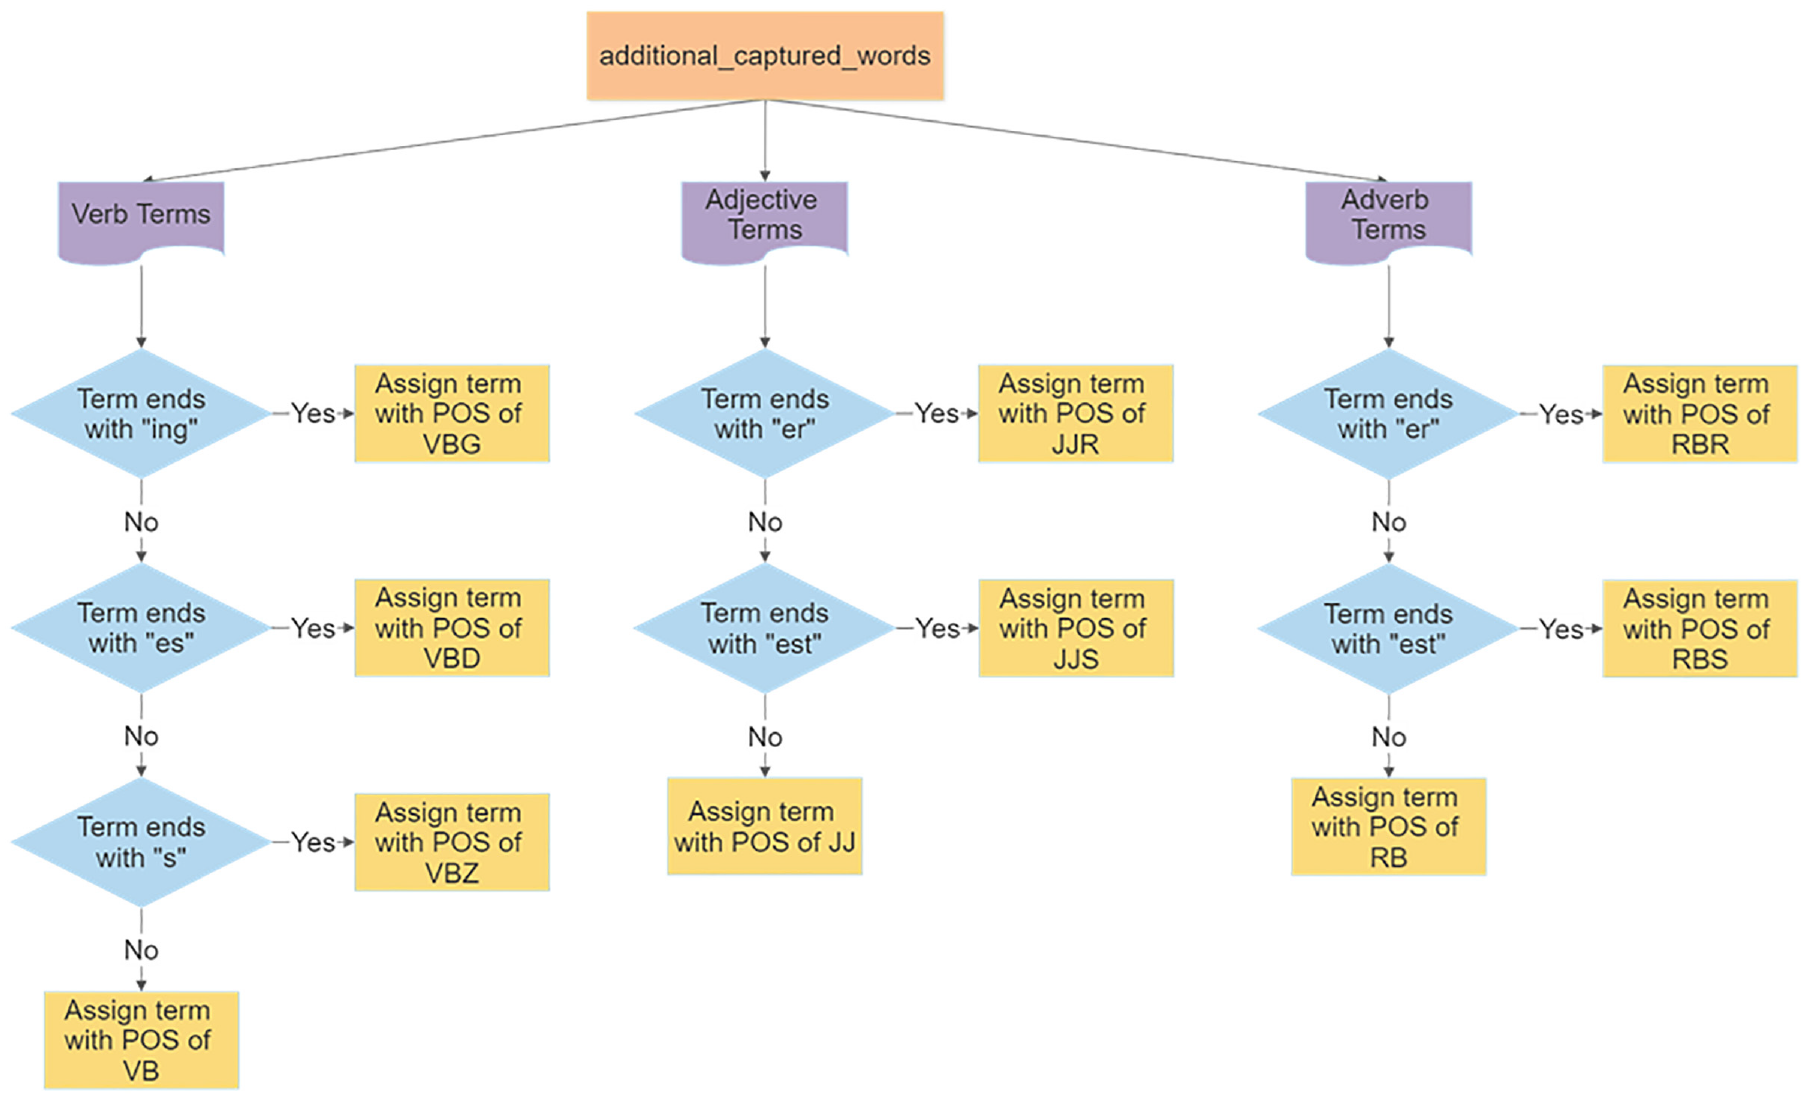
Process to convert word_form POS tags into NLTK POS tags.
Lexicon Scoring
Following the development of the lexicon, the corpus-captured words were given a polarity score (sentiment score
1. Frequency counts: In this method, the sentiment score is defined as the difference in the frequency of tweets that appear in a positive class (count
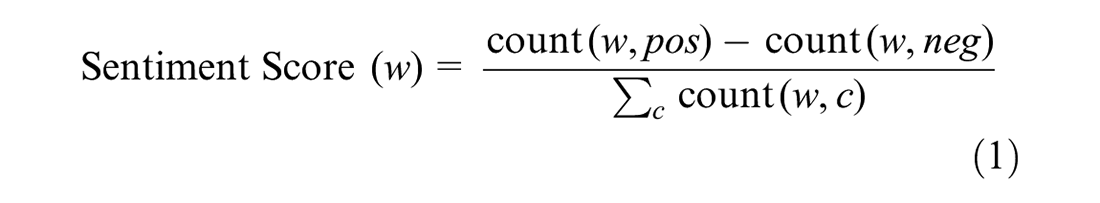
where
2. Bayes theorem (
32
): In this method, the score is defined as the difference between posterior probability of the word being positive

where


where
Several authors have shown that probabilistic scoring of sentiments can be further enhanced by using a well-known numerical statistical measure called term frequency-inverse document frequency (TF-IDF) ( 24 – 26 ). TF-IDF is designed to capture the importance of a term in a document (tweet) relative to the entire corpus of documents and is calculated using Equation 7. Therefore, a product of both TF-IDF and the best probabilistic scoring method without it were evaluated to verify whether TF-IDF could potentially improve the scoring of transit-related terms.

where
Polarity Scoring of Additional Captured Words
The techniques used to score corpus-captured words required previous sentiment knowledge, which additional captured words did not have. Thus, a simple rule-based matching technique utilizing the sentiment scores of the corpus-captured words was implemented instead, as illustrated in Figure 6. The basis of this approach is that similar words but used as a different POS, excluding nouns, hold similar meanings. The word “fast,” for instance, is sometimes used as an adjective or an adverb with similar sentiment value. This is also the case with words originating from each other but being used as a different POS. The sentiment intensity of words like “wait” and “waited” is very comparable in the transit context.
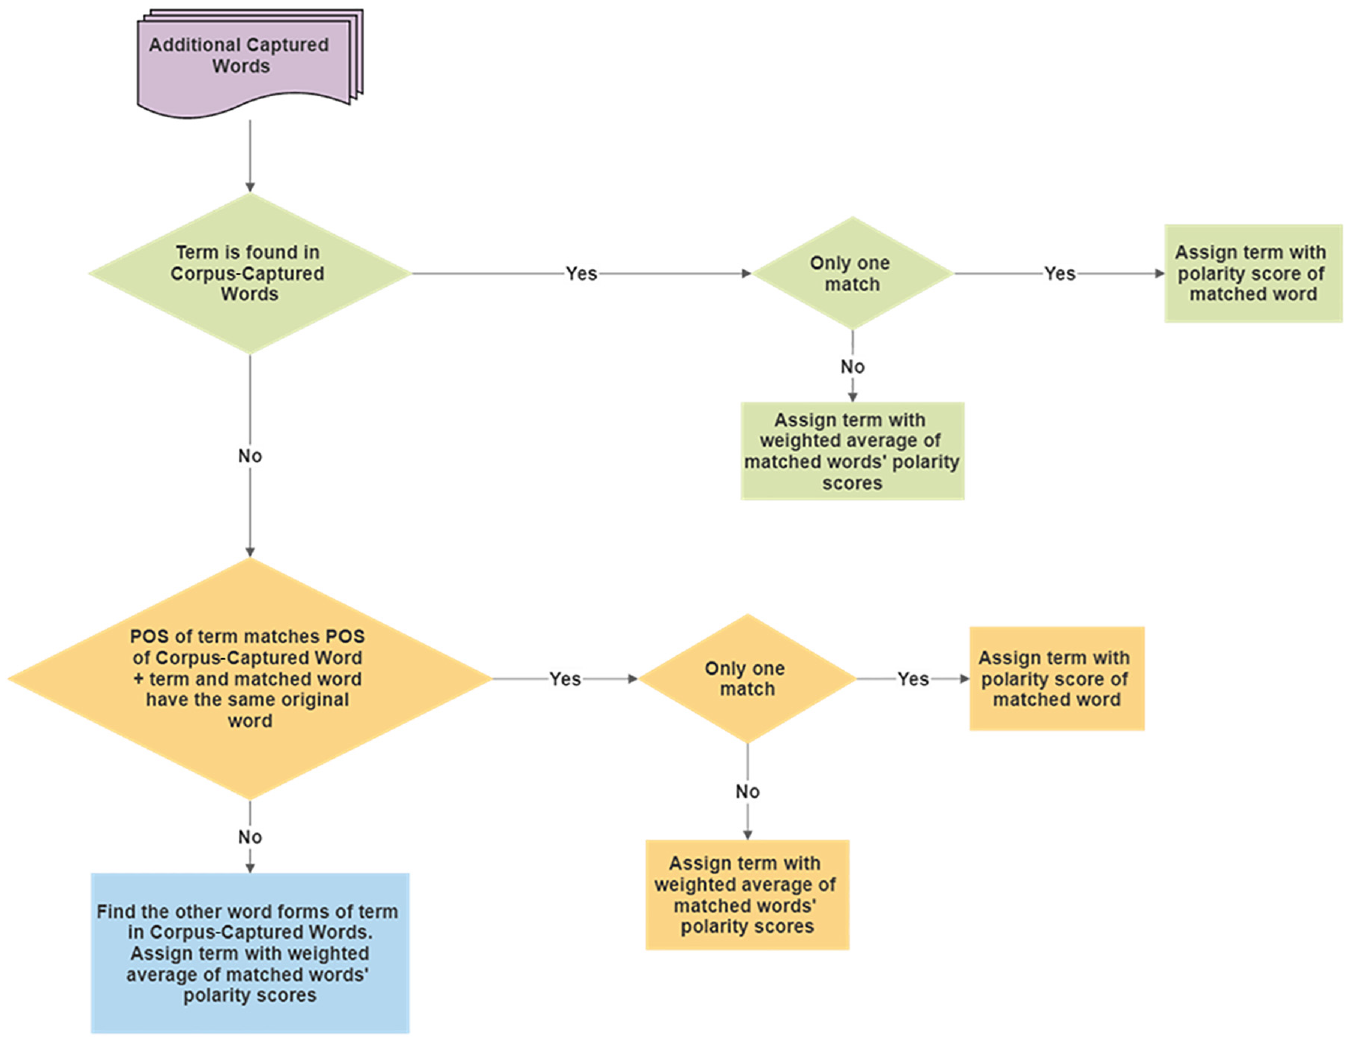
Polarity scoring of additional captured words.
The corpus-captured words and additional captured words were merged, excluding any neutral words with a sentiment score of zero. Duplicated words with multiple POS tags were combined using a weighted average based on term occurrence in the tweets. This was done to give each word a single overall score. Finally, the lexicon created was evaluated against traditionally used generic sentiment lexicons using the set of performance metrics outlined previously (precision, recall, F1-score, and accuracy).
Sentiment Analysis
On-Time Performance
Because tweets with a negative sentiment make up the vast majority of tweets in the sample, we measured the effect of the service change on riders’ perception of on-time performance by evaluating only the subset of negative tweets about on-time performance. Each tweet was examined and assigned an associated route number(s) if applicable. Then, tweets labeled with more than one bus route were replicated for each bus route number. Routes with two tweets or fewer in the entire analysis period were eliminated from the analysis because a low number of tweets may not be indicative of a route’s performance.
This resulted in a total of 34 control routes (117 tweets before the service change versus 80 after) and 18 treatment routes (46 tweets before the service change versus 113 after) being selected for the analysis. Figure 7 shows the number of tweets for each route.
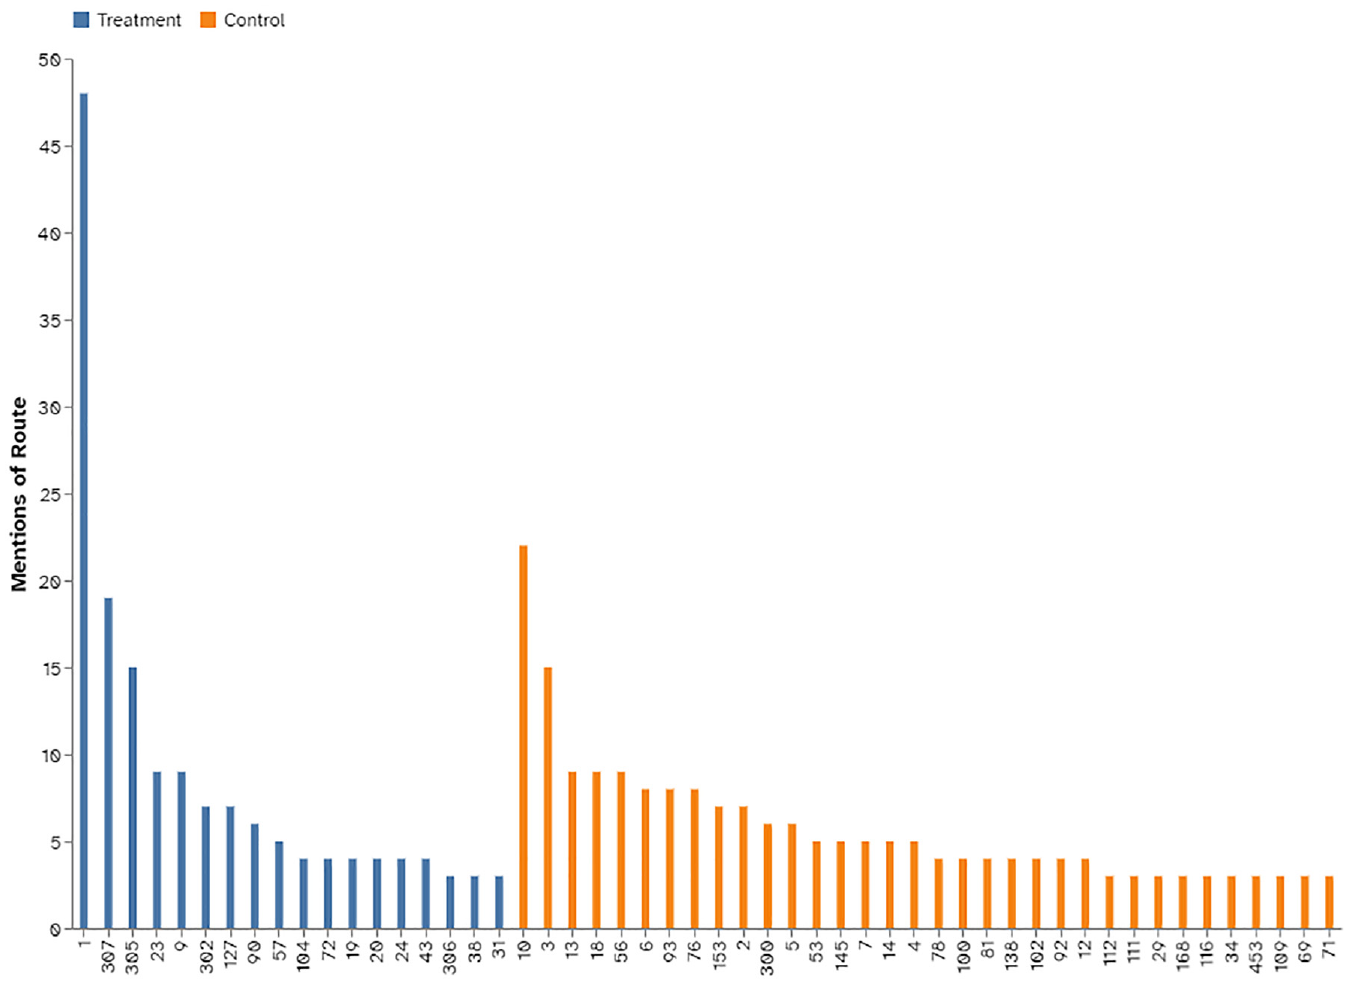
Total mentions for each route.
Sentiment analysis was then conducted on each tweet in which each term was assigned a polarity score using the transit-specific sentiment lexicon developed. The terms’ scores were summed for each tweet and then normalized to be between -1 and 1 based on all the tweet scores being studied. The average polarity scores of tweets before and after the service change for the two groups (control and treatment) were calculated to measure the overall customer satisfaction for on-time performance. These were compared according to the group they belong to using a one-tailed two-sample t-test with equal variances with the following hypotheses:


The service attributes defined in the Content Analysis section were used to quantify the perceived performance of the service change. This was achieved by looking at the percentage change in frequency of negative tweets to understand how the objectives of the service change fared.
Operational-Oriented Analysis
Data Collection and Preparation
To calculate the on-time operational performance of buses in the field, GTFS and APC data were used. GTFS data were used mainly to obtain the bus schedules. Two GTFS feeds, “23 August, 2018” and “11 December, 2018,” were collected for this study. APC data were used to extract actual stop-level arrival and departure details for each trip on each route for which data were available. The data were acquired from Calgary Transit for the period September 20, 2018 to January 17, 2019, at which time only 65% of their bus fleet was equipped with an APC system.
Extensive data preprocessing was required to merge the GTFS and APC data for the entire analysis period (further details can be found in Al-Sahar [ 33 ]). This involved the following: compiling the correct tables needed for each data type separately; checking for missing data; preparing the APC data to capture the stop-level details for each unique trip of the routes studied; preparing the GTFS data to obtain the schedule timings of the routes studied; combining the APC and GTFS data according to similar column attributes; and finally, calculating the schedule deviations for each stop according to the difference between the actual departure time and the scheduled departure time. Missing schedule deviations occurring at the start of a trip were given a value from the final stop of the previously connected trip (if the stop schedule details matched) or given a value of zero (trip is assumed to have left on time). Other occurrences of missing schedule deviations were interpolated. Details from the final stop of each trip were removed because customers were not boarding; therefore, there would be no complaints about schedule adherence.
On-Time Performance Calculation
Trips were separated according to the group they belonged to, resulting in a total of 6,040,111 stop-level details for control routes (3,196,090 before the service change versus 2,844,021 after) and 4,465,801 stop-level details for treatment routes (2,015,586 before the service change versus 2,450,215 after). On-time performance was calculated for each group and period based on the proportion of schedule deviations that were within Calgary Transit’s time window of 1 min early and 5 min late. Then, the overall on-time performance for control routes (before versus after) and treatment routes (before versus after) was compared using a two-tailed two-sample z-test of proportions with equal variances based on the following hypotheses:


Finally, a comparison of the trends and the statistical results between the customer-oriented analysis and operational-oriented analysis was conducted to test our main hypothesis.
Results and Discussion
Transit-Specific Sentiment Lexicon
The assessment of the different techniques outlined in the Methods section used to score the captured terms is shown in Table 1. The frequency method (Equation 1) performs slightly better in all areas compared with the Bayesian method (Equation 2). These improvements can also be seen when modifications were made to Equation 1 using TF-IDF, when it outperforms both the probabilistic methods used individually, aligning with previously conducted studies ( 24 – 26 ). Therefore, this scoring was used for the transit-specific sentiment lexicon. The lexicon properties and the scoring distribution are shown in Figure 8.
Sentiment Scoring Techniques Performance Results
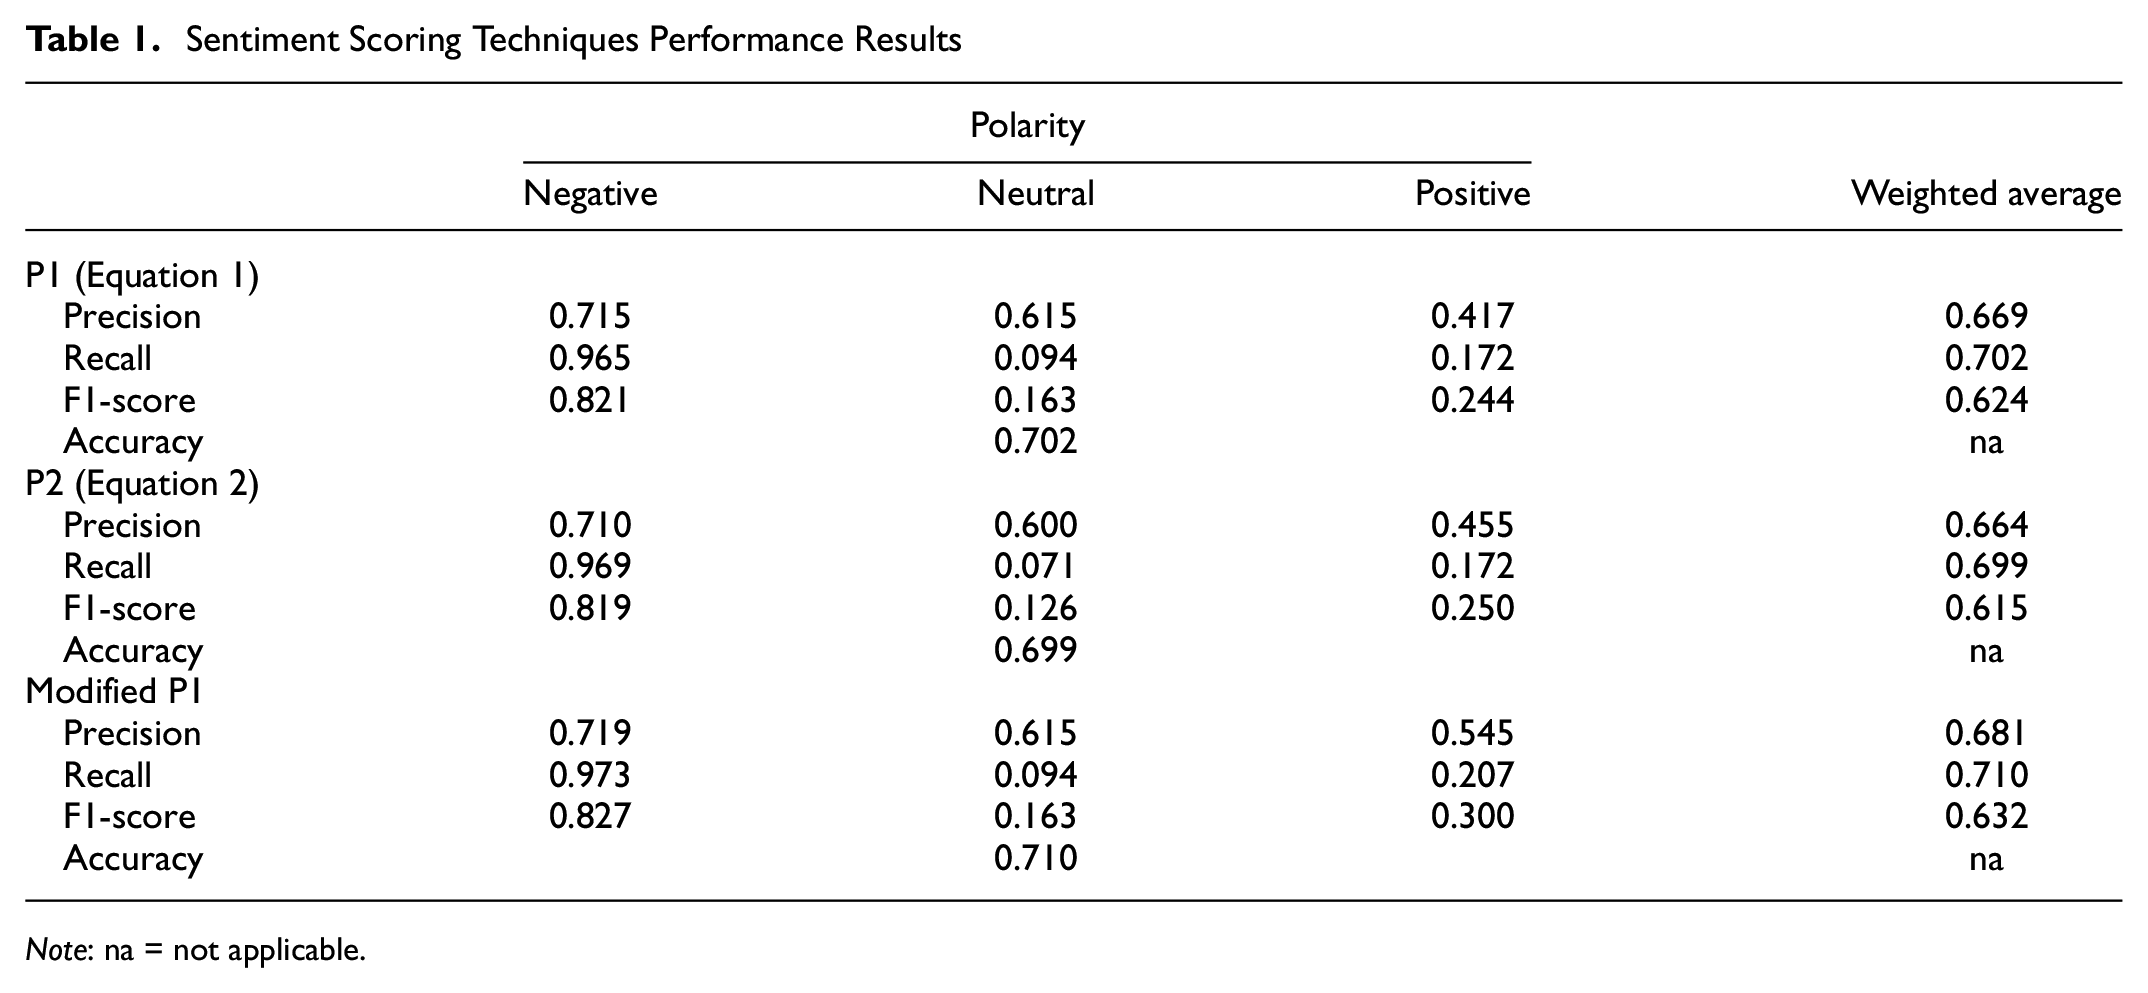
Note: na = not applicable.
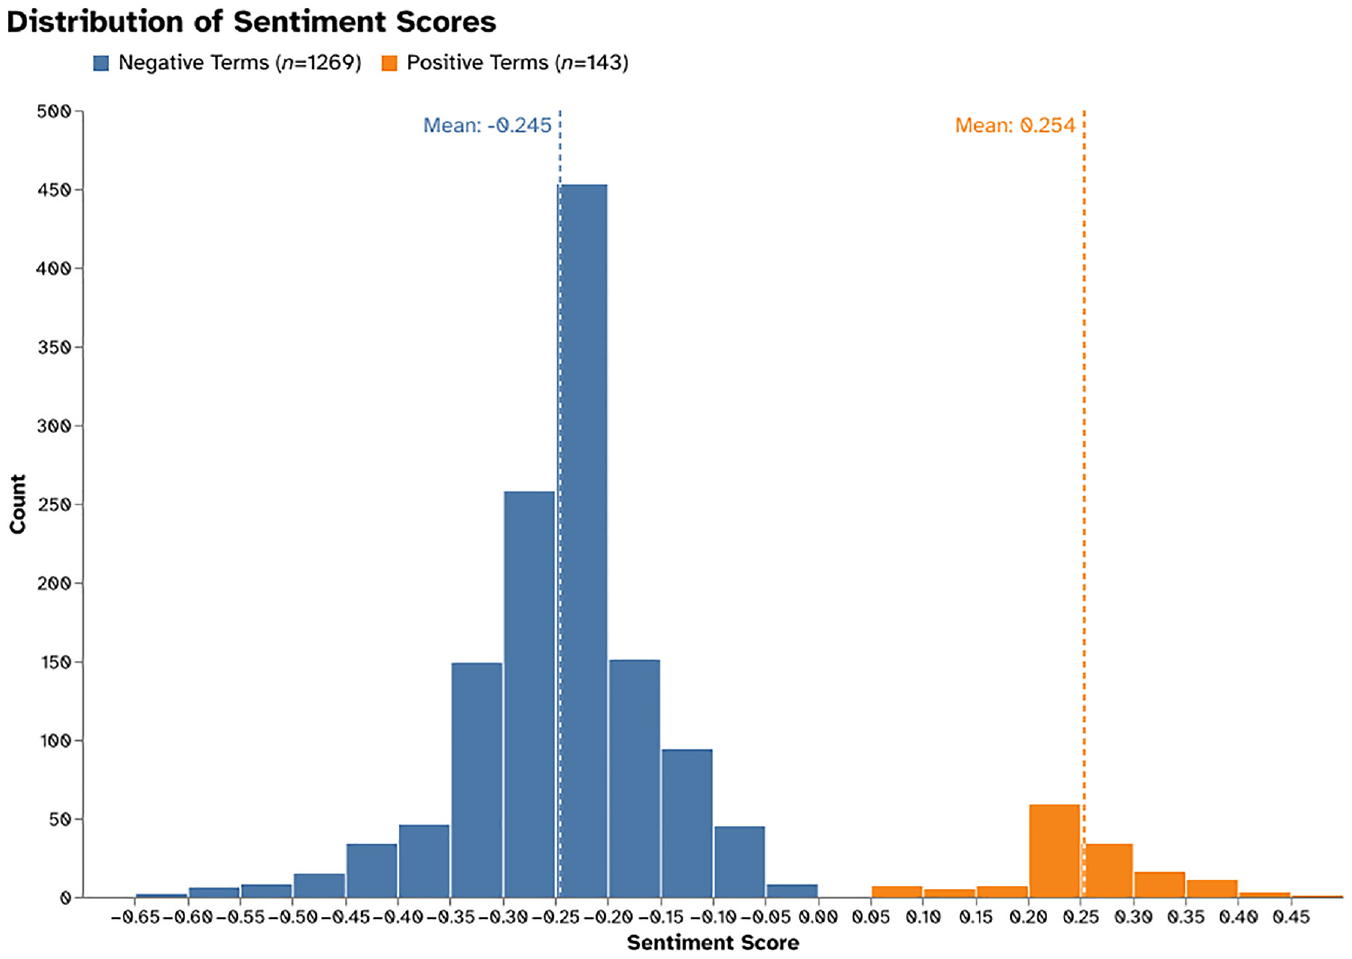
Transit-specific sentiment lexicon properties and frequency scoring distribution.
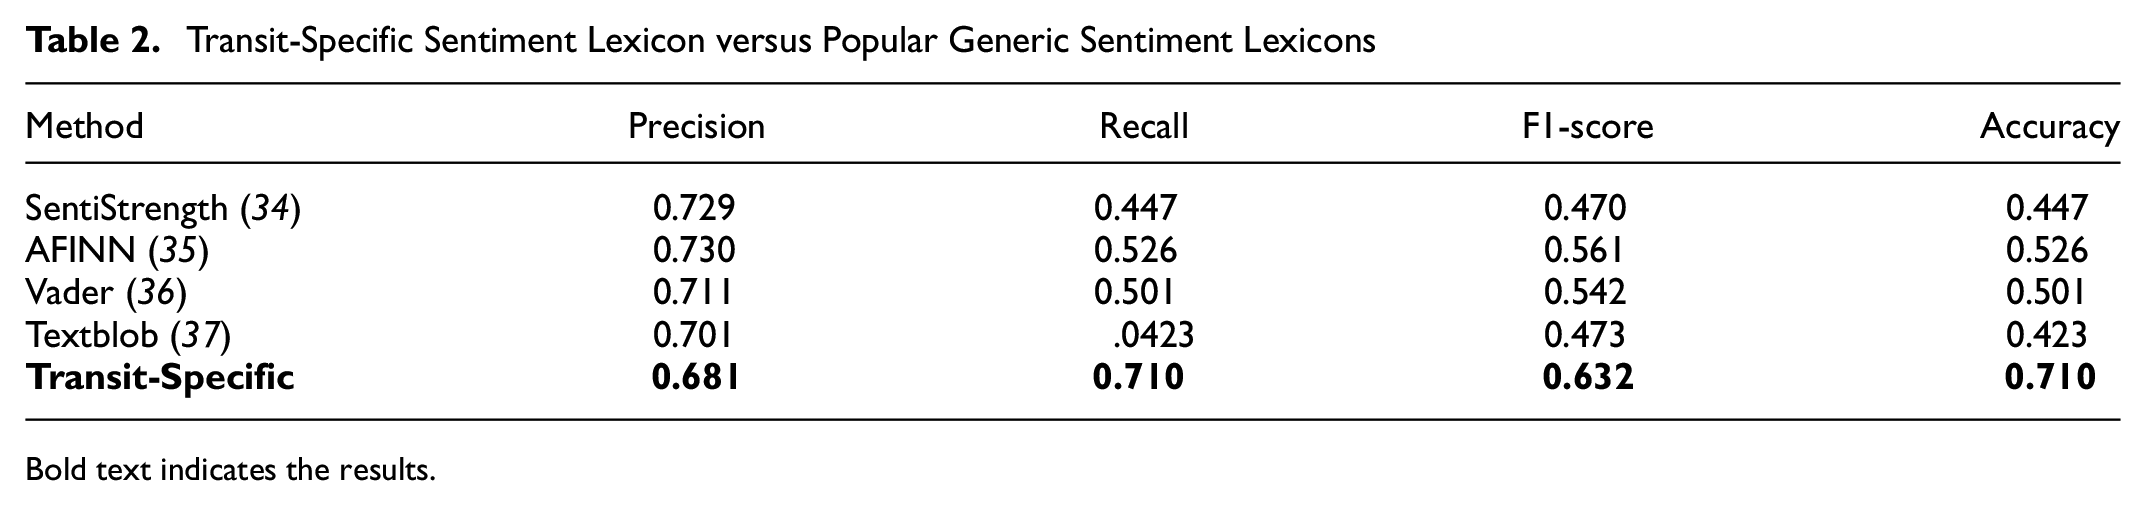
The comparison between the transit-specific sentiment lexicon we developed versus commonly used generic sentiment lexicons is presented in Table 2. The transit-specific lexicon has slightly lower precision in comparison with other lexicons but outperforms them considerably with regard to recall. In our case, recall is more important because capturing negative tweets is a priority over capturing the other polarities of tweets (neutral or positive); it is true to say that the majority of transit tweets consist of complaints (
8
,
11
,
15
). Moreover, the F1-score (a combination of the precision and recall metrics) shows that the overall performance of the transit-specific lexicon is better than AFINN (the highest performing generic lexicon) by 7.1%. This can also be seen when comparing the accuracy. The transit-specific lexicon leads by 18.4%, which is statistically significant
Transit-Specific Sentiment Lexicon versus Popular Generic Sentiment Lexicons
Bold text indicates the results.
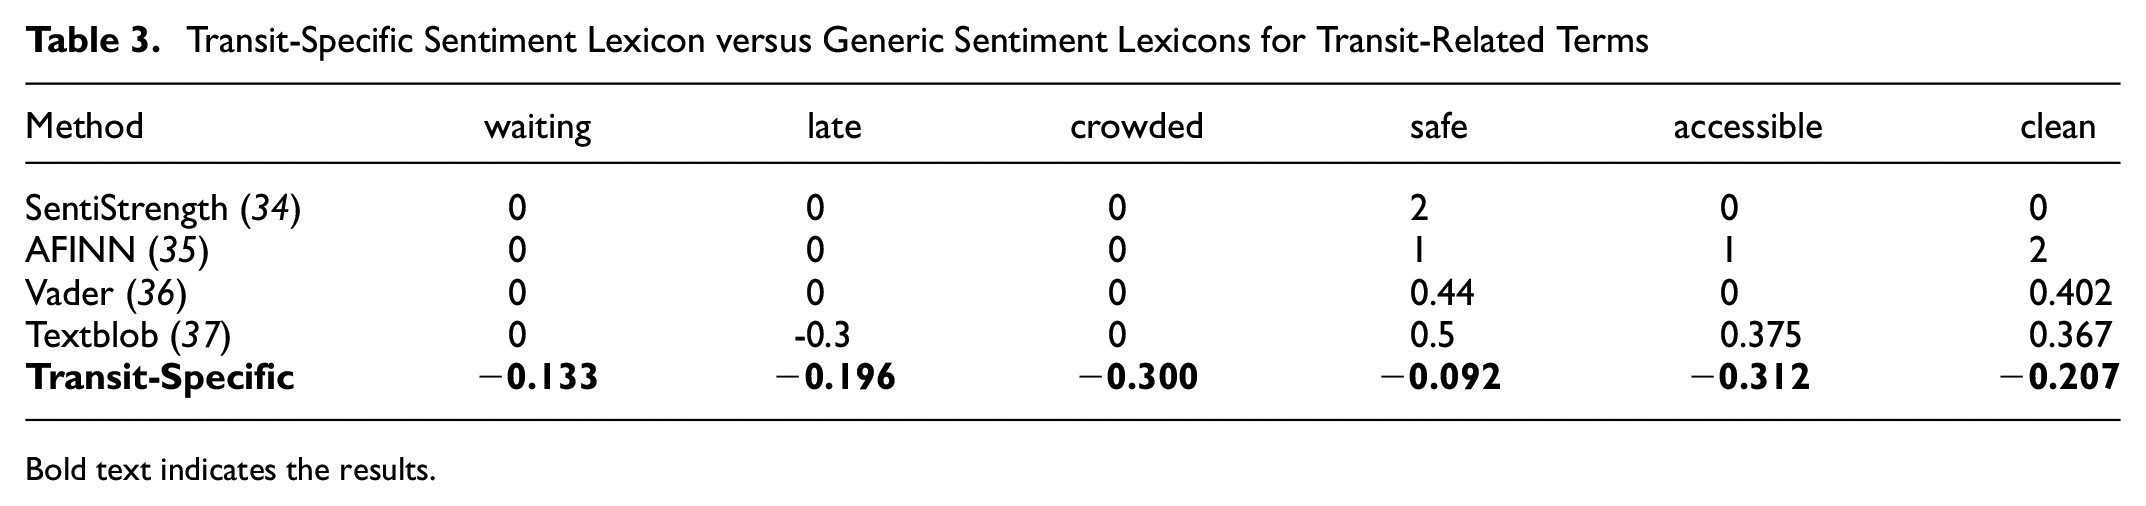
These results are consistent with the conclusions of previous studies that highlighted the accuracy and reliability issues when using a generic sentiment lexicon in the transit field ( 5 , 15 ). By taking a closer look at some of the scores given to the most commonly used terms on Twitter for different service quality attributes (Table 3), it becomes evident that these terms are completely misclassified for the majority of cases or are not even considered. This emphasizes that lexicons are context dependent and must be tailored to suit the study.
Transit-Specific Sentiment Lexicon versus Generic Sentiment Lexicons for Transit-Related Terms
Bold text indicates the results.
Service Change Evaluation
Figure 9 presents the overall sentiment change based on negative tweets for the different service attributes after the service change. The results show that 11 out of the 18 attributes have deteriorated. These consist mainly of operational factors (except travel time, on-time performance, and transit integration). The rest of the attributes improved. This is a way of showing transit agencies how well their goals and objectives are being met based on the customer’s point of view. For example, a service attribute related to “MAX Convenience,” on-time performance, has deteriorated, whereas, for “MAX Comfort,” safety and security has improved.
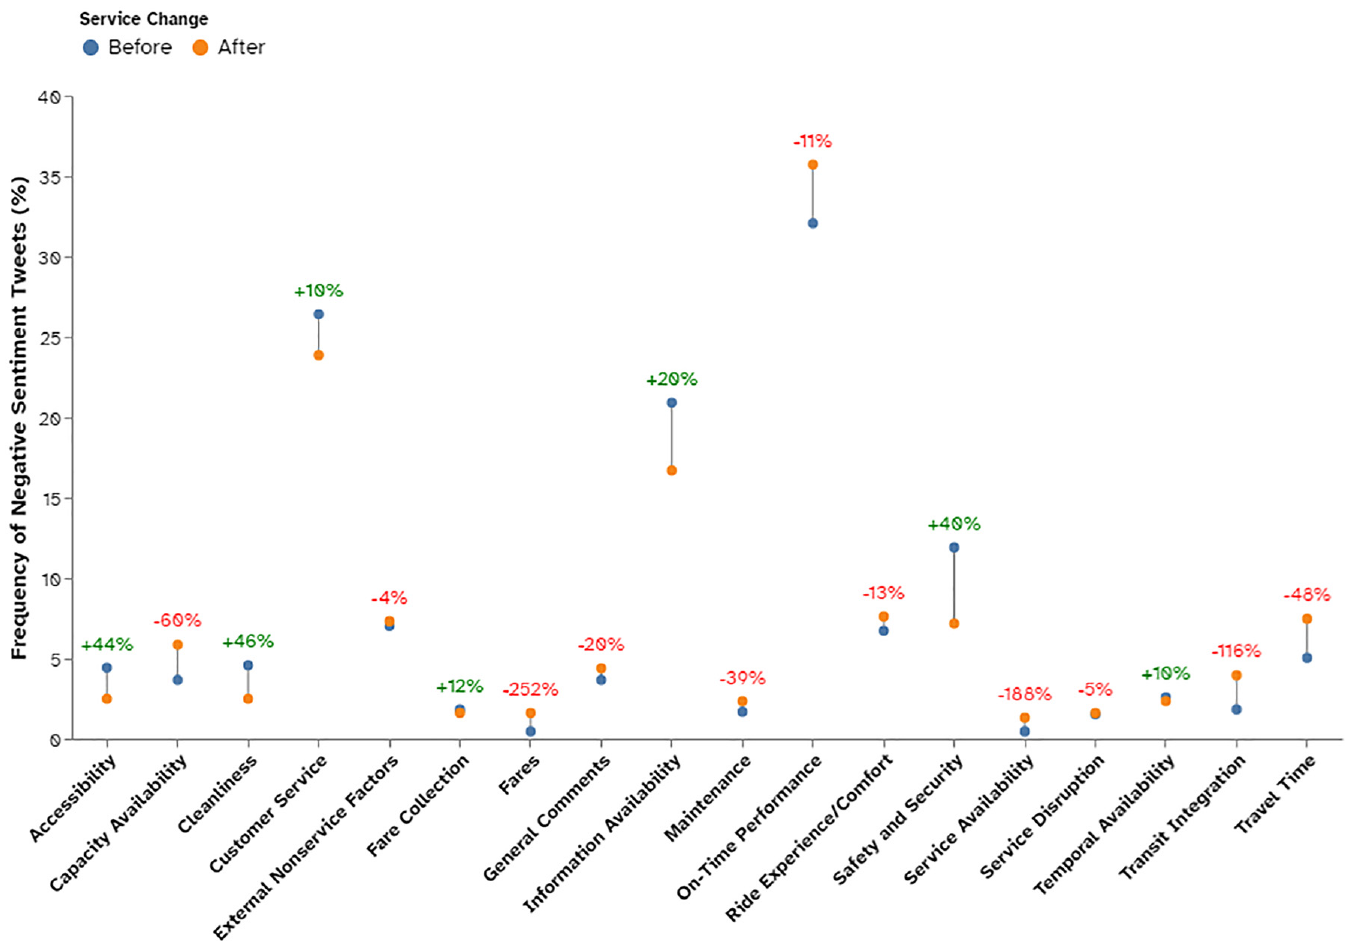
Semantic–sentiment distribution of negative bus tweets before and after a service change.
Figure 10 presents a normalized comparison of the overall on-time performance evaluation before and after the service change from both customer and operational perspectives. Actual values are given in Table 4. Statistical tests with a significance level
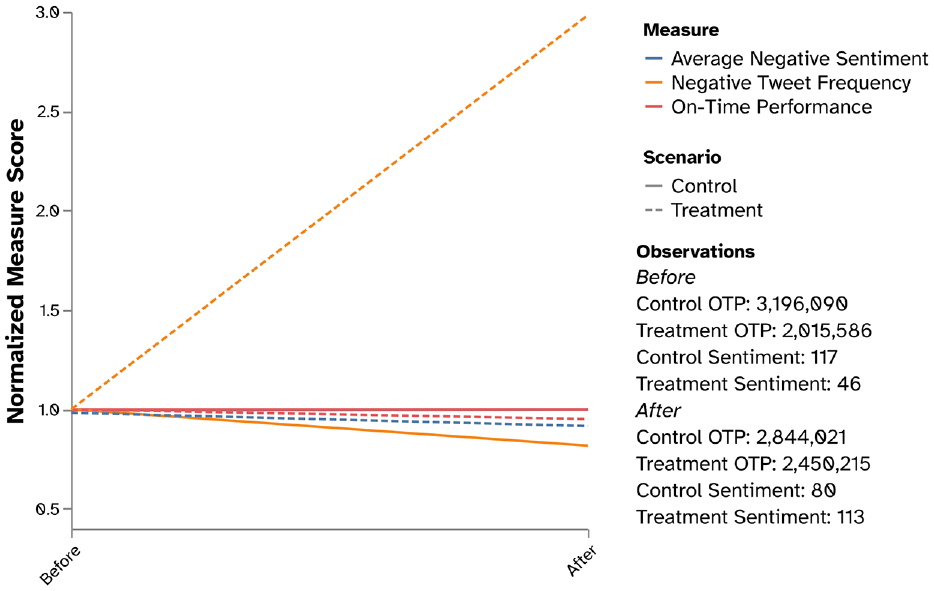
Overall on-time sentiment and operational performance results for control and treatment routes.
Change in Metrics across Treatment and Control Routes
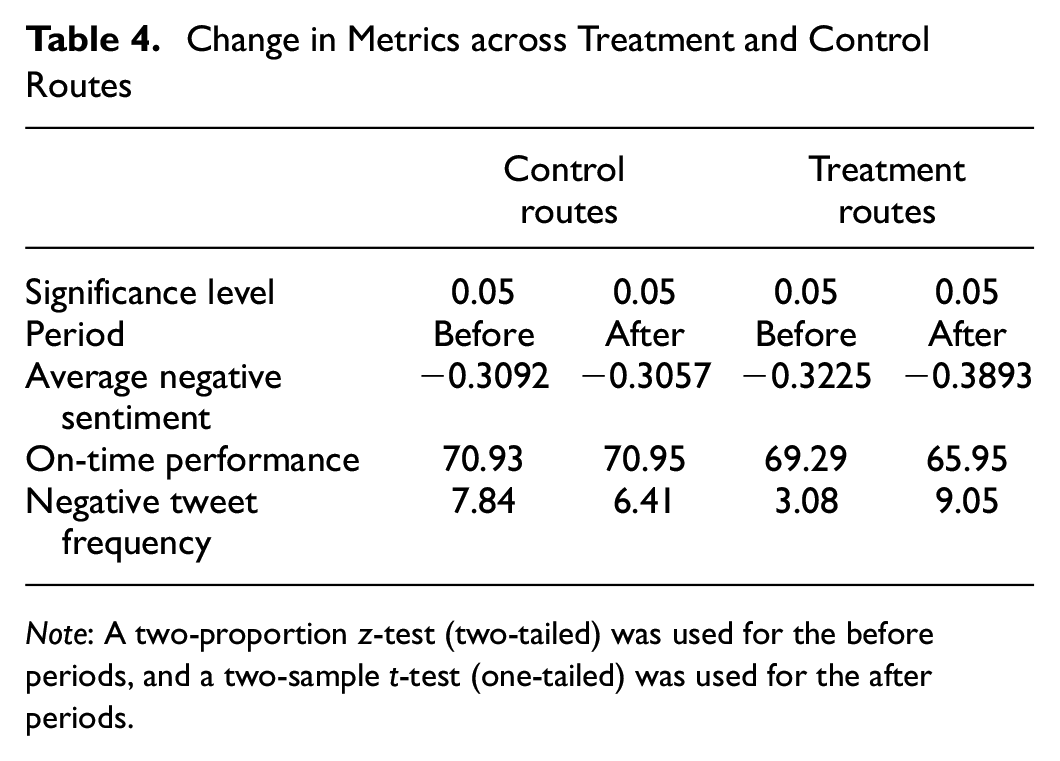
Note: A two-proportion z-test (two-tailed) was used for the before periods, and a two-sample t-test (one-tailed) was used for the after periods.
For control routes, the customer satisfaction average sentiment has increased slightly by 1.1% (+0.0035 sentiment score) from
(
The findings above align with our initial hypothesis. The actual change in on-time performance has a similar trend to the customer satisfaction obtained from Twitter. The control routes’ on-time performance has remained mostly unchanged, which was expected because these routes have not been altered. On the other hand, the treatment routes’ performance has changed but surprisingly for the worse. Figure 11 maps the difference in on-time performance for common treatment stops before and after the service change. Purple dots indicate a deterioration in stop performance, green dots an improvement, and the other shades are in between. Routes on the map can be identified as the cause of this drop in on-time performance, not individual stops or one specific area.
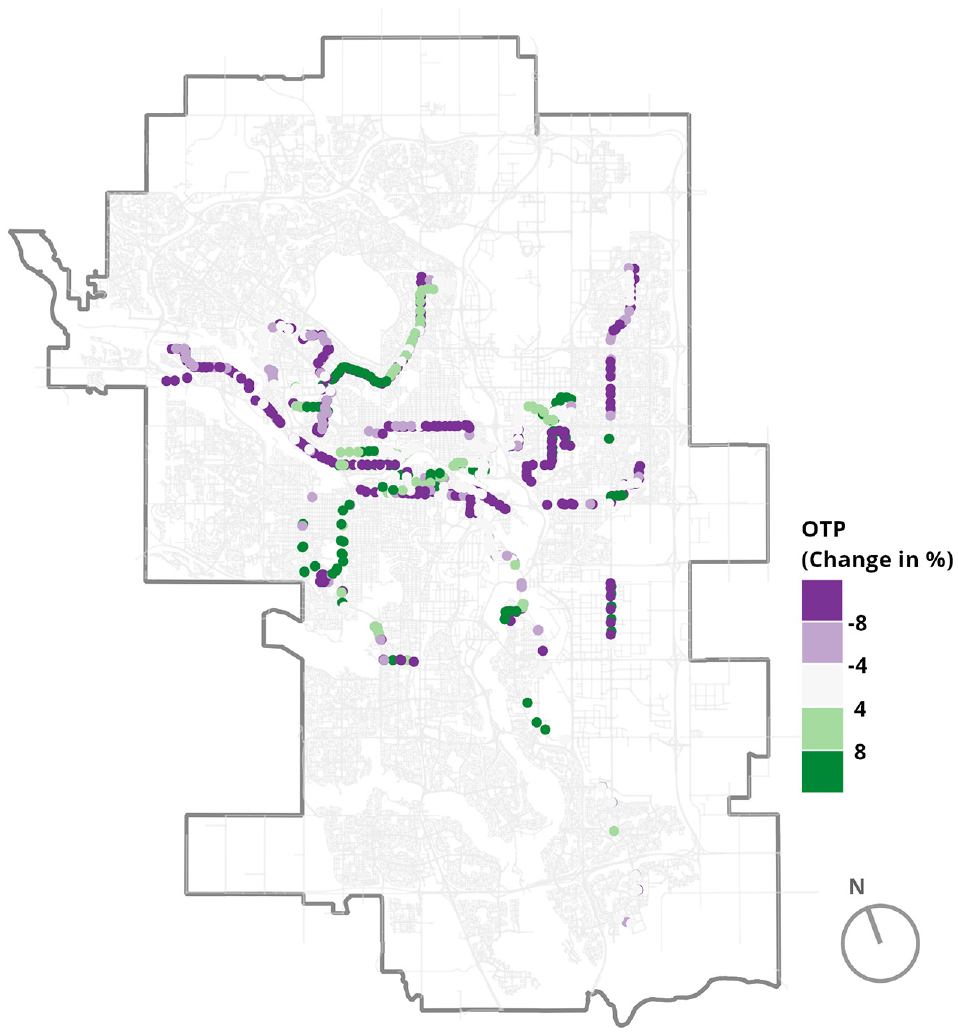
Map indicating the difference in on-time performance for common treatment stops before and after the service change.
Additionally, the distribution of negative tweets and on-time performance at each stop for one of the most discussed routes on Twitter during this analysis period, Route 1, were observed before and after the service change, as shown in Figure 12. The majority of negative tweets are located at stops with poor schedule adherence, regardless of direction.
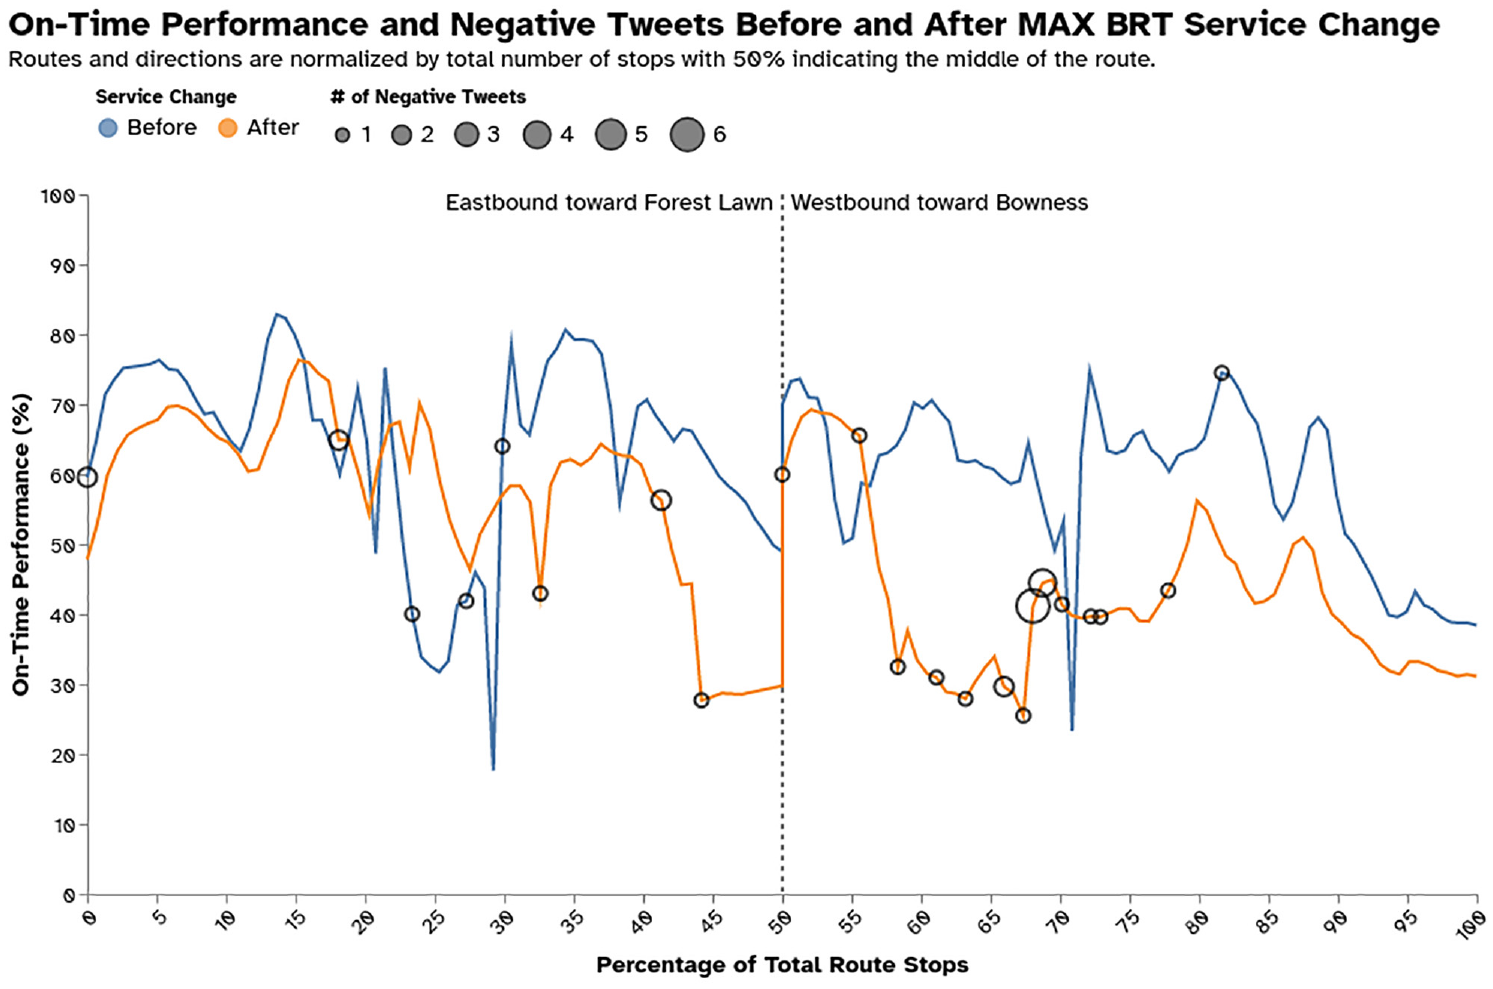
On-time performance and negative tweet counts for Route 1 before and after the service change.
These results further illustrate that there is a relationship between the perception of Twitter riders and on-time performance, matching previous studies showing the same results but from customer satisfaction surveys ( 38 , 39 ). Combining the two measures would give transit agencies a more comprehensive evaluation of where the service is underperforming and needs adjusting, making the decision planning and operation process more efficient.
Policy Implications
Although there is more work to be done to strengthen the connection between Twitter sentiment, customer satisfaction surveys, and performance, this initial look at a major service change suggests that Twitter or other social media sources may be a useful supplement to traditional methods of expressing satisfaction or not.
If social media sentiment can be calibrated with customer surveys, it can provide a measure of sentiment about a service and about emerging issues that is far closer to real time. The rise and fall of general or topic-specific sentiment can allow agencies to address problems more nimbly.
This creates the possibility that vocal groups with a minority view or complaint organize to use social media to influence the sentiment measurement. This is already in practice on a less quantitative level, because transit typically falls under municipal control and decision-makers are more accessible at this level of government. The situation is further exacerbated by the known and unknown biases in representation from social media users.
Nevertheless, in addition to staff monitoring social media accounts for questions or urgent issues, an ongoing analysis of sentiment can provide agencies with a “pulse” feed in relation to emerging issues, problematic routes, or other areas of the system. This is especially true for larger agencies for whom monitoring and analyzing social media streams manually is not as feasible.
Conclusions
This research evaluates the impact of a major service change on the perception of transit riders from Twitter in comparison with a standard operational performance measure of reliability, “on-time performance.” To the authors’ knowledge, this is the first study to compare customer satisfaction from Twitter with measures of operational effectiveness in the transit field. To improve the accuracy and reliability of this study, a transit-specific sentiment lexicon was developed using a hybrid approach. This contained verbs, adjectives, and adverbs. Terms were assigned a polarity score based on an assessment of different scoring techniques. The lexicon was then compared with commonly used generic sentiment lexicons.
The experimental results for the development of the transit-specific sentiment lexicon showed that the best sentiment scoring scheme consisted of a probabilistic measure (frequency count based) modified by a statistical measure (TF-IDF), achieving an overall accuracy and F1-score of 71% and 63.2%, respectively, compared with using a probabilistic measure individually. This lexicon outperformed commonly used generic sentiment lexicons, attaining an overall increase in accuracy and F1-score of 18.4% and 7.1%, respectively, in comparison with the highest performing generic sentiment lexicon.
The introduction of Calgary Transit’s new MAX BRT routes has led to many mixed feelings from transit users on Twitter as to how well it has performed overall. On the operational side, from a customer perspective, many of the service attributes have deteriorated after the service change, although with regard to comfort, connections, and customer service, the changes seem to have had a positive impact.
The on-time performance analyses show similar trends between riders’ perception and the operational performance of the system. Both suggested that the unaffected routes’ on-time performance improved slightly but were not significant enough to be caused by the introduction of the MAX service. In contrast, the affected routes’ on-time performance declined both from the customers’ point of view and the operational standpoint, and these differences were significantly influenced by the service change. A similar trend was also observed when looking at one individual route. It can be seen that the majority of negative tweets corresponded to stops with low on-time performance.
This study provides transit agencies with a method for utilizing customer-oriented measures obtained from Twitter in a meaningful way. Combined with operational measures, they can assess different service changes more accurately and help transit agencies make better-informed decisions for future planning. Transit agencies (including Calgary Transit) typically use “what we heard”-style reporting when presenting information based on user engagement surveys to decision-makers such as councilors and senior management. Both in-person and online surveys are active data collection methods in which respondents may skew their responses toward higher levels of engagement. Twitter analysis uses more passive data collection. A systematic and more quantitative social media analysis such as the one introduced here can provide the discussion with additional nuance and an added dimension, which could help clarify decision-making in the future.
This study has some limitations, most notably the data used in the analysis. Twitter data have a biased demographic representation of transit users because they are skewed to a younger male user, whereas transit demographics may include more women and elderly riders ( 5 ). This can be potentially mitigated in part by capturing the perception of riders other than online users by employing traditional means of data collection, such as surveys, in future work. Our Twitter data were limited to tweets mentioning the agency being studied, limiting the scope of work that could be done. In the future, a well-defined framework for obtaining a large corpus of transit-related tweets to conduct a more robust analysis could provide more conclusive results. Another limitation is attitudinal user bias caused by the Calgary Transit publicity campaign to notify its users of planned and forthcoming changes to its system. Users who formed positive opinions of the changes because of the campaign may have tended to make positive tweets in relation to actual on-time performance. On the other hand, those with negative opinions of the information campaign may have tended to tweet negatively as well. However, this would affect standard surveys too.
The transit-specific sentiment lexicon developed is the first of its kind, providing several opportunities for extending this work and enhancing its accuracy. A recommendation for future work involves investigating other scoring schemes that could improve the polarity score of transit-related terms and examining whether they reflect the right level of intensity. Transit-related tweets are generally negative, creating an unbalanced data set that can create a problem when it comes to classifying positive tweets. Therefore, in future work, a methodology to tackle this issue should be considered.
Footnotes
Author Contributions
The authors confirm contribution to the paper as follows: study conception and design: R. Al-Sahar, A. Shalaby; data collection: R. Al-Sahar, T. El-Diraby; analysis and interpretation of results: R. Al-Sahar, A. Shalaby, W. Klumpenhouwer; draft manuscript preparation: R. Al-Sahar, W. Klumpenhouwer, A. Shalaby; supervision: A. Shalaby, W. Klumpenhouwer. All authors reviewed the results and approved the final version of the manuscript.
Declaration of Conflicting Interests
The author(s) declared no potential conflicts of interest with respect to the research, authorship, and/or publication of this article.
Funding
The author(s) disclosed receipt of the following financial support for the research, authorship, and/or publication of this article: Funding was received from Calgary Transit, the Natural Sciences and Engineering Research Council, and the Canadian Urban Transit Research and Innovation Consortium as part of the “Social-semantic analysis of social media interactions to access customer satisfaction in transit agencies”, CFC No. 210912 and Fund No. 507914.