
Abstract
With ridership declining nationally and transit agencies looking for innovative ways to maintain and attract riders, a more complex understanding of transit riders and their satisfaction could provide additional insight and guidance to benefit the future of transit. This study challenged the traditional captive versus choice rider dichotomy and indicates the need for a more nuanced breakdown of transit riders based on the attributes most important to them. To conduct the analysis, the authors obtained rider survey data from nine agencies across the United States from varying geographic regions and representing various agency sizes. Agencies were selected based on their intentional use of demographic classifications and questions about satisfaction with various aspects of transit service. The authors then applied ordered logit regression across the 18,544 rider survey responses to predict the relative importance of service attributes on overall satisfaction. The findings suggested that different classifications of riders by gender, race, and income yielded diverse priorities, although certain service aspects such as reliability were important across demographics. In addition to the findings from the regression analysis, this study also offers a series of recommendations to facilitate future investigations by using more consistent, standardized data to further the breadth and depth of national transit rider analyses.
Since 2014, transit ridership has steadily decreased across the United States. Several studies have identified a variety of factors underlying this decline, some of which reflect internal choices of transit agencies and others external trends and disruptions in society ( 1 , 2 ). In many cases, these trends were exacerbated by the COVID-19 pandemic. Although the longer-term implications of the pandemic for transit are still unknown, COVID-19 emphasized the essential role of transit and transit riders in society, including providing critical mobility and healthcare services ( 3 ).
Stakeholders in the industry are exploring policies and strategies to address these alarming ridership trends. These innovations span a range of interventions including improved fare technology, integrating new modes and vehicles, exploring new service models, and different public–private relationships. Innovations in transit have the potential to help transit better serve current riders and increase ridership across the board. Key to the effectiveness of these innovations is whether they add value for current or potential riders, therefore, it was necessary to analyze current riders and meaningfully consider the core transit rider demographic assumptions that have historically defined transit in the United States.
A more nuanced understanding of transit riders will enable a more robust, innovative, and equitable future for American transit systems. As such, this study sought to address two questions: 1. Who currently rides transit? and 2. How do these riders feel about transit service? With regard to the first question, this paper documents a variety of demographic characteristics of current transit riders to demonstrate transit rider diversity. To address the second question, two subquestions were considered. The first subquestion explored the relationship between different aspects of transit service and overall satisfaction. The second subquestion explored how these relationships changed based on demographic characteristics. Understanding current riders’ needs and preferences will help guide improvements to existing transit services and may help attract new riders who share similar demographic characteristics. This could also equip agencies to allocate resources more efficiently and equitably.
Literature Review
In the context of declining transit ridership and lifestyles changes, which were accelerated by the COVID-19 pandemic, there is an increased need to better understand transit riders and their satisfaction with the service. There are several factors that affect rider satisfaction, some of which are outside a transit agency’s control, but transit service attributes are some of the most important aspects of rider satisfaction ( 4 ).
Whereas some researchers have sought new ways of assessing rider satisfaction, such as scraping tweets from Twitter ( 5 ) or mining app reviews ( 6 ), transit rider surveys are a widely used and accepted process that collect both qualitative and quantitative data that may not otherwise be captured. However, rider surveys have limitations, namely that they fail to capture nonriders, who represent a large, heterogenous, portion of the population ( 7 ). Nonetheless, even with this limitation, methodical rider survey data collection and analysis may lead to interventions that maintain existing ridership and potentially attract new riders.
Within analyses of rider satisfaction surveys conducted, several studies have investigated the relative importance of service attributes on overall satisfaction. Literature reviews synthesizing this research suggest that cleanliness, comfort, safety, and customer service are often found to be statistically significant or discussed as significant by the authors ( 8 ). However, these analyses have historically considered only service attribute rankings without much attention, if any, to differences among transit riders.
Differences in transit riders’ characteristics are likely to affect their values and perceptions of service and satisfaction. Previous studies have documented the need for more intentional market segmentation to understand a variety of factors, including attitudes around transit, travel behavior, and satisfaction ( 9 , 10 ). The most common breakdown of riders has been by “choice” or “captive” users of transit. Captive riders are generally understood to be people who use transit because they have limited transportation options, which in the American context is almost synonymous with not owning a car. It is assumed that these people will use transit regardless of service levels. This group of riders is contrasted with choice riders, who are generally understood to be people who have other means of transportation, probably a private automobile, who opt to take transit ( 11 ). The captive versus choice rider dichotomy has informed decisions, and thus the development, of transit systems for decades. However, this binary rider categorization defines the range of a person’s modes of transportation too narrowly. In several cases, the “‘captivity’ of carless riders is greatly overstated,” and for riders who have other mobility options, many of those choice riders will “occasionally use the transit system when it meets their needs, even in cities with relatively poor transit” ( 11 ). Additionally, the changing work, lifestyle, and consumption patterns, many of which were accelerated during the COVID-19 pandemic, further challenge the relevancy of the captive versus choice rider classification for understanding transit riders.
This study sought to leverage prior transit rider satisfaction survey analyses, and then apply these to additional demographic categories to gain a more nuanced understanding of transit riders at the national level ( 12 ). By incorporating data from agencies across the United States, this paper presents results that may help explain and shape nationally occurring phenomena, such as ridership decline. The paper additionally explores more nuanced understandings of transit riders and the importance of more holistic, contextualized analyses to achieve intentional and more equitable outcomes.
Methodology
Analyzing the relative importance of service attributes on overall satisfaction required three major steps: data collection, data cleaning and standardization, and constructing a predictive model. The goal was to collect rider satisfaction survey responses from a wide range of agencies across the United States to reflect the diversity of transit services offered. Reponses were collected per individual to align satisfaction responses with demographic factors, which were theorized to affect the riders’ transit experiences. Through the combination and standardization of these individual responses, the aim was to identify shared sentiments by demographic population across riders nationally.
Selection of Agencies and the Data Collection Process
Transit systems of interest were strategically selected to reflect the wide range of operations in the United States. A requirement for selection was to be in receipt of funds from the Federal Transit Administration (FTA), which mandates a certain level of data collection, management, and reporting. Markers for differentiation of agencies included geographic dispersion, size of agency, and types of transit services (bus, rail). To develop an initial list of transit agencies, the authors used a previously published paper that clustered agencies according to “metropolitan area population, percentage of population living in a dense area, percentage of zero vehicle households, and transit agency operating expenses,” which were then distinguished as operating in dedicated versus nondedicated rights of way ( 13 ). The authors further subdivided agencies into geographic regions (North, Midwest, South, West) and randomly selected 30 agencies in total by drawing at least two from each combined geographic region–cluster pair. From the initial sampling of 30 agencies of interest, only data from nine agencies were used in this analysis, given several challenges with data collection, including,
Agency communication: no response from agency, difficulty connecting to appropriate contacts in different departments;
Data relevancy: several agencies were in the process of conducting new surveys but were delayed because of COVID-19, meaning surveys and responses were collected several years earlier and may not have captured more recent changes in transit service; and
Data accessibility: data of interest were not stored by the agency, usually because the agency relied on an external contractor, or the data were only available in the aggregate (i.e., summarized or processed such that individual responses could not be identified).
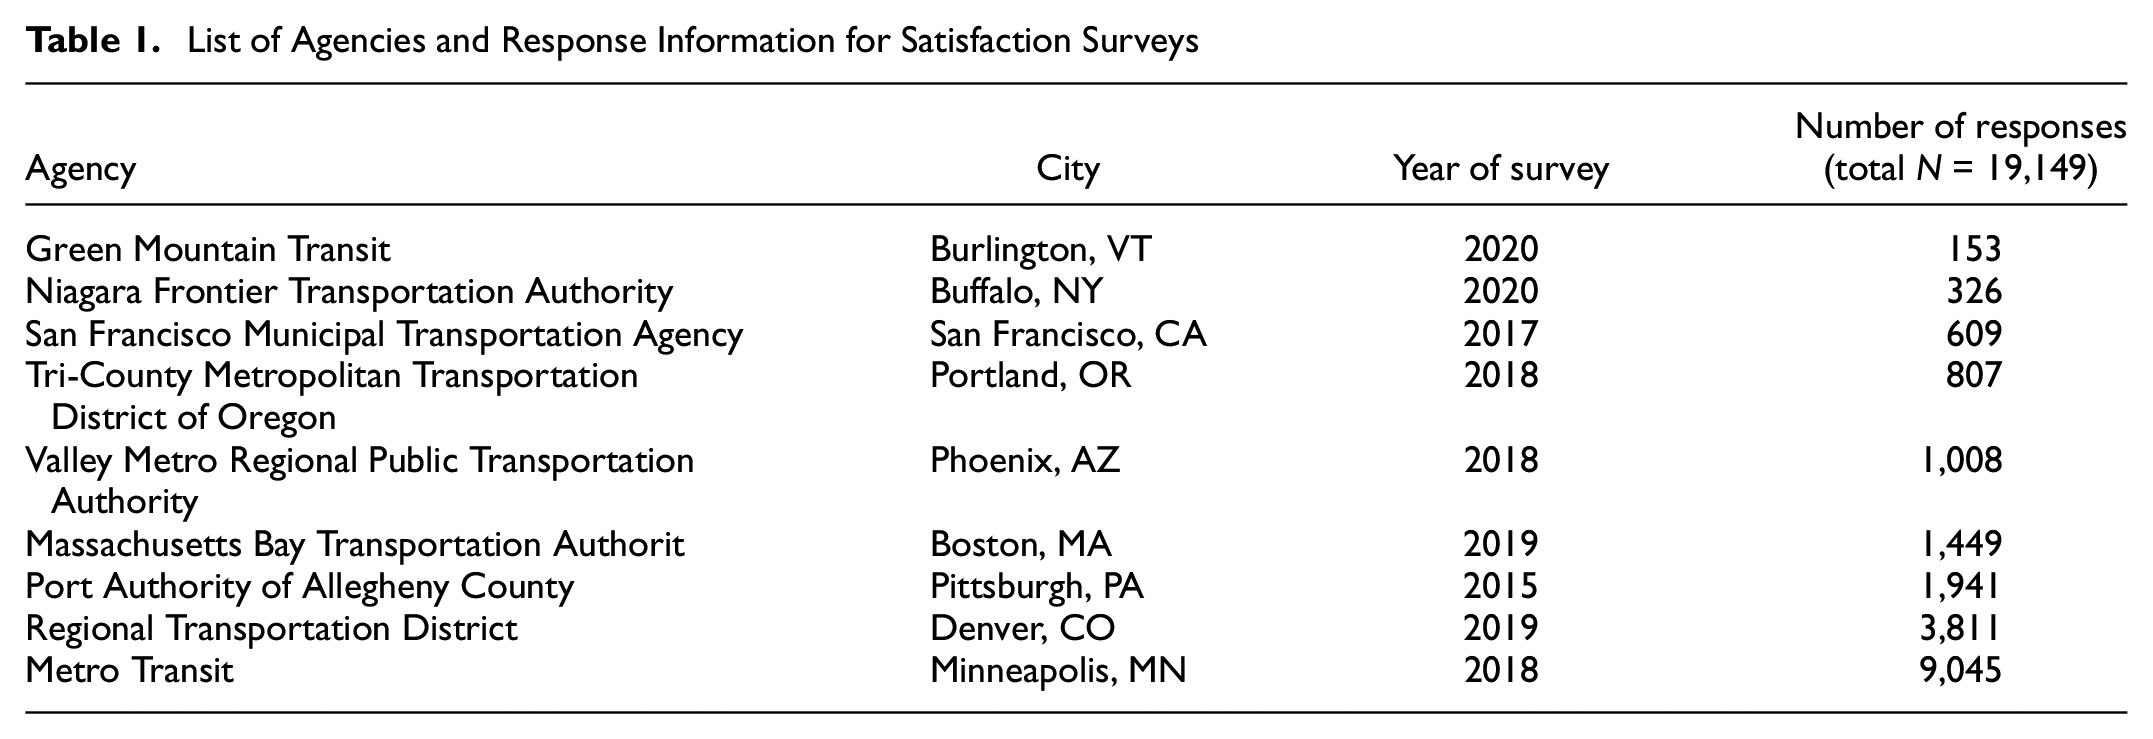
The nine agencies from which data were obtained are presented in Table 1, including the name of the agency, the city where it is located, the year the survey was conducted, and the number of responses. Responses capture bus and/or rail data depending on the agency. Although in all cases the data had to be requested from the agencies, some of the survey instruments or reports are publicly available ( 14 – 18 ).
List of Agencies and Response Information for Satisfaction Surveys
Data Cleaning and Standardization
The data from the agencies were not standardized in their format, the information the agencies collected, or the scales used to record responses. To address each of these concerns, a three-step data cleaning process was applied before analysis. These steps were to 1) remove extraneous response information, 2) generate demographic categories and assign responses, and 3) generate descriptive service variables and assign responses.
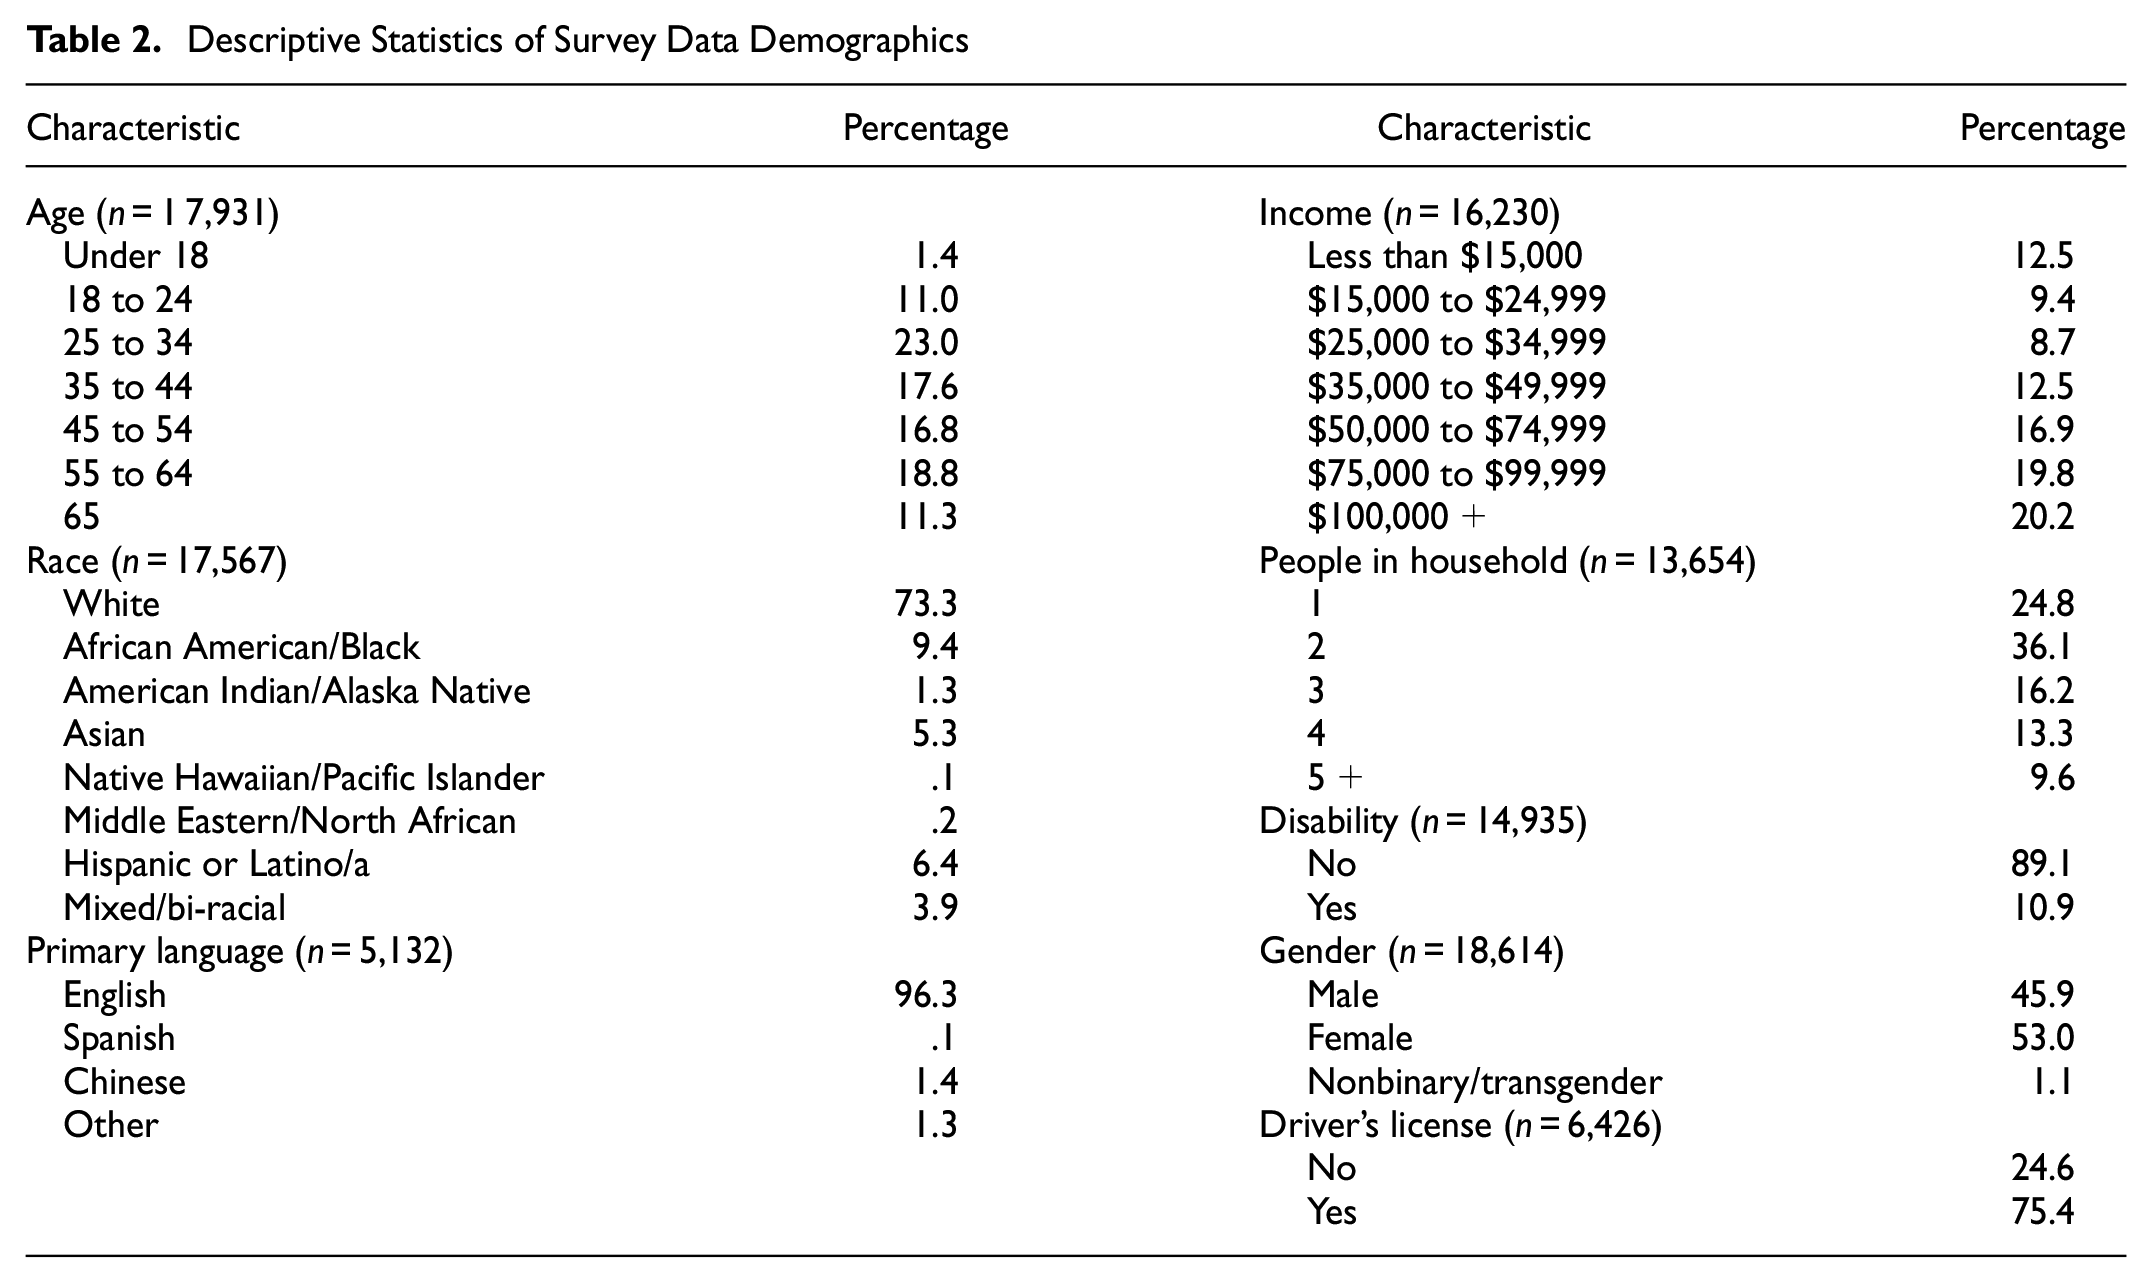
In the first step, data were formatted into .csv files, and extraneous information such as preferred routes and origin–destination questions were removed. In the second step, demographic category variables were created to standardize comparisons across agencies. The list of demographic variables of transit riders included language, gender, disability, age, number of people in the household, race, income, and possession of a driver’s license. The distribution of these descriptive statistics is summarized in Table 2. The n value differs across the demographic data as not all individuals responded to each item, and agency surveys differed in the demographic data collected. Finally, demographic variables were realigned to provide consistent categorical values across agencies, because agencies often used response different scales for the same demographic variable. For example, some agencies recorded income on a scale of $10,000 to 20,000, whereas others used a scale from $15,000 to 25,000. Some values have been more broadly characterized to accommodate the incongruent values across agencies.
Descriptive Statistics of Survey Data Demographics
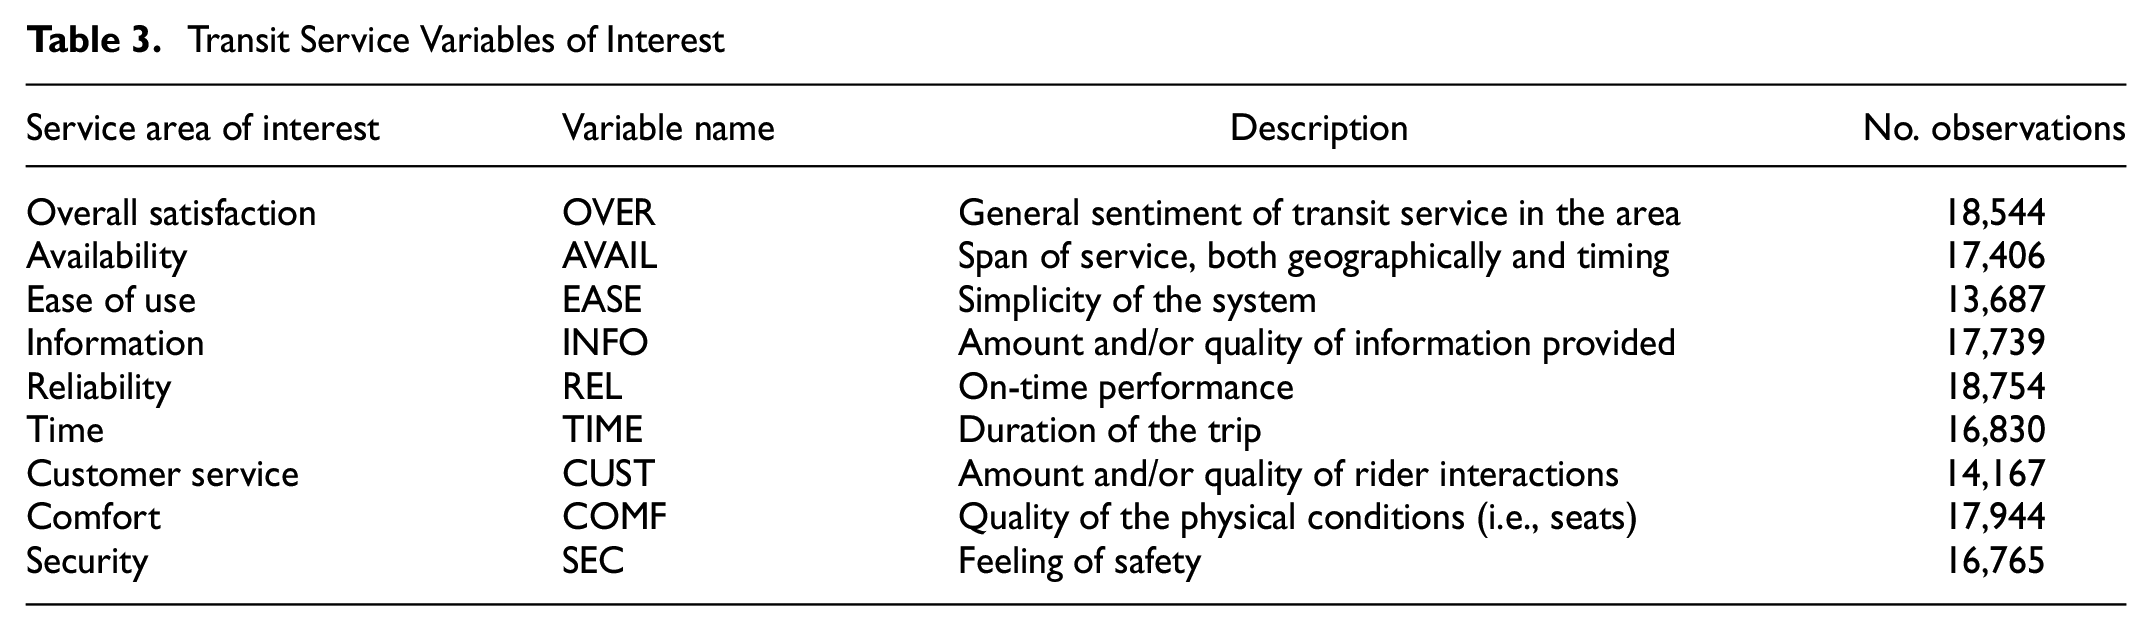
In the third data processing step, the list of transit service variables was selected, which included overall satisfaction, availability, ease of use, information, reliability, travel time, customer service, comfort, and security. These variables were selected as they were most representative of the attributes collected across the agency surveys. The questions from each agency were then assessed to determine which transit service variable, if any, best represented the data being captured by the question. In some instances, agencies did not ask any questions that addressed a selected variable. As a result, transit service variables have different n values. In other instances, agencies asked multiple questions that reflected sentiments about the same variable of interest. In these cases, the question scores were averaged to reflect a single, combined value. Responses were rounded up (≥.5) or down (<.5) to the nearest whole number. Lastly, responses were rescaled to be standard across agencies. This included ordering service satisfaction responses to a consistent Likert scale (1 = strong negative and 5 = strong positive). Table 3 summarizes the variables of interest for the service attributes and the number of responses. Figure 1 summarizes the overall distribution of Likert responses for the transit service attributes of interest.
Transit Service Variables of Interest
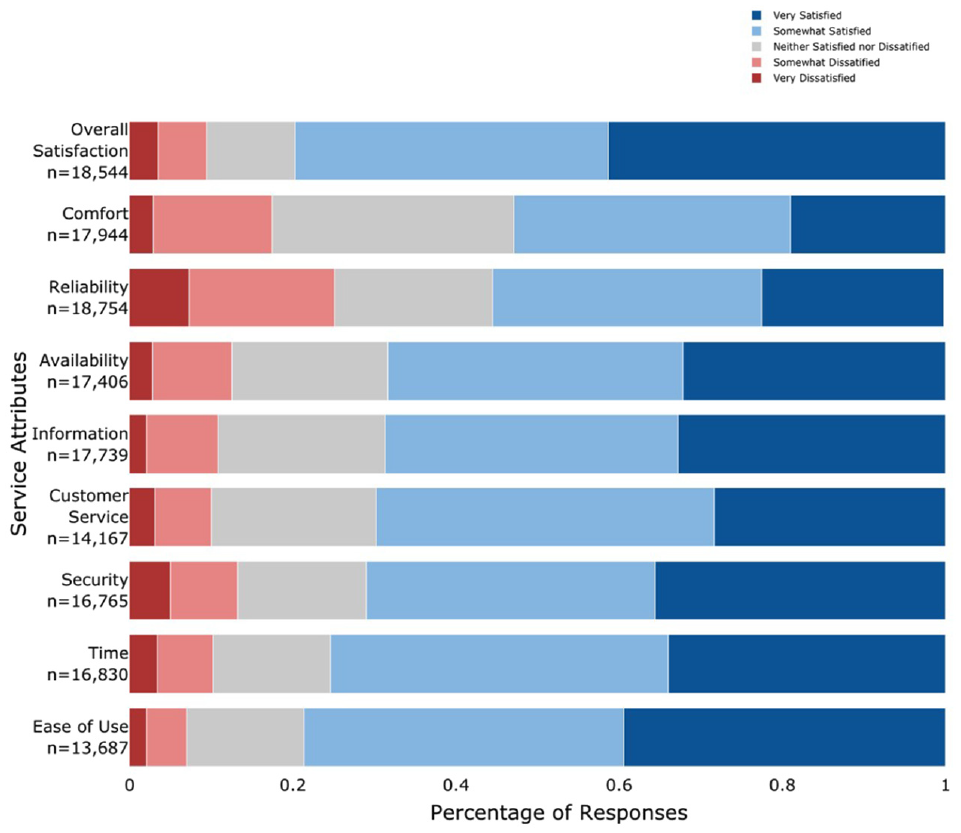
Distribution of survey responses for transit service attributes.
Results
The results of the analysis present current transit riders’ demographic profiles and satisfaction levels with the given transit service variables. This includes demonstrating the demographic diversity of transit riders and how these demographic differences correlate with different service attribute priorities.
Descriptive Statistics
As seen in Table 2, a summary of the demographic responses emphasizes the diversity of transit riders. For example, 45.9% of transit riders identified as male, whereas 53.0% of riders identified as female. With regard to race, 73.2% of transit riders identified as white compared with 9.4% identifying as African American or Black and 6.4% as Hispanic. Even within characteristics commonly associated with transit riders such as not having a driver’s license, only 24.5% of transit riders did not have a license (75.4% did). Lastly, although 89.1% of transit riders did not identify as a person with disabilities, some 10.8% of riders did, which is a substantial portion of the rider population. It is important to note that transit rider surveys can vary widely in their representativeness because of nonresponse bias and the target populations accessed. Each of these agencies was responsible for ensuring the representativeness of the survey in their service area and, given that we used the surveys as third-party data, the individual agencies must be contacted for further details.
Ordered Logit Model of Rider Satisfaction
Based on the data characteristics and previous, similar analyses, the model selected for analyzing the relationship between service attributes, demographics, and overall service satisfaction was an ordered logit model. As explained by Iseki and Smart, “ordered logit regression is a method used to examine the relationships between a series of independent variables and an ordinal, [categorical], dependent variable. … In ordered logistic regression, the particular order of values in the dependent variable is important, while differences between two consecutive values of a dependent variable are not” ( 12 , p. 169). Building on this Iseki and Smart work, the authors conducted a multivariate, ordered logit analysis of 18,544 observations to explore the relative importance of service attributes on overall satisfaction and the differences, if any, between different demographic groups. The model was estimated using the “polr” command from the MASS package in the statistical software R.
The authors constructed the single best predictive model for the data through a series of model adjustments, with the eight service attributes as potential independent variables and overall satisfaction as the dependent variable. The process involved several iterations of identifying statically significant variables, grouping responses based on the distribution of responses by factor levels and comparing different reference levels. Table 4 summarizes the outcomes of this process.
Summary of Ordered Logit Model Variations
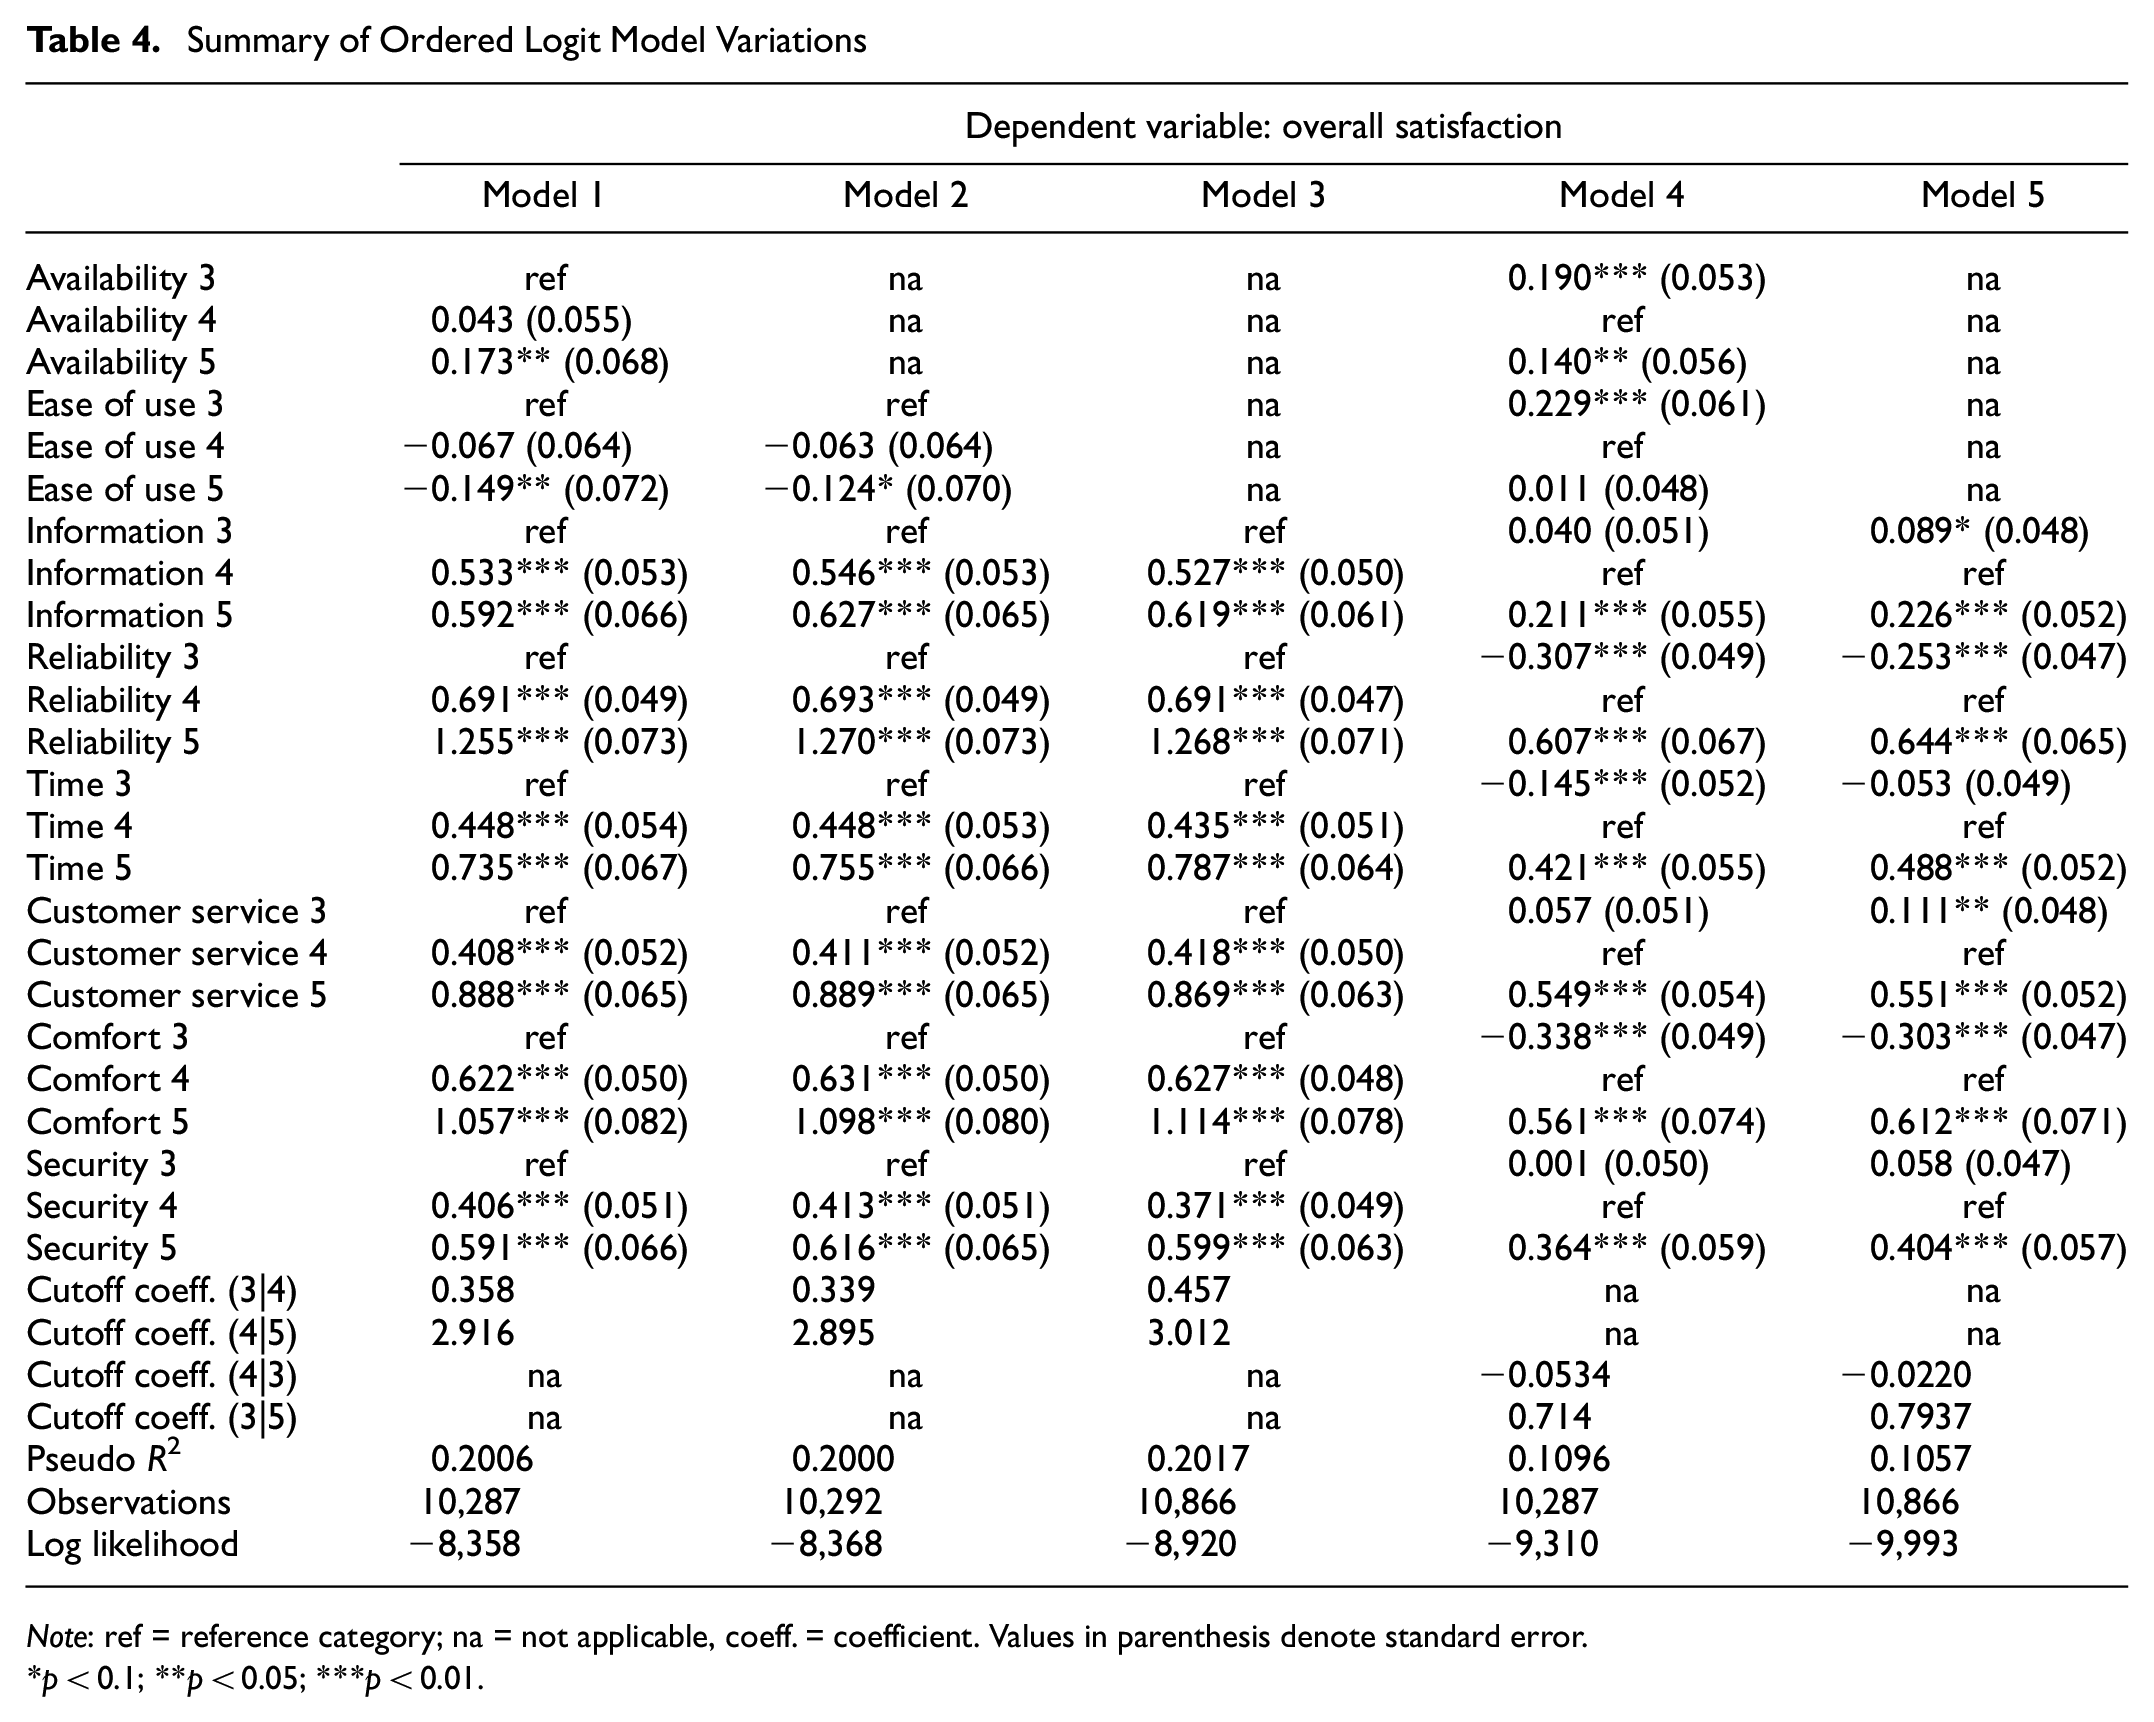
Note: ref = reference category; na = not applicable, coeff. = coefficient. Values in parenthesis denote standard error.
p < 0.1; **p < 0.05; ***p < 0.01.
Across the five model iterations, there were several similarities and differences. In all cases, the independent and dependent variables were regrouped into three categories: Categories 3, 4, and 5. Category 3 was the combination of Response levels 1, 2, and 3, which represented strong negative, somewhat negative, and neutral responses, respectively. Category 4 (i.e., Response level 4) indicated a somewhat positive response; Category 5 ( Response level 5) a strongly positive response. From this grouping, Models 1, 2, and 3 used Category 3 as reference; the only change involved pruning out the least statistically significant variables. Models 4 and 5 used Category 4 as the response level, with Model 4 retaining all the independent variables and Model 5 pruning out AVAIL and EASE. The base model, used in later analyses, is described by Model 3 in Table 4.
Overall Satisfaction Level by Demographic Subpopulation
Although analysis of the relative importance of independent variables may help direct decisions in service planning and resource allocation, considering how the relative importance varies across key demographic characteristics also supports a more equitable distribution of resources in addition to providing insights into service planning. The authors analyzed the base model across gender (Table 5), income (Table 6), and race (Table 7) groups to assess what differences, if any, existed in the relative importance of transit service attributes for overall satisfaction across demographic groups.
Overall Satisfaction by Gender
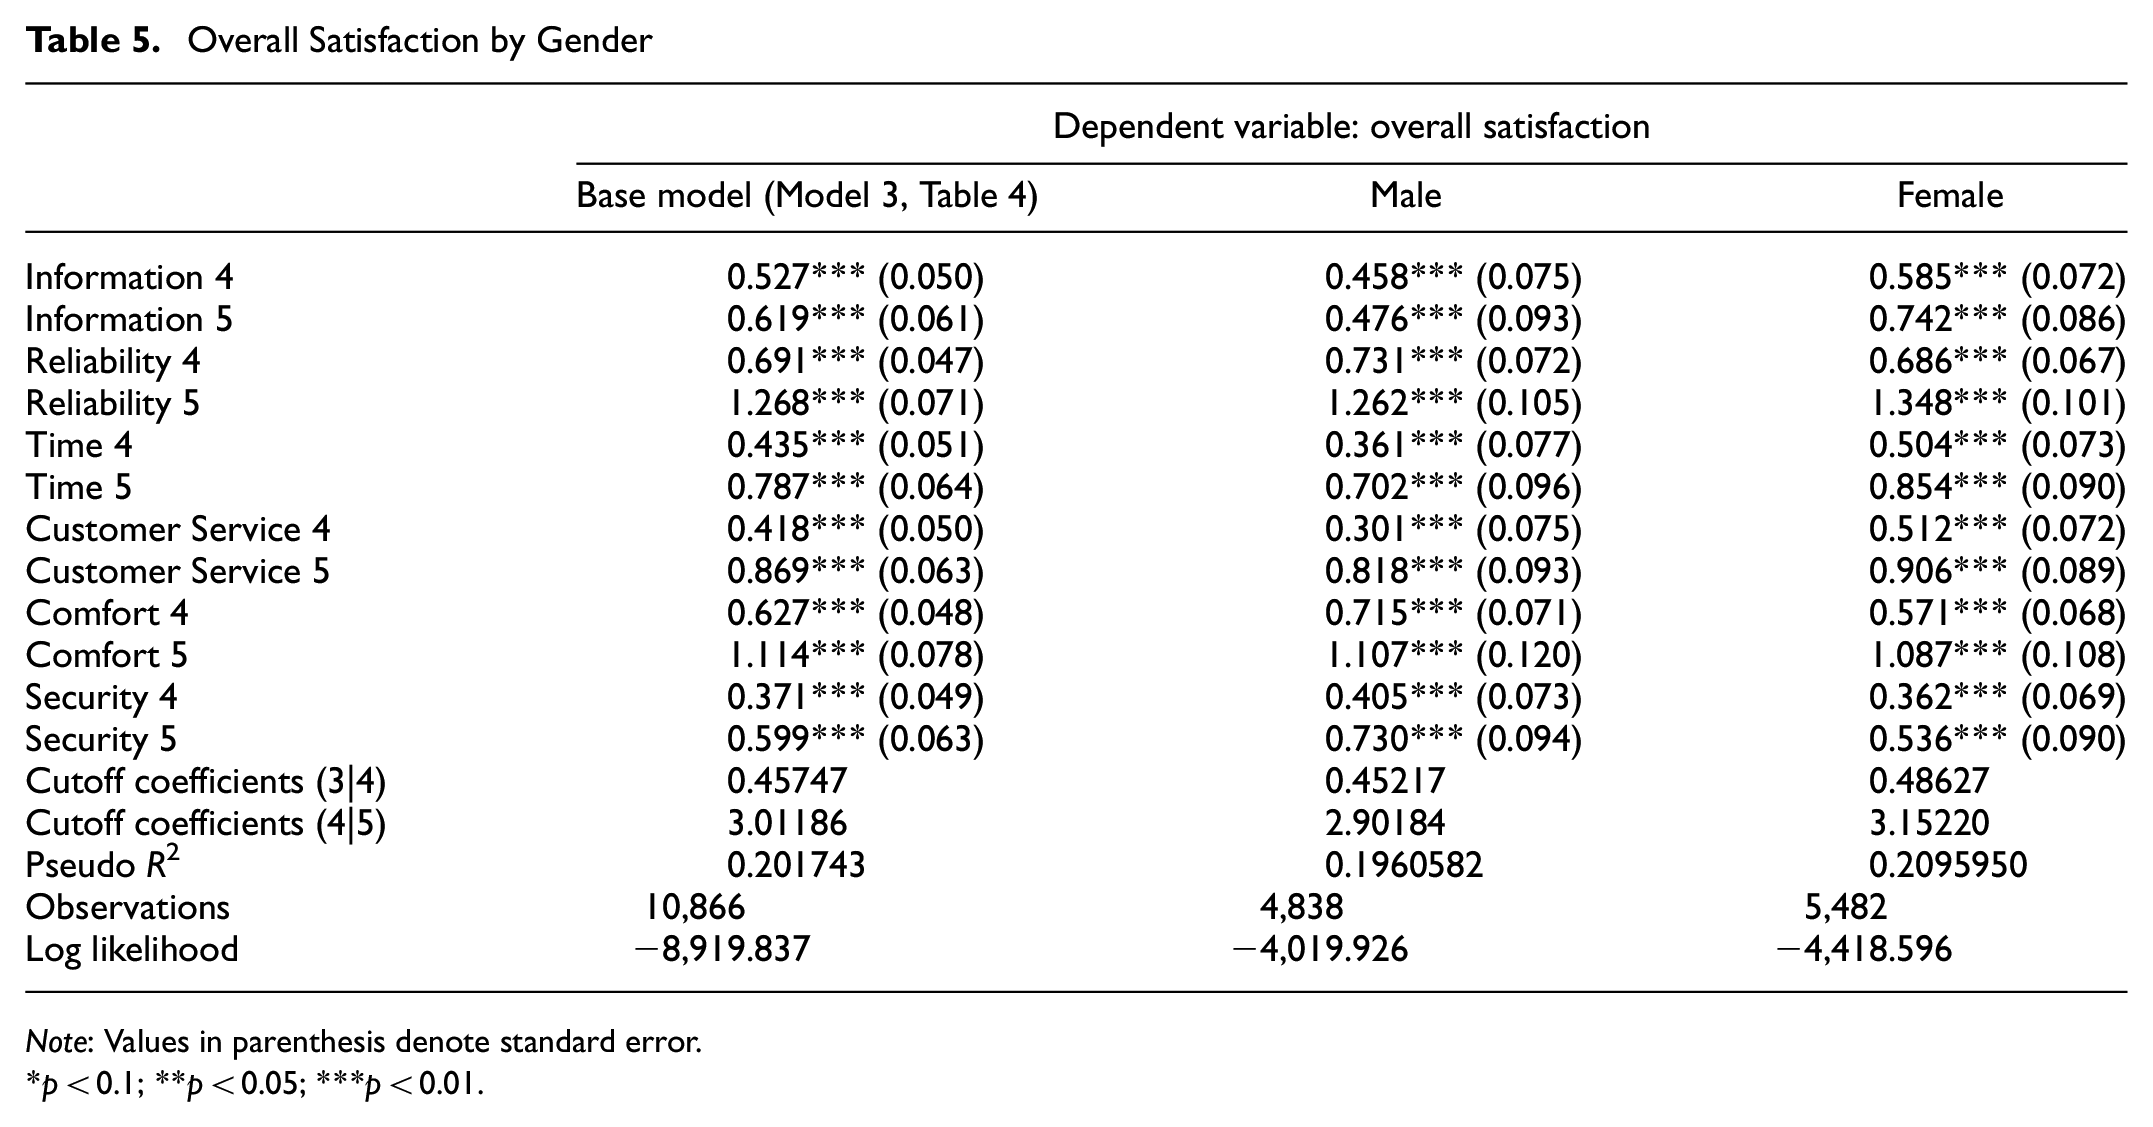
Note: Values in parenthesis denote standard error.
p < 0.1; **p < 0.05; ***p < 0.01.
Overall Satisfaction by Income
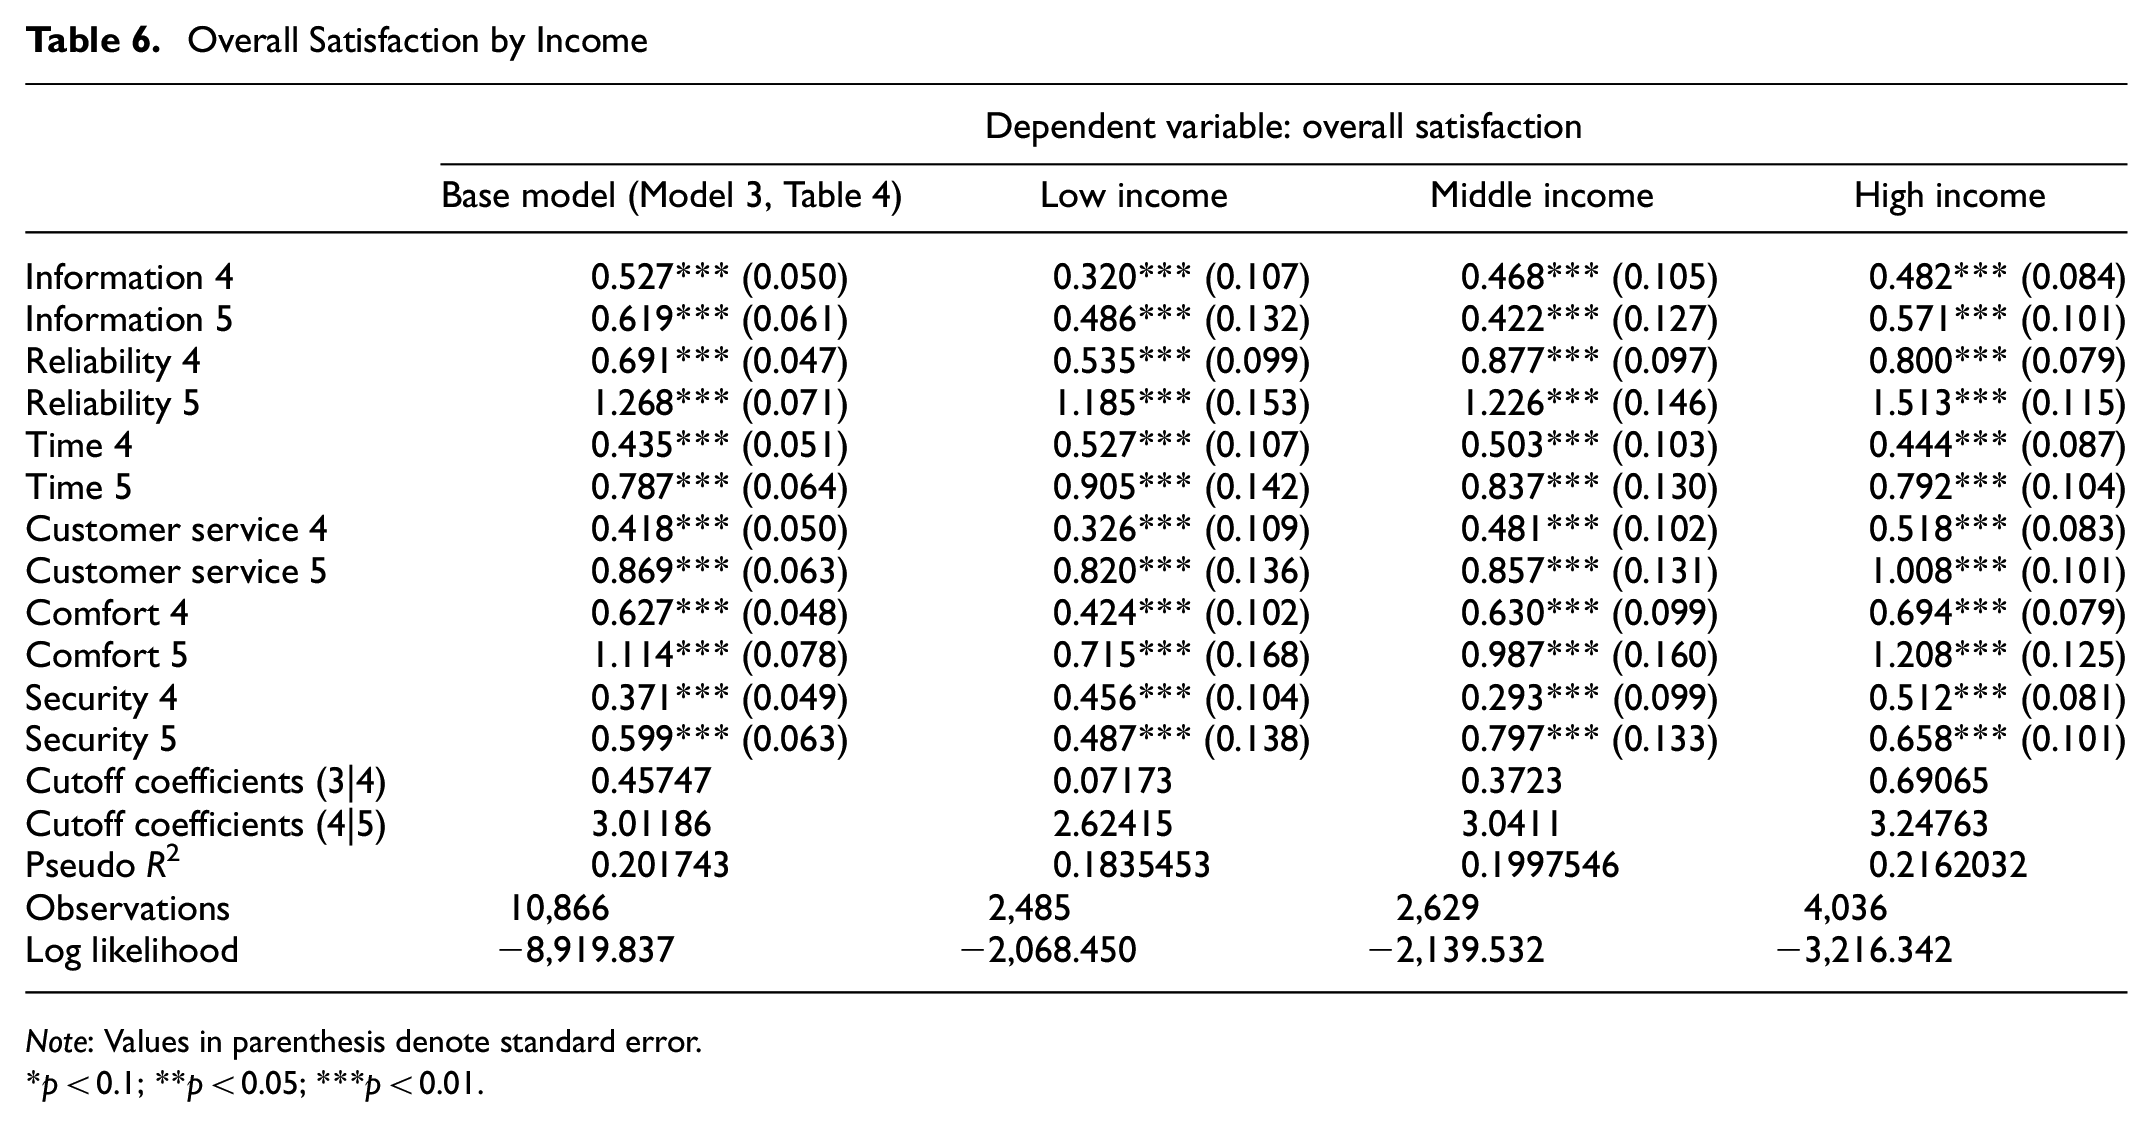
Note: Values in parenthesis denote standard error.
p < 0.1; **p < 0.05; ***p < 0.01.
Overall Satisfaction by Race
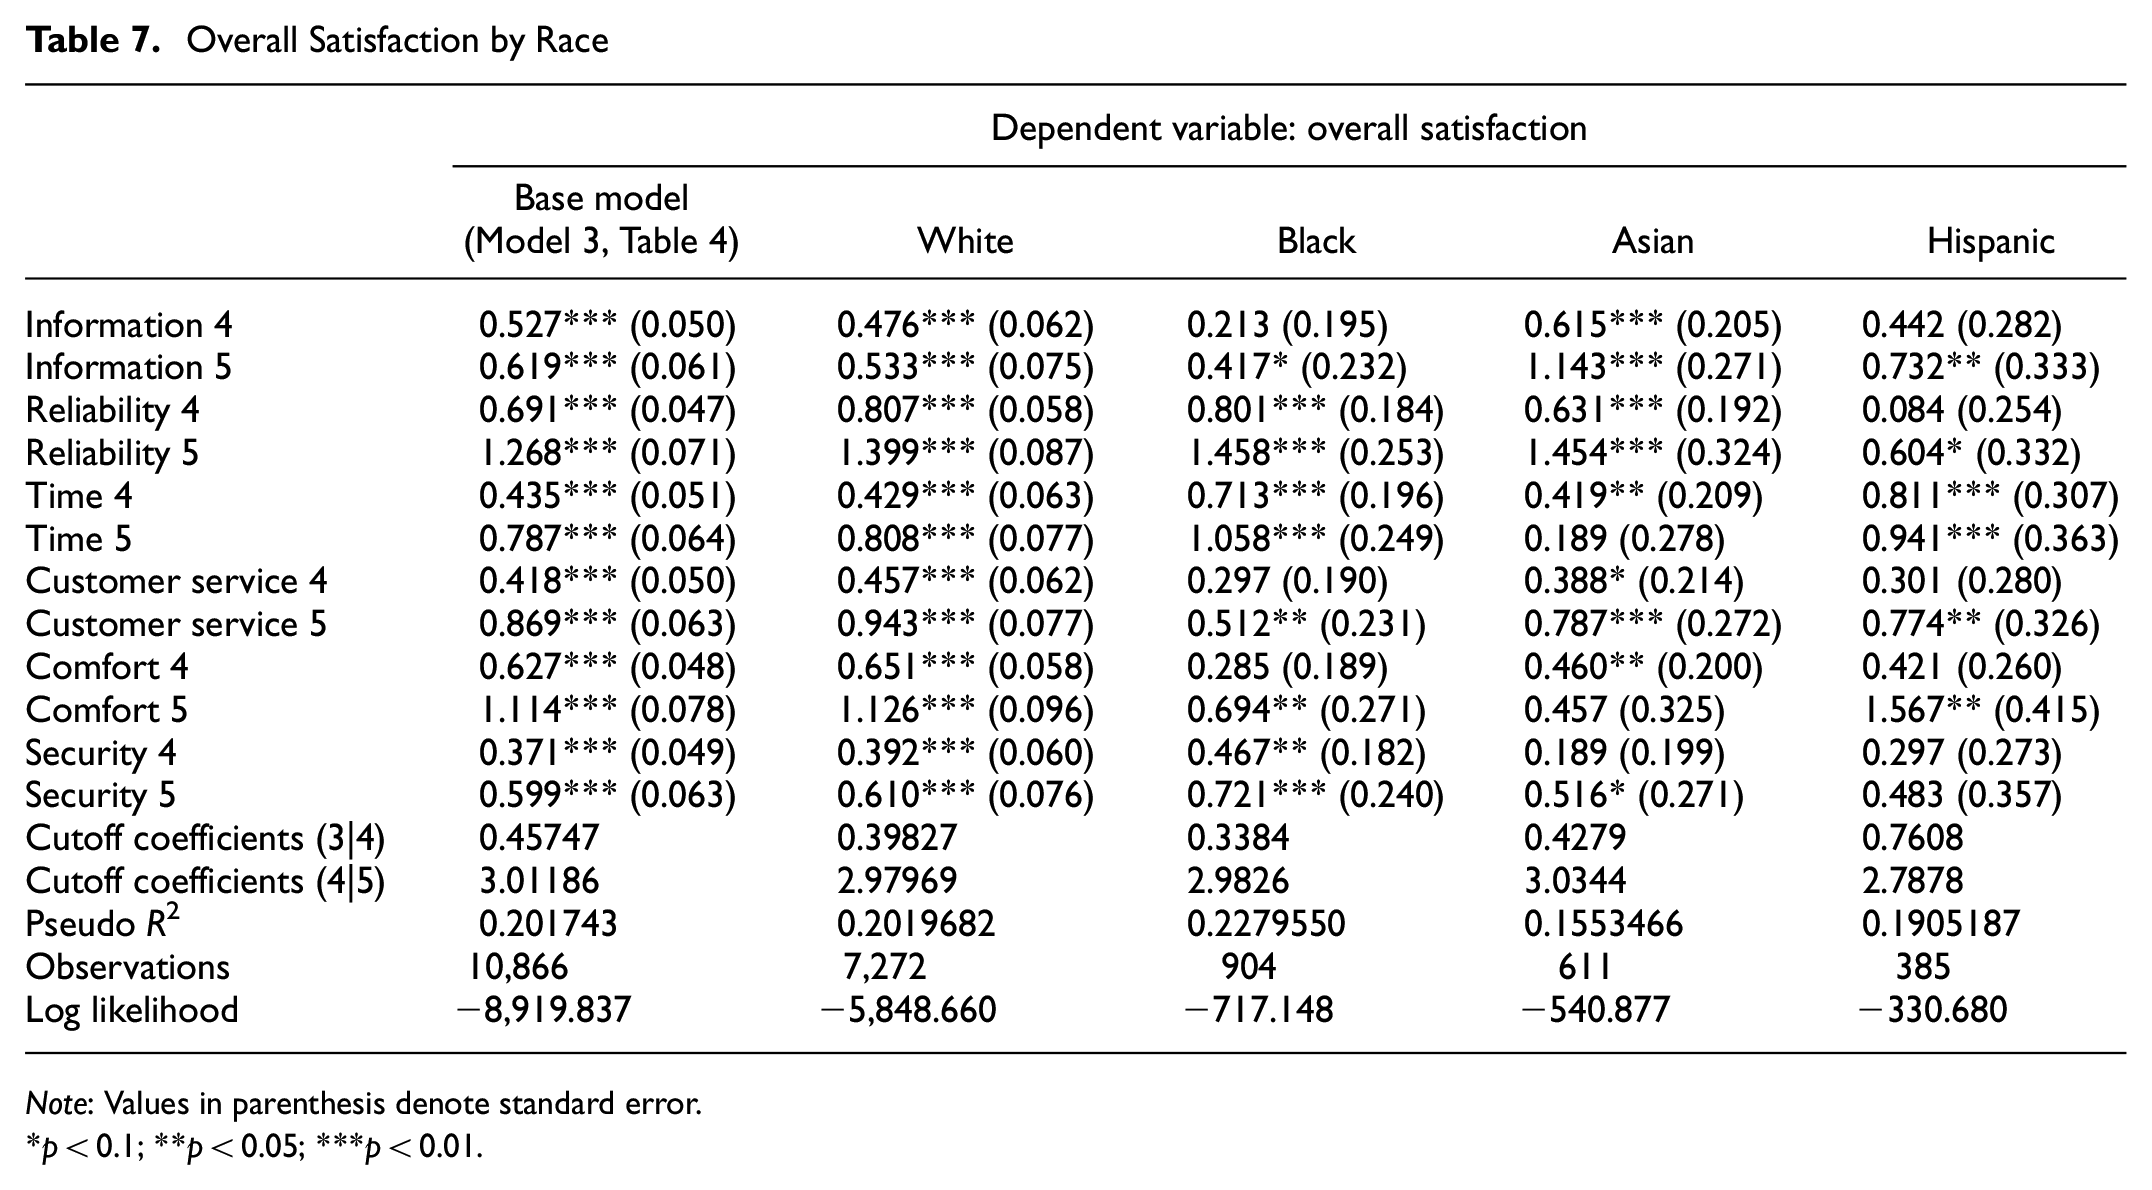
Note: Values in parenthesis denote standard error.
p < 0.1; **p < 0.05; ***p < 0.01.
When considering riders who identify as male versus female, the higher cutoff coefficient indicated that women were generally more satisfied with transit than men. The most notable trend was that women had higher coefficients for transit operating variables, that is, INFO, REL, and TIME, which captured information, reliability, and travel time of trip, respectively. Women had higher coefficients (except for Reliability 4), indicating the higher relative importance of these aspects for women than men. This was contrasted with men who had larger coefficients for the values capturing comfort and security, which are more directly related to customer experience. Interestingly, reliability was split, indicating very high ratings of reliability being more important to women, but moderately high ratings of reliability being more important to men. The finding for security was interesting, as previous studies have shown this aspect to be more important to women.
Although nearly every transit agency asked about the income levels of riders, agencies differed in the scales and ranges of their income categories. As a result, during the data standardization process, income ranges were condensed down into three broad categories: low-, middle-, and high income. Low income is generally taken to be less than $35,000, middle income is $35,000 to $74,999, and high income is greater than $75,000.
The higher cutoff coefficient for high-income riders meant that they were generally more satisfied with transit, which is logical given that high-income riders are likely to have more travel options and would not take transit if they were not satisfied with the service. In general, coefficients across income levels tended to follow a pattern in which either the low income or high income were below the base coefficient, with the other income group being above the base coefficient. The coefficient of middle-income riders was generally between the values of the low- and high-income riders, although the middle-income coefficient may be closer to one income group than the other. This is best exemplified when looking at reliability, customer service, and comfort, which all had higher importance for higher-income riders. In contrast, travel time was more important for lower-income riders. Although there was certainly variation across the income groups, there was also some consensus across service attributes. For example, reliability consistently had some of the largest coefficients, regardless of income.
The last demographic category is race, and similar to income, categories of responses varied across agencies. As a result, only a few race categories were applicable across agencies, and even then, there was a large range in the number of n values.
Based on the cutoff coefficients, Asian riders tended to be most satisfied, although Hispanic riders were more likely to be moderately satisfied overall. Of the demographic variables that were analyzed, responses by race had the greatest variation. Analysis by race was also the only demographic grouping in which there were coefficients that were not statistically significant. This was especially the case for Asian and Hispanic riders. However, similar to income, whereas there was variation across race, there were similar trends across service attributes, with reliability and comfort having some of the highest coefficients. Black riders had the highest coefficients for safety, whereas white riders had higher coefficients for customer service and comfort. Information availability was highest for Asian riders.
Discussion and Limitations
When considering the demographic distribution of survey respondents, the selection of agencies may disproportionately over or underrepresent certain groups. For example, Boston and San Francisco are two of the most expensive cities in the United States. As such, when comparing absolute incomes in Boston and San Francisco to average incomes across the United States, the incomes of those two cities tend to be higher than the national average. This neglects the reality that once the elevated cost of living is controlled for, incomes in Boston and San Francisco may be relatively more comparable to other metropolitan areas. However, the absolute values are still likely to skew the income distribution of transit riders nationally. A more holistic and diverse sampling of transit agencies nationally should correct these concerns in future analyses.
Variations in the relative importance of service attributes on overall satisfaction across demographic groups may have important implications, and explanations for the results of the analysis could help contextualize these findings to make them more operational. Looking at male versus female riders, the relative gender differences in coefficient ratings suggests that women tended to value better service over amenities such as a more comfortable ride. Interestingly, men had higher coefficients for security, indicating that feelings of security were relatively more important for overall satisfaction. However, issues with women’s safety in transit has long been documented, and there are several reasons why these concerns may not be reflected in security being given a higher relative importance for the overall satisfaction for women. The first is that the data were for current transit riders, so it is possible that there are women who are so deeply concerned about their safety that they do not take transit at all. Furthermore, within the groups of women who are riders, there may be different trip patterns or other identities that shape their transit journey and overall experience ( 19 ).
Overall satisfaction by income and race reaffirmed that riders of different income and race groups had different values for service attributes in the way they relate to overall satisfaction. However, the differences may not be that large, and there may still be consensus across groups about what are the most important aspects. For example, across income and race groups, reliability was consistently one of the most important service attributes. Thus, interventions that increase reliability are likely to improve satisfaction for several different types of transit riders. However, it has long been understood that income and race are highly correlated in the United States, which has far-reaching effects across society, including spatial distribution, location in relation to jobs and resources, and transportation accessibility ( 20 ). As such, isolating the effects of income and race on transit satisfaction is not only difficult but potentially counterintuitive.
Whereas the quantitative results of this analysis can be leveraged to support policy decisions, the results should be paired with a more holistic understanding of the complexities of transit riders and their experiences. As discussed above, there are several external or limiting factors that may qualify application of these analyses. An important caveat to this work is that the specifics of the agencies from which data were collated are likely to have a significant impact on the overall results. However, a broader, national analysis could emphasize that there are nonetheless shared sentiments across agencies and different rider groups. As such, this study supports the need for more concerted efforts to address areas of concern such as nationwide declining ridership that reflect the larger challenges facing transit as an industry, while balancing the unique contexts and challenges facing individual agencies.
Conclusions
This study used order logit regression to look at differences in the relative importance of service attributes for demographic subpopulations. The findings from the synthesis of the data and application of regression models highlighted the diversity of transit riders and revealed the variance in rider satisfaction by demographic subpopulations. Challenges with the consistency and quality of the data limited certain dimensions of the analysis, but the commonalities and divergences identified between demographic subpopulations suggested opportunities for cross-cutting priorities with opportunities to support the specific needs of certain demographic groups.
The results of this analysis support the conclusion that different categories of riders place different levels of importance on different service attributes. By gender, women tended to place more importance on operating features such as reliability and duration of trips than men, who prioritized comfort and security. When dividing riders by income group, high-income riders were generally more satisfied with transit, supporting what may be a choice to take transit. Reliability, customer service, and comfort all had higher importance for higher-income riders, whereas travel time was more important for lower-income riders. Lastly, different racial identities had the most varied relative importance and degrees of statistical significance. Black riders had the highest coefficients for safety, white riders had higher coefficients for customer service and comfort, and information availability was highest for Asian riders. The coefficients for reliability and comfort were some of the highest across races. In fact, reliability and comfort were relatively important to several demographic subpopulations, suggesting that these two service attributes were significant across groups. Other differences across gender, income, and race could be attributed to variations in how, when, and why transit services are used, leading to differences in how the service is experienced. The findings from this analysis can be leveraged by planners and transit agencies to more efficiently allocate resources to areas of service that are most important to riders, helping to keep existing riders and potentially attracting new riders of similar demographic profiles.
The findings presented in this paper build on previously conducted studies and provide new contributions as well. Most notably, this study looked at transit rider across the United States using data from nine diverse agencies. It also looked at rider demographics more closely, recognizing the nuanced and overlapping ways that different identities intersect to create complex rider profiles beyond those of simply choice and captive riders.
Recommendations
Based on the processes and results of this study, there are several key recommendations. The first is the need for more consistent data across agencies. Although each agency has its own goals and values, agencies across the United States often share similar challenges and opportunities, particularly around federal policies and funding. A standardized set of transit service and demographic questions that could be reported back to FTA would allow for better data access, standardized criteria for assessment, and simpler comparisons across agencies and the United States as a whole. Such data would be useful for individual agencies as well as for informing federal policy decisions. The authors recommend asking questions around the following service areas: frequency, coverage, reliability, ease of use, information availability, time/length of trip, customer service, comfort, and security/safety. Demographic areas of interest include age, gender, race, income, and possession of a driver’s license. These questions should be paired with origin–destination data to allow spatial analyses of differences in rider perceptions. In most cases, agencies already ask questions around these service and demographic qualities. However, inconsistent question wording, variable response scales, and varying data collection methods make comparing this critical information difficult across multiple agencies.
There are numerous avenues through which to build on the work started in this paper. A more robust or diverse group of agencies could provide a more nuanced regional and national analysis. Similarly, different classifications and groupings of transit services might yield more concrete and actionable areas for interventions. Lastly, more categories and complex combinations of demographic variables might provide a more complete picture of transit rider profiles, further challenging the captive versus choice rider distinction and allowing planners and transit agencies to make more efficient and equitable decisions to better suit their riders.
Footnotes
Acknowledgements
The authors would like to acknowledge Kelly Mi for her assistance in data cleaning and standardization. The authors are grateful to the transit agencies for sharing their data and thank the transit riders for their time in completing the rider satisfaction surveys.
Author Contributions
The authors confirm contribution to the paper as follows: study conception and design: B. Mers, K. Watkins; data collection: B. Mers; analysis and interpretation of results: K. Watkins, B. Mers, M. Hunter; draft manuscript preparation: B. Mers, K. Watkins, M. Hunter. All authors reviewed the results and approved the final version of the manuscript.
Declaration of Conflicting Interests
The authors declared no potential conflicts of interest with respect to the research, authorship, and/or publication of this article.
Funding
The authors disclosed receipt of the following financial support for the research, authorship, and/or publication of this article: This research was funded by the Transit—Serving Communities Optimally, Responsively, and Efficiently (T-SCORE) Center, a USDOT university transportation center.