
Abstract
The present study proposed a real-time traffic safety evaluation framework using macroscopic flow variables. To this end, open-access extended vehicle trajectories were employed. Rear-end traffic conflicts and macroscopic traffic flow variables were derived from the trajectory data and were integrated for real-time safety evaluation. The Proportion of Stopping distance (PSD) accounts for all types of interactions (both safe and unsafe) in the traffic stream; therefore, the same was adopted to analyze the rear-end traffic conflicts. A macroscopic indicator termed “time spent in conflict (TSC)” was derived to evaluate the rear-end traffic conflicts. Machine learning models, namely, Random Forest (RF), Support Vector Machines (SVM), and eXtreme Gradient Boosting (XGB), were employed to predict TSCs using macroscopic traffic flow variables. The results revealed that the TSC computed based on PSD exhibits a reliable and explainable relationship with the macroscopic traffic flow variables. TSC computed based on PSD revealed that intermediately congested traffic flow conditions are critical in traffic safety and can be attributed to complex traffic phenomena such as traffic hysteresis, traffic oscillations, and increased speed variance. Moreover, a stable relation between traffic safety and traffic flow was suggested for varying threshold values. Among different machine learning models, the RF model was observed as the best-fitted model to predict TSC based on macroscopic traffic variables. TSC quantifies the safety status of a given traffic flow condition, where a higher value of TSC for a particular traffic flow condition indicates that vehicles prevail in the conflicting scenario for a longer time and, therefore, reflect higher operational risk. The developed machine learning model can be employed to predict TSC (operational risk) in real time using the macroscopic traffic flow variables and, therefore, facilitate traffic safety monitoring.
Keywords
Real-time traffic safety evaluation conceptualizes that “the probability of a crash occurring on a specific road section within a very short time window can be predicted using the instantaneous traffic dynamics” ( 1 ). The model for real-time safety evaluation primarily uses collision data and establishes an association between collision and traffic dynamics ( 2 – 4 ). Besides collisions, collision severity ( 5 , 6 ) and collision type ( 7 , 8 ) are also considered for developing real-time collision models. The main inputs for real-time collision models are collision and traffic dynamics. Traffic dynamics data collected using loop detectors ( 9 – 11 ), Bluetooth detectors ( 4 , 12 ), probe vehicles ( 13 ), or other sources like radar sensors ( 14 , 15 ) were integrated with the collision database to develop real-time collision prediction models. Other than traffic dynamics, variables related to geometry, weather conditions, and pavement conditions were also considered for developing real-time collision prediction models.
It is well articulated that collision-based safety evaluation suffers from known disadvantages related to (a) the requirement for accurate collision records, (b) long data-collection time, and (c) transferability to locations with new roads. As a result of these disadvantages, the application of a real-time collision prediction model, although having good predictive accuracy, subsides. Recently, researchers worldwide have promoted the use of traffic conflicts to evaluate traffic safety ( 16 – 18 ). With the availability of high-resolution, detailed datasets such as Naturalistic Driving Studies (NDS), and vehicle trajectories (extracted using advanced sensors like radar sensors [ 19 , 20 ] and improved video processing techniques [ 21 , 22 ]), the application of traffic conflicts for crash causation and traffic safety assessment seems to be a more prudent, rational, and practical approach. Traffic conflict is “an observable situation in which two or more road users approach each other in time and space to the extent that there is a risk of collision if their movements remain unchanged” ( 23 ). Traffic conflict-based safety analysis offers proven benefits over collisions. Traffic conflicts can (a) assess traffic safety effectively using short-duration data, as traffic conflicts are more common than collisions and can be easily observed, (b) establish a link between risk and different design elements, (c) provide information about unsafe interactions, and thus establish an association between driving behavior and risk, and (d) provide insight about failure mechanisms leading to collisions ( 24 ). Different surrogate safety measures (SSMs), which report the proximity in time or space of various road users to an anticipated collision spot, are developed. Post-encroachment time (PET), time to collision (TTC), deceleration rate, proportion of stopping distance (PSD), time-integrated TTC (TIT), and modified TTC (MTTC) are some of the widely used SSMs.
Recent studies have attempted to develop conflict prediction models by establishing an association between traffic conflicts and traffic flow characteristics. Two approaches, (a) aggregated approach and (b) disaggregated approach, are most famous for traffic conflict studies. The aggregated approach relates the characteristics of conflicts like conflict frequency ( 25 – 29 ) or duration of a conflict ( 30 ), collision risk ( 31 – 34 ), conflict rate ( 35 ), and conflict severity ( 36 ) to traffic flow characteristics. In the disaggregated approach, traffic conflict (binary variable, 1 if conflict, and 0 if non-conflict) is related to vehicle kinematics and traffic dynamics ( 37 – 44 ). In all the studies mentioned above, rear-end traffic conflicts were analyzed using high-quality vehicle trajectories.
Research Motivation and Objectives
From the above discussion, the following points are noted:
First, evaluating traffic conflicts warrants high-quality vehicular trajectories. Empirical vehicle trajectories are extracted from video using manual or automated extraction techniques. Mining vehicle trajectories is time-consuming, tiring, and difficult to extract in real time. Further, the use of simulated trajectories for safety evaluation is inherently dependent on the robustness of the calibration and validation of the simulation model. Therefore, there is a strong need to develop a framework that establishes a relationship between traffic conflicts and traffic flow characteristics. This framework has the following advantages. First, macroscopic traffic variables at the link or network level can be estimated using loop detectors, Wi-Fi/Bluetooth, and radio frequency identification (RFID) sensors. Thus, the correlation between traffic conflict and macroscopic traffic variables will eliminate the need for a high-quality microscopic dataset for real-time safety analysis. Second, the framework can facilitate network-level traffic safety assessment, which, otherwise, is extremely difficult.
Second, most studies establishing an association between traffic conflicts and traffic flow characteristics have focused on the occurrence of conflict (binary outcome 1 if conflict, and 0 if non-conflict). However, studies focusing on establishing an association between conflict characteristics (conflict frequency, conflict rate, and conflict duration) and traffic flow characteristics are limited. Conflict characteristics quantify the safety status related to the fundamental relation of traffic flow and, therefore, can assist in developing traffic control strategies to establish a tradeoff between traffic efficiency and safety.
Third, most studies are reported for homogenous and lane-discipline traffic conditions. However, those for heterogeneous and weak lane-discipline traffic are lacking. Under heterogeneous and weak lane-discipline traffic conditions, vehicles with varying static and dynamic properties interact with each other simultaneously in lateral and longitudinal dimensions. Therefore, analyzing traffic conflict under heterogeneous and weak lane-discipline traffic is thought-provoking and challenging. For these conditions, a conflict prediction model based on macroscopic variables could be one of the potential prospects for safety evaluation.
With this motivation, the present study develops a novel traffic conflict-based model for real-time traffic safety evaluation under heterogeneous and weak-lane traffic conditions. Rear-end traffic conflicts and macroscopic traffic flow variables are derived from the trajectory data and are integrated for real-time safety evaluation. In the present study, “time spent in conflict (TSC),” proposed by Mohamaddian et al. ( 30 ), is used as an indicator to evaluate traffic conflicts. The TSCs are modeled as a function of macroscopic traffic flow variables using different machine learning algorithms to facilitate real-time applications. The proposed conflict model has two significant contributions: (a) it eliminates the need for trajectory data for real-time traffic evaluation by correlating traffic conflicts with traffic flow characteristics; (b) as TSCs are used to evaluate traffic conflict, the proposed model will quantify the safety status of traffic flow conditions, thus facilitating a tradeoff between traffic efficiency and safety.
The remainder of the paper is organized into five sections. The next section explains the data employed in the study, which are the vehicle trajectory data for a mid-block section of a six-lane divided Dumas Road in Surat. The following section comprehensively explains the methodology adopted for the computation of macroscopic traffic flow variables and TSC. The evaluation of the proposed methodology for the empirical dataset is then presented, followed by the practical implications. Finally, the concluding remarks are presented.
Dataset
The open-access extended vehicle trajectory dataset for a six-lane divided urban mid-block road is selected in the study. The speed limit of the study section is 80 km/h. The data can be retrieved from (https://shriniwasprofile.wordpress.com/open-source-data-from-our-research-group/). The details on the development of extended vehicle trajectories can be found in Raju et al. ( 45 ). The details of the extended vehicle trajectories are summarized in Table 1.
Trajectory data details
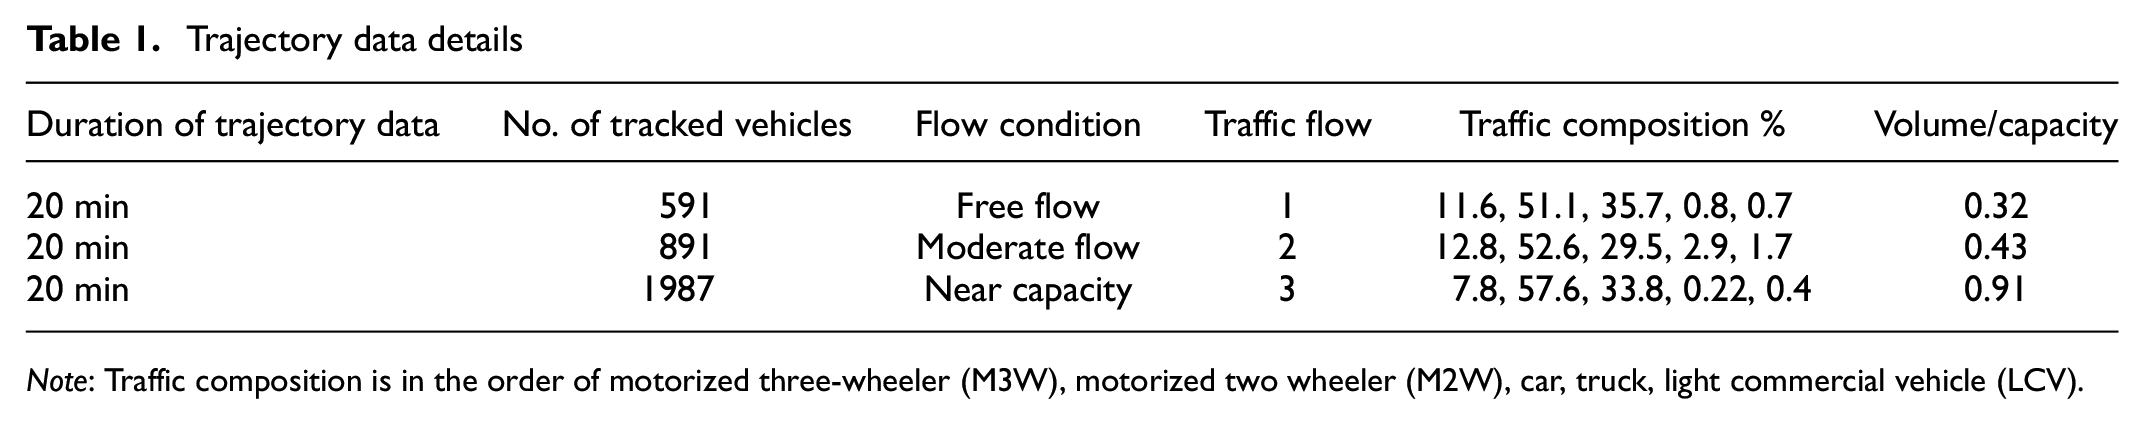
Note: Traffic composition is in the order of motorized three-wheeler (M3W), motorized two wheeler (M2W), car, truck, light commercial vehicle (LCV).
The retrieved vehicle trajectories were smoothened to reduce the noise in the dataset. For instance, tracking vehicles from the video can produce local errors, which can give rise to higher values of instantaneous acceleration/deceleration or speeds. Therefore, information on vehicle kinematics is essential to detect and reduce errors ( 46 ). Researchers have applied the smoothening technique to reduce errors ( 47 – 49 ). Punzo et al. reported that smoothening could remove the random component of the error ( 50 ). The present study uses a seven-point moving average method to smoothen the vehicle trajectories ( 51 ). The vehicle trajectories for different flow conditions are illustrated in Figure 1.
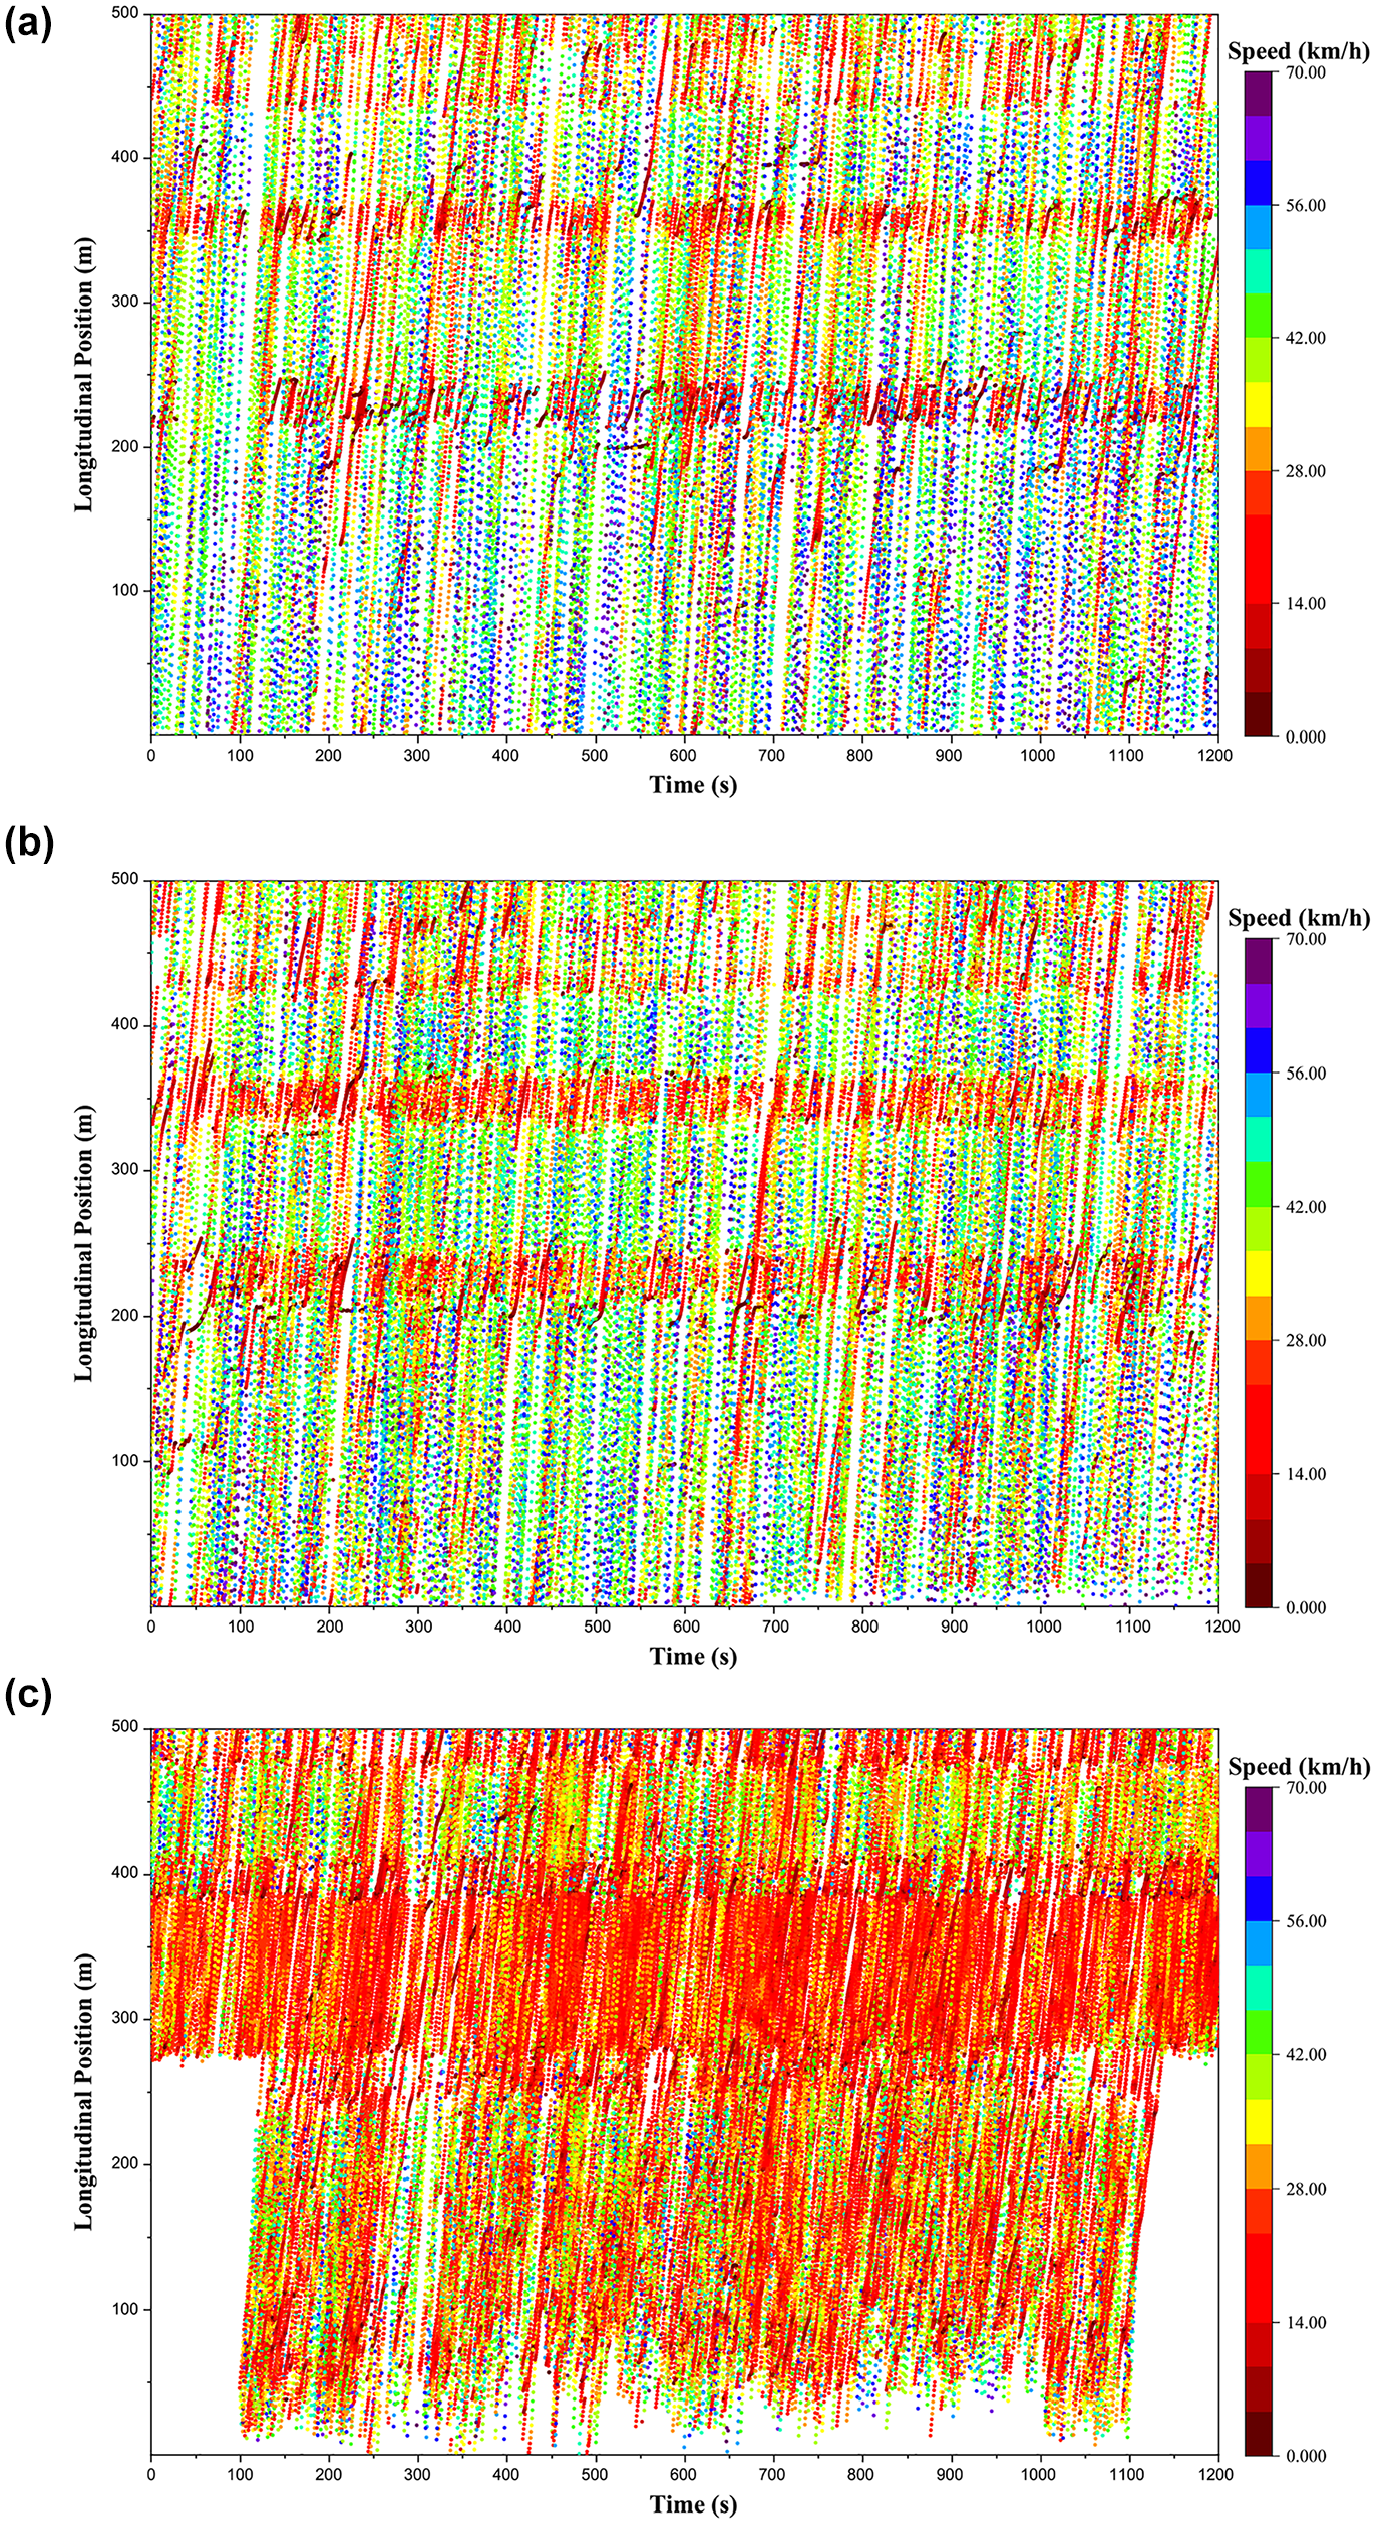
Extended vehicle trajectories for the subject study location: (a) low-flow conditions, (b) medium-flow conditions, and (c) high-flow conditions.
Figure 1 illustrates the speed distribution in the space–time plane for three varying flow levels. It can be noted that for low-flow conditions (V/C = 0.3), vehicles travel at higher speeds (green points). This can be attributed to lesser vehicle-to-vehicle interactions, highlighting that vehicles can travel at their desired speeds. However, vehicle-to-vehicle interaction increases for medium (V/C = 0.43) and high-flow conditions (V/C = 0.91). Therefore, the subject vehicle’s speed is influenced by the surrounding vehicles. As a result of these increased vehicle-to-vehicle interactions, vehicle travel at relatively lesser speeds (higher density of red points) compared with low-flow conditions. The varying magnitude of speed over space and time has significant implications for both efficiency and safety of the traffic stream. The vehicle trajectories can be employed to elicit the safety status of a given traffic flow condition, as explained in the next section.
Methodology
It is imperative to derive leader–follower pairs to identify and analyze potential rear-end traffic conflicts. It is well articulated that vehicles under heterogeneous and weak lane-discipline traffic conditions do not follow a specific lane and exhibit a high degree of disorder because of continuous lateral movements. As a result, vehicles can occupy any position on the roadway. The continuous lateral movement results in multiple leader–follower pairs, staggered following conditions, following between vehicles, and seepage behavior ( 48 , 49 , 52–55). Because of the inherent complexities associated with driving behavior under heterogeneous traffic conditions, a robust methodology for deriving leader–follower pairs is imperative. The present study adopts the methodology proposed by Chauhan et al. ( 49 ) to identify leader–follower pairs from trajectory data. The methodology is explained next.
Estimation of Leader–Follower Pairs
The methodology proposed by Chauhan et al. ( 49 ) is based on the principles of lateral threshold (LT), lateral clearance (LC), and lateral gap (LG).
Mathematically, LT and LG can be represented as:


where LT = lateral threshold, Yi = lateral position of vehicle i on the carriageway, w = width of a vehicle, Lv and Tv = leading and trailing vehicles, LCi = lateral clearance, and LG = lateral gap.
Chauhan et al. assumed that a vehicle would not move into the desired position if the LG available is less than the LT and will aim to maintain its trajectory until the desired conditions are met (LG greater than the LT) ( 49 ). Figure 2 illustrates the traffic scenario at a time (t).
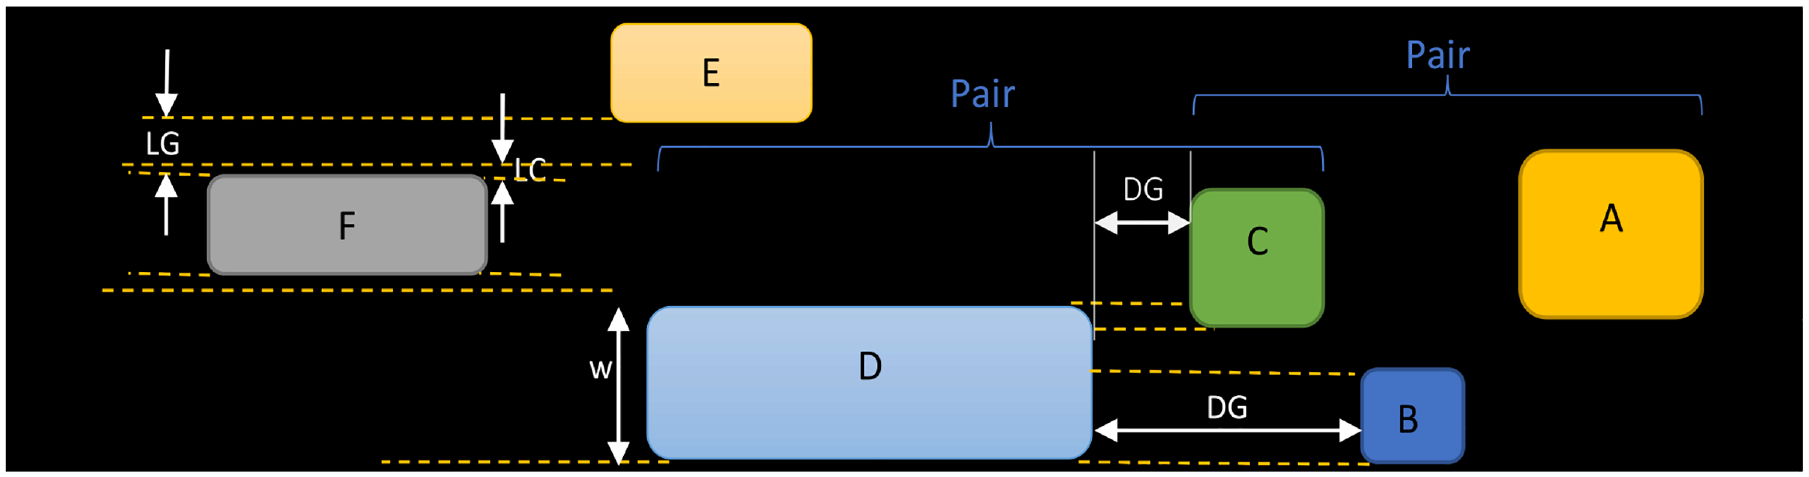
Identification of leader–follower pairs (redeveloped by authors).
From Figure 2, it can be noted that vehicle A and vehicle C fall in the same lane and, thus, can be considered a leader–follower pair. As noted, the width of vehicle D significantly overlaps the width of vehicle C and vehicle B, signifying staggered following conditions. However, the distance gap (DG) between vehicles D and C is less than the distance gap between vehicles D and B. Therefore, vehicle C and vehicle D are considered the leader–follower pair.
The leader–follower pairs for the time interval i are identified if the following conditions are satisfied:

where
Leader and follower pairs are identified using the first two conditions of Equation 3. In contrast, the issue of several leading vehicles in the lateral threshold zone is covered using the third condition of Equation 3. A MATLAB script was developed to identify the leader–follower pairs based on the above situation.
Estimation of Macroscopic Indicators of Traffic Flow and Traffic Safety
Considering the vehicle trajectories as illustrated in Figure 1, the macroscopic flow characteristics, namely, traffic density (k(x, t)), traffic flow (Q(x, t)), and speed (V(x, t)) can be computed using Edie’s generalized definition ( 47 ) as:


where
Traffic conflicts resulting from vehicle-to-vehicle or vehicle-to-pedestrian interactions are microscopic and, therefore, would inherently depend on drivers’ and pedestrians’ behavior. However, a macroscopic indicator is imperative to evaluate traffic conflicts from a macroscopic perspective. Mohammadian et al. proposed TSC as a macroscopic indicator derived using traffic conflicts ( 30 ). TSC represents the total time spent by all the vehicles in a conflicting situation based on a given conflict measure. A higher value of TSC for a particular traffic flow condition indicates higher risk and, therefore, poorer safety. Considering vehicle-to-vehicle interactions for a given spatio-temporal window, the TSC can be mathematically represented as:

where
The following two considerations are desirable for deriving TSC using different conflict indicators. First, the TSC based on conflict indicators should result in a sufficient correlation between the TSC and macroscopic indicators, as the study aims to analyze traffic conflicts using macroscopic traffic flow characteristics. The second consideration is the physical interpretation of TSC derived using different conflict indicators. For instance, if TTC or DRAC are used as a conflict indicator to analyze the rear-end conflicts, then vehicle-to-vehicle interactions where the speed of the following vehicle is greater than the leading vehicle are only considered. Therefore, only information about the interactions on a collision course is considered. Other unsafe interactions where vehicles travel closely at higher speeds are not considered. The assumptions of TTC and DRAC for characterizing an interaction as traffic conflicts limits its applicability to measure traffic safety from a macroscopic perspective. On the contrary, if PSD is considered a conflict indicator, all possible vehicle-to-vehicle interactions are considered. The TSC based on PSD indicates the time during which the stopping distance is less than the relative spacing between the vehicles. Therefore, the TSC based on PSD would entail information about both safe and unsafe movements of vehicles in the traffic stream.
The intermediately congested states are associated with complex traffic phenomena like increased speed variance, traffic instabilities, and hysteresis and are, therefore, critical with regard to safety ( 63 – 68 ). Therefore, for deriving a meaningful relation between traffic safety and traffic flow, the TSC computed based on any conflict indicator should explain this phenomenon. For instance, if TTC is used as a traffic conflict indicator, then congested traffic conditions will be marked critical. Under congested conditions, vehicles are closely spaced (lower headways), so time-based conflict indicators such as TTC or TIT, or TET would mark congested traffic as most critical (33, 34). On the other hand, being a distance-based conflict indicator, PSD would mark congested traffic states as less critical, attributed to lower speed (higher stopping distance). Moreover, Mohammadian et al. reported that TSC based on PSD marks the intermediately congested state or transition from uncongested to congested traffic states as most critical with regard to safety ( 30 ). This implies that the TSC based on PSD provides a meaningful relation between macroscopic traffic flow variables and traffic safety. Based on the above discussions, in the present study PSD is used to estimate the TSC.
In the present study, varying thresholds of PSD

where

Modeling Methodology
Researchers have recently used statistical and machine learning models for traffic safety studies. It is well articulated that machine learning models have better predictive capabilities and account for the non-linearity and interaction effects in the data without any parametric assumption related to the data distribution. However, the interpretability capabilities of the machine learning models have often been argued and form one of the significant drawbacks. Mannering et al. posited that a tradeoff must be made between the models’ predictive performance and interpretable capabilities ( 69 ). Recently, the shapely additive explanation (SHAP) technique has been widely used to explore and investigate the interpretability capability of machine learning models ( 44 , 70–72). The SHAP technique assists in understanding the effect of the input parameters on the output of machine learning models. Therefore, considering better predictive capabilities, adequate interpretability, and facilitating real-time applications, machine learning models are employed in the present study for modeling TSCs as a function of macroscopic traffic flow variables.
A desirable machine learning model will likely have (a) predictive accuracy and (b) generic applicability for unknown data. In the present study, three machine learning algorithms, namely, random forest (RF) ( 28 , 30 , 43 , 44 ), support vector machines (SVM) ( 9 , 73–76), and eXtreme Gradient boosting machines (XGB) ( 43 , 44 , 71 ) are considered for modeling TSC as a function of macroscopic traffic flow variables. The considered machine learning algorithms are widely used for real-time traffic safety assessment.
Initially, out of the total sample, 70% were considered for training, and the remaining 30% of the data were considered testing data. The testing data will be used to ascertain the generic applicability of the machine learning models for the unknown dataset. In the next step, the hyperparameters of different machine learning models were optimized. K-fold cross-validation and grid search techniques were used to derive the optimal values of hyperparameters for different machine learning models. The grid search technique is a process that searches exhaustively through a manually specified subset of the hyperparameter space of the targeted algorithm. In k-folds cross-validation, the training dataset is randomly divided into k-folds. The model evaluation is repeated k times, where each time, k-1 folds are used for model training, and the remaining fold is used for validation. The process above is repeated across all different sets of hyperparameters from the grid search range to derive optimal sets. The present study uses the five-fold cross-validation and grid search method for hyperparameter tuning. To evaluate the different machine learning models, the following criteria are considered:
Results and Discussion
This section first discusses the distribution of TSCs in the flow–density and speed–density planes for varying
Linkage Between Traffic Safety and Traffic Flow Dynamics
The vehicle trajectory data extracted for the three traffic flow conditions are employed to compute the macroscopic traffic flow variables and TSCs, as explained in the methodology section. The space–time plane is discretized into multiple temporal windows of size
Figure 3 illustrates the distribution of TSC in the flow–density and speed–density planes for varying
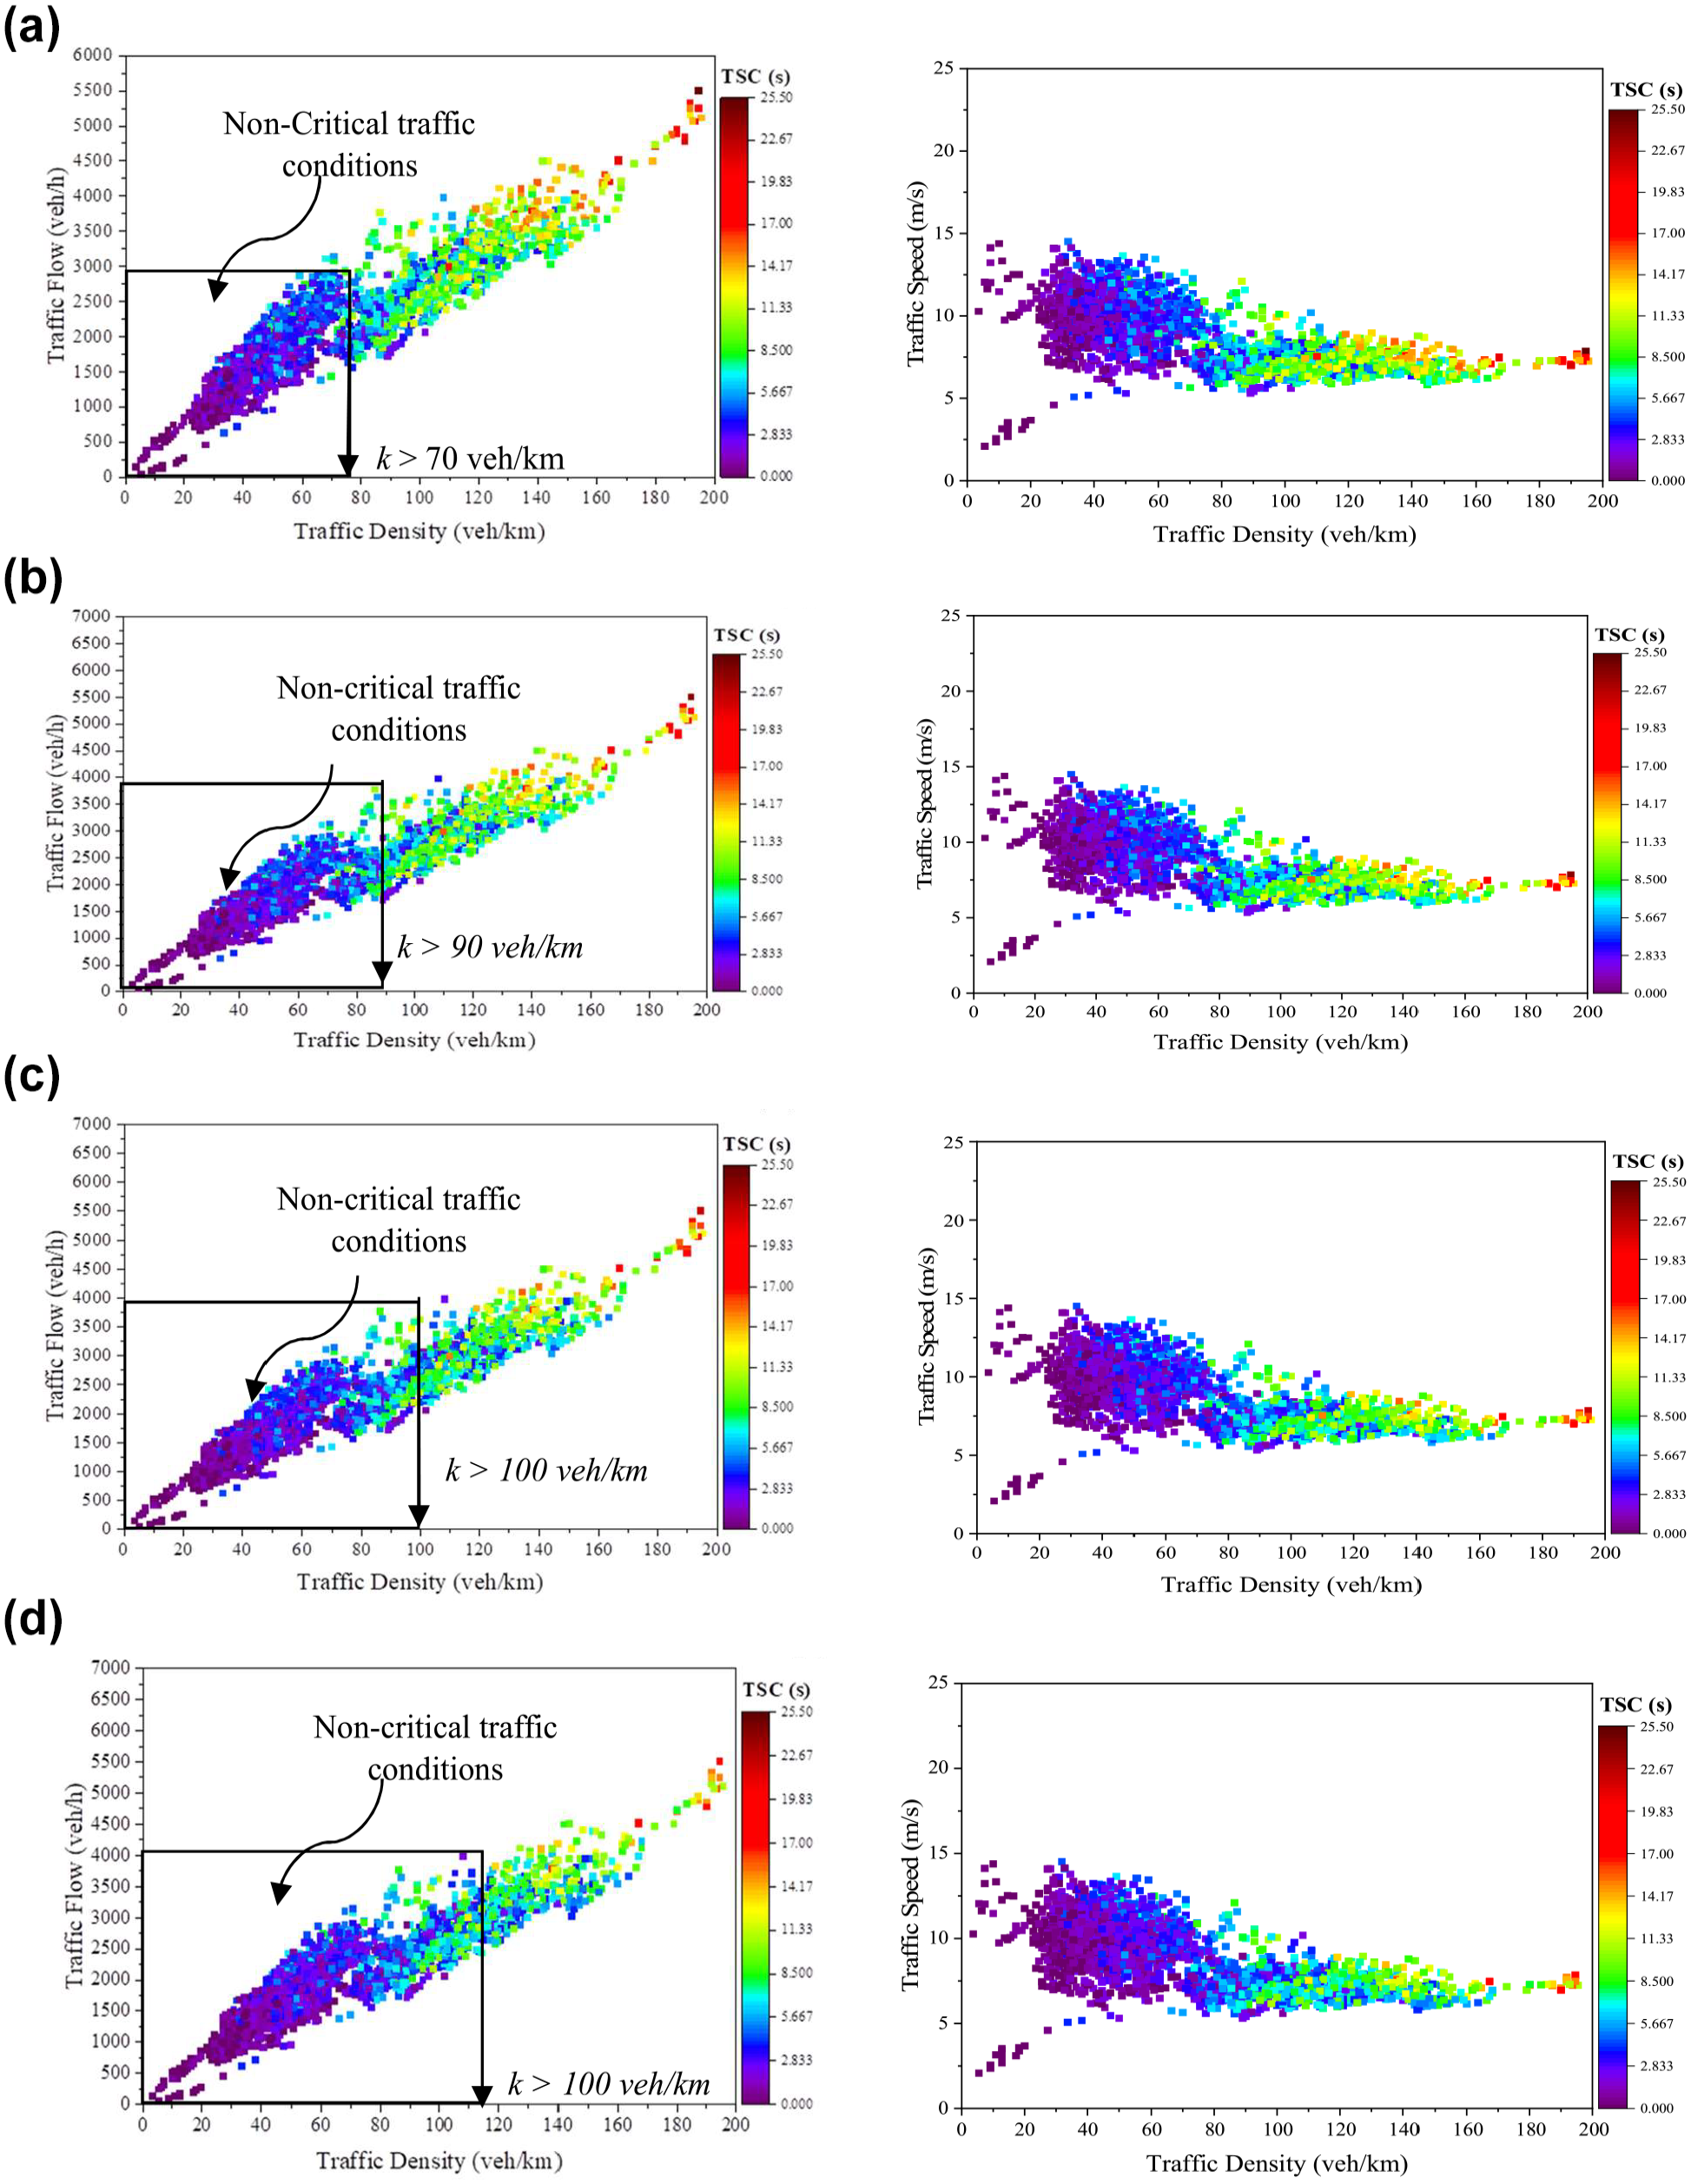
Flow–density planes for different proportion of stopping distance (PSD) thresholds: (a) PSDcri = 1, (b) PSDcri = 0.9, (c) PSDcri = 0.8, and (d) PSDcri = 0.7.
Figure 3 shows that as the traffic density increases, the TSC increases. This implies that vehicles prevail in conflicting conditions for a longer time at higher densities. Therefore, at higher densities, the operational risk rises significantly. Further, it can be noted that moderately congested and at-capacity conditions are critical traffic flow conditions for traffic safety. Here, the critical traffic flow conditions pertaining to safety indicate traffic conditions with higher TSC values (concentration of green and red points). Similarly, for varying
What can also be noted from Figure 3 is that at varying thresholds, higher values of density (higher flow and lower speed) are marked as critical. For instance, for
From Figure 3, it can be concluded that TSC based on PSD marks moderately congested and at-capacity traffic flow conditions as critical as regards safety. Further, for varying
Evaluation of Data-Driven Machine Learning Models
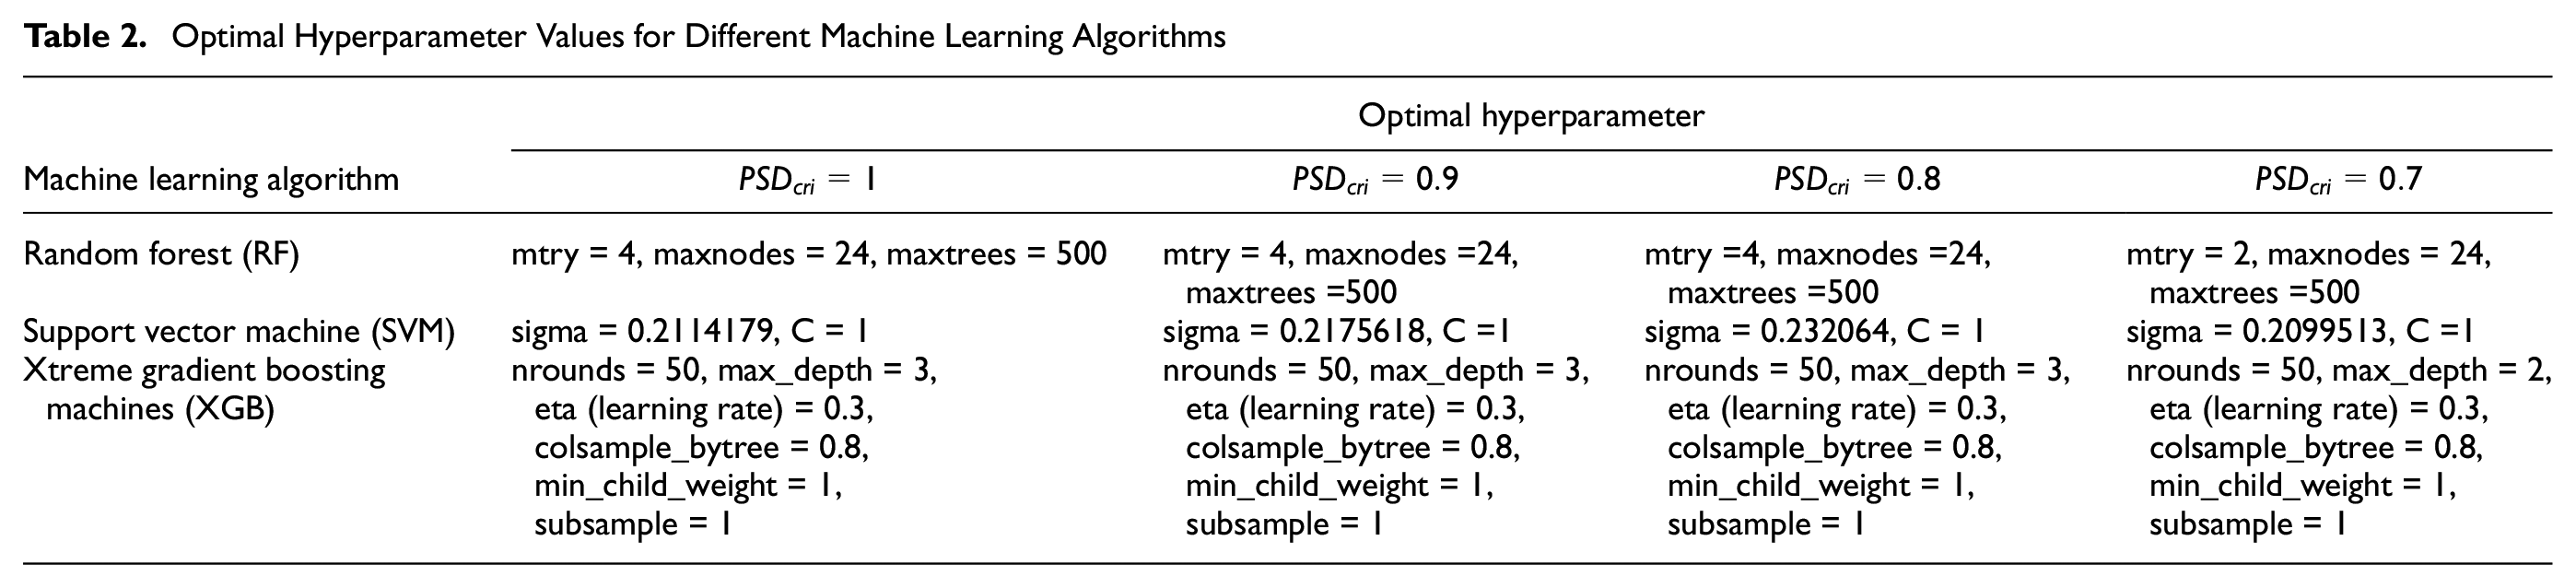
As discussed in the “Methodology” section, the TSC is modeled as a function of macroscopic traffic flow variables using three machine learning algorithms, namely, RF, SVM, and XGB. The machine learning algorithms were implemented in the open RStudio platform. The hyperparameters for each machine learning model were tuned or optimized by employing the k-fold cross-validation and grid search technique. The optimal hyperparameter values are summarized in Table 2. The hyperparameter values for different machine learning algorithms are nearly similar, or the difference is marginal for varying PSDcri values. This could be attributed to the range of TSC values (minimum and maximum TSC values) for varying PSDcri being nearly similar.
Optimal Hyperparameter Values for Different Machine Learning Algorithms
The performance measure for different machine learning models for the test dataset and for varying PSD thresholds are summarized in Table 3.
Results of Machine Learning Models on Test Dataset
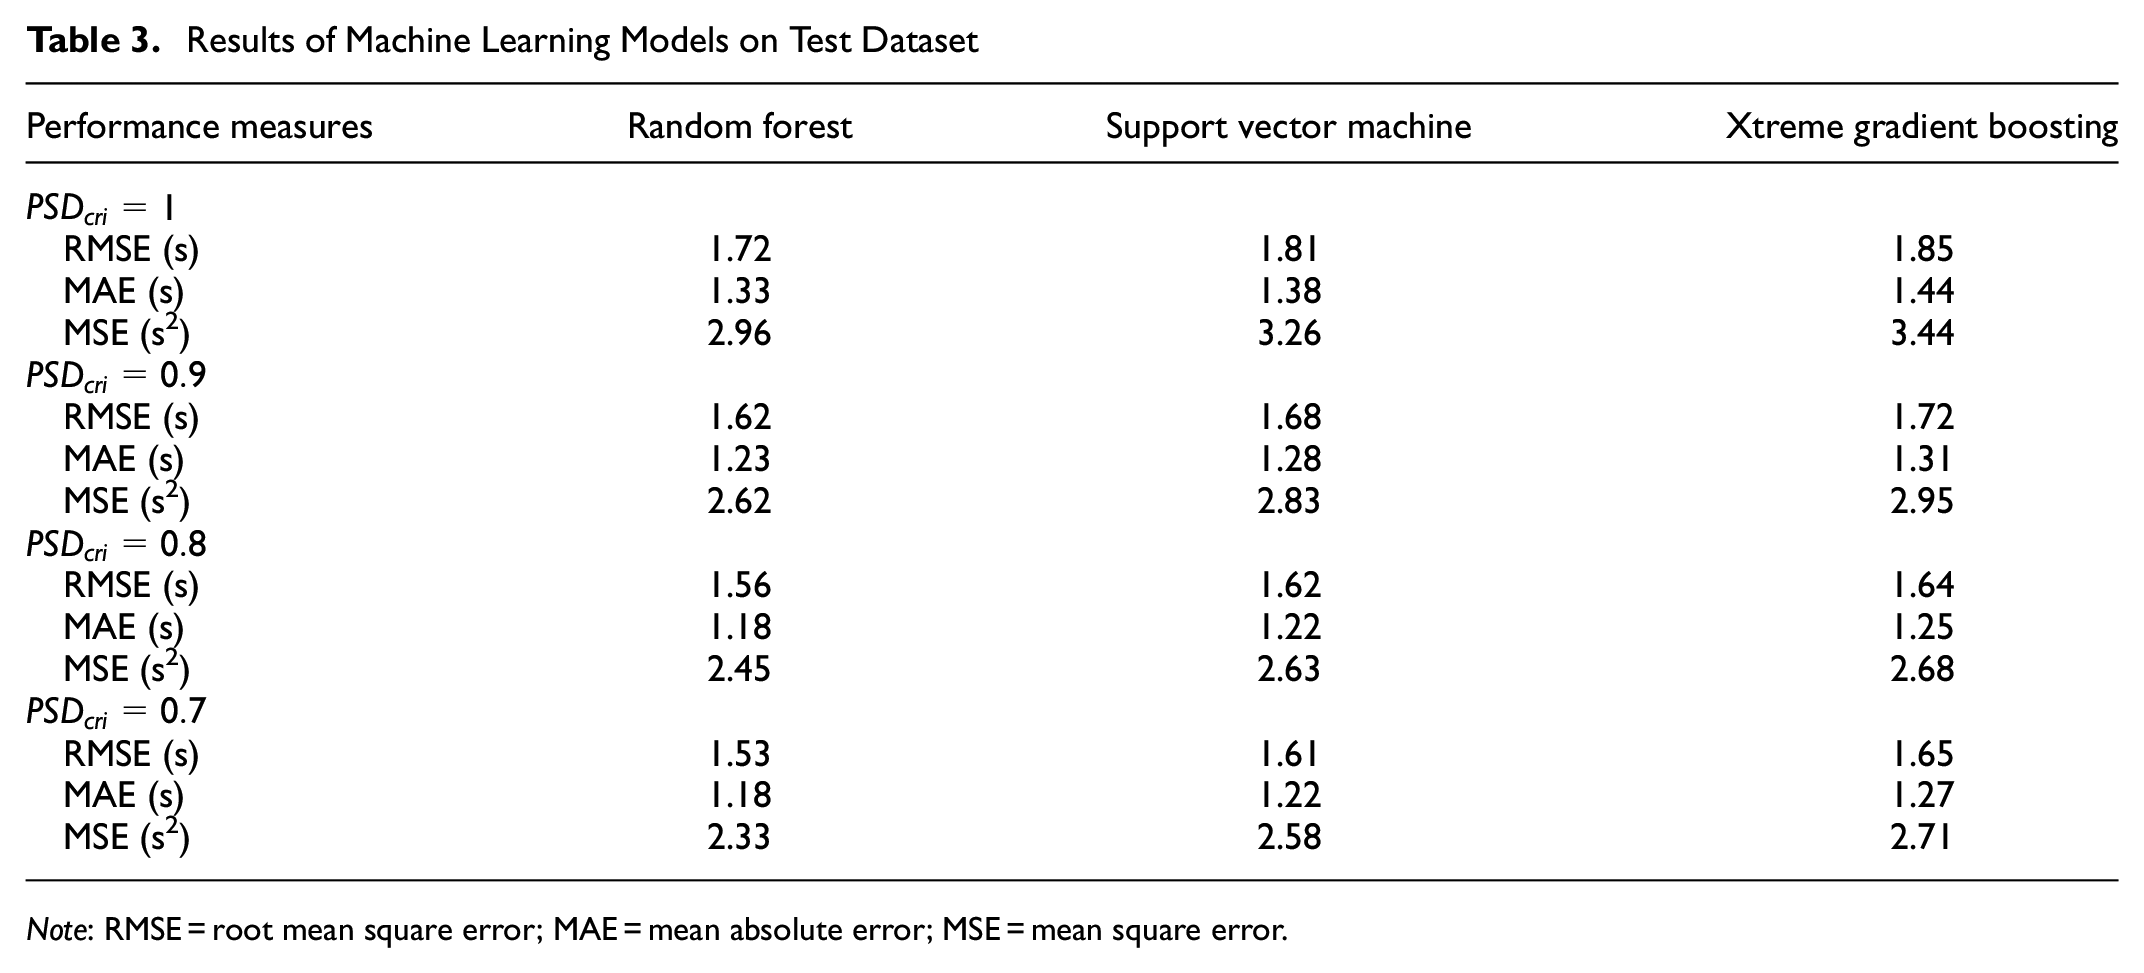
Note: RMSE = root mean square error; MAE = mean absolute error; MSE = mean square error.
The results show that all the machine learning models perform similarly for the test datasets (Table 3). However, it can be noted that among the three machine learning models, the errors (RMSE, MAE, and MSE) are the least for the RF model compared with SVM and XGB, indicating that the RF model slightly outperforms the other models. Consistent observations were noted for different
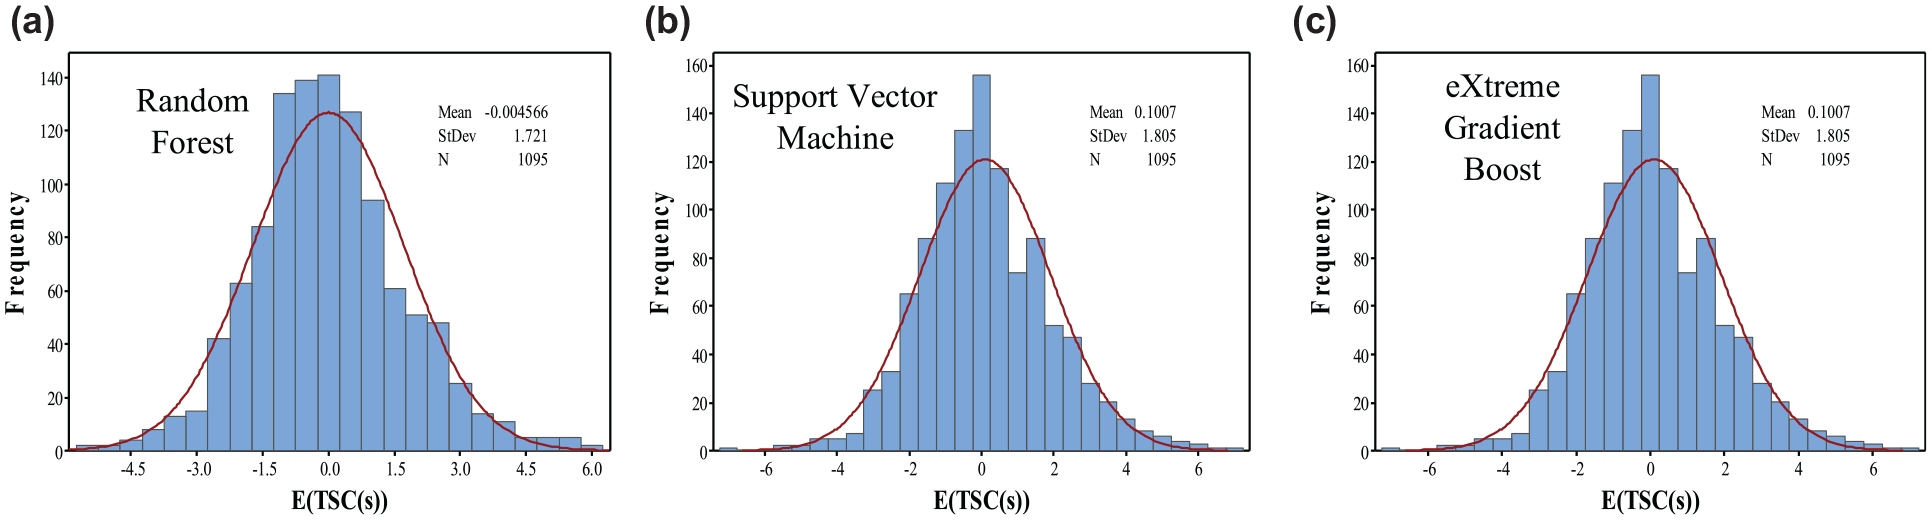
Proportion of stopping distance (PSD) threshold 1 error distribution for: (a) random forest model, (b) support vector machines, and (c) extreme gradient boosting machines.
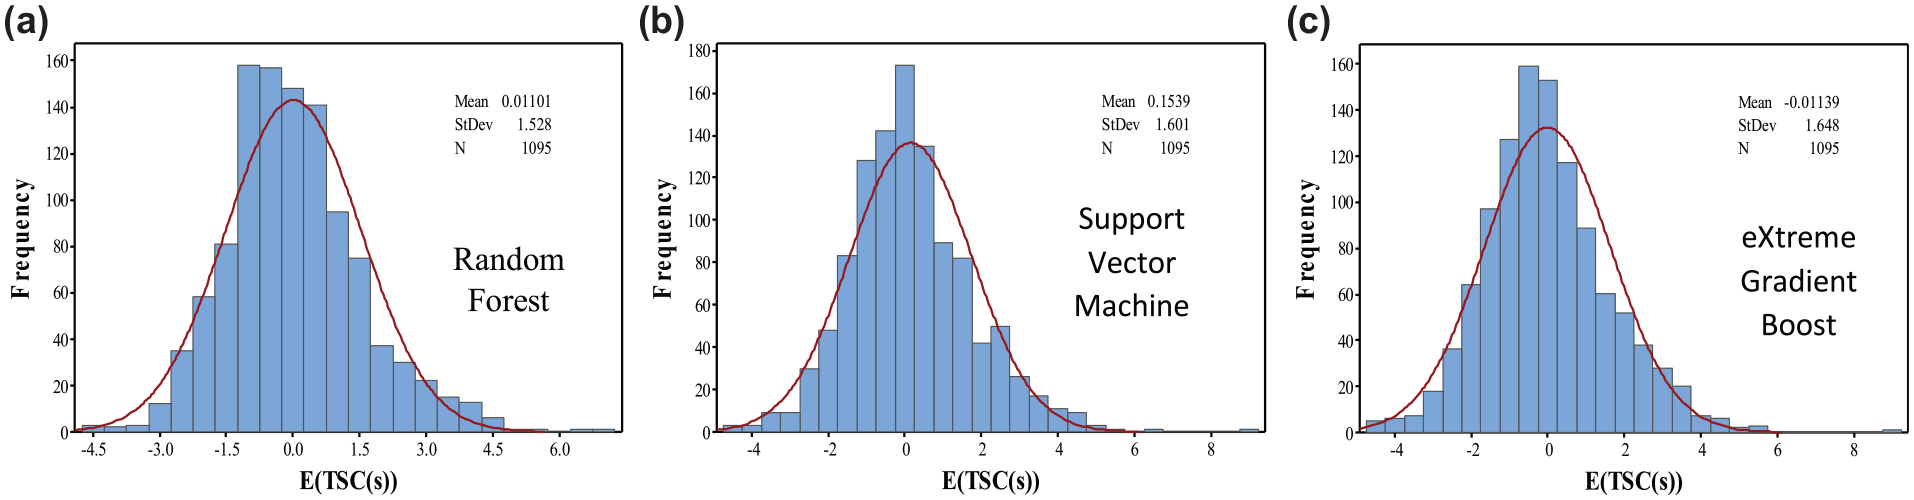
Proportion of stopping distance (PSD) threshold 0.7 error distribution for: (a) random forest model, (b) support vector machines, and (c) extreme gradient boosting machines.
The error distribution of each machine learning model reveals that the errors are nearly normally distributed for all three models, with the RF model performing slightly better than the other two machine learning models. Consistent observations were noted for varying
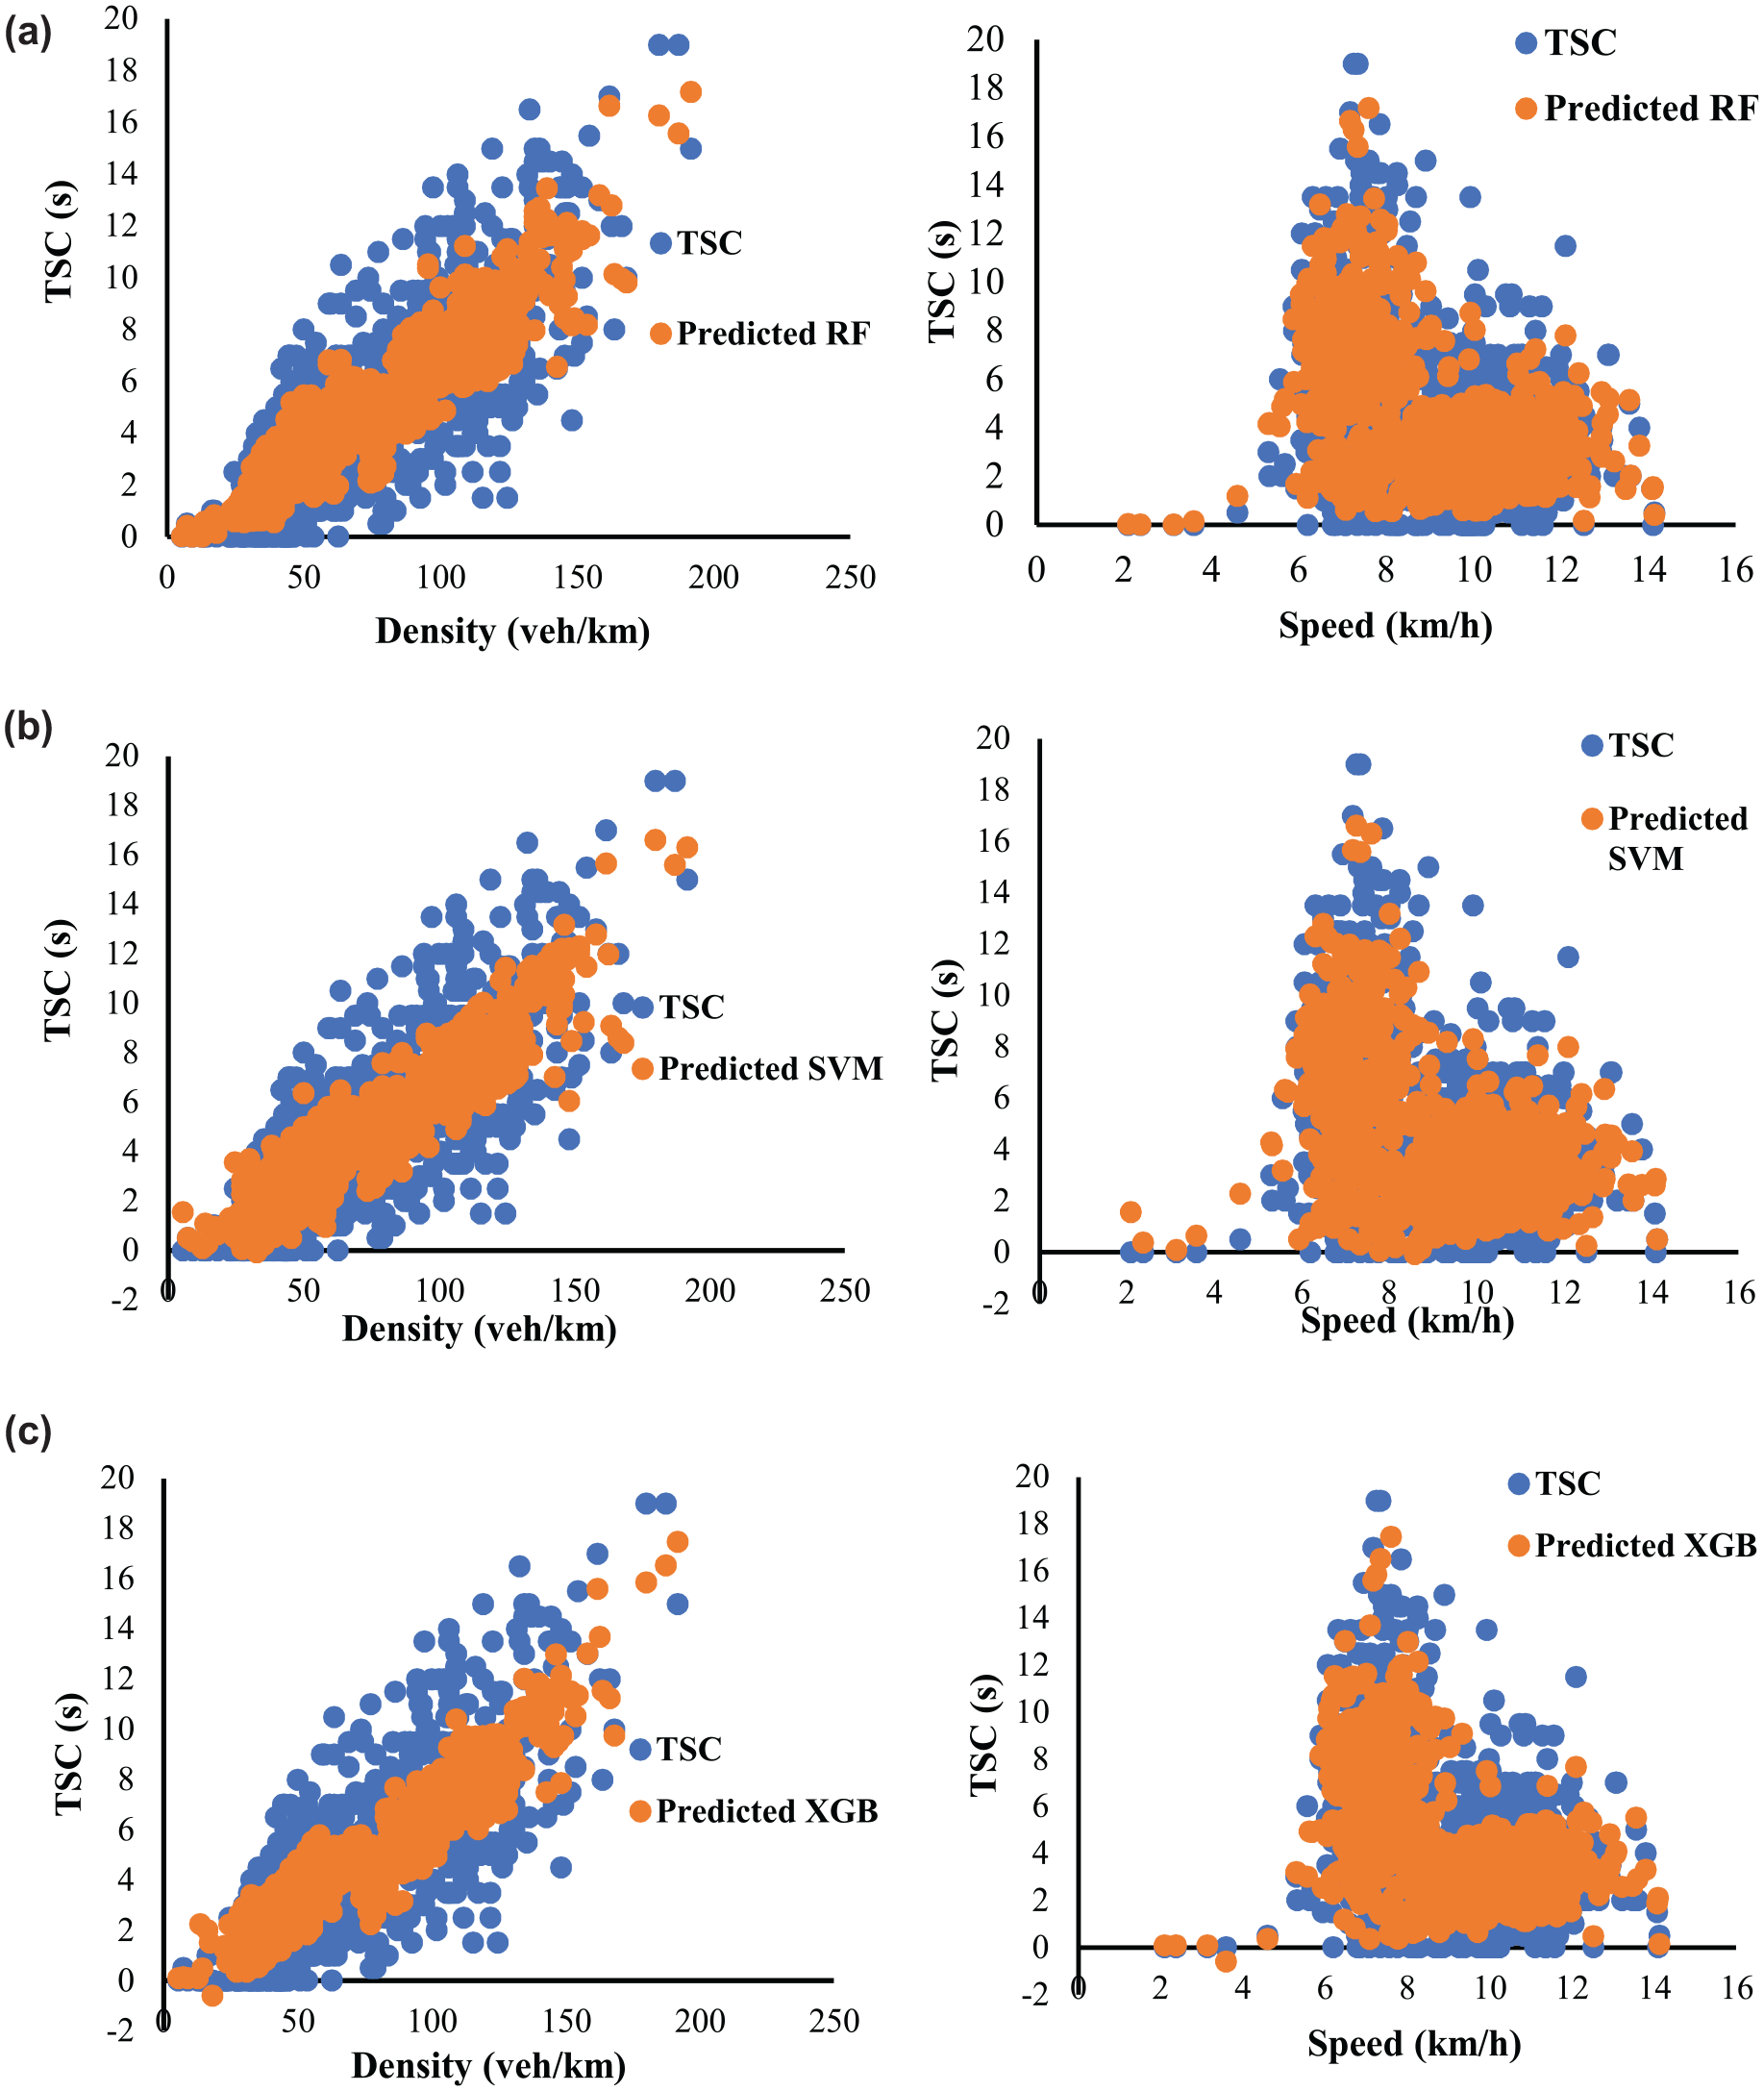
Time spent in conflict (TSC)–density plane and TSC–speed plane for PSD 1: (a) random forest, (b) support vector machine, and (c) extreme gradient boosting.
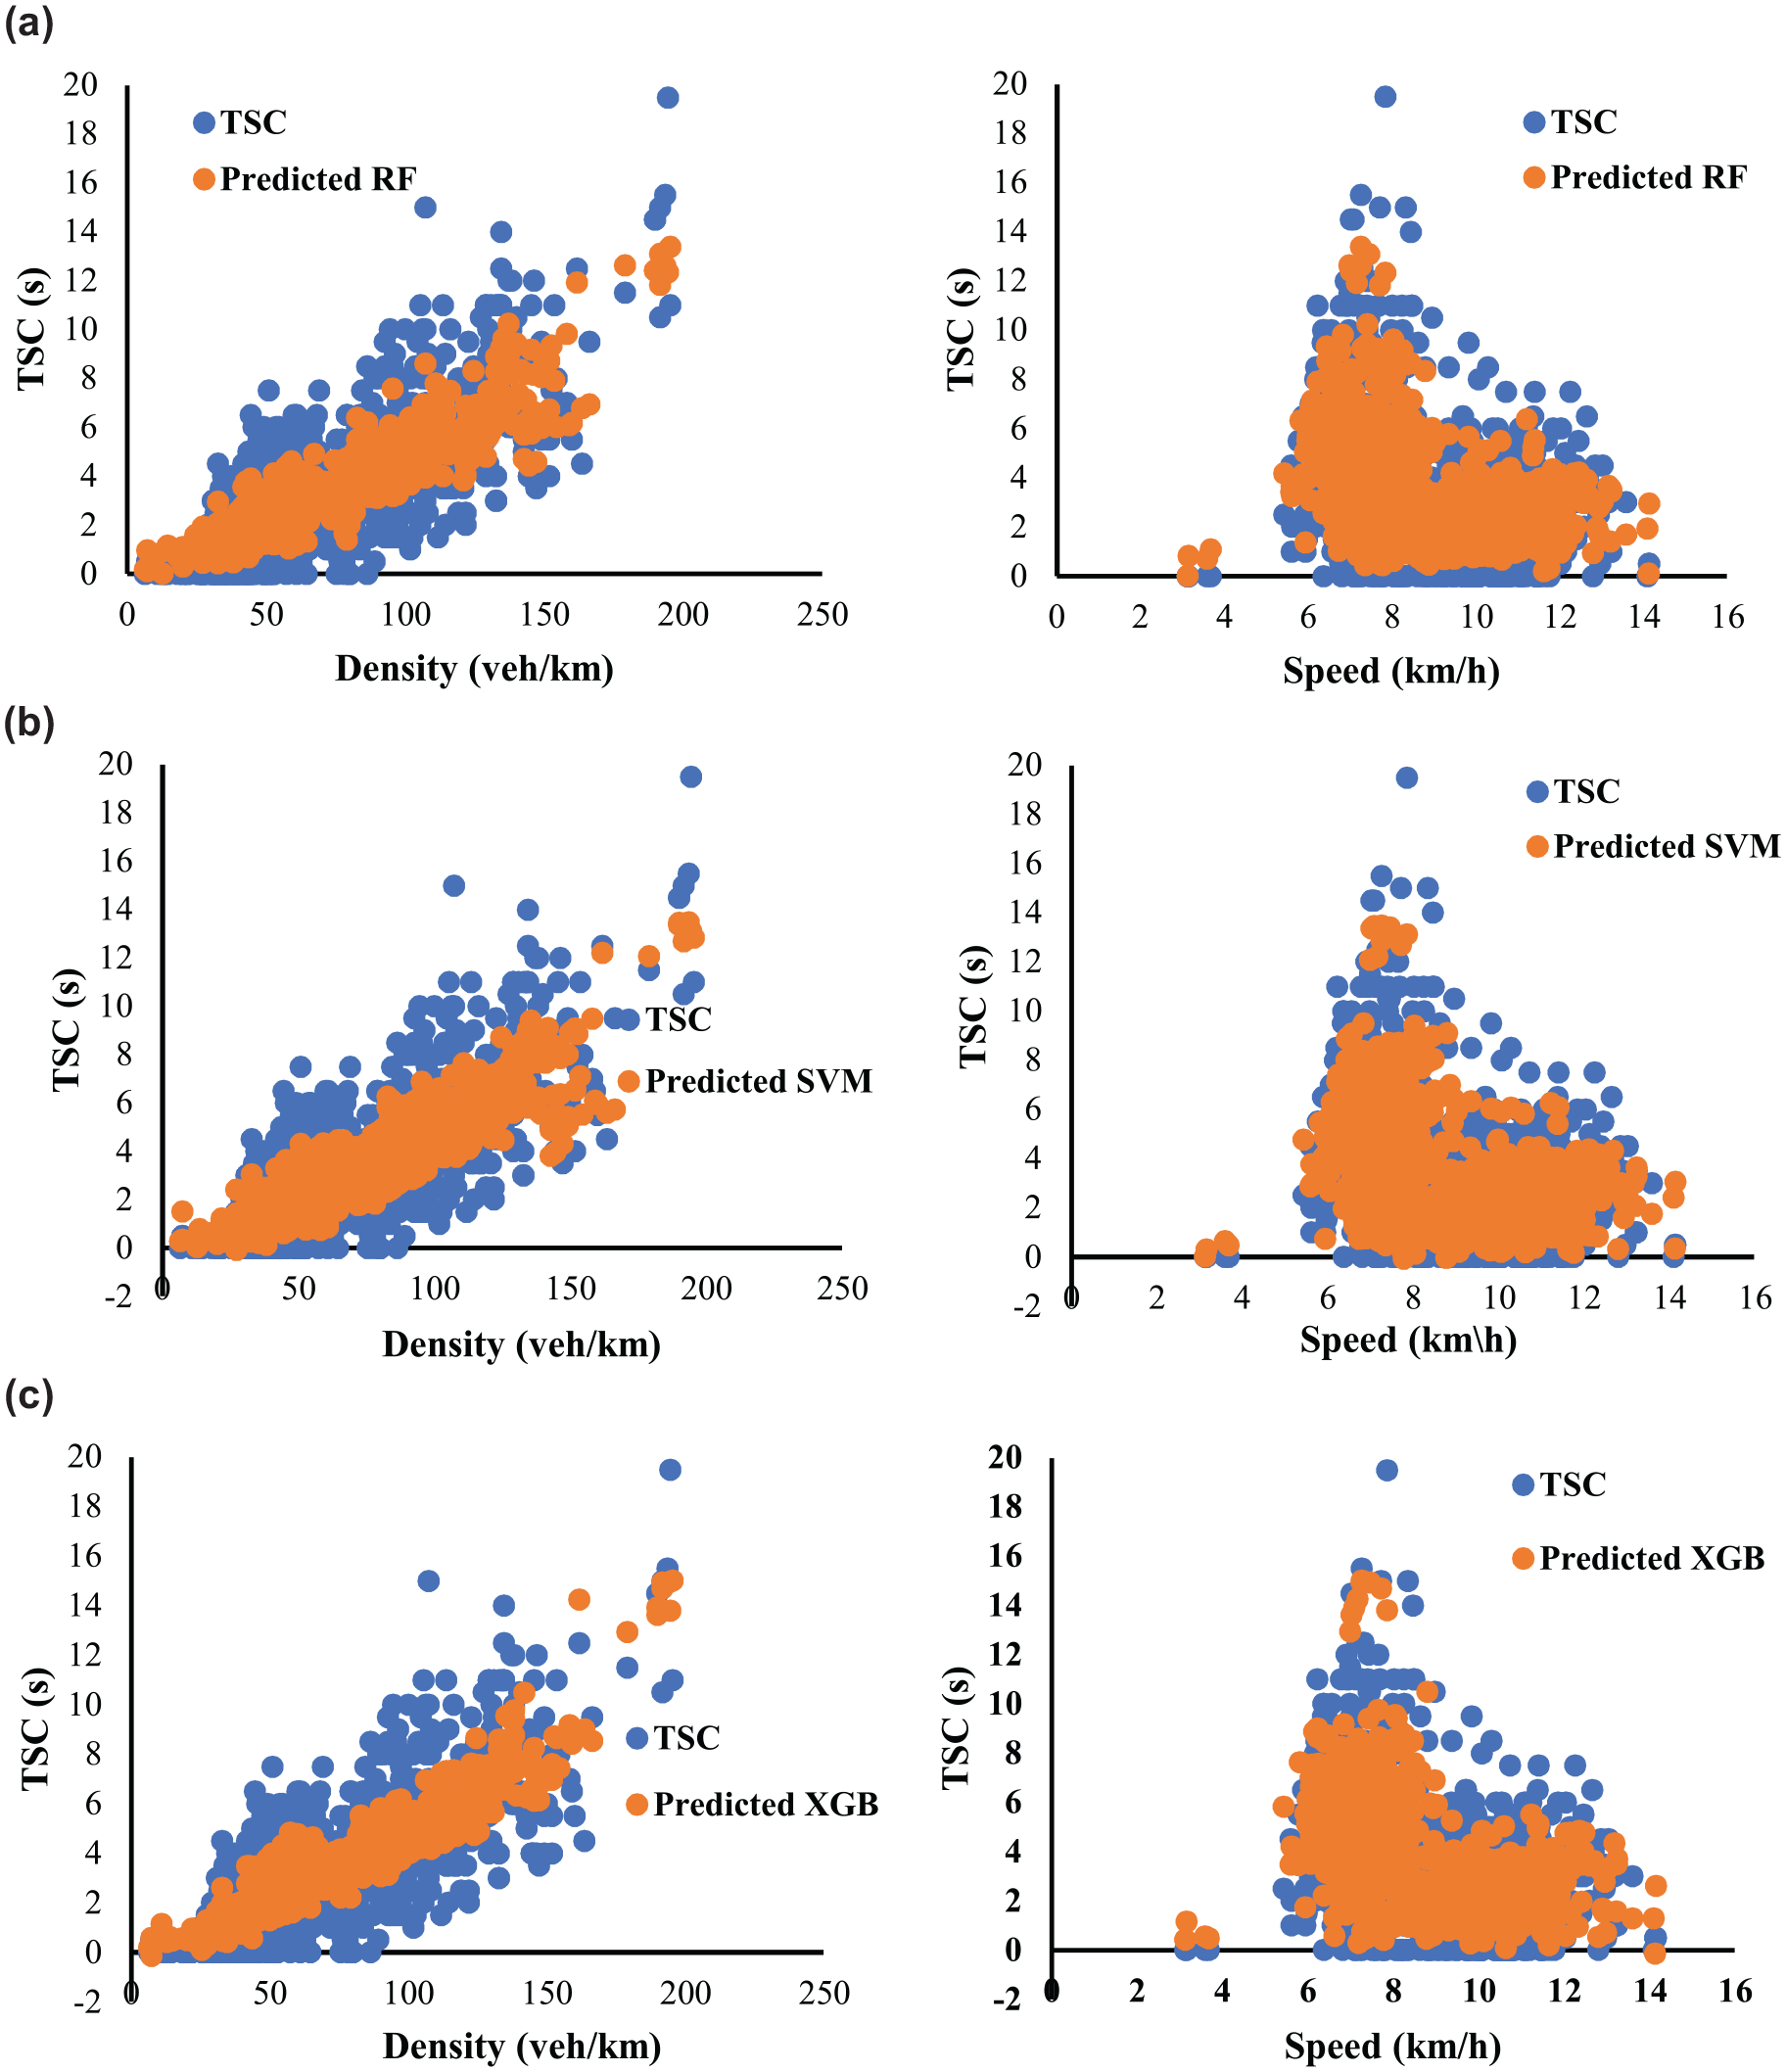
Time spent in conflict (TSC)–density plane and TSC–speed plane for PSD 0.7: (a) random forest, (b) support vector machine, and (c) extreme gradient boosting.
It is clear from Figures 6 and 7 that for a given value of traffic density and speed, the predicted TSC values are close to the observed TSC value. Consistent observations can be noted for all the machine learning models developed in the study. However, the SVM and XGB models predicted negative values of TSC, which are non-physical and practically insignificant. Consistent observations can be noted for varying
Practical Implications of the Study
Some of the potential practical implications of the trained machine learning models are summarized below:
In the present study, rear-end traffic conflicts were evaluated as a function of macroscopic traffic flow variables: traffic density, speed, the standard deviation in speed, and traffic composition. The macroscopic traffic variables can be collected using roadside detectors such as loop detectors, radar sensors, Bluetooth/Wi-Fi sensors, and other Intelligent Transportation System (ITS)-based technologies. The developed machine learning model can be employed to predict TSC (operational risk) in real time using the macroscopic traffic flow variables and, therefore, facilitate real-time traffic safety monitoring ( 29 , 40 ). The developed machine learning model can also facilitate identifying critical road segments and periods.
Conventionally, traffic mobility has been the primary objective of different control strategies. Recently, traffic safety (crash risk) was also integrated into developing control strategies to improve freeway traffic safety ( 80 , 81 ). However, the mobility and safety-based strategies were not integrated under a unified framework. The framework proposed in the present studies elicits the safety status of a given traffic flow condition and, therefore, can facilitate the development of real-time traffic control to optimize mobility and traffic safety. This can be achieved by minimizing the total time spent by vehicles and minimizing the time spent in conflict. A multi-objective optimization framework can be developed for real-time optimization of safety and mobility ( 82 ).
In the present study, rear-end traffic conflicts were evaluated as a function of macroscopic traffic flow variables: traffic density, speed, the standard deviation in speed, and traffic composition. As discussed earlier, the macroscopic traffic flow variables can be easily measured. Therefore, the proposed framework eliminates the need for high-quality vehicle trajectories for safety evaluation, facilitating network-wide traffic safety assessment, which, otherwise, is very difficult. For instance, network-wide trajectories can be collected. The methodological approach detailed in the study can be adopted for estimating TSC, and a generic machine learning model can be developed. The generic machine learning model can be employed for network-wide traffic safety assessment. With the advent of connected and autonomous vehicles and their increased penetration in the traffic stream, network-wide trajectories can be collected in real time. The collected data can be integrated into the framework proposed in the present study to facilitate network-wide traffic safety assessment ( 83 ).
Conclusions and Way Forward
The present study proposed a real-time traffic safety evaluation framework using macroscopic flow variables. To this end, open-access extended vehicle trajectories retrieved from https://shriniwasprofile.wordpress.com/open-source-data-from-our-research-group/ are employed. Rear-end traffic conflicts and macroscopic traffic flow variables are derived from the trajectory data and are integrated for real-time safety evaluation. The PSD accounts for all types of interactions (both safe and unsafe) in the traffic stream; therefore, the same is adopted as a suitable traffic conflict indicator. A macroscopic indicator termed TSC is derived to evaluate the rear-end traffic conflicts. Machine learning models, namely, RF, SVM, and XGB, are employed to predict TSCs using macroscopic traffic flow variables. The developed models can facilitate real-time monitoring of traffic safety. The following are the conclusions drawn from the study:
(a) The TSC computed based on PSD exhibits a reliable and explainable relationship with the macroscopic traffic flow variables. TSC calculated based on PSD revealed that intermediately congested traffic flow conditions are critical with regard to traffic safety and can be attributed to complex traffic phenomena such as traffic hysteresis, traffic oscillations, and increased speed variance. For varying threshold values (
(b) Three machine learning models, namely, RF, SVM, and XGB, were employed to model TSC. The results revealed the RF model as the best-fitted model to predict TSC based on macroscopic traffic variables.
The framework to evaluate traffic safety using macroscopic traffic flow variables has two significant advantages. First, the framework facilitates real-time traffic safety monitoring by identifying critical traffic flow conditions. Second, the framework reveals the traffic safety status corresponding to a given traffic flow condition and, thus, can be used to develop control strategies to balance traffic efficiency and safety. Admittedly, the study results provide significant insights revealing that studies for varying roadway geometry conditions are needed to develop generic TSC models and, thus, form the future scope of the study. Further, under mixed traffic conditions, vehicle-to-vehicle interactions are two dimensional. As a result of two-dimensional interactions, a spectrum of traffic conflicts such as rear-end, sideswipe, angled, and head-on exists (79, 84). Therefore, a comprehensive framework accounting for the two-dimensional vehicle-to-vehicle interactions for evaluating traffic safety is pivotal and, thus, forms the future scope of the study. Further, using TSC, the failure of the traffic stream with regard to safety can be assessed and needs further investigation. The development of real-time traffic control optimizing traffic safety and mobility also forms the future scope of the study.
The authors confirm contribution to the paper as follows: study conception and design: Hiral Patel, Ninad Gore, Said Easa, Shriniwas Arkatkar; data collection: Hiral Patel; analysis and interpretation of results: Hiral Patel, Ninad Gore; draft manuscript preparation: Hiral Patel, Ninad Gore, Said Easa, Shriniwas Arkatkar. All authors reviewed the results and approved the final version of the manuscript.
Footnotes
Declaration of Conflicting Interests
The author(s) declared no potential conflicts of interest with respect to the research, authorship, and/or publication of this article.
Funding
The author(s) received no financial support for the research, authorship, and/or publication of this article.