
Abstract
The international roughness index (IRI) is one of the important criterion used to determine the roughness of roads. Various devices are available to determine IRI, however, they are mostly used to determine the condition of highways. Studies to determine the roughness of nonmotorized roads, such as bicycle roads, which have become increasingly important in recent years, are limited. Therefore, this study presents a cost-effective roughness measurement method that can measure both highways and nonmotorized roads. For this, a mountain bike was used as the test vehicle, and for the first time, the stiffness and damping coefficients of the bicycle tire were taken into account when calculating the IRI. First, the stiffness and damping coefficients of the bicycle’s front tire were calculated. These coefficients were then used as input data for the equation of motion with one degree of freedom, and the IRI was calculated. The 660-m long divided highway (1,320 m in total) on the Bursa Uludagğ University campus was chosen as the test road. A laser profilometer device was used to quantify the reference IRI values of this test road. The same road was then measured by bicycle. The obtained results were evaluated using mean absolute percent error, mean absolute error, root mean square error, and mean square error metrics. All these indicators showed very promising results, suggesting that this new method could be a cost-effective and reliable approach to determining the IRI of highways, especially nonmotorized roads.
The roughness of a road is an essential variable in determining pavement quality. With regard to driving safety, driver/passenger comfort, and road maintenance requirements, road pavement quality is a major consideration. Road roughness is defined as the deviation of the road profile from a planar surface ( 1 ). Roughness, a significant factor in evaluating road performance, affects safety, comfort, travel speed, and vehicle operating and maintenance costs ( 2 ). In addition, although roughness reduces the energy consumption of vehicles ( 3 , 4 ) and thus greenhouse gas emissions ( 5 , 6 ), it increases tire wear ( 7 ). For this reason, it is vital to determine the roughness of roads, the international roughness index (IRI), devised by the World Bank, was accepted in 1982 for determining the roughness metrics of roads ( 8 ). IRI is defined as a vehicle’s response to road roughness ( 9 ) and is measured by a mathematical method known as the quarter-vehicle model ( 10 ).
Several methods are available to estimate IRI, such as laser profilometers and response-type roughness measurements ( 9 , 11 , 12 ). Several studies have measured the roughness of roads using these methods. However, these methods were developed mainly to determine the roughness of highways, and are not, therefore, generally suitable for determining the roughness of nonmotorized road types, such as pedestrian and bicycle roads.
Use of bicycles and e-scooters has become an essential aspect of multimodal, integrated transportation systems in relation to environmental, economic, and social sustainability ( 13 ). In addition, increases in energy prices and especially the effect of the pandemic have started to direct people toward individual transportation systems such as bicycles and e-scooters. This, in turn, has accelerated the construction and maintenance activities of nonmotorized roads, such as bicycle roads, especially in big cities. Therefore, the maintenance needs of these roads will also have to be met. In the literature, studies have been found on the effects of road roughness on bicycle road route selection ( 14 , 15 ), the importance of road surface types on bicycle riding ( 16 ), the relationship between the safety of bicycle roads and cyclist injuries ( 17 ), the relationship between road roughness and cyclists’ energy consumption ( 18 ), and the effect of pavement roughness on bicycle ride quality ( 19 ). However, studies determining the roughness of bicycle roads are scarce.
Zang et al. measured the roughness of pedestrian and bicycle roads using bicycle-mounted smartphones and GPS sensors ( 20 ). They also developed an algorithm to identify potholes and bumps in roads. Three tests were performed to evaluate this algorithm, and the experimental results were consistent with the measurements derived with professional tools. With this method, it was confirmed that the roughness of pedestrian and bicycle roads, which professional vehicles cannot use, can be measured. Wage and Sester estimated the roughness of bicycle roads through the least squares method using acceleration data collected with the help of smartphones from a lot of bicycles ( 21 ). The acceleration values collected by each cyclist’s smartphone were integrated into a standard scale system and used as input data in the OpenStreetMap application. Thus, they showed that the roughness of these roads could be widely determined.
To the best of the authors’ knowledge, this study is the first in which road roughness measurements were calculated by considering the characteristics of the bicycle tire (i.e., stiffness and damping ratios). In the literature, it is largely the relationship between acceleration data and roughness that has been investigated—no studies were found in which direct IRI calculations were made. Furthermore, the stiffness and damping values of the tire must also be known for the equations of motion used in the calculation of road roughness. In the roughness measurements made in previous studies, neither the stiffness value of the bicycle tire nor the damping coefficient were considered. However, these features (stifness and damping of the tire), which are neglected in one-degree-of-freedom systems, have a significant effect on the accuracy of roughness measurements. For the purposes of this study, a mountain bike was used as the test vehicle. To collect data from the road surface, a data acquisition system (DAS) was developed and placed on the handlebar of the bicycle. A three-axis (x, y, and z) accelerometer (MPU-6050) and GPS sensor (GY-NEO6MV2) working synchronously were used in the DAS to obtain acceleration and position data from the road surface with the bicycle. The roughness data of the 660-m long divided road in Bursa Uludagğ University campus in both directions (1,320 m round trip) were measured with the laser profilometer device, the results of which are considered the reference IRI data. After that, the same road was measured using the bicycle in both directions of the test road. The results were evaluated using the mean absolute error (MAE), mean square error (MSE), root mean square error (RMSE), and mean absolute percent error (MAPE)—the most frequently used evaluation criteria.
The remainder of this article is organized as follows: the quarter-car model used in the IRI calculation and the newly proposed method are discussed in the next section. The results of the measurements made according to the proposed method are then presented, and in the final section, our conclusions and suggestions for future research are given.
Methods
Specific tools are used to measure the roughness of roads ( 9 , 11 , 12 ), including straight edge, response-type instruments, rod and level, profilograph, walking profilers, and inertial profilers. Some of these tools are high-precision measures, however, because both the cost and labor costs of these tools are high, researchers have looked for alternative, more economical measurement methods. An accelerometer sensor integrated with a GPS module is one such alternative measurement method, which several studies have incorporated ( 22 – 30 ). In the current study, a three-axis accelerometer and integrated GPS module were used, and—for the first time—an attempt was made to determine IRI from the characteristics of the bicycle tire. Figure 1 presents a flowchart of the method followed to calculate the IRI in this study.
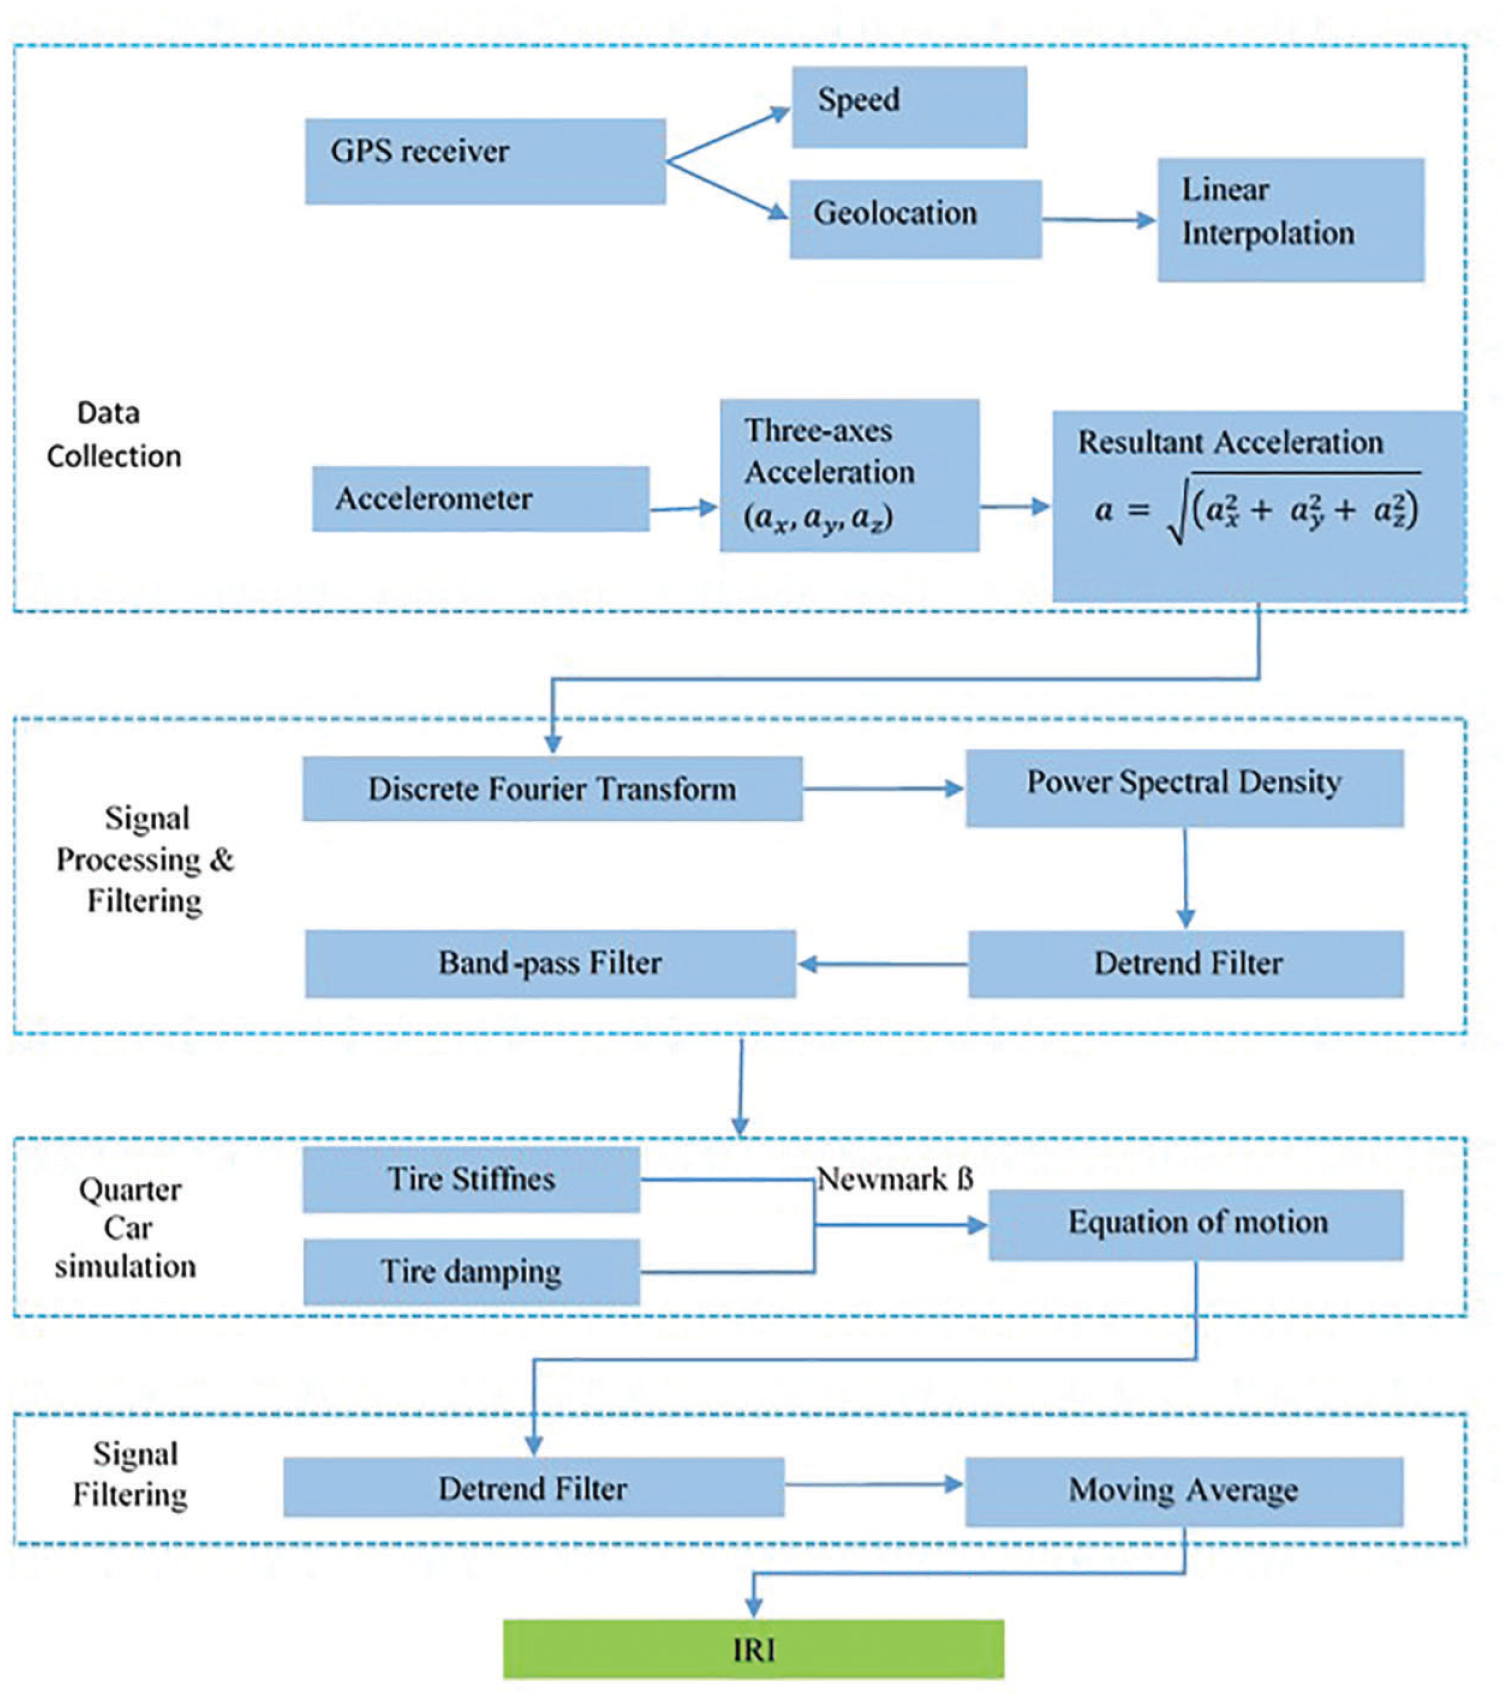
Flowchart of the method followed to calculate the international roughness index.
IRI is the sum of the displacements in the z-axis direction of the longitudinal profile of the road divided by the distance traveled by the vehicle. According to Figure 2, ti (i ∈ [1, n]) represents the sampling time, hi represents the displacement of the road surface relative to the reference point at time ti, and L represents travel distance,

where

Figure 2 shows the quarter-car model commonly used in computing IRI with one degree of freedom. The test vehicle (bicycle) used in this study consisted of two parts: frame and wheel. This bicycle did not have suspension, that is, the bicycle frame was a rigid structure. In an equation of motion with one degree of freedom, the bicycle frame’s vertical displacement (
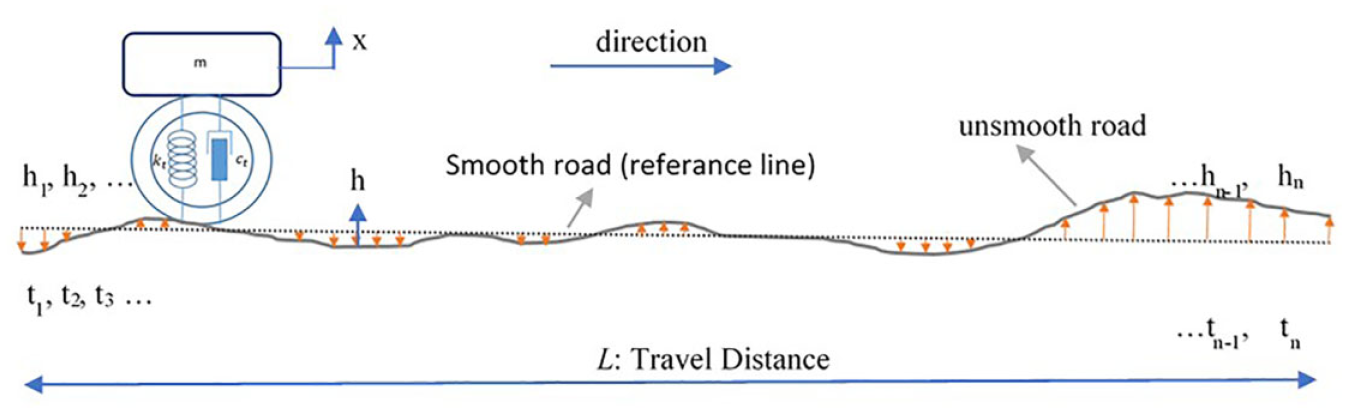
Example of a road profile.
Equation 3 presents the equation of motion according to the quarter-car model used in this study,

From this we can deduce that,

where
Test Vehicle Setup
A mountain bike with pneumatic, inflatable wheels measuring a tire/rim inner diameter of 559 mm and a width of 52 mm (52-559) was used as the study test vehicle. Wheel pressure was 206.850 KPa. The DAS is the where the sensor data are collected and stored. A DAS is created for the simultaneous functioning of all sensors. It consists of an embedded 10-bit Arduino Nano microcontroller with an operating range of 0 to 5 V, a three-axis accelerometer, a GPS module, and a data collection module. Road roughness data were obtained with the three-axis accelerometer (MPU-6050). In addition, a GPS module (NEO-6 GPS modulus datasheet) with 1 Hz sampling and 2.5 m horizontal distance sensitivity was used to obtain the speed, position, and time information of the bicycle. The accelerometer and GPS data collected from the roads were stored in a 16 GB micro SD card. The operating protocol of the system is written in the Arduino program. A 0.96-in. OLED (organic LED) module of resolution 128 × 64 was used to monitor the speed of the test vehicle and identify any possible problems. A control unit was set up within the DAS to control its operation. Thus, because of the buttons and LEDs on the DAS, the system operation can be organized and the problems that may occur can be tracked. 5000-mAh power bankerbank was used to meet the energy requirements of the DAS, which was securely attached to the handlebars of the test vehicle using plastic clamps. Figure 3 shows the DAS and its position on the test vehicle.
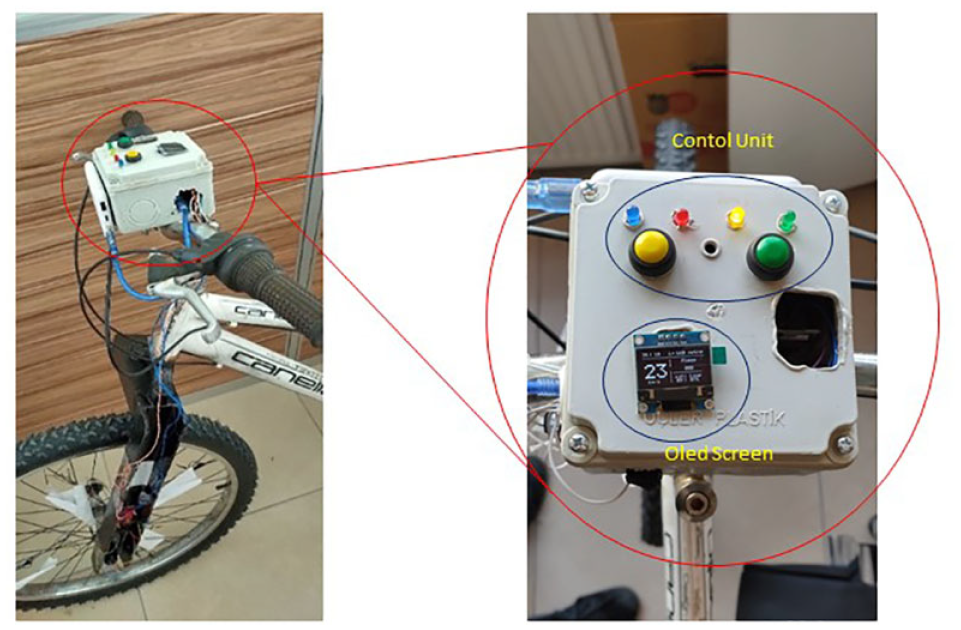
Data acquisition system and its position on the bike.
Deriving Data from GPS and Accelerometer Sensors by Bicycle-Mounted DAS
The accelerometer data in the longitudinal profile of the road and the measurement distance were the main variables used in the IRI calculation. The travel distance (L) was computed using data recorded by the GPS sensors in the DAS,

where
Acceleration values were obtained from the accelerometer sensor in the DAS. Since a bicycle will make swinging movements during measurement or motion, acceleration values will occur in all three directions (x, y, and z). Therefore, the acceleration values in the three directions were calculated as the resultant of acceleration, and the gravitational acceleration (

Fıeld Study
The double-lane divided road in Bursa Uludagğ University campus was chosen as the test road. (Figure 4). The length of the test road was 660 m in one direction (total length in both Bursa- and University directions = 1,320 m). The pavement was composed of bituminous hot mix asphalt. The laser profilometer device (Figure 5b), brought from Bursa Highways Agency, was operated at a speed of 25 km/h in the directions of Bursa and the University. Three IRI values were obtained from the left lane of the dual-lane road: the left rut, the right rut, and the midpoint between the two wheels.
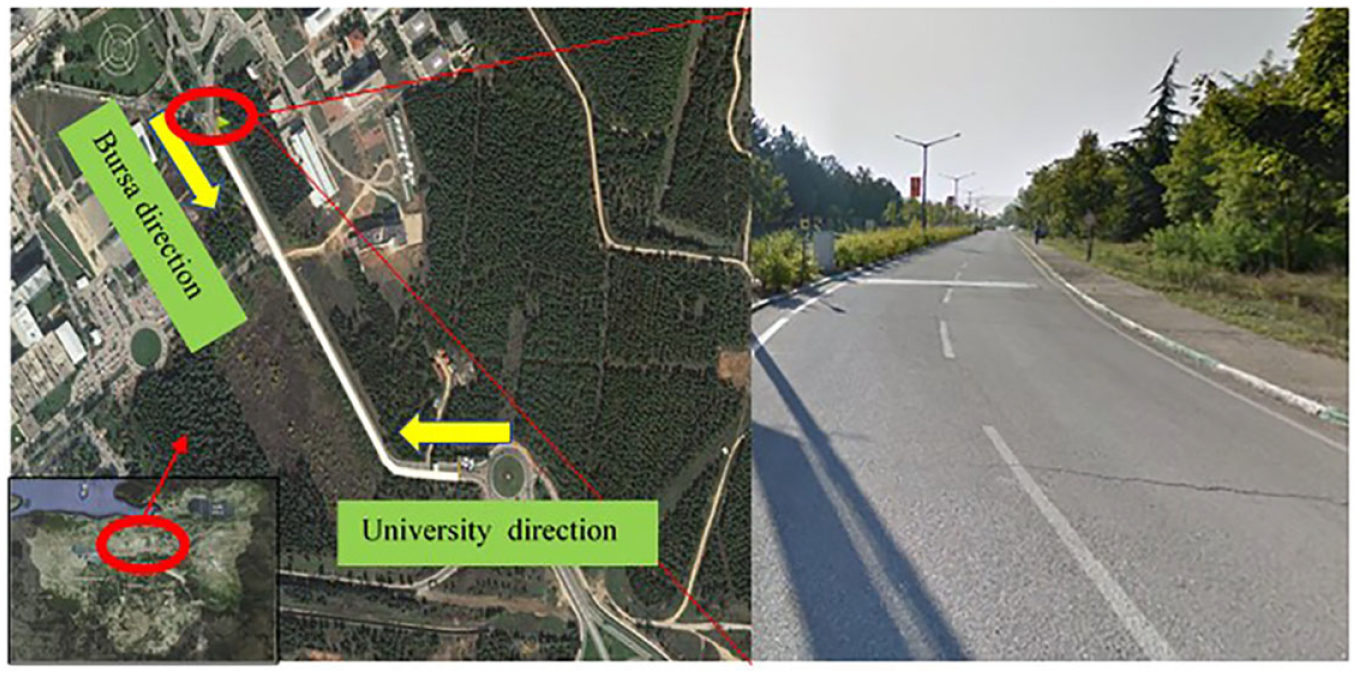
Bursa Uludagğ University field area.
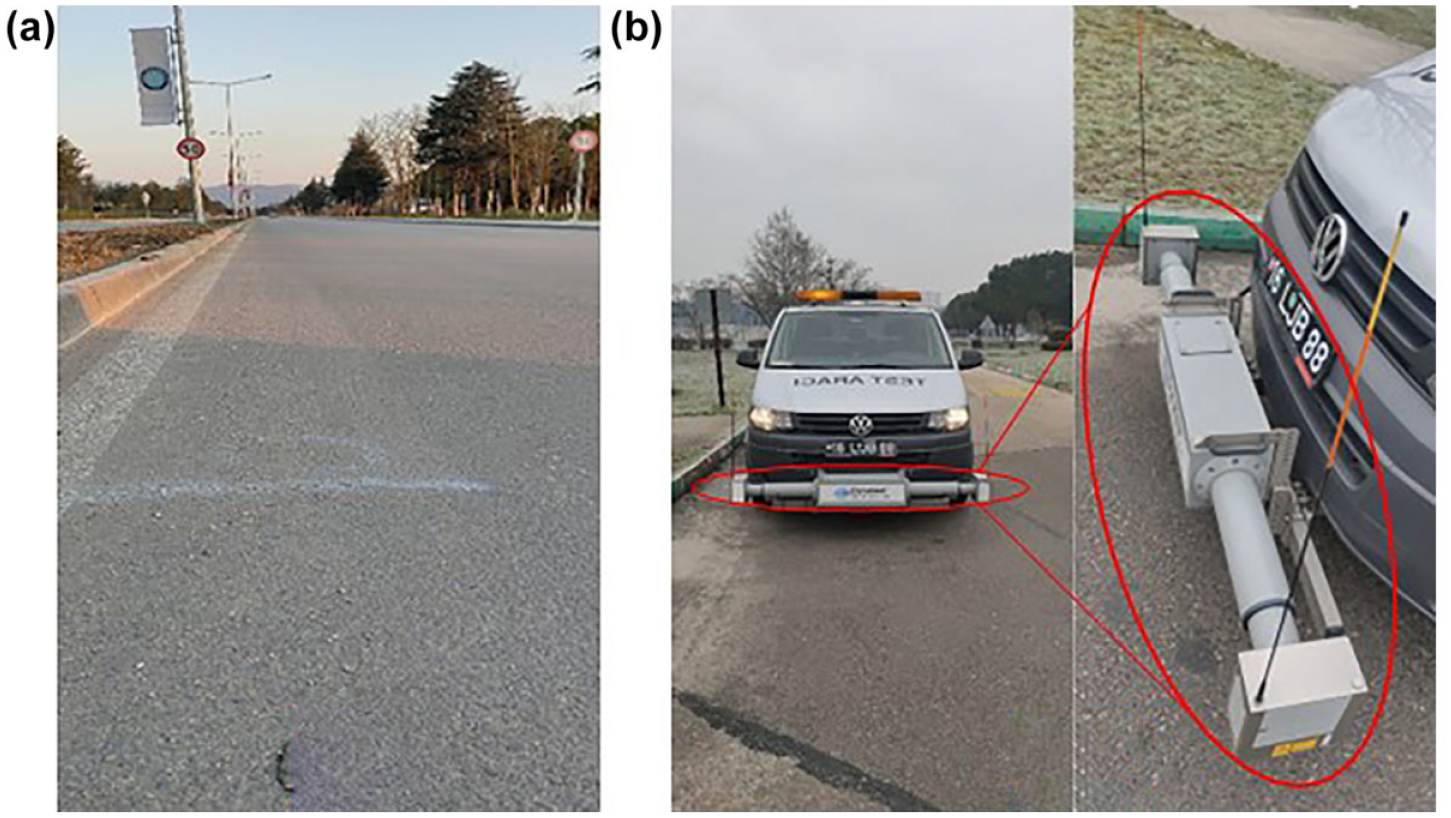
(a) Segment of the University road, and (b) profilometer vehicle and laser profilometer.
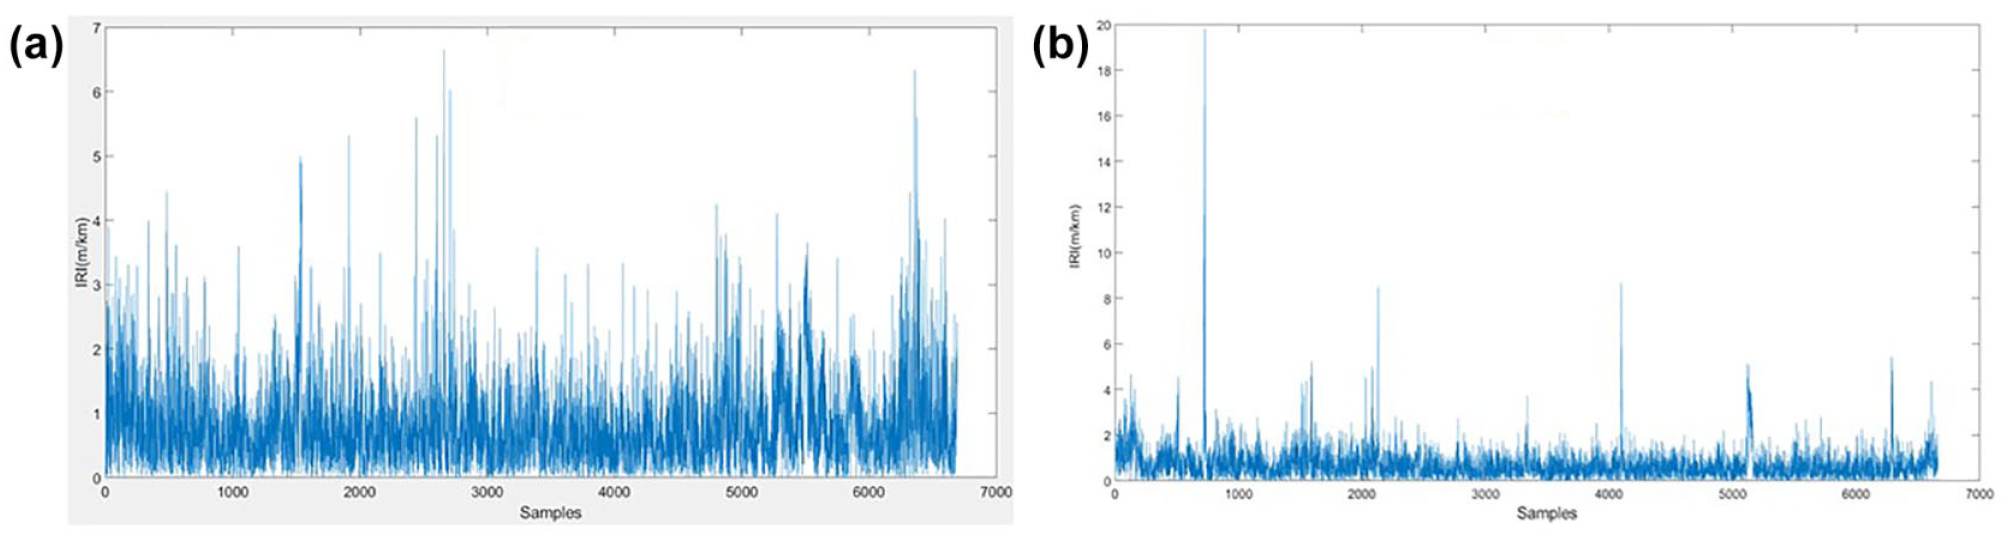
The starting location of the test road is shown in Figure 5a. To reach a speed of 25 km/h (± 1 km/h), the test vehicle was operated further back from the measurement starting point and the desired speed was reached at the measurement point. Figure 6 shows the IRI results measured with the laser profilometer device for both directions of the test road. These graphs show the right rut measurements of the profilometer vehicle: the x-axis represents the data number and the y-axis represents the IRI value.
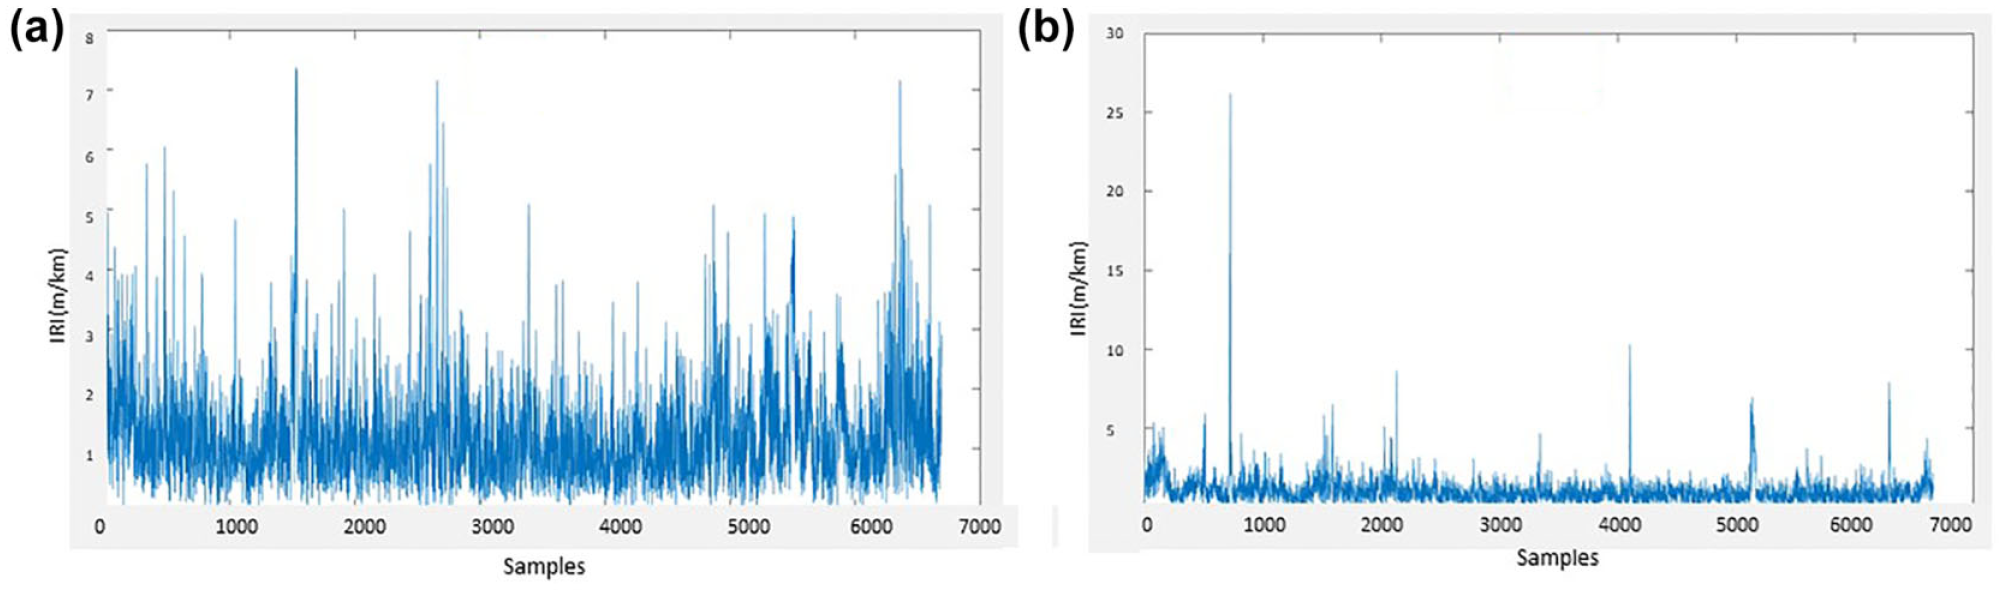
Interational roughness index (IRI) results of the test road measured by laser profilometer: (a) University direction, and (b) Bursa direction.
With the bicycle (test vehicle), a test drive was carried out in the area where the right wheel of the laser profilometer vehicle passes (Figure 7), and measurement data were obtained only from this part of the test road.
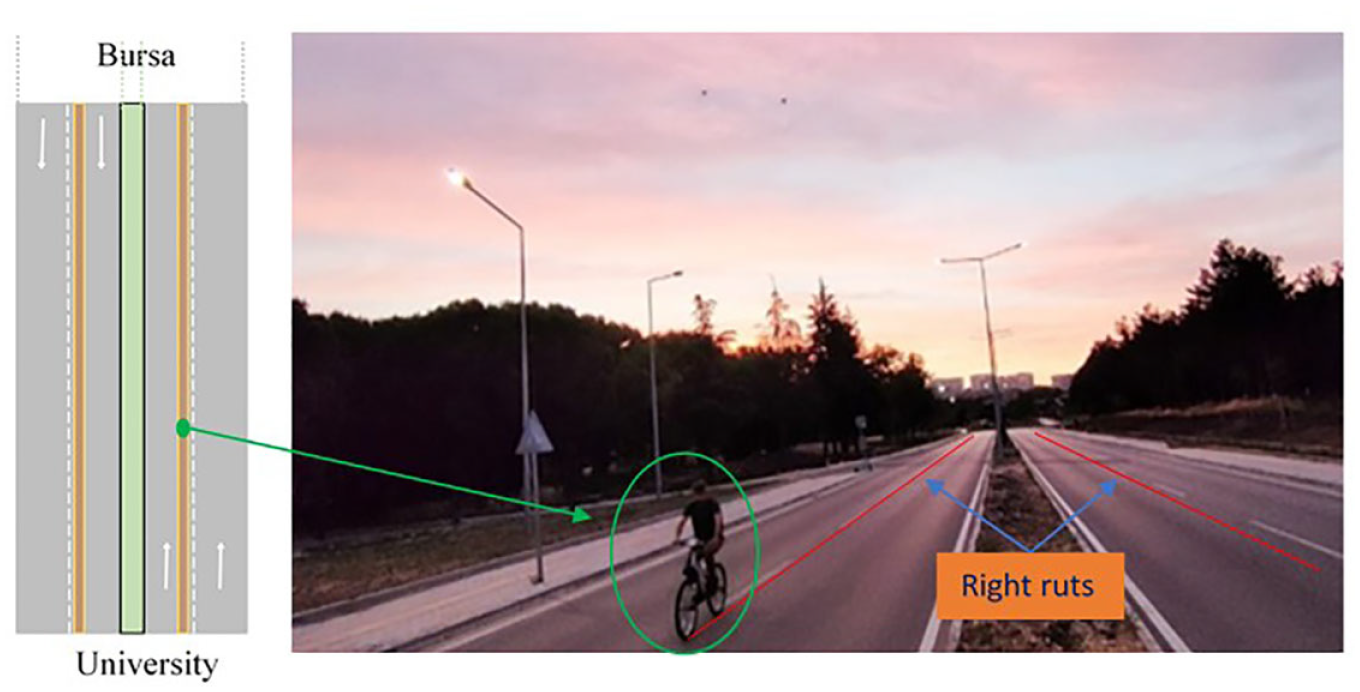
Measurement on the test road with the bicycle test vehicle.
Stiffness and Damping Coefficients
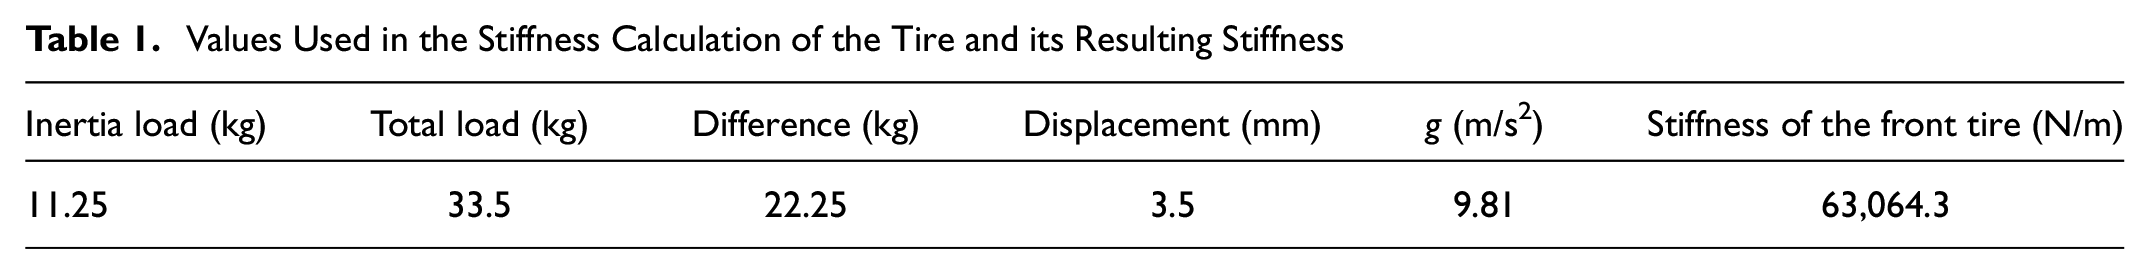
As stated, the stiffness and damping coefficients of bicycle tires have not been taken into account in previous studies of IRI measurements made with bicycles (20, 31–33). This study was the first to include these features in the IRI calculation. First, the stiffness and damping ratios of the bicycle tire had to be calculated. For this, the amount of vertical displacement caused by the load added to the bicycle’s front tire was determined (Figure 8), and the stiffness of the front tire was calculated with Equation 7. For this purpose, the unladen weight applied by the front tire (30 pounds per square inch) to the ground was 11.25 kg. With the driver weighing 78 kg, the load exerted by the front tire on the ground was 33.5 kg. The load increase on the bicycle’s front tire with the driver load is 22.25 kg. Thus, when both loads were added, the difference between the amount of displacement (

where
kt = stiffness of the tire,
g = gravitational acceleration, and
m = difference between the loaded and unladen masses.
This gave a tire stiffness value of 63,064.3 N/m and a gravitational acceleration of 9.81 m/s2. Table 1 presents the variables used to calculate the stiffness of the bicycle front tire and their values.
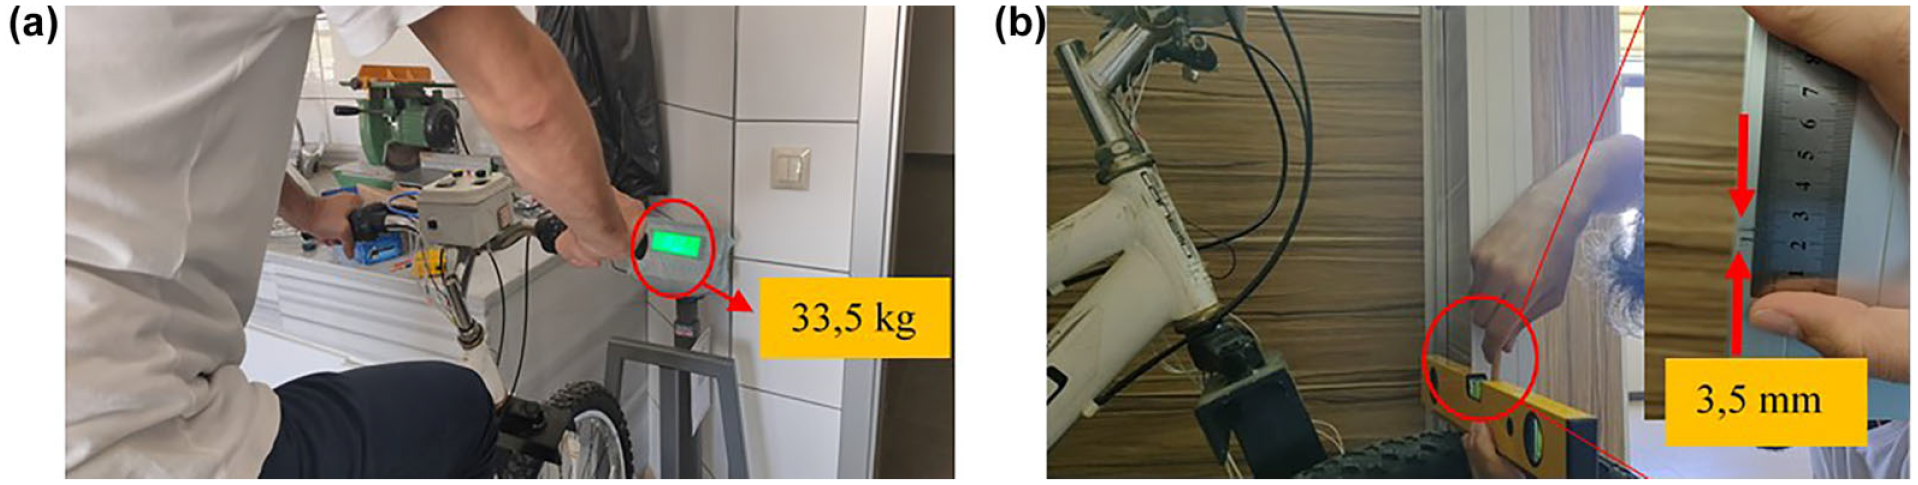
(a) Load measuırement and (b) displacement measurement.
Values Used in the Stiffness Calculation of the Tire and its Resulting Stiffness
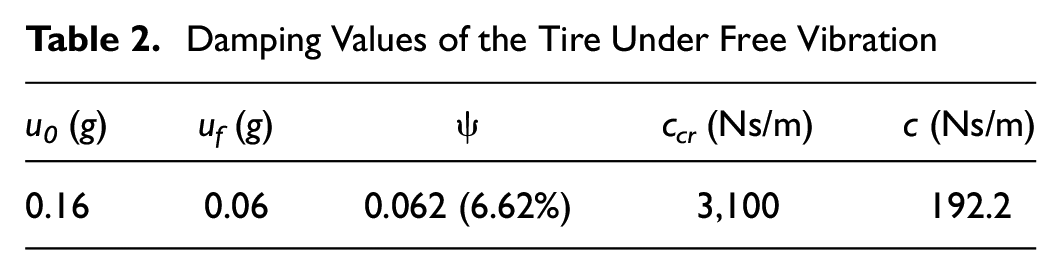
The damping coefficient is determined according to the response of the wheel subjected to free vibration under a certain load. Accordingly, to create free vibration in the bicycle wheel, including the driver load, the wheel was impacted with an iron mold and the reduction value in the vibration of the wheel was calculated. Figure 9 shows the forced vibration of the wheel as a result of the impact applied to the front wheel and the free vibration that occurred afterward.
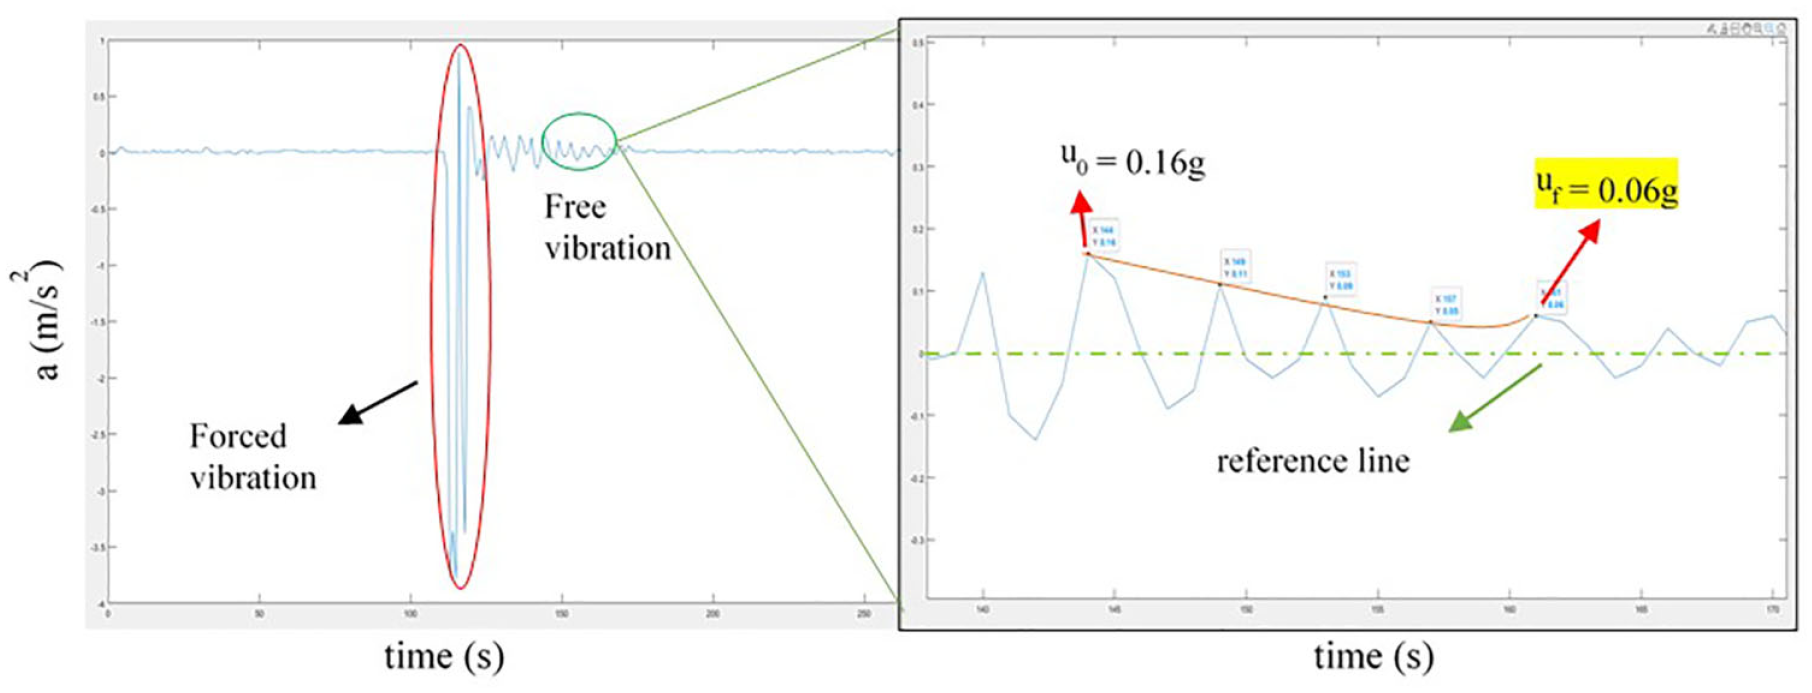
Damping rate of the tire under free vibration.
As seen in Equations 8 to 10, the damping coefficient depends on the damping ratio (

So


where
k = stiffness value of the tire, and
m is the amount of load exerted by the wheel on the contact surface.
(For
According to Equation 9, the damping ratio (
Damping Values of the Tire Under Free Vibration
Values to be Used in the Equation of Motion
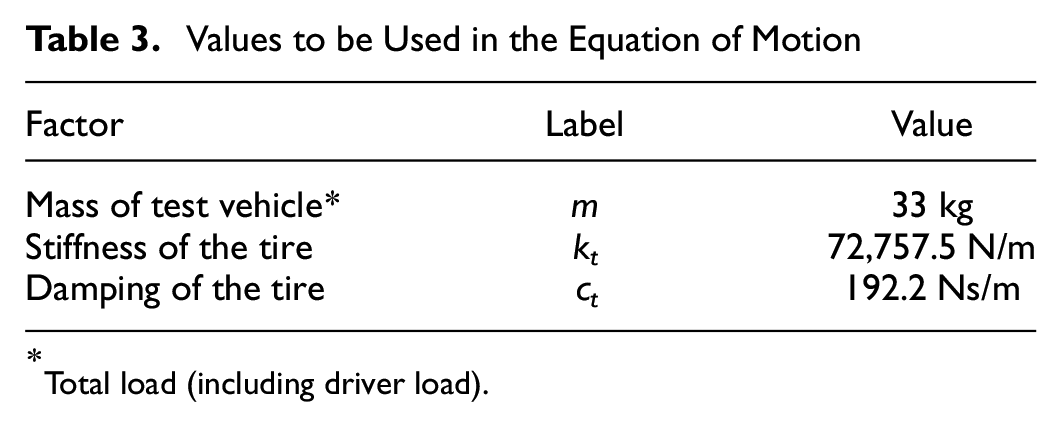
Total load (including driver load).
Calculation of Road Profile
There are a few mathematical methods to calculate road profiles from acceleration data, however, first, the data collected with an accelerometer have to be digitally filtered and numerically converted from acceleration into displacement. According to Eshkabilov and Yunusov, the most suitable digital filters for removing noise in the collected data are passband filters with the frequency bands 0.5 …, 50 Hz ( 34 ). The sampling rate of the accelerometer used in the current research was 82 Hz. As the data were collected at a speed of 25 km/h, data were received every 8.4 cm of the test road. A 0.5 to 30 Hz filter frequency range was used because of the sample rate selected. Figures 10 to 12 show the acceleration values, power spectral density of the filtered signal with the passband (0.5 to 30 Hz), and raw and filtered acceleration values, respectively, obtained from the Bursa and University directions.
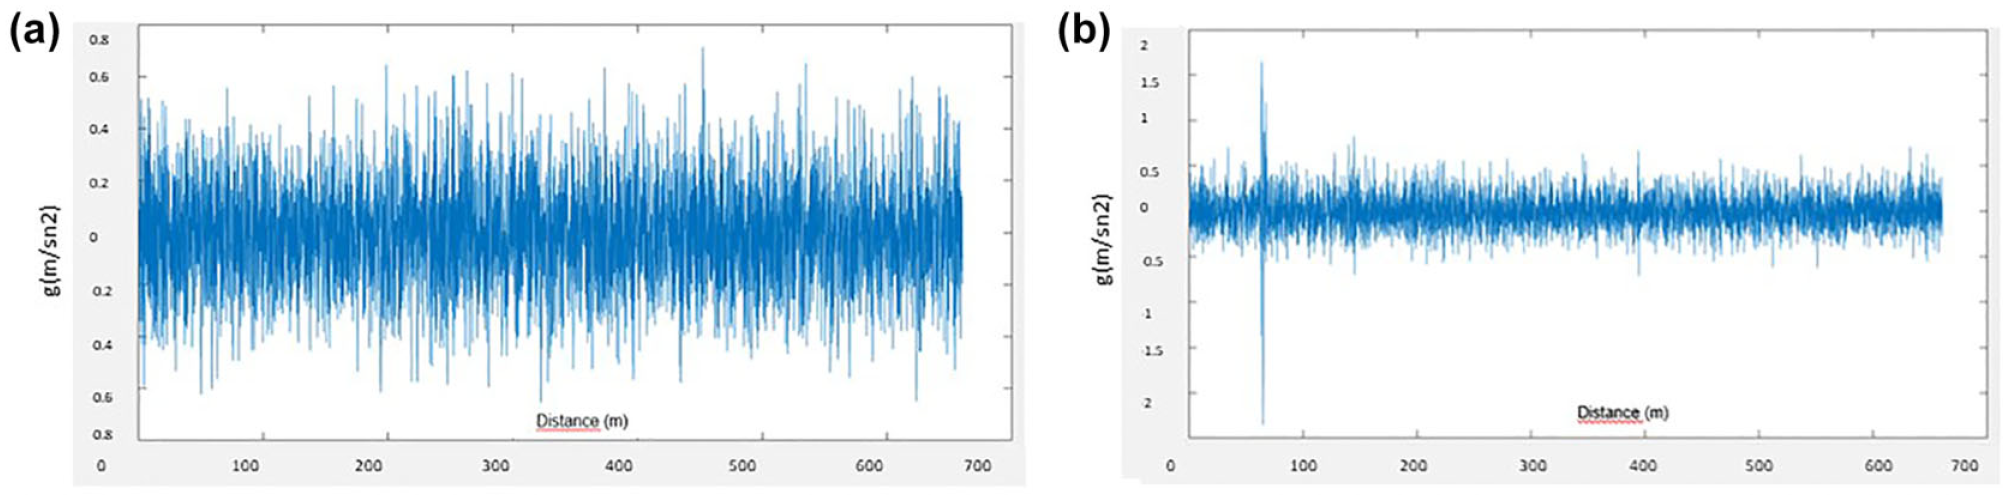
Acceleration values obtained from test vehicle: (a) Bursa direction and (b) University direction.
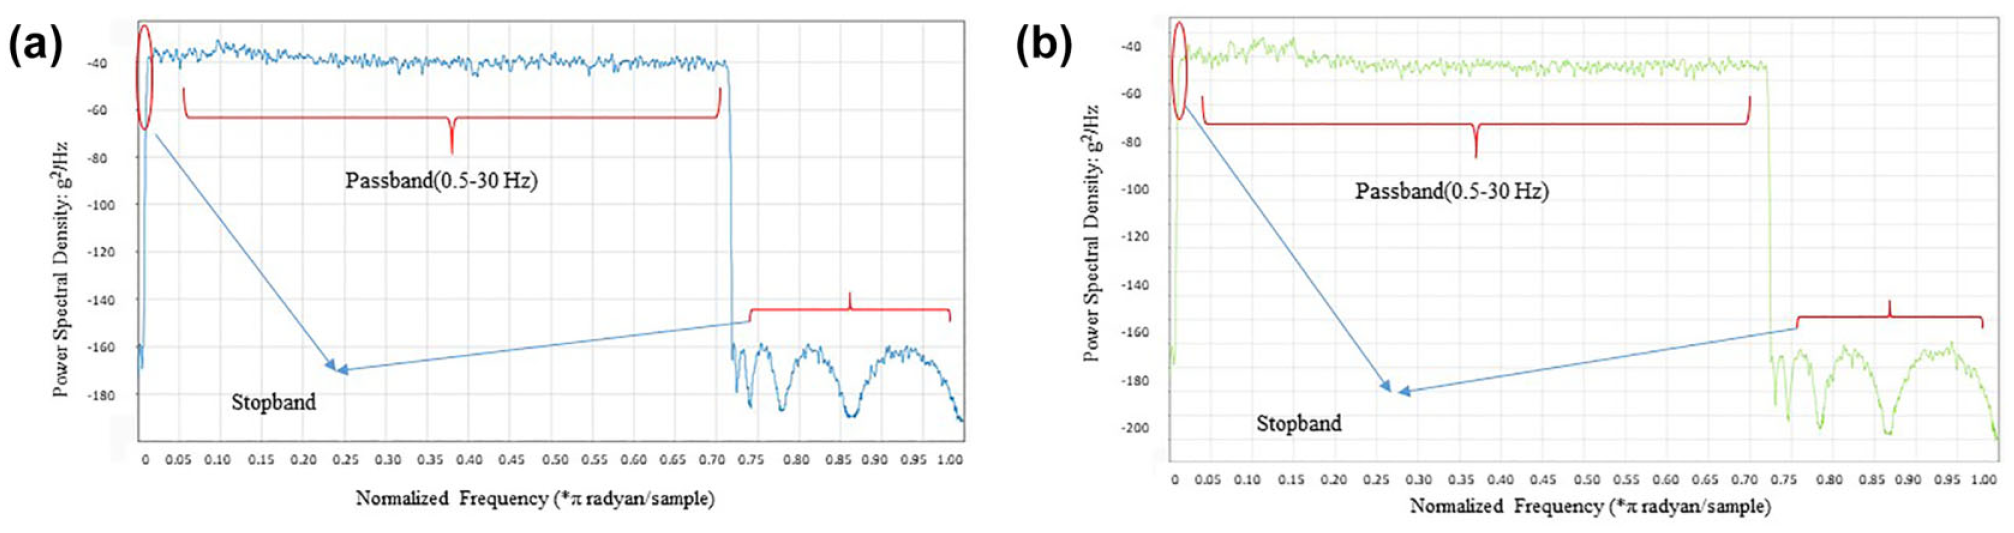
Power spectral density filtered signal: (a) Bursa direction, (b) University direction.
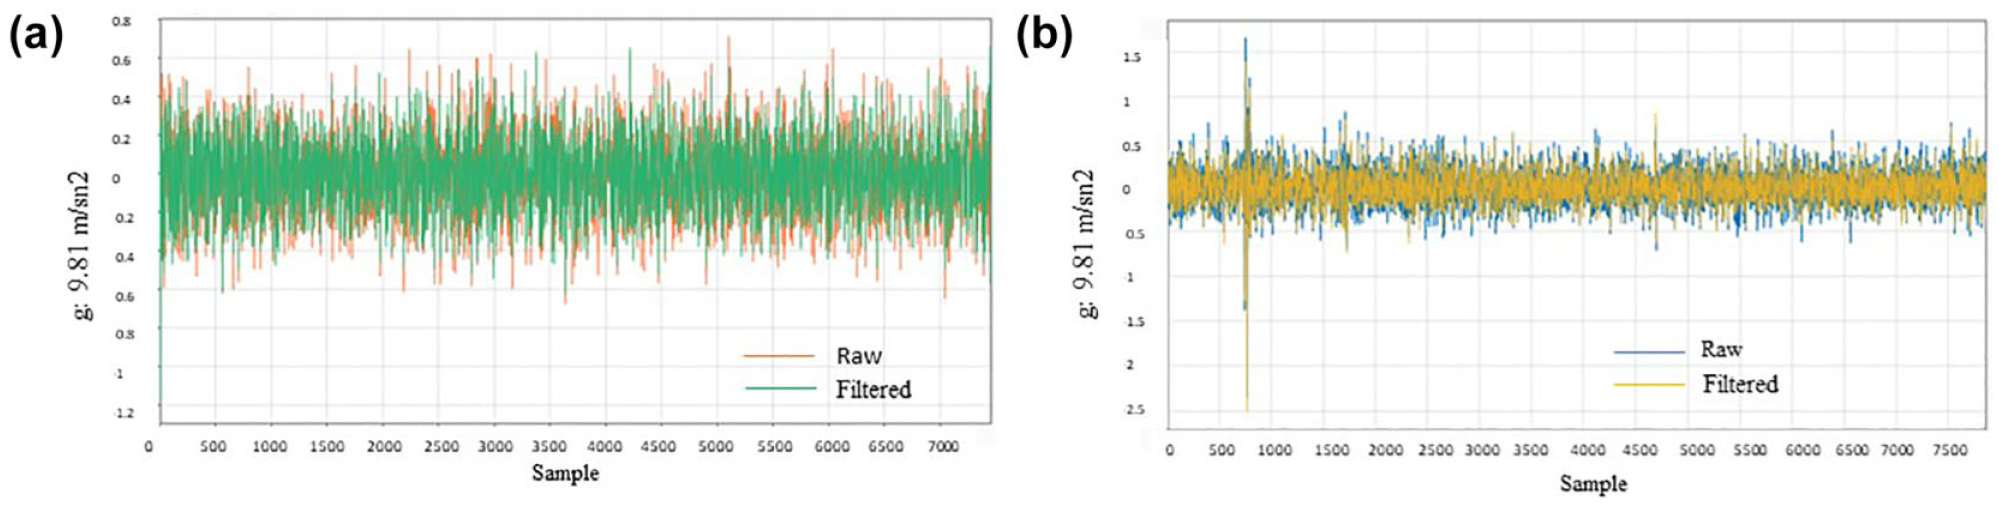
Raw and filtered acceleration values: (a) Bursa direction, (b) University direction.
To calculate the vertical displacement of the road profile, the double numerical integration of the acceleration data must be calculated. According to research by Eshkabilov and Yunusov, the Newmark β method is the most appropriate for a precise evaluation of road profiles ( 34 ). The Newmark β equation is shown in Equation 11.
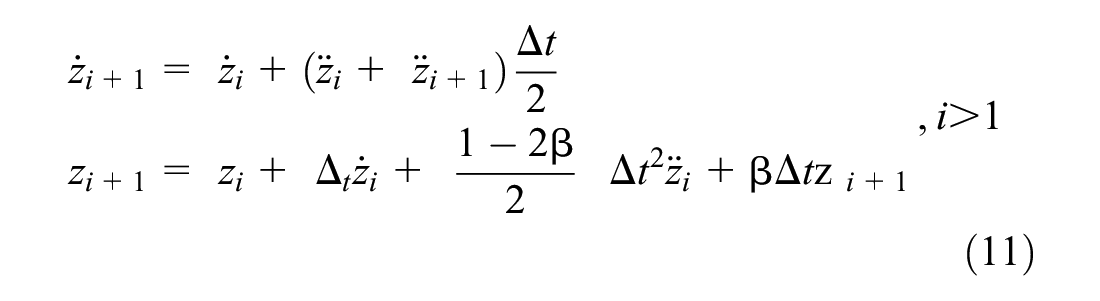
where
β is vital correction factor of the model (taking β = 0.5).
These differential equations were solved using the MATLAB Simulink tool. Therefore, after the road profile was calculated, the moving average filter, which is a profile smoothing filter, was applied:


where
Figure 13 shows the filtered IRI results with the trend and moving average filter.
International roughness index (IRI) results: (a) Bursa direction, and (b) University direction.
Results
The IRI results calculated in this study, in which the bicycle tire characteristics were taken into account for the first time, were compared with the reference laser IRI results. The test road was investigated in 10-, 30-, and 60-m segments in both directions (Bursa and University). The position information of the test vehicle (bicycle) was matched with the reference position data by the linear interpolation method. The performance of both methods was evaluated with MAE, MSE, RMSE, and MAPE measurement criteria. In Figures14 and 15, the red line represents the reference IRI values measured by the laser profilometer, and the blue line indicates the IRI values calculated in the current study. In Figure 14, a to c , the reference and estimated IRI values determined according to the 10-, 30-, and 60-m segments, respectively, of the test road examined in the Bursa direction are shown. The x-axis shows the specified distance intervals (10, 30, and 60 m), and the y-axis shows the average IRI value (mm/m). Accordingly, for the proposed method, it can be said that the reference IRI trend graph captured up to 500 m of the road on the 10- and 30-m segments. Table 4 shows the MAPE value effects on model sensitivity. According to the data, the IRI prediction values for all segments of the test road remained within acceptable limits, and the prediction value for 30- and 60-m segments of the test road was good (MAPE < 20) (see Table 5). Among these segments, the best performance was observed in the 60-m road segment: 0.2 MAE, 0.05 MSE, 0.24 RMSE, and 17.13% MAPE.
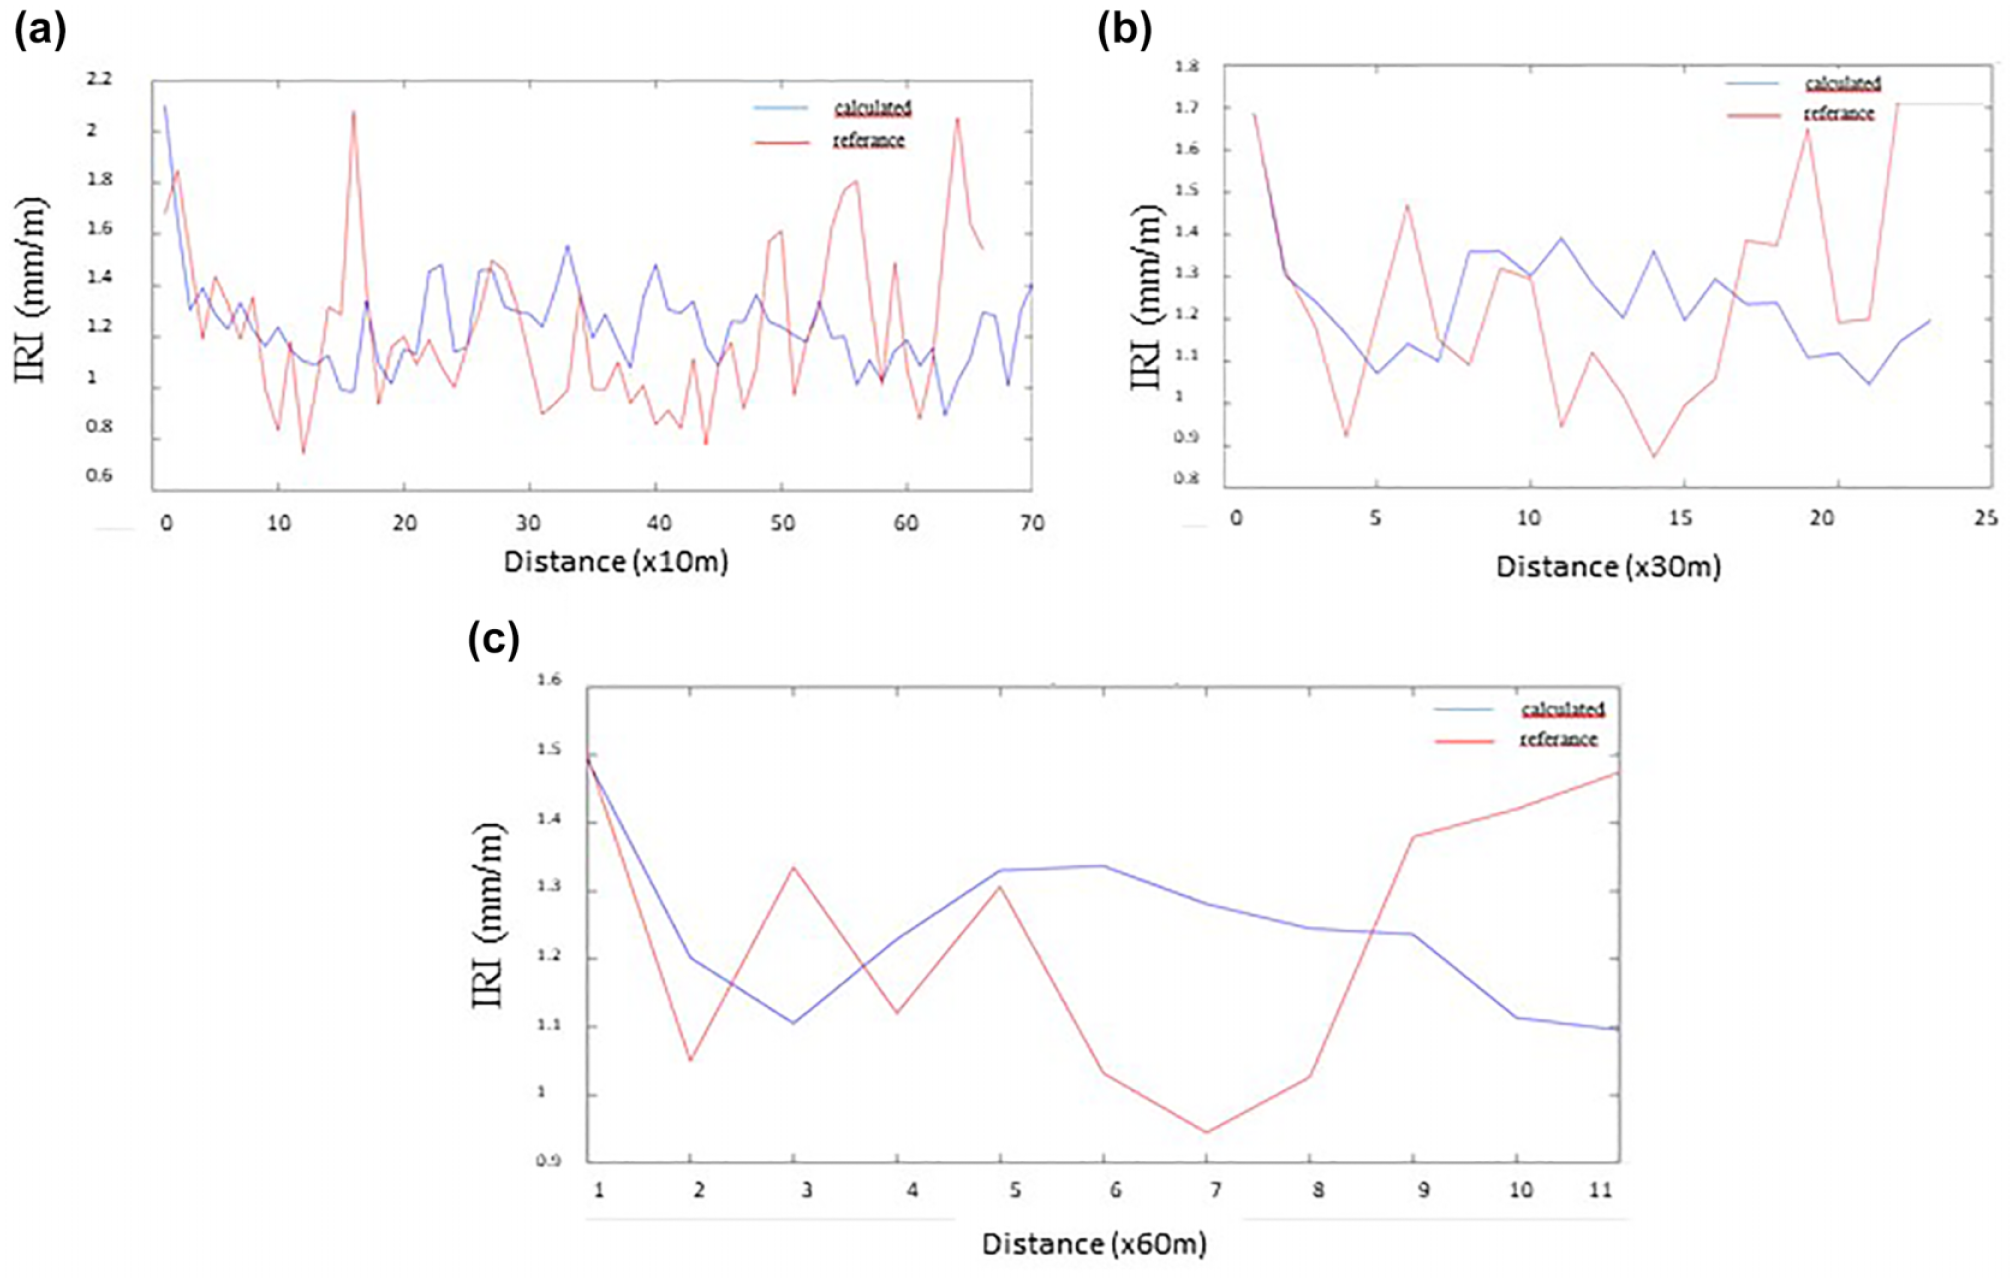
Reference international roughness index (IRI) and estimated IRI values calculated for various segments of the test road in the Bursa direction: (a) 10 m, (b) 30 m, (c) 60 m.
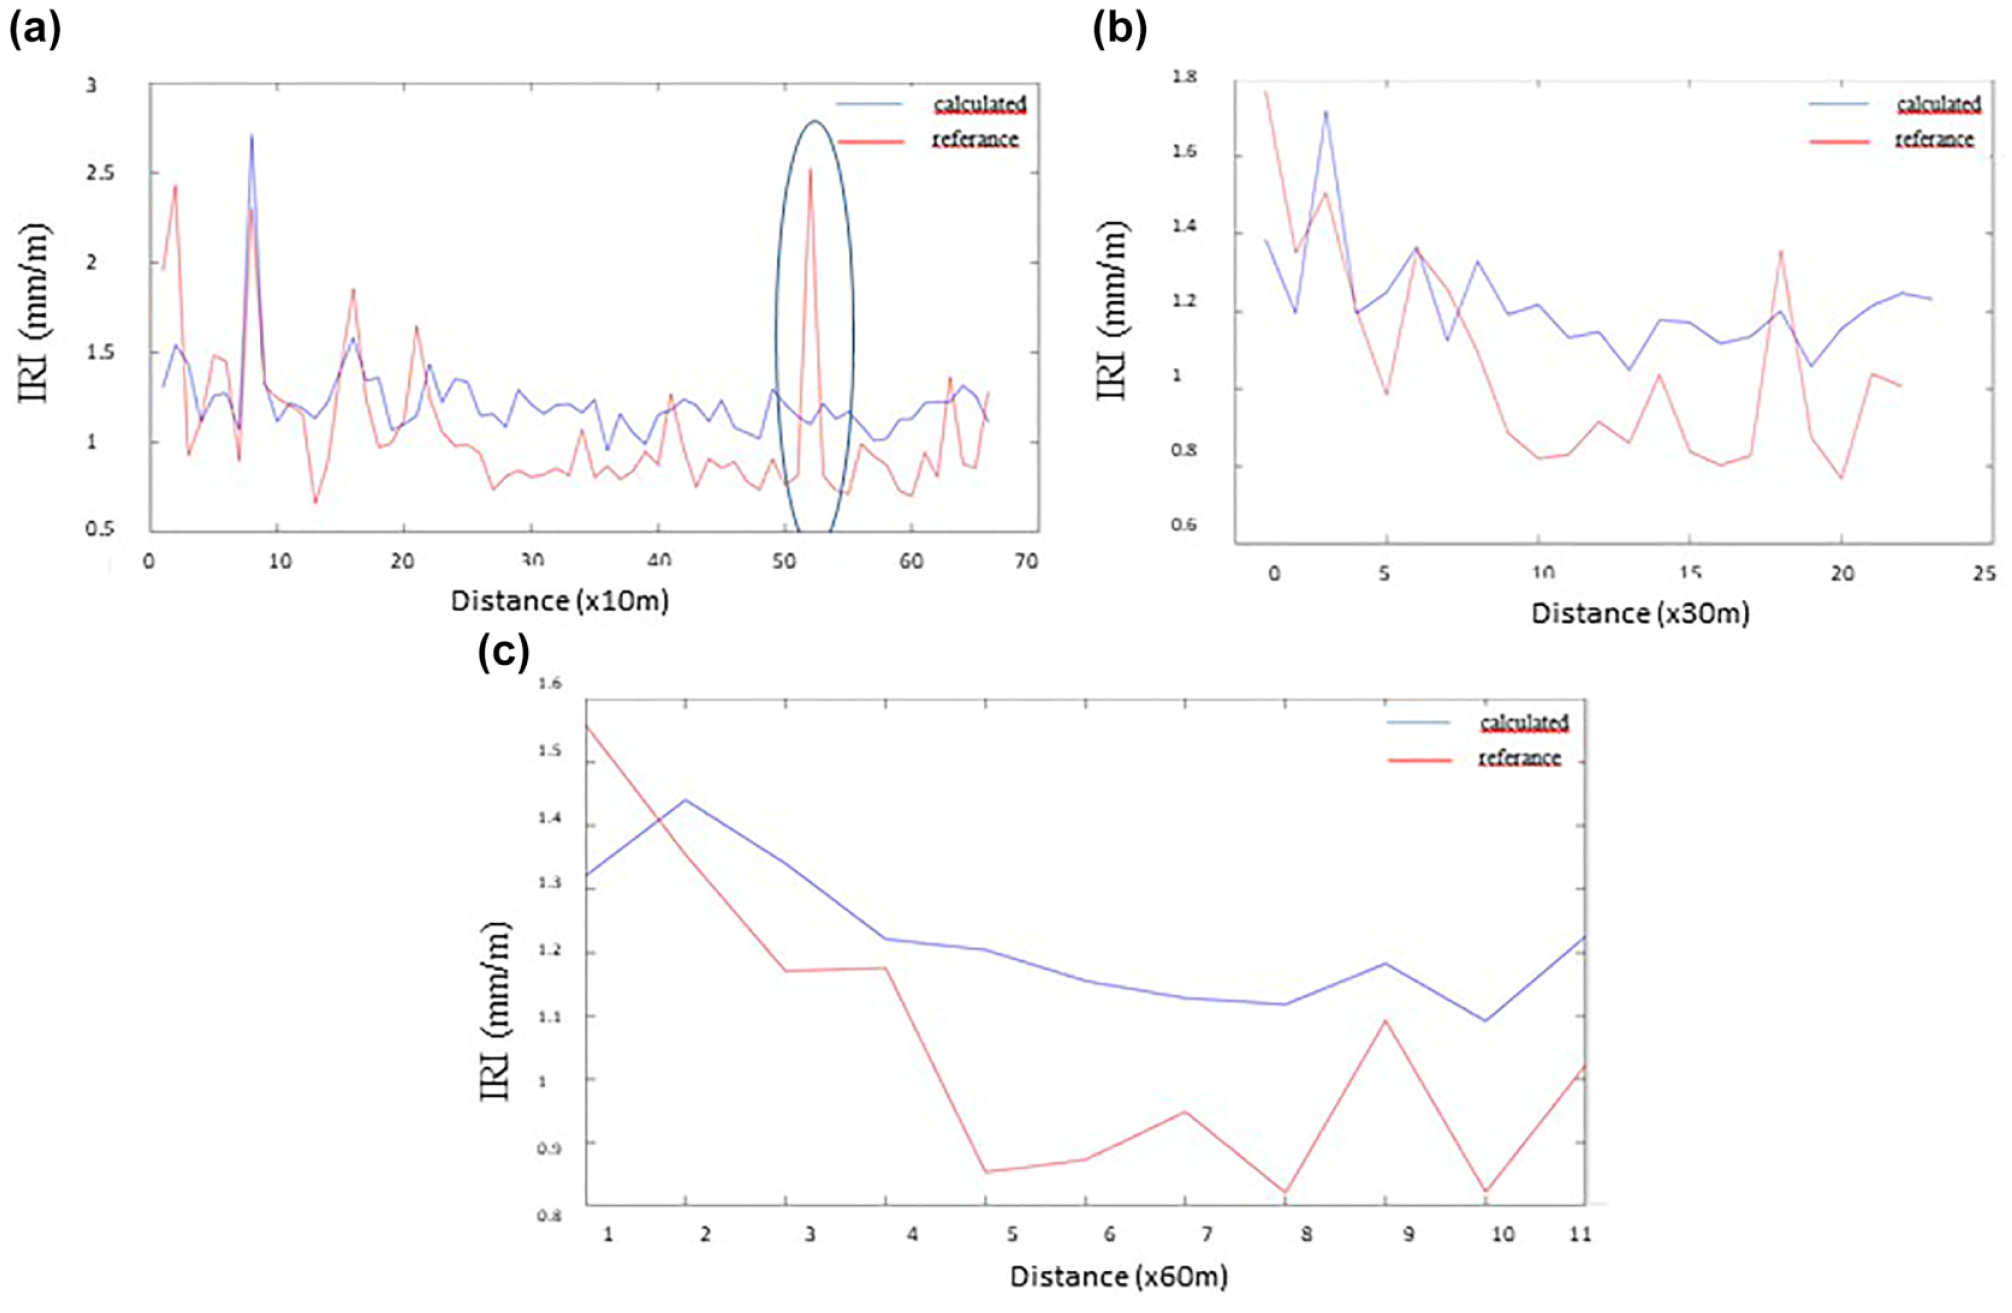
Reference international roughness index (IRI) and estimated IRI values calculated according to various segments of the test road in the University direction: (a) 10 m, (b) 30 m, and (c) 60 m.
Effects of MAPE Values on Model Sensitivity ( 35 )
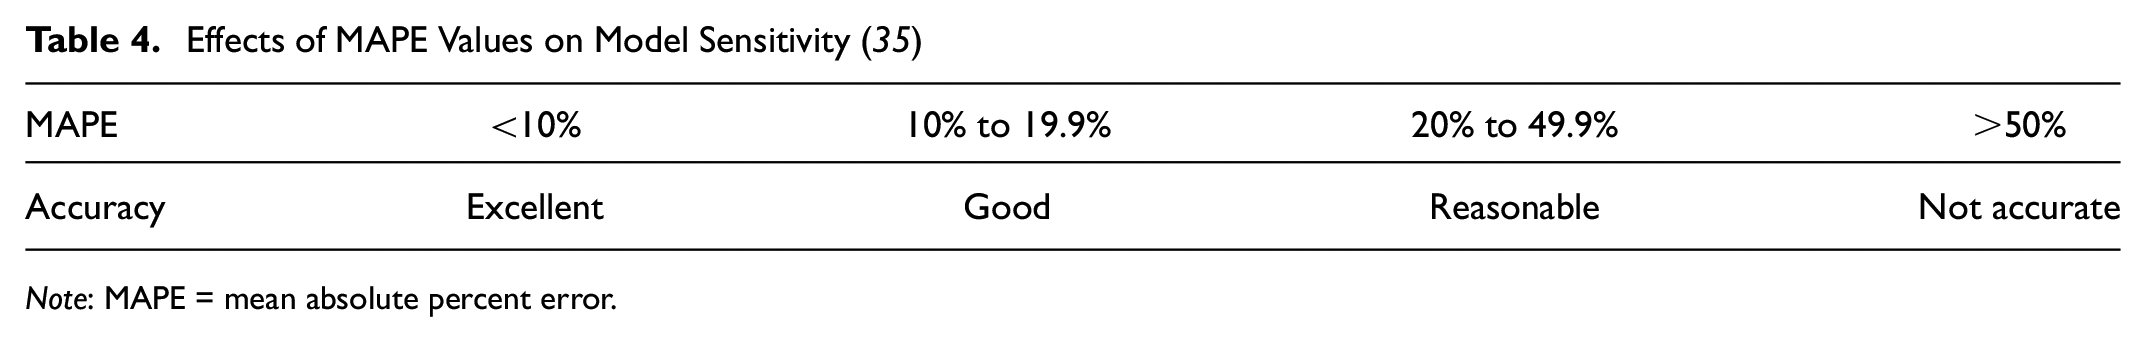
Note: MAPE = mean absolute percent error.
Performance Results Obtained for the Bursa- and University Directions
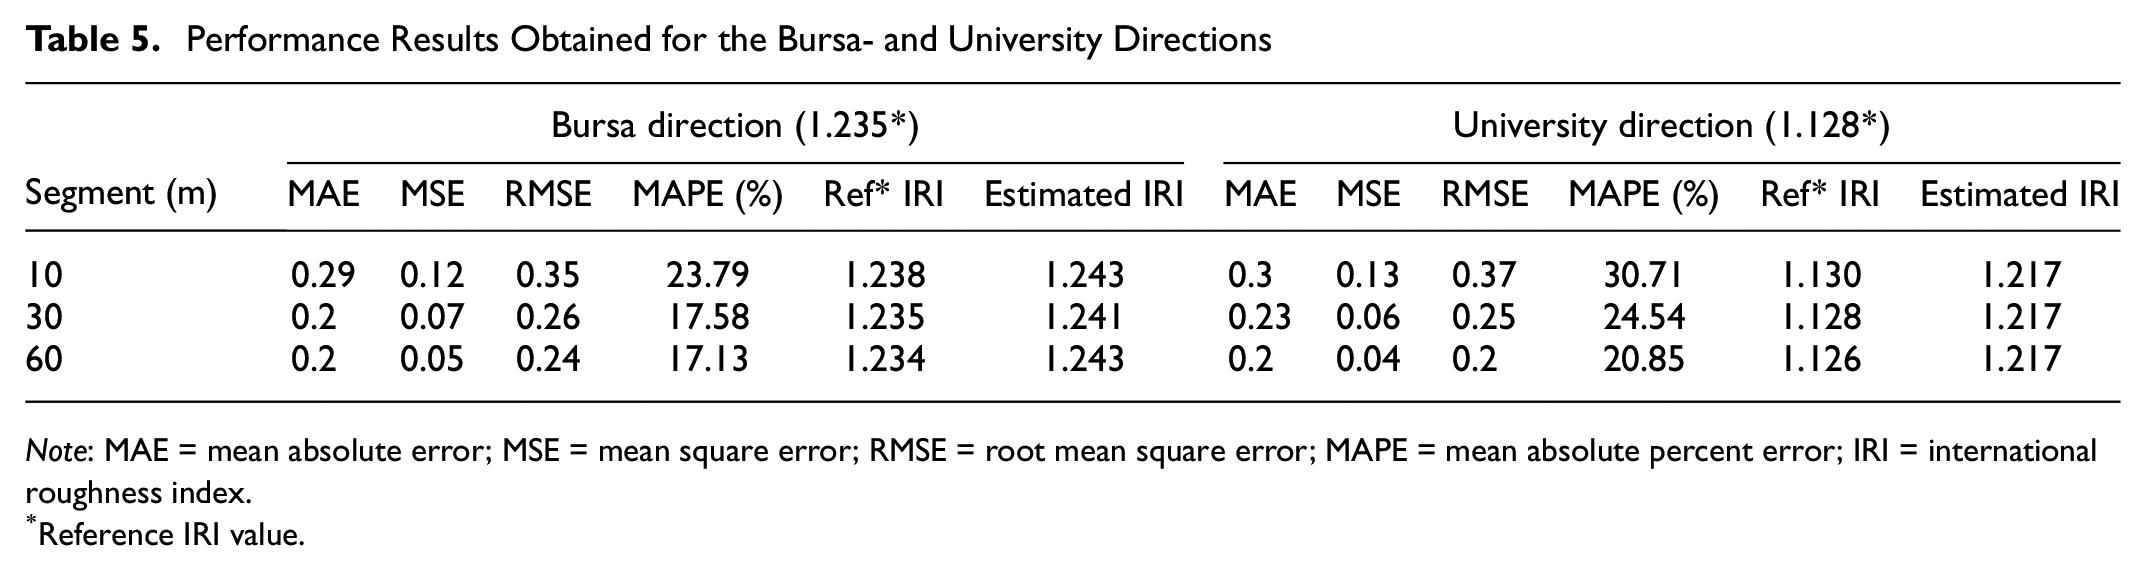
Note: MAE = mean absolute error; MSE = mean square error; RMSE = root mean square error; MAPE = mean absolute percent error; IRI = international roughness index.
Reference IRI value.
Figure 15, a to c , shows the reference and estimated IRI values determined according to the 10-, 30-, and 60-m segments of the test road, respectively (examined in the direction of the University). The estimated IRI values for all segments of the test road were found to capture the reference IRI trend, with the exception of the 520 m on the 10-m segment (Figure 15a). The best performance was found on the 60-m road segment: 0.2 MAE, 0.04 MSE, 0.2 RMSE, and 20.85% MAPE.
The reference IRI values in both directions (Bursa and University) and the IRI values calculated by the bicycle are given in Table 5. The estimated IRI values in the Bursa direction produced more accurate results. Figure 16 shows that the MAE, MSE, RMSE, and MAPE values decreased as the examined distance intervals of the test road increased, and thus the performance values increased. This figure also illustrates that the results obtained from the Bursa direction produced more accurate performance values.
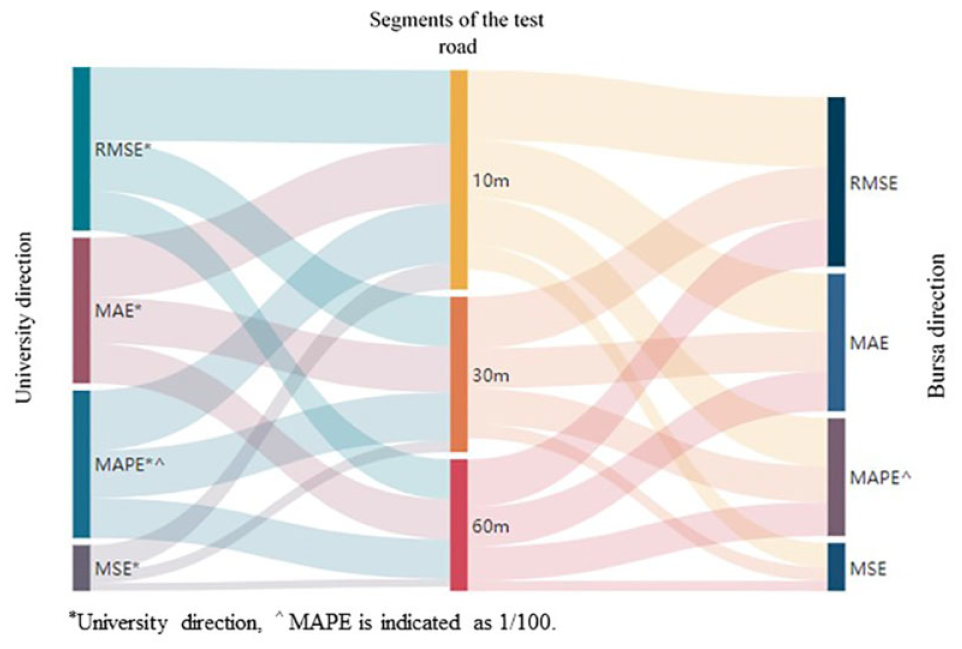
Variation in the performance criteria according to the distance intervals of the test road.
Conclusion
In this study, for the first time, IRI was calculated by considering the characteristics (stiffness and damping coefficients) of a bicycle tire. For this purpose, a mountain bicycle was used to measure IRI. The stiffness and damping coefficients of the bicycle’s front tire were measured, and these coefficients were used as input data for the equation of motion with one degree of freedom. A double-lane divided road comprising a hot asphalt mixture in Bursa Uludagğ University campus was chosen as the test road. Reference IRI values of the test road were measured by a laser profilometer vehicle.
A bycicle-mounted DAS was designed to obtain acceleration and position data from the test road. A three-axis accelerometer and GPS sensor obtained the acceleration data and position information inside the DAS. The bicycle was driven across the right rut of the reference laser profilometer vehicle at a speed of 25 km/h. The test road was divided into 10-, 30-, and 60-m segments. Each segment was evaluated using MAE, MSE, RMSE, and MAPE evaluation criteria. According to this, the reference IRI values were estimated to have an accuracy of 83% (for the 60-m segment) with the test vehicle (bicycle) developed in this study, in which the bicycle wheel characteristics were considered.
It should be noted that the shape and pressure of the tire, as well as the weight of the driver, had an influence on the measured values. This study could therefore be expanded by investigating different wheel characteristics and types of roads.
This study’s results were very close to the reference IRI values and therefore deemed satisfactory. As a result, a much cheaper IRI measurement vehicle was developed as an alternative to an expensive laser measurement tool. This study also measured the IRI values of nonmotorized roads, which are increasingly important today; it is not currently possible to measure the quality of nonmotorized roads using the established profilometer tools. All the indicators showed very promising results, suggesting that the proposed method could be a reliable, less expensive option to determine the IRI of highways, especially nonmotorized roads, and an alternative measurement method for road authorities.
Footnotes
Acknowledgements
We thank Bursa Highways Agency for providing the laser profilometer tool for obtaining the reference IRI data of the test road examined in the study.
Author Contributions
The authors confirm contribution to the paper as follows: study conception, design and data collection: M. Rizeliogğlu analysis and interpretation of results: M. Yazıcı; draft manuscript preparation: X. Author, Y. Author. All authors reviewed the results and approved the final version of the manuscript.
Declaration of Conflicting Interests
The authors declared no potential conflicts of interest with respect to the research, authorship, and/or publication of this article.
Funding
The authors received no financial support for the research, authorship, and/or publication of this article.