
Abstract
With the increasing emphasis on sustainable transportation solutions, there is an urgent need for a system that can accurately assess vehicle-specific energy consumption in real-time. However, the current modeling frameworks have a significant gap in that they are not demand- and congestion-responsive, nor are they capable of modeling the system-wide energy consumption of bus fleets at the vehicle-level, encompassing all three types of powertrains—conventional, hybrid, and electric. To address this gap, we present a comprehensive modeling framework that takes into account passenger loading, considers the dynamics of the system including acceleration, and is capable of predicting the real-time energy usage of each bus in a transit network. Using the Pioneer Valley Transit Authority system as a case study, we calibrated existing powertrain-specific models for conventional diesel, hybrid, and battery electric buses. Our demand- and congestion-responsive energy consumption modeling framework fills this critical gap and offers significant potential for future sustainable transportation planning. Relying on detailed trajectories computed from one month of bus location data, along with passenger counts and road grade, our framework is a novel contribution in that it provides spatiotemporal energy predictions for an entire bus system. As it is readily calibrated with potential improvements in accuracy given more data, this framework can be applied by transit agencies for the purposes of real-time energy consumption monitoring, fleet electrification planning, equity analyses, and carbon emission reduction strategies.
Keywords
In 2021, the transportation sector was responsible for 28% of the total energy consumption in the U.S. ( 1 ). Although public transportation accounted only for 6% of all trips taken across the country, the energy intensity of buses (0.11 kWhpkm) is significantly lower than that of cars (0.22 kWhpkm) ( 2 , 3 ). This indicates that public transportation can significantly reduce transportation-related energy consumption and carbon emissions by providing an alternative to individual car use. Thus, public transportation has an important role in climate change mitigation. Given the increasing urgency of the climate situation, there is a need for readily deployable energy models to facilitate decision-making for sustainability in bus transit networks.
Hybrid electric bus (HEB) and battery electric bus (BEB) are low- and zero-emission vehicles. By adopting HEB and BEB into public transportation fleets, we have the potential to significantly reduce the transportation sector’s overall emissions and move toward a more sustainable future ( 4 ). Furthermore, low- and zero-emissions vehicles are cheaper to run, as the annual energy costs of HEB and BEB are 34% and 73% less than that of conventional diesel bus (CDB) ( 5 ). Hybrid and electric buses that are actively operating at transit agencies across the U.S. account for 22% and 2% of the total buses, respectively ( 6 ).
Currently, transit agencies do not have any system to accurately track the per-vehicle energy consumption of their fleet on a daily or hourly basis. This highlights the need for energy models to analyze system-wide energy consumption. Vehicle-specific models are essential for decision-making, especially under constraints on budget and time. For instance, an energy consumption model can aid in identifying the most effective investment strategies and prioritizing routes for electrification. These models can be applied to evaluate the potential impacts of electrification on energy usage and emissions. Furthermore, energy consumption models can help policymakers to predict future energy consumption patterns at the vehicle level, assess the economic viability of different electrification strategies, and estimate the potential environmental outcomes of these strategies. Given these factors, an energy consumption model can play an instrumental role in promoting sustainable transportation and is an initial step toward helping policymakers design effective strategies for reducing greenhouse gas emissions.
Related Work
The modeling of energy consumption in public transportation systems has been widely studied, and several methods have been explored to develop models to estimate energy consumption by taking into account a range of factors and parameters ( 7 – 15 ). The earliest framework to model fuel consumption and emissions in heavy-duty diesel vehicles was introduced in 2004. The model estimates fuel rates based on variables such as engine power, friction factor, speed, displacement, and engine efficiency ( 16 ). This model has been applied to a wide range of fleets, including light- and medium-duty vehicles. An enhancement was made to the previous model by removing an unrealistic condition under which buses have to either accelerate at full throttle or brake at full braking to minimize their fuel consumption levels ( 17 ). In another improvement to the physics-based energy consumption model, a second-order polynomial energy consumption function was introduced ( 18 ). This model takes into consideration several factors including vehicle resistance force, rotational mass, gear ratio, the total mass of bus, acceleration, and speed as the dependent variables. In another study, a model was developed to estimate energy consumption by taking into account the distance traveled, route taken, and time ( 19 ). This model captures auxiliary system variables including heating, ventilation, air conditioning, and other electrical components in the energy consumption model. A more recent study focused on developing a system-wide energy consumption model for Massachusetts Bay Transportation Authority trains ( 15 ). This machine-learning-based model is capable of predicting energy consumption models using train movement and operation data, ridership, and ambient temperature data. Despite all these efforts, no approach has been proposed to provide accurate system-wide energy estimates based on real-time vehicle-specific models.
This paper fills the gap in the literature by developing a modeling framework that is demand- and congestion-responsive. The framework is capable of modeling the system-wide energy consumption of a bus fleet at the vehicle-level, including all three types of conventional, hybrid, and electric powertrains. We calibrate vehicle-specific energy models for various powertrains to arrive at accurate system-level and vehicle-level predictions. We also develop a systematic approach to build an energy model, which is not only highly interpretable and high-performing, but is also simply built based on vehicle-specific parameters and trajectories.
The results of this energy modeling framework can be considered as an initial step to build a decision support tool to help transit agencies in planning the electrification of their fleets. This model can be used to plan future public transport systems, reduce energy consumption, facilitate the transition toward more sustainable fleets with lower emissions, and make better policy decisions about fleet replacement.
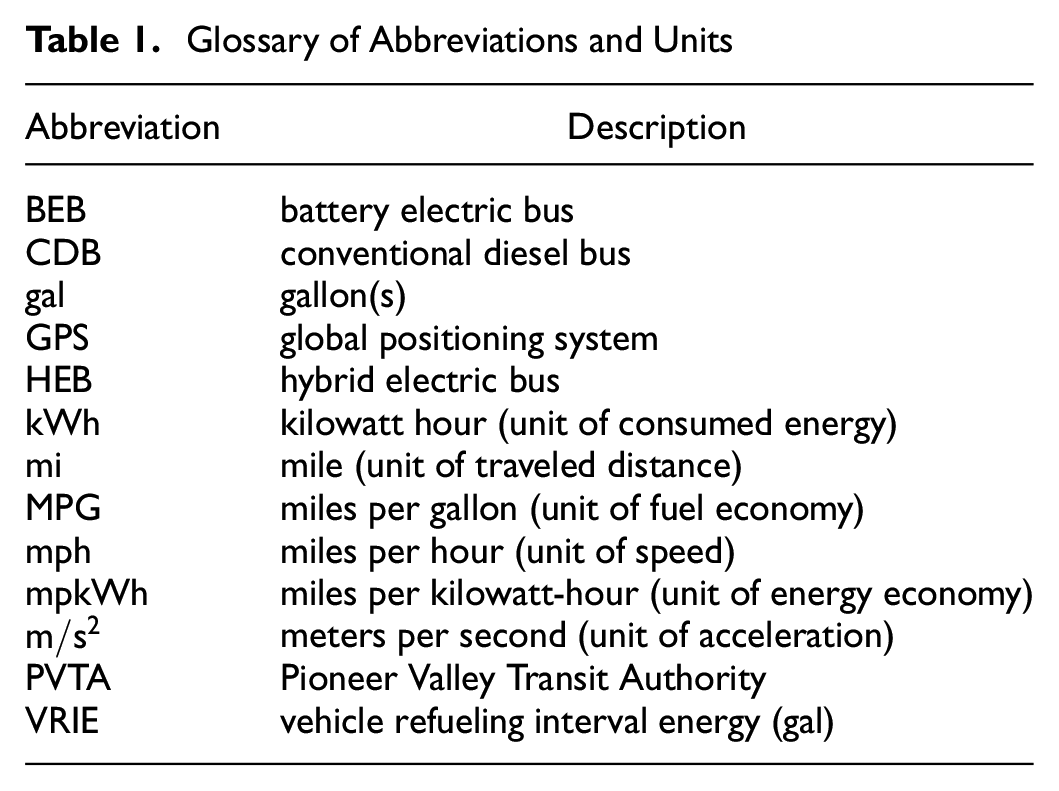
As an aid to the reader, we summarize the abbreviations used in this paper in Table 1. The rest of the paper is organized as follows. We describe the case study area in the next section. Following this, we describe the methods used (data and models). Then we present and discuss the results and close with a conclusion.
Glossary of Abbreviations and Units
Case Study
Bus Network and Fleet
The Pioneer Valley Transit Authority (PVTA) is the second-largest transit agency in Massachusetts, U.S. It served over 6 million passenger trips in the Pioneer Valley region (Hampden and Hampshire counties) in 2022. Figure 1 shows the location of bus stops in PVTA network. PVTA operates 178 buses on 45 fixed routes ( 20 ). Out of these buses, 88% are CDB, 5% are HEB, and 7% are BEB. There are 10 different types of bus engines in the network: five conventional (“C1”–“C5”), two hybrid (“H1” and “H2”) and three electric (“E1”–“E3”) powertrain engines. Figure 2 displays the histogram of PVTA bus engines.
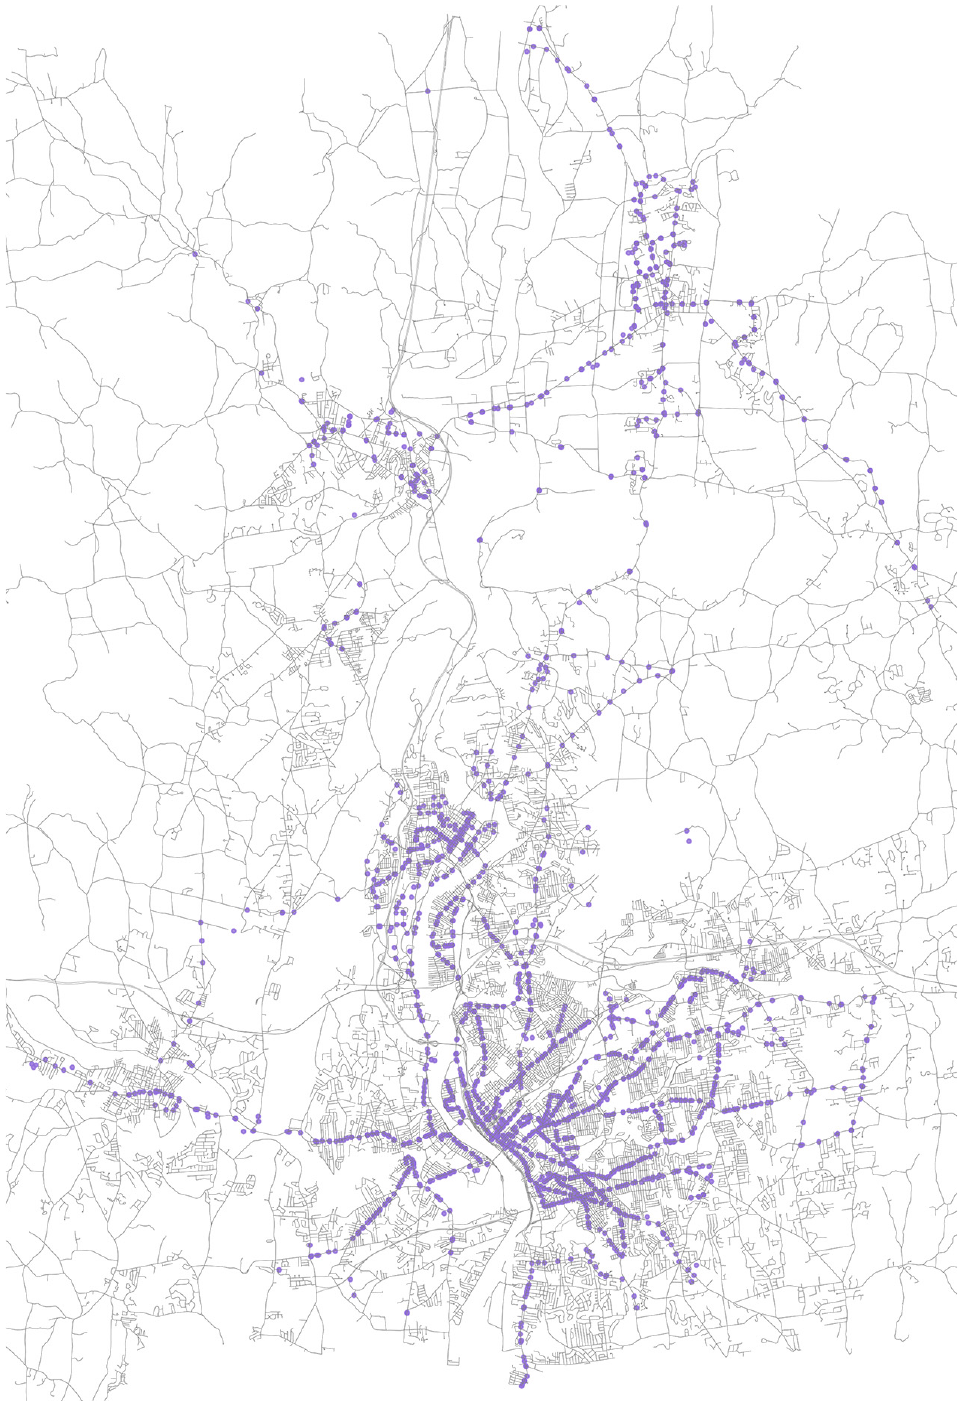
Pioneer Valley Transit Agency bus stop locations.
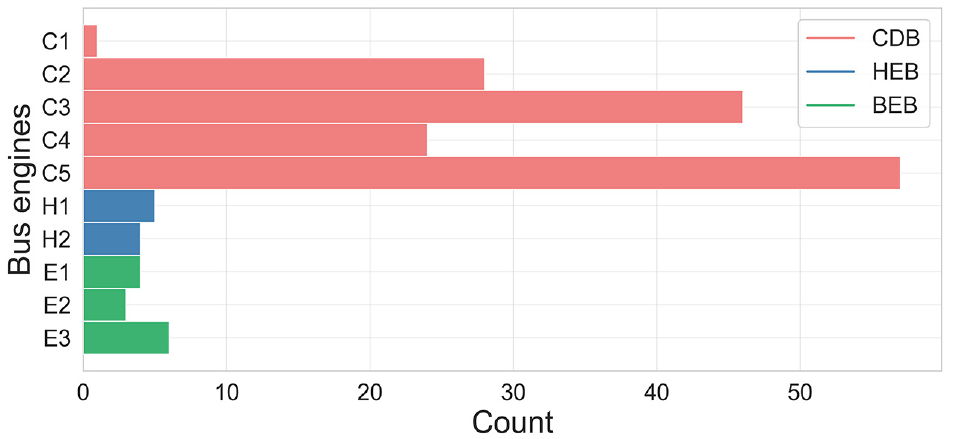
Histogram of vehicle engines in Pioneer Valley Transit Agency network.
Energy Data
To calibrate and validate the powertrain-specific energy models, we used timestamped refueling data indicating the amount of refueling tickets for each bus in April 2022. Refueling tickets are collected each time buses go for refueling to the garages. To better understand the frequency of refueling, we plotted a histogram of refueling intervals, as shown in Figure 3. This analysis revealed that refueling intervals are irregular, with an average interval of 34.8 h and a median interval of 24.8 h.
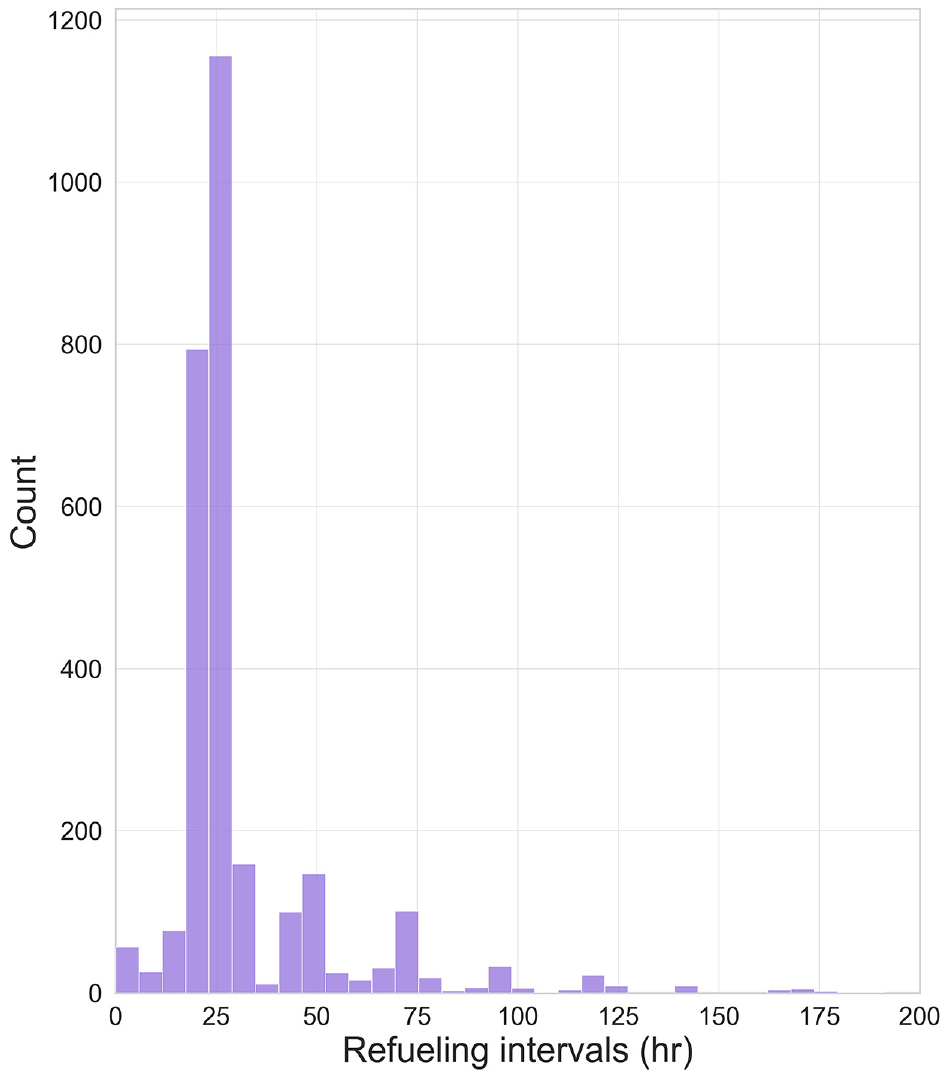
Histogram of refueling intervals.
For the purpose of validation, we define the vehicle refueling interval energy (VRIE) as
Figure 4 shows histograms of VRIE (gal) for CDB and HEB. The mean VRIE is about 30 gal for CDB and 26 gal for HEB.
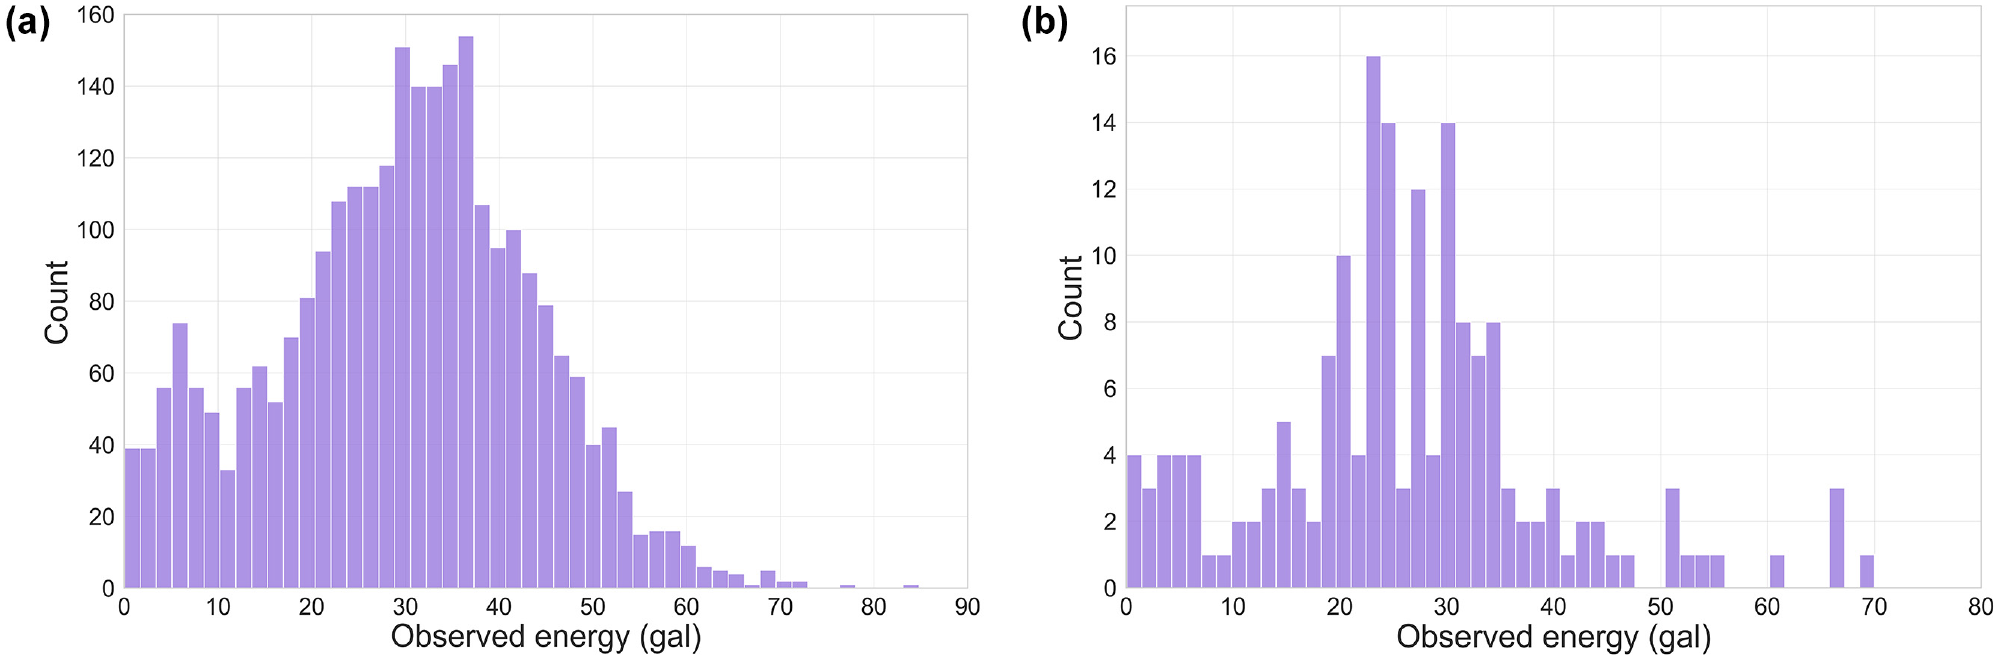
Histograms of vehicle refueling interval energy (gal) for: (a) conventional diesel bus and (b) hybrid electric bus.
Methods
Trajectory Computation
First, we cleaned the timestamped vehicle GPS location data by removing all data points with a time interval of less than 2 s. Each timestamp corresponds to the departure of a bus from a given stop. These spurious observations comprised about 3% of all the location timestamps in the dataset. Afterward, we computed trajectories (distance
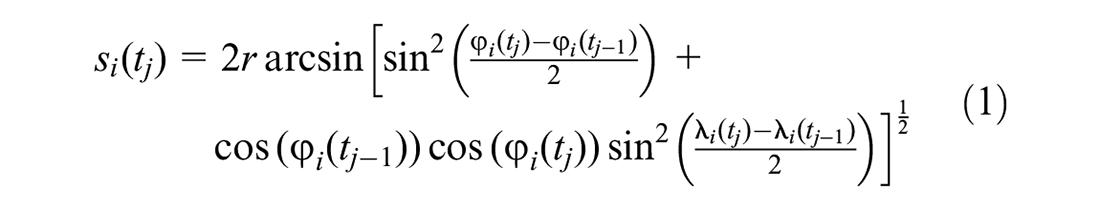


where
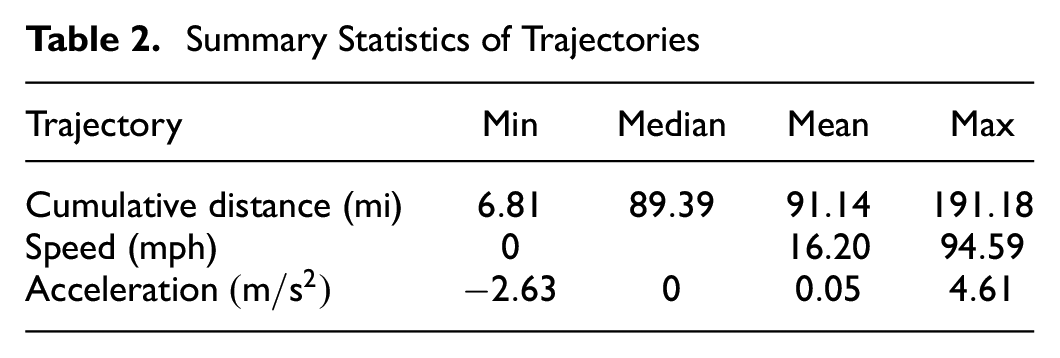
Trajectories for a selected 24 h period are shown in Figure 5. Histograms of distances, speeds, acceleration, and time intervals are depicted in Figure 6. Summary statistics of trajectories for April, 2022, are shown in Table 2.
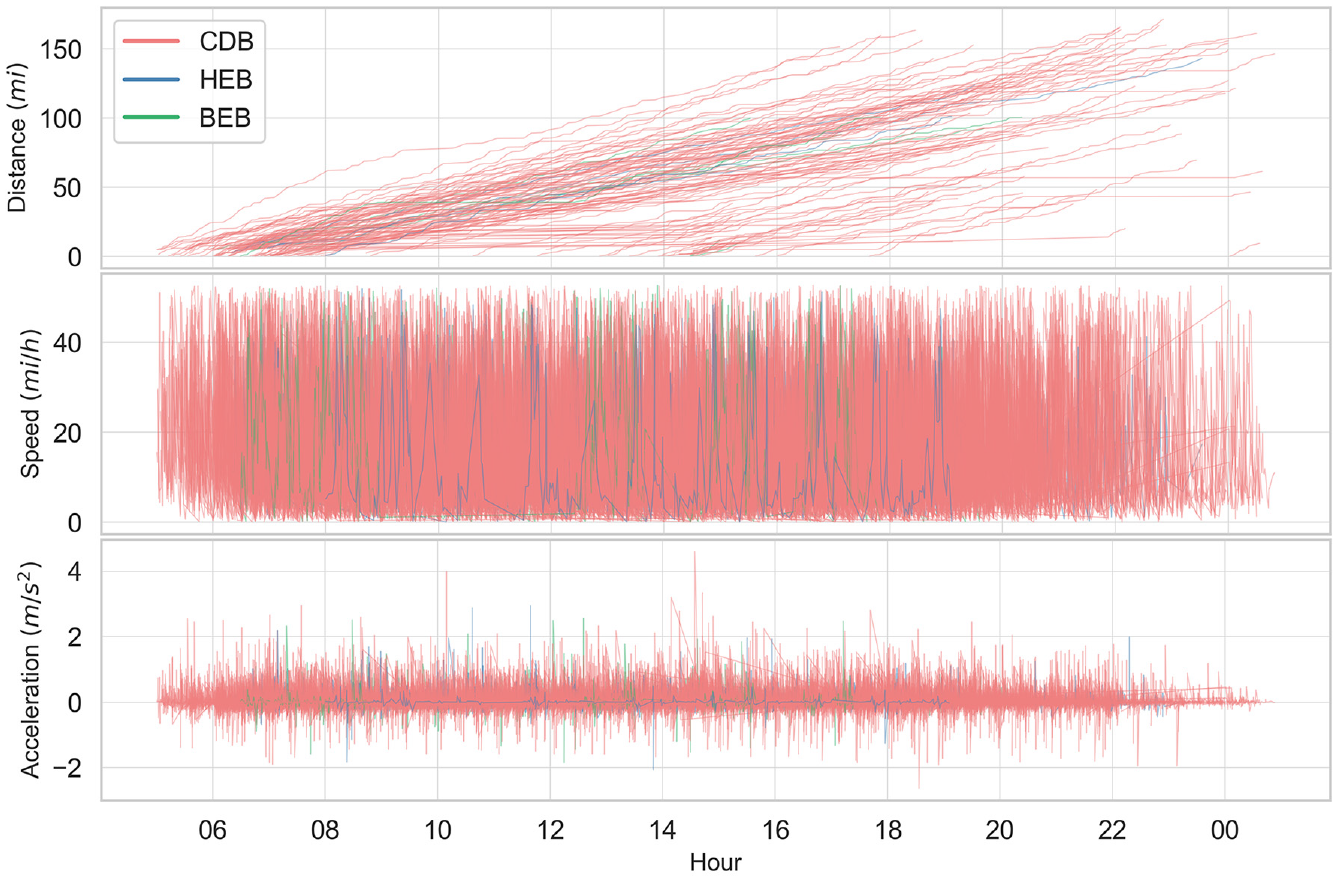
Time series of trajectories (cumulative distance [top], speed [middle], and acceleration [bottom]) for all 178 Pioneer Valley Transit Authority buses in the dataset over a 24 h period (5:00 a.m., April 4, 2022, to 5:00 a.m., April 5, 2022.
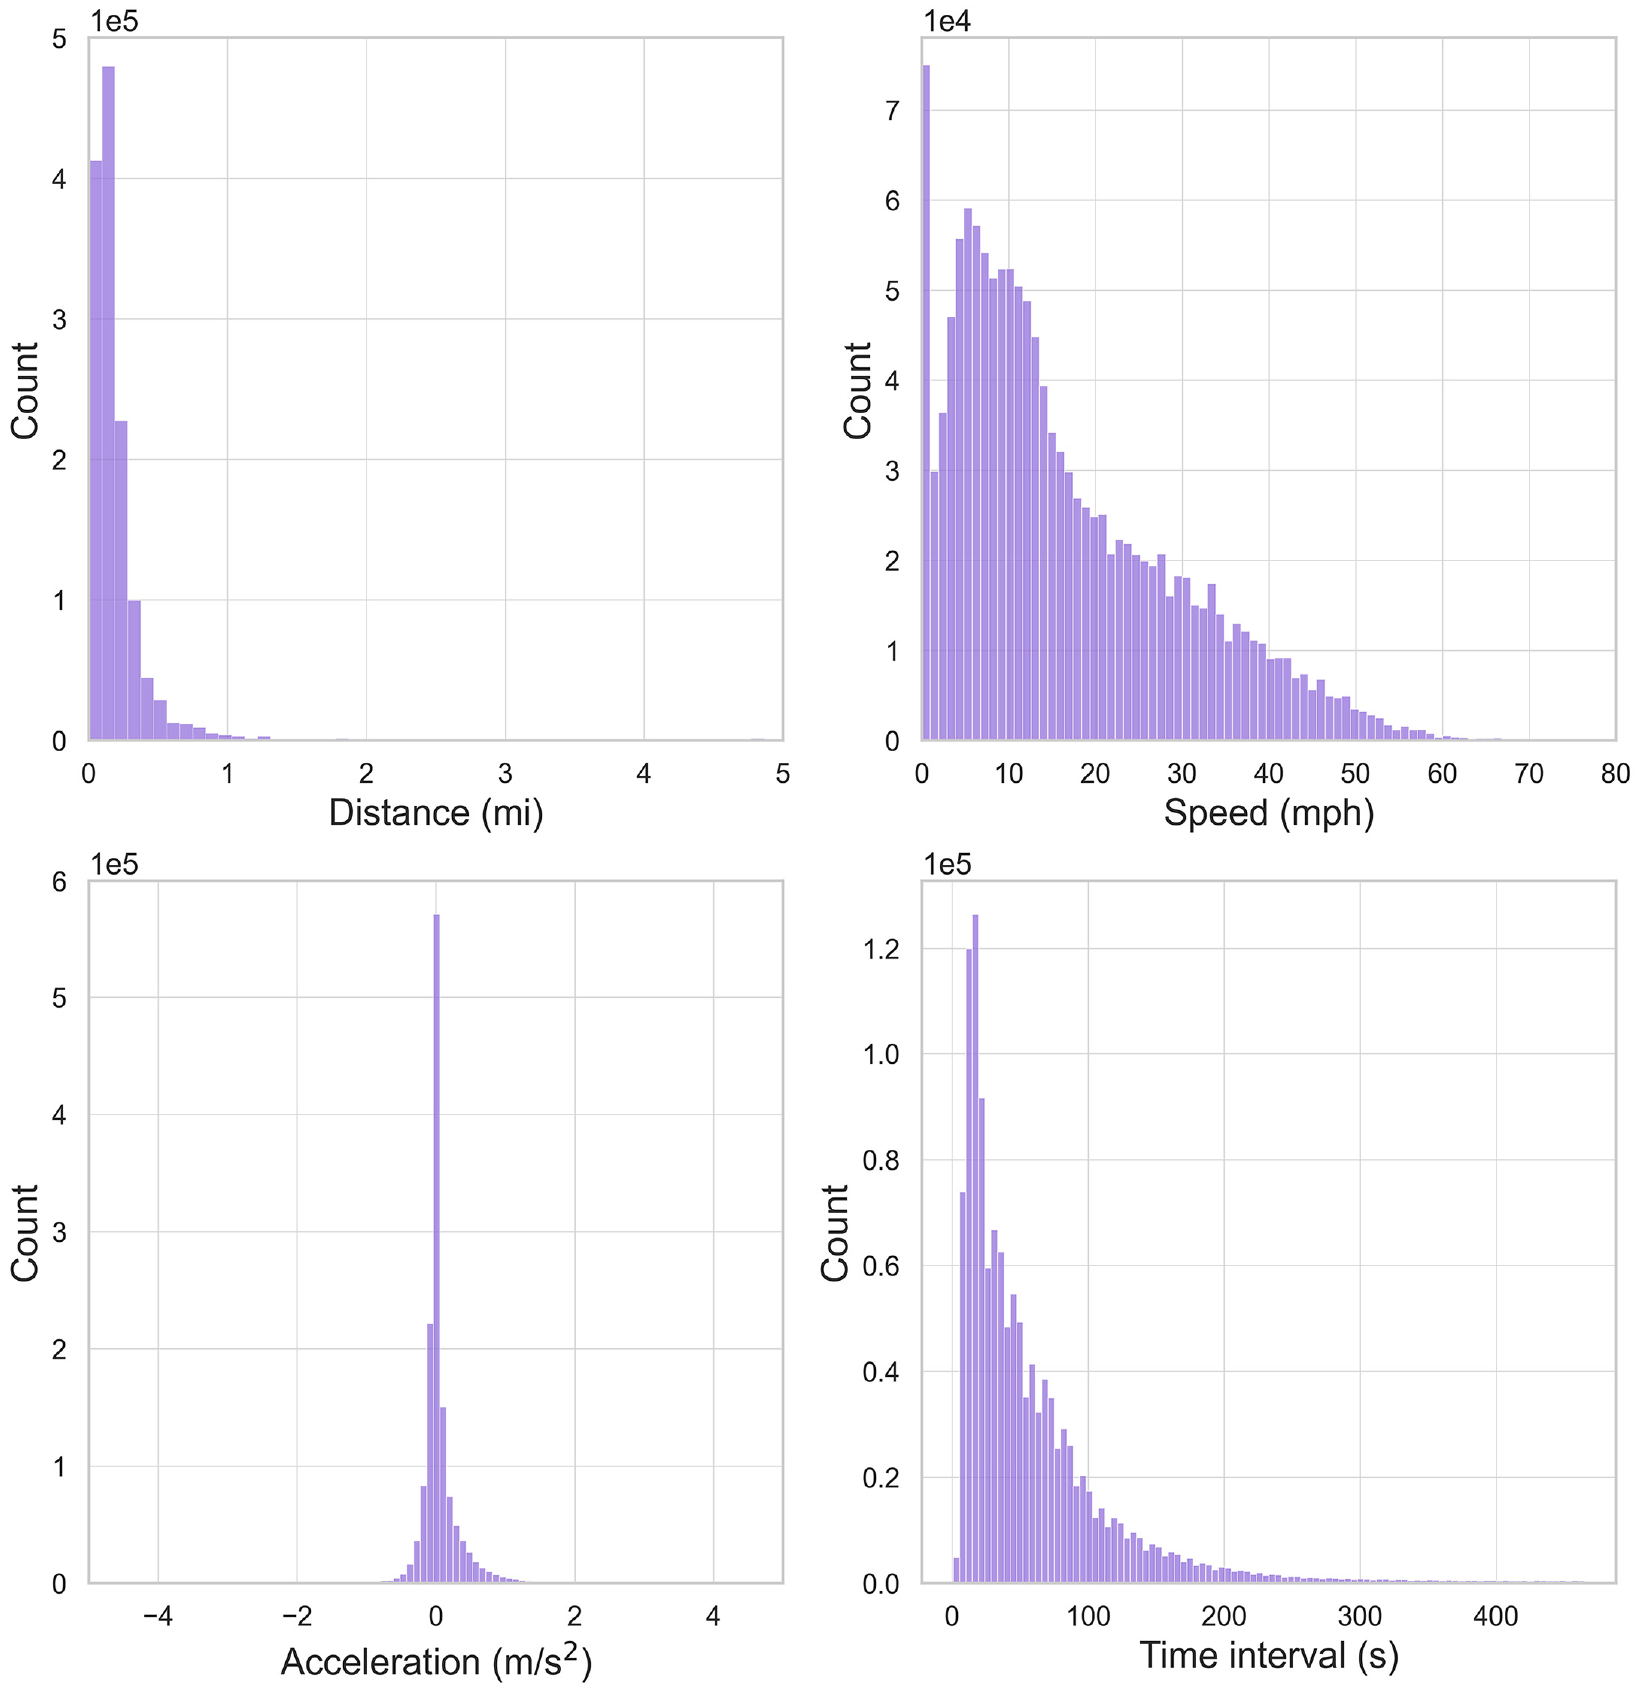
Histogram of trajectories: distance (top left), speed (top right), acceleration (bottom left), and time intervals (bottom right) in April, 2022. These histograms are trimmed for better clarity, with 3% of their data points removed.
Summary Statistics of Trajectories
Energy Models
We adapted existing powertrain-specific physical energy models for CDB, HEB, and electric vehicles, which we modified for BEB ( 18 , 22 ). Engine-specific parameters are shown in Table 3. All, except the age, are used in the powertrain models. The parameters common to all the energy models are summarized in Table 4. Model indices are provided in Table 5.
Engine Specifications
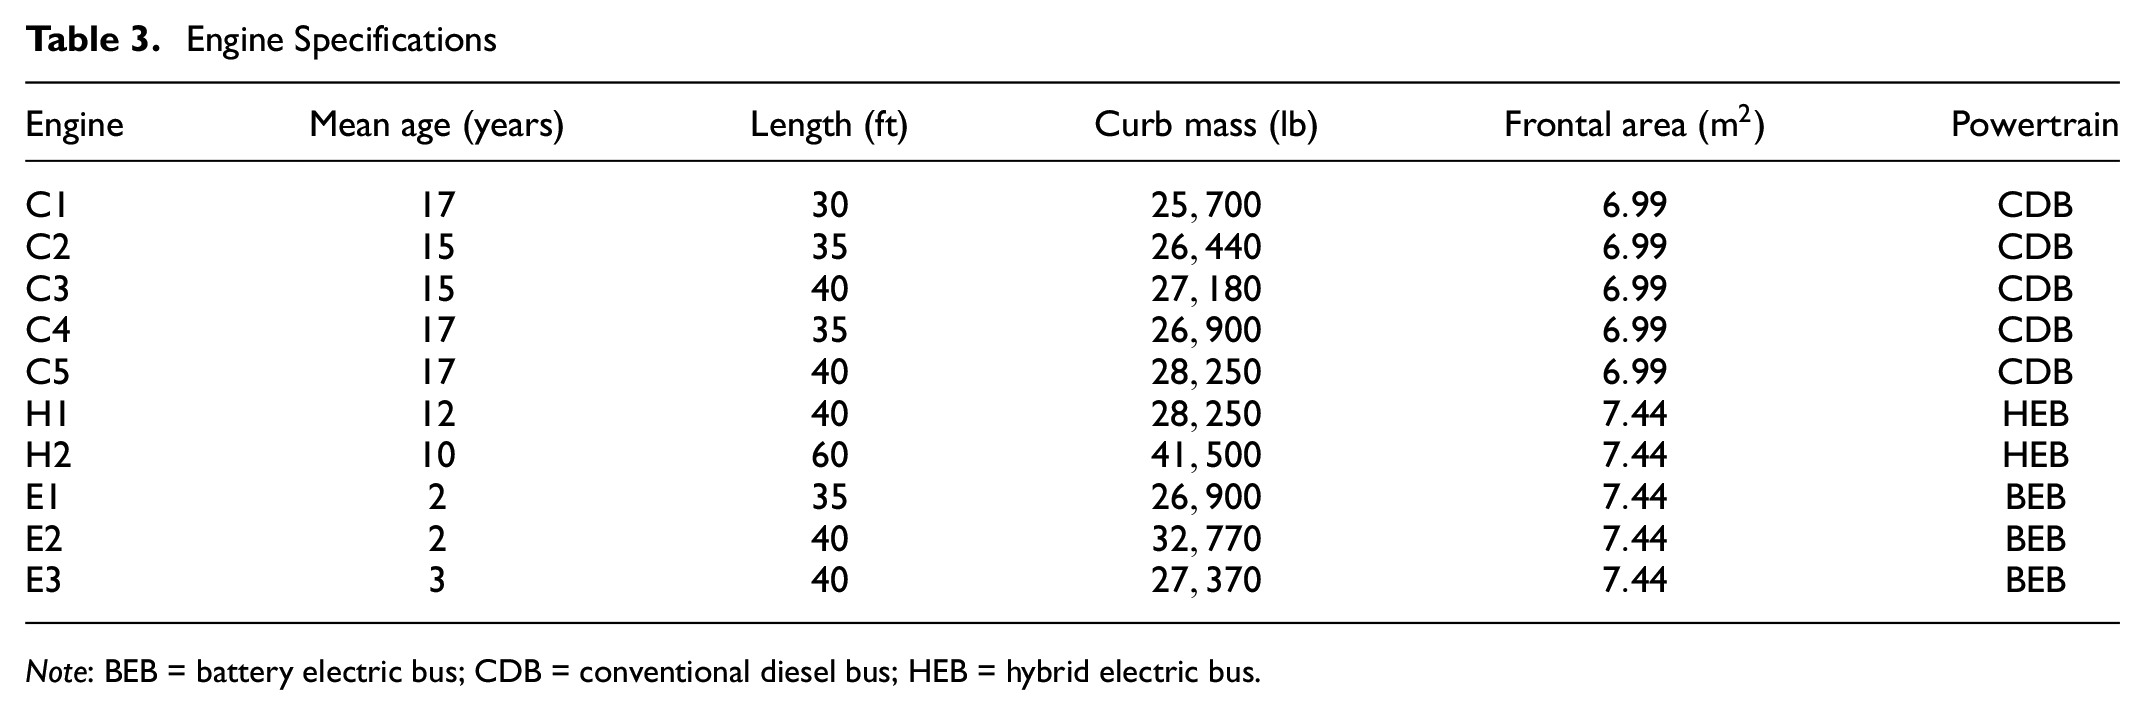
Note: BEB = battery electric bus; CDB = conventional diesel bus; HEB = hybrid electric bus.
Common Parameters for Powertrain Energy Models
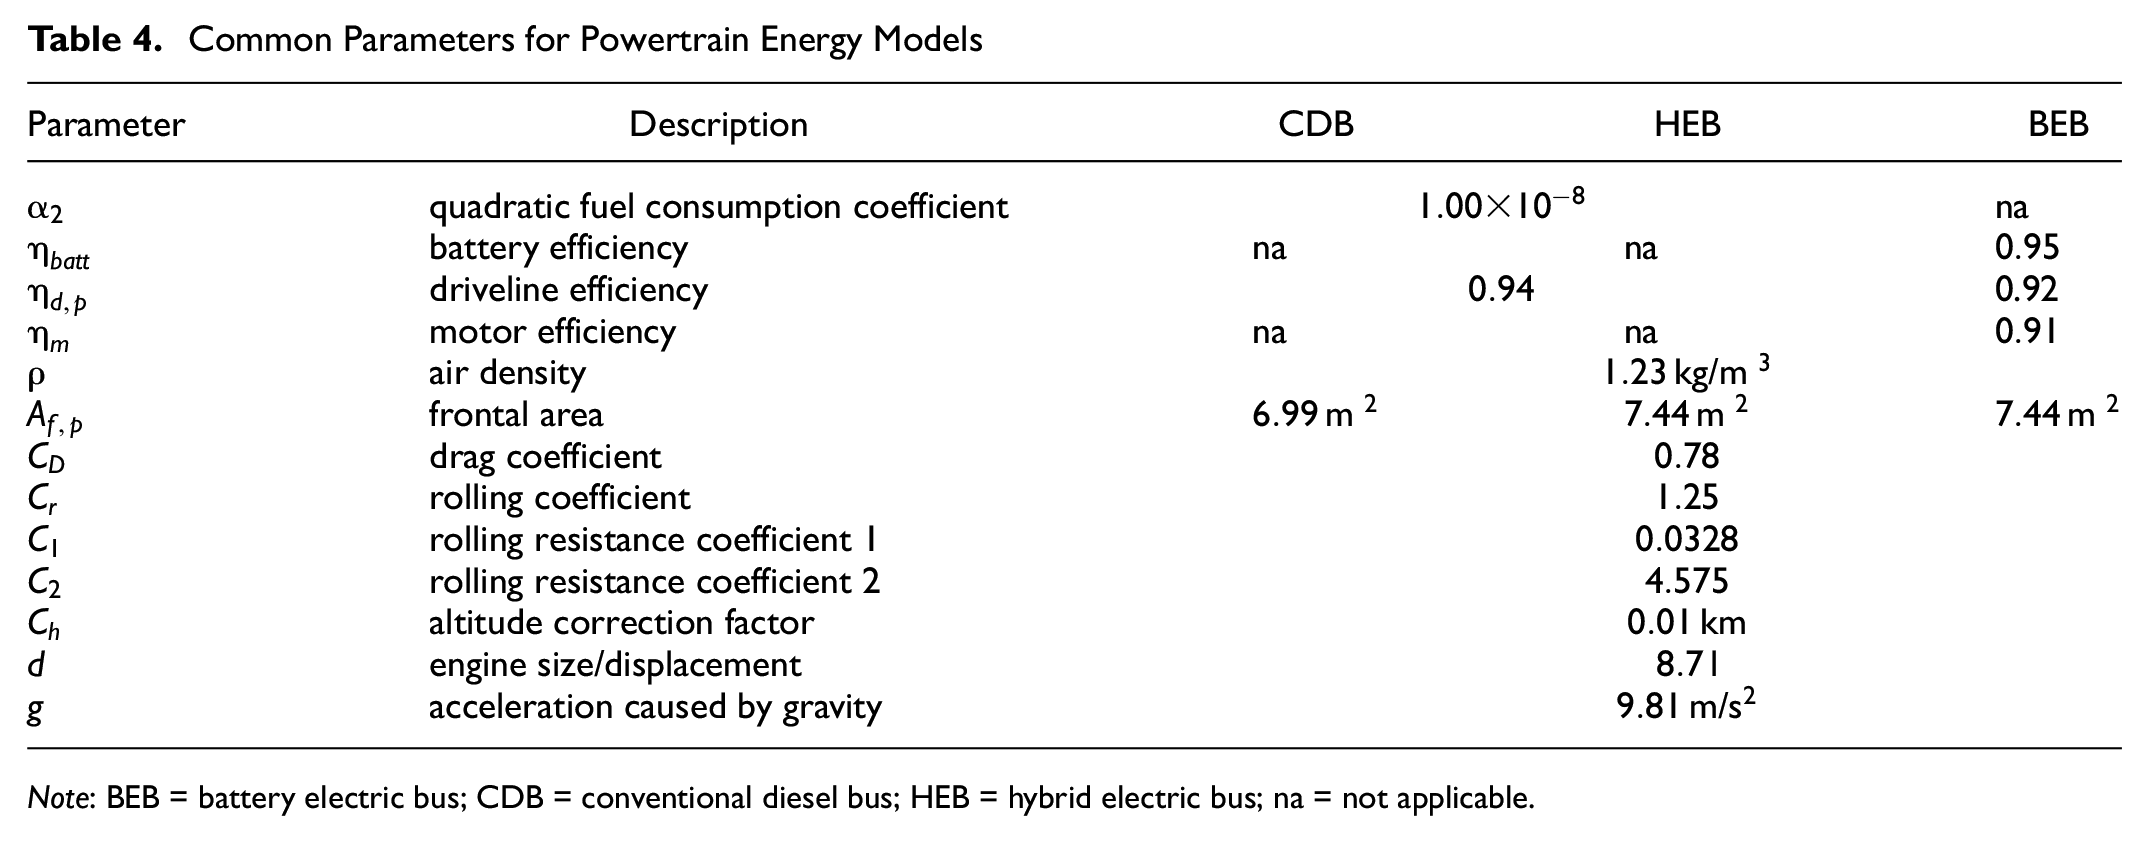
Note: BEB = battery electric bus; CDB = conventional diesel bus; HEB = hybrid electric bus; na = not applicable.
Model Indices and Mappings
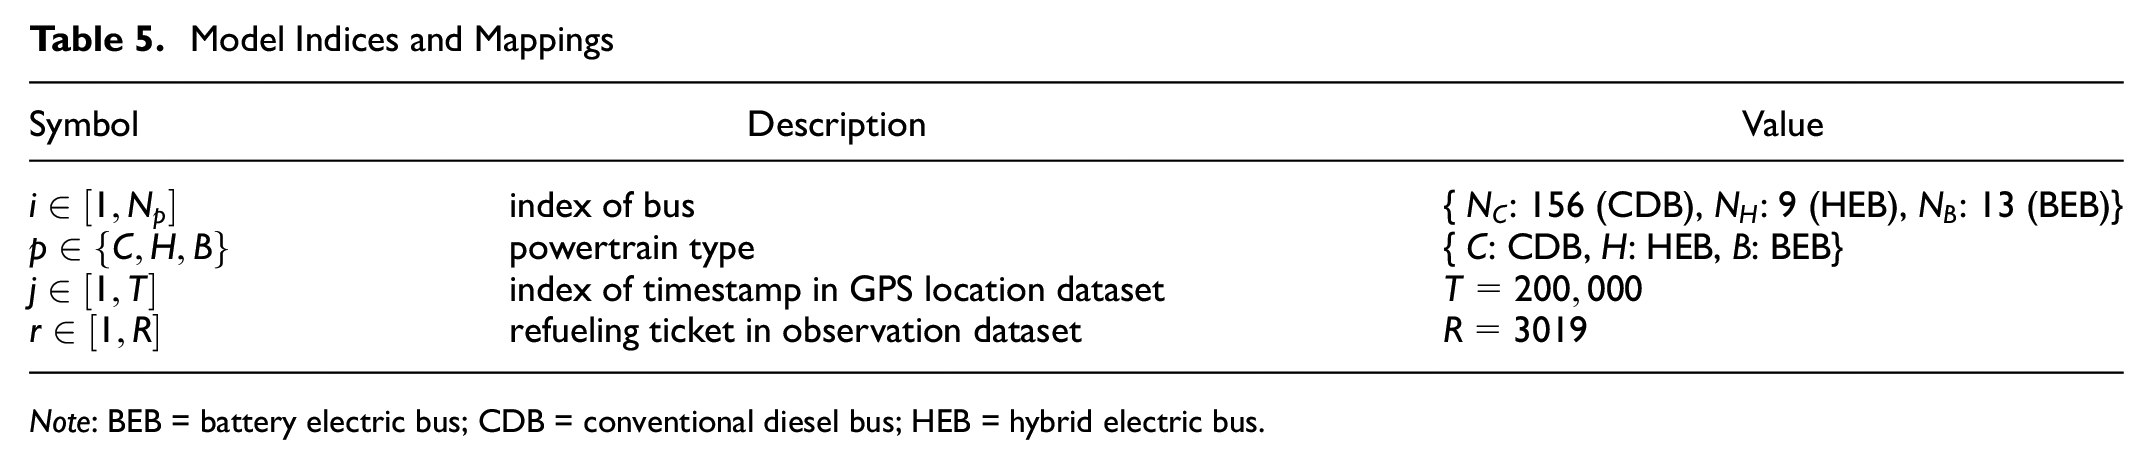
Note: BEB = battery electric bus; CDB = conventional diesel bus; HEB = hybrid electric bus.
The instantaneous tractive power
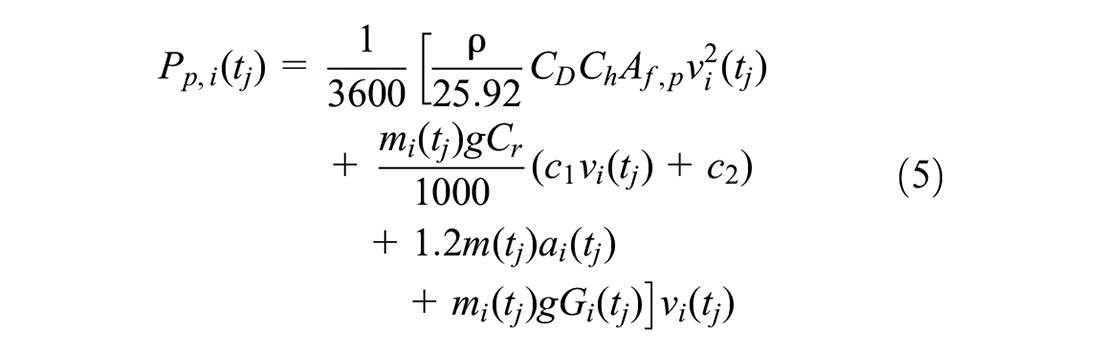
where
Conventional Diesel Bus (CDB) Model
The input power,

where
The fuel consumption rate
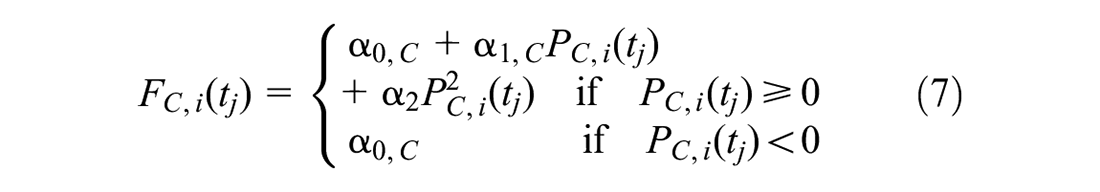
where
the constant
Thus, the diesel consumption in liters

where
Hybrid Electric Bus (HEB) Model
We assume the same energy model formulation for HEB as for CDB. Thus, instead of explicitly modeling the hybrid control unit mechanism, we account implicitly for the improved efficiency by calibrating

Battery Electric Bus (BEB) Model
To calculate the input power from the battery of a BEB, we account for regenerative braking, as well as the efficiencies of the electric motor and the battery (
22
). Thus, the power consumed,

where
The regenerative braking efficiency is specified by:

where
Then, energy (kWh) consumed at timestamp

Calibration Procedure
We selected five parameters for calibration. These are shown in Table 6:
Calibrated Parameters
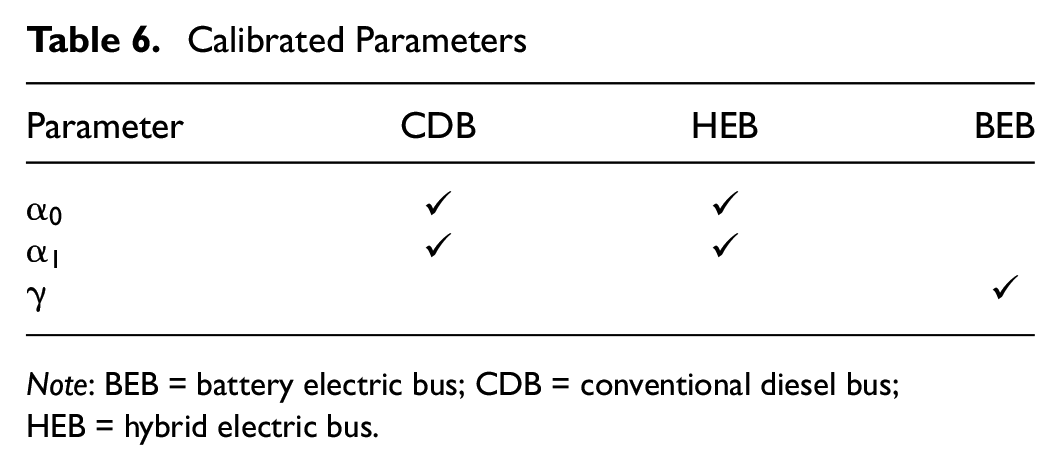
Note: BEB = battery electric bus; CDB = conventional diesel bus; HEB = hybrid electric bus.
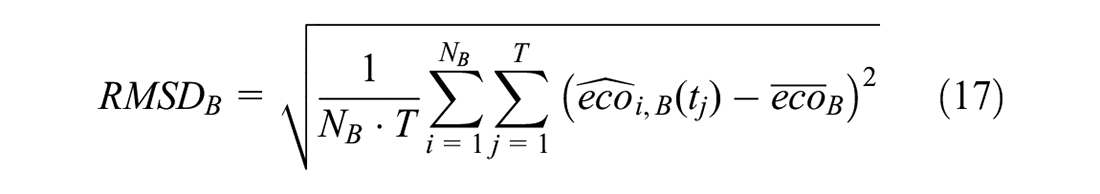
Since the unit of observation for energy consumption was the duration of the refueling interval, we specify the energy consumed therein—vehicle refueling interval energy,

where
To calibrate the powertrain-specific parameters
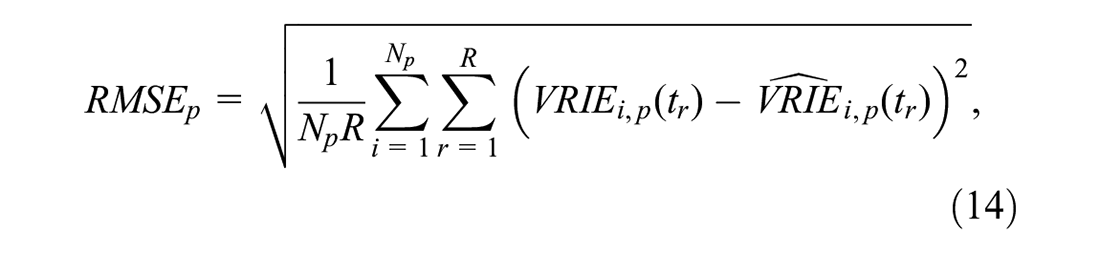
where
Thus, the minimization problem is as follows:

where
To minimize
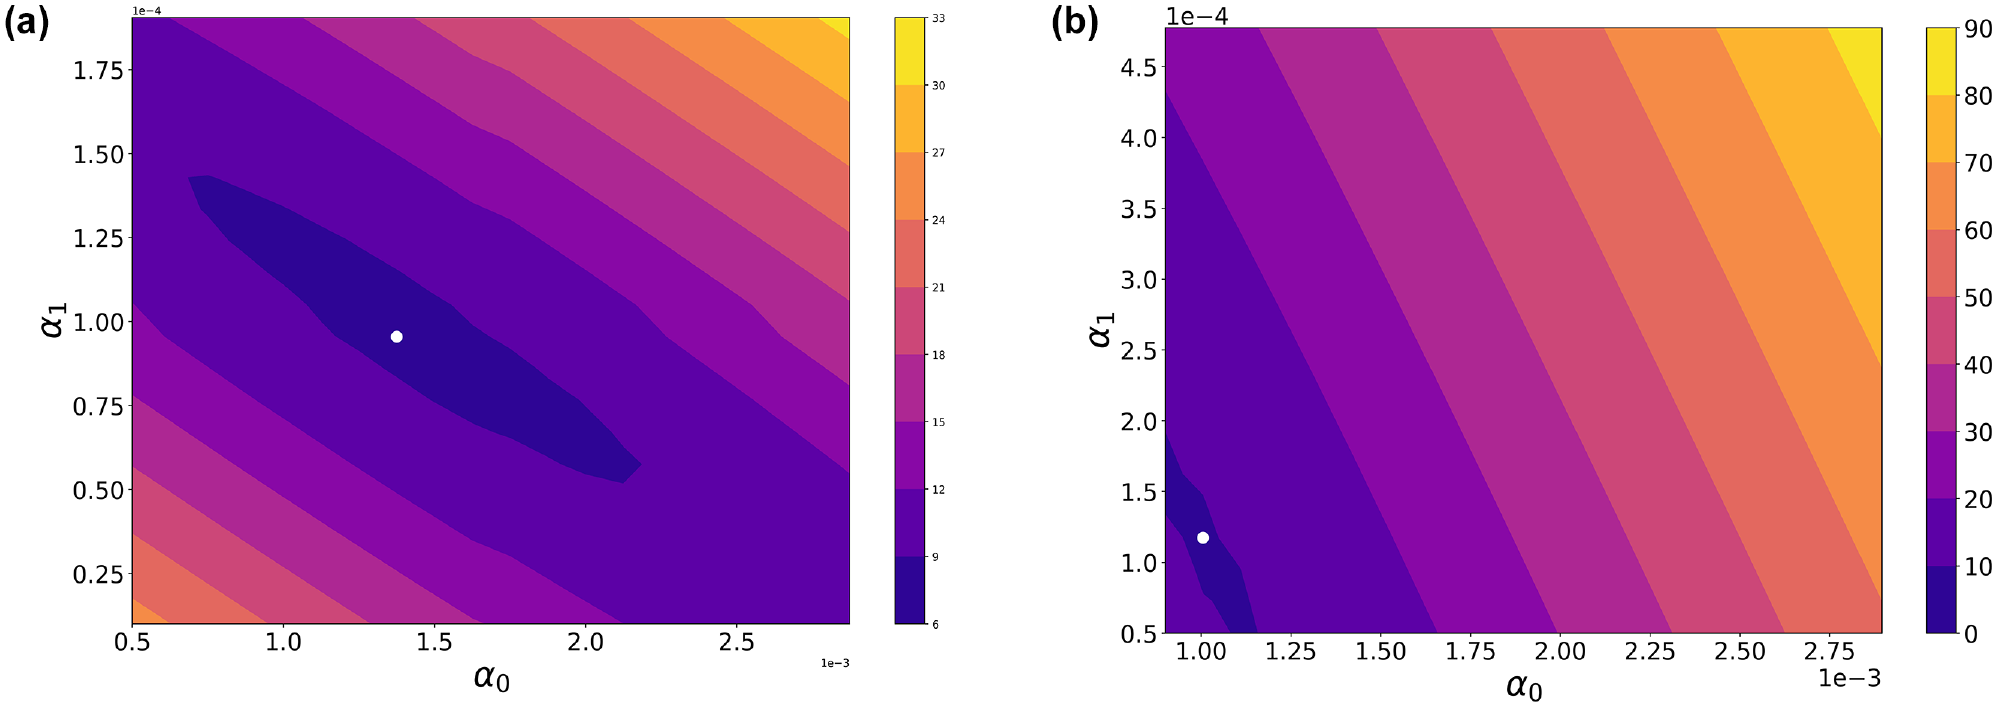
The conventional diesel bus (CDB) model energy root mean squared error (gal) resulting from calibration of
Energy consumption data for BEB were unavailable for April, 2022. Thus, we fitted our model a mean BEB energy economy

Finally, we obtain the optimal
Thus, we conducted a search for

The objective trajectory is shown in Figure 8.
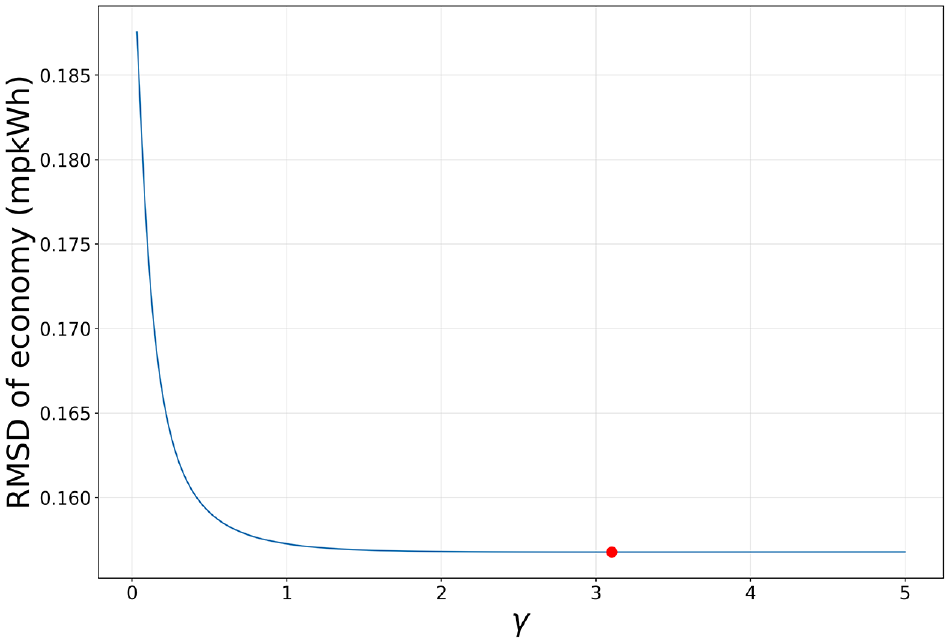
The battery electric bus model economy root mean squared deviation (RMSD) (mpkWh) resulting from calibration of the regenerative decay parameter
Results and Discussion
Model Performance
The optimal parameter values resulting from the model calibration are shown in Table 7. We then computed the final performance of the models using 23% of the VRIE observations at vehicle level. The test RMSE is 8.19 gal for CDB, 8.01 gal for HEB, and 0.12 mpkWh for BEB (Table 8). To further assess performance, we calculated mean absolute percentage error (MAPE) for each powertrain-specific model (Table 9). At the vehicle level, the test MAPE is 28% for CDB, 26% for HEB, and 18% for BEB. Average fuel economies for CDB and HEB were computed as 5.35 MPG and 6.44 MPG, respectively (which are close to 4.82 MPG and 5.84 MPG from the literature). Despite the CDB and HEB MAPEs being relatively high when computed at the vehicle level, these models exhibited better performance when evaluated on an aggregated weekly system-level basis. In this case, the test MAPE is 5% for CDB, and 2% for HEB. We were unable to compute system-level MAPE values for BEB, as charging data were unavailable.
Calibrated Parameters
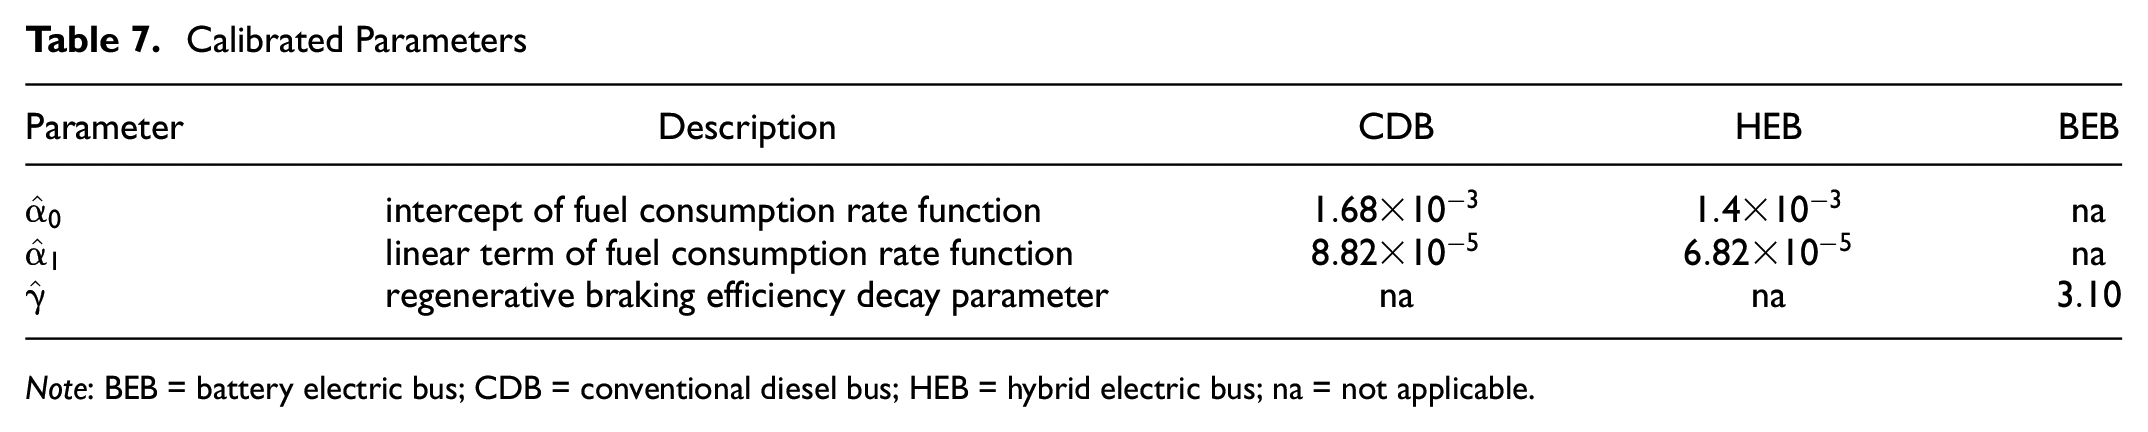
Note: BEB = battery electric bus; CDB = conventional diesel bus; HEB = hybrid electric bus; na = not applicable.
Model Training and Test Performance Metric (RMSE) at Vehicle Level (Based on Vehicle Refueling Interval Energy)
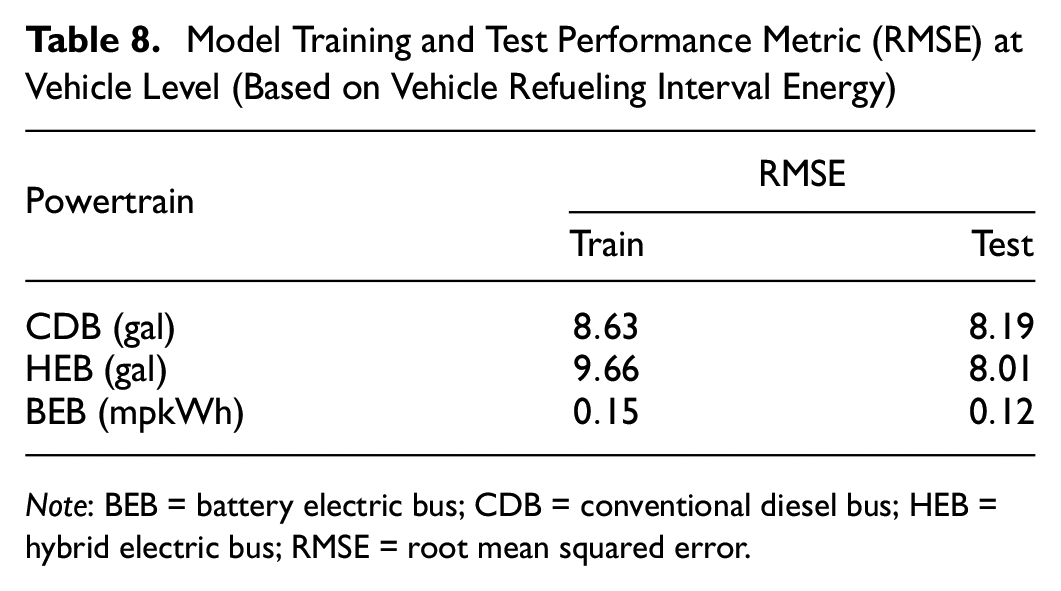
Note: BEB = battery electric bus; CDB = conventional diesel bus; HEB = hybrid electric bus; RMSE = root mean squared error.
Model Training and Test Performance Metric (MAPE) at Vehicle Level (Based on Vehicle Refueling Interval Energy) and System Level (Weekly Aggregated)
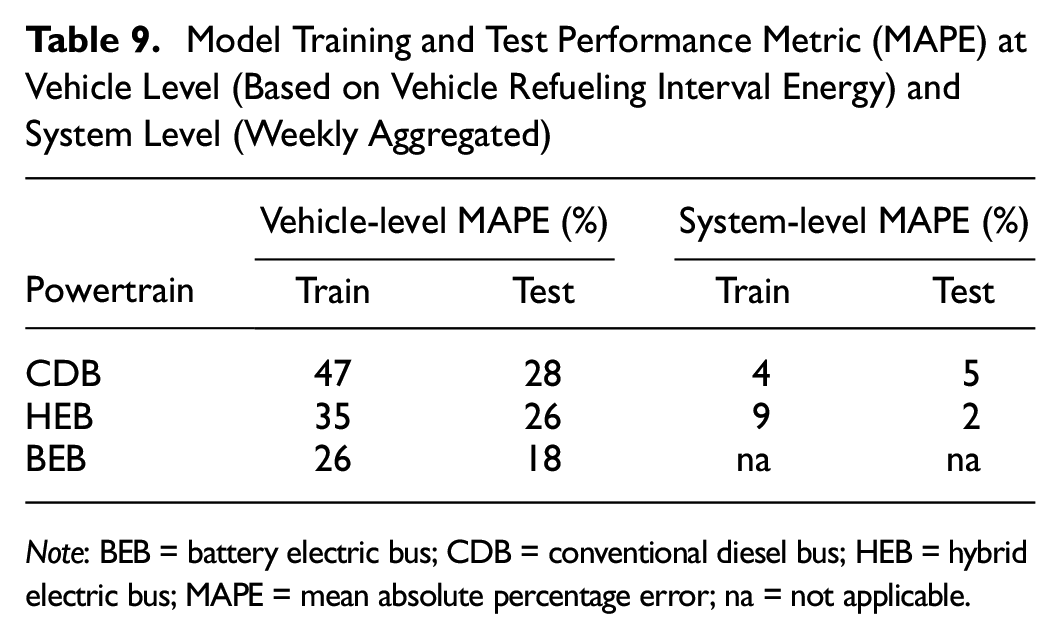
Note: BEB = battery electric bus; CDB = conventional diesel bus; HEB = hybrid electric bus; MAPE = mean absolute percentage error; na = not applicable.
In Figure 9, the model predictions of VRIE (gal) are plotted against the observed values for CDB and HEB. It is evident that both the CDB and HEB models perform well in estimating energy. The HEB model is slightly inferior because of the relatively small size of the HEB fleet operating on the PVTA network. (HEB on the PVTA network comprise only 5% of the total fleet, while CDB comprise 88%). This limited size of the HEB fleet restricts the ability to calibrate the HEB model parameters for better performance.
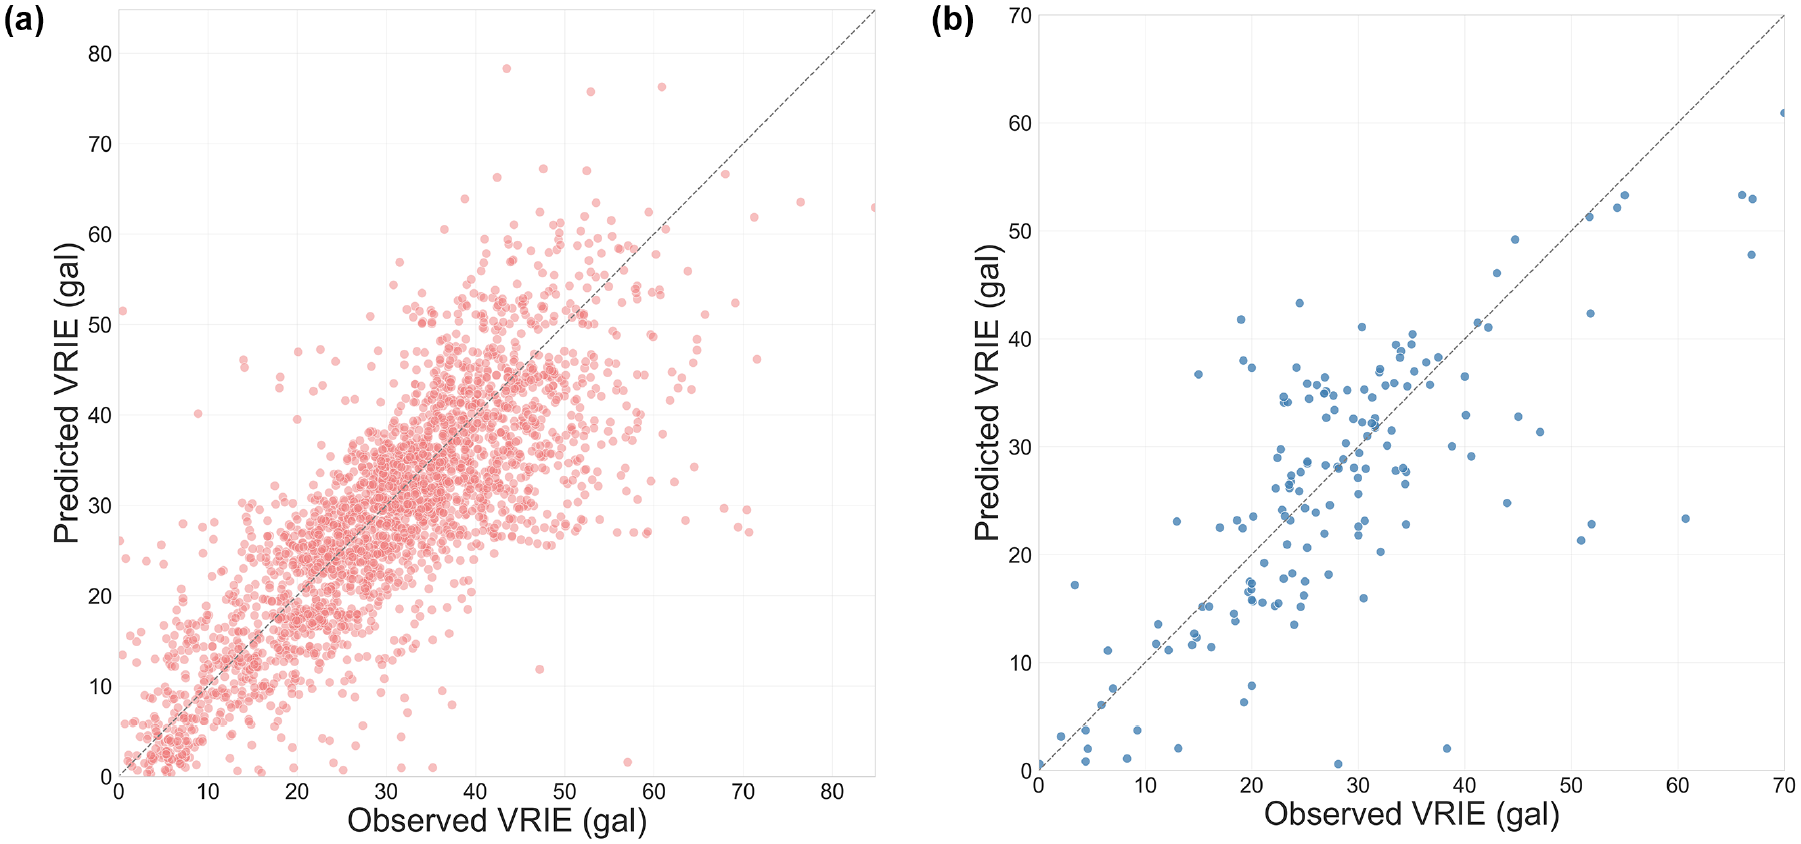
Predicted versus observed vehicle refueling interval energy (VRIE) (gal) for: (a) CDB and (b) HEB.
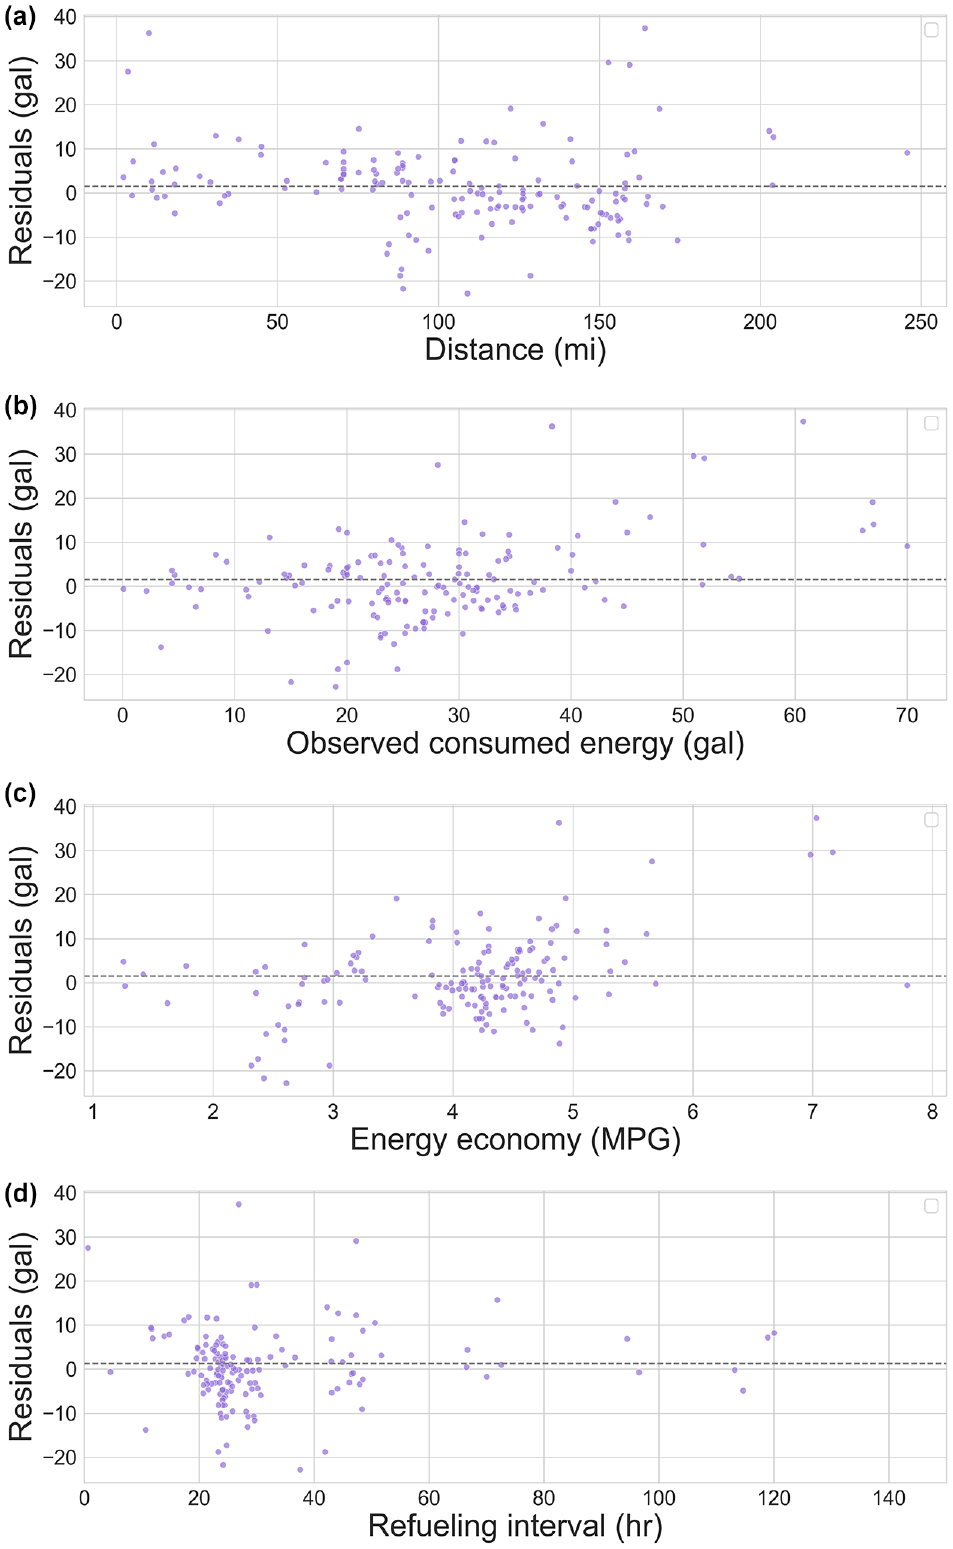
We analyzed the residuals to evaluate the fitted models (Figures 10 and 11). When plotted against distance, the residuals display a largely homoskedastic pattern with constant variance. However, when the residuals are plotted against energy and fuel economy, there appears to be a slightly positive correlation. This behavior indicates a systematic error, as there is a linear dependency the current models fail to capture. This discrepancy is further highlighted when we consider the residuals versus refueling interval plots (Figures 10d and 11d). We observe that the absolute value of the residuals decreases with the refueling interval. This pattern may also point to the presence of a measurement error in the distances, as the timestamped locations do not include bus movements to and from depots. Thus, the impact of this error reduces as the refueling interval gets larger. We plan to further investigate and address these errors in future work.
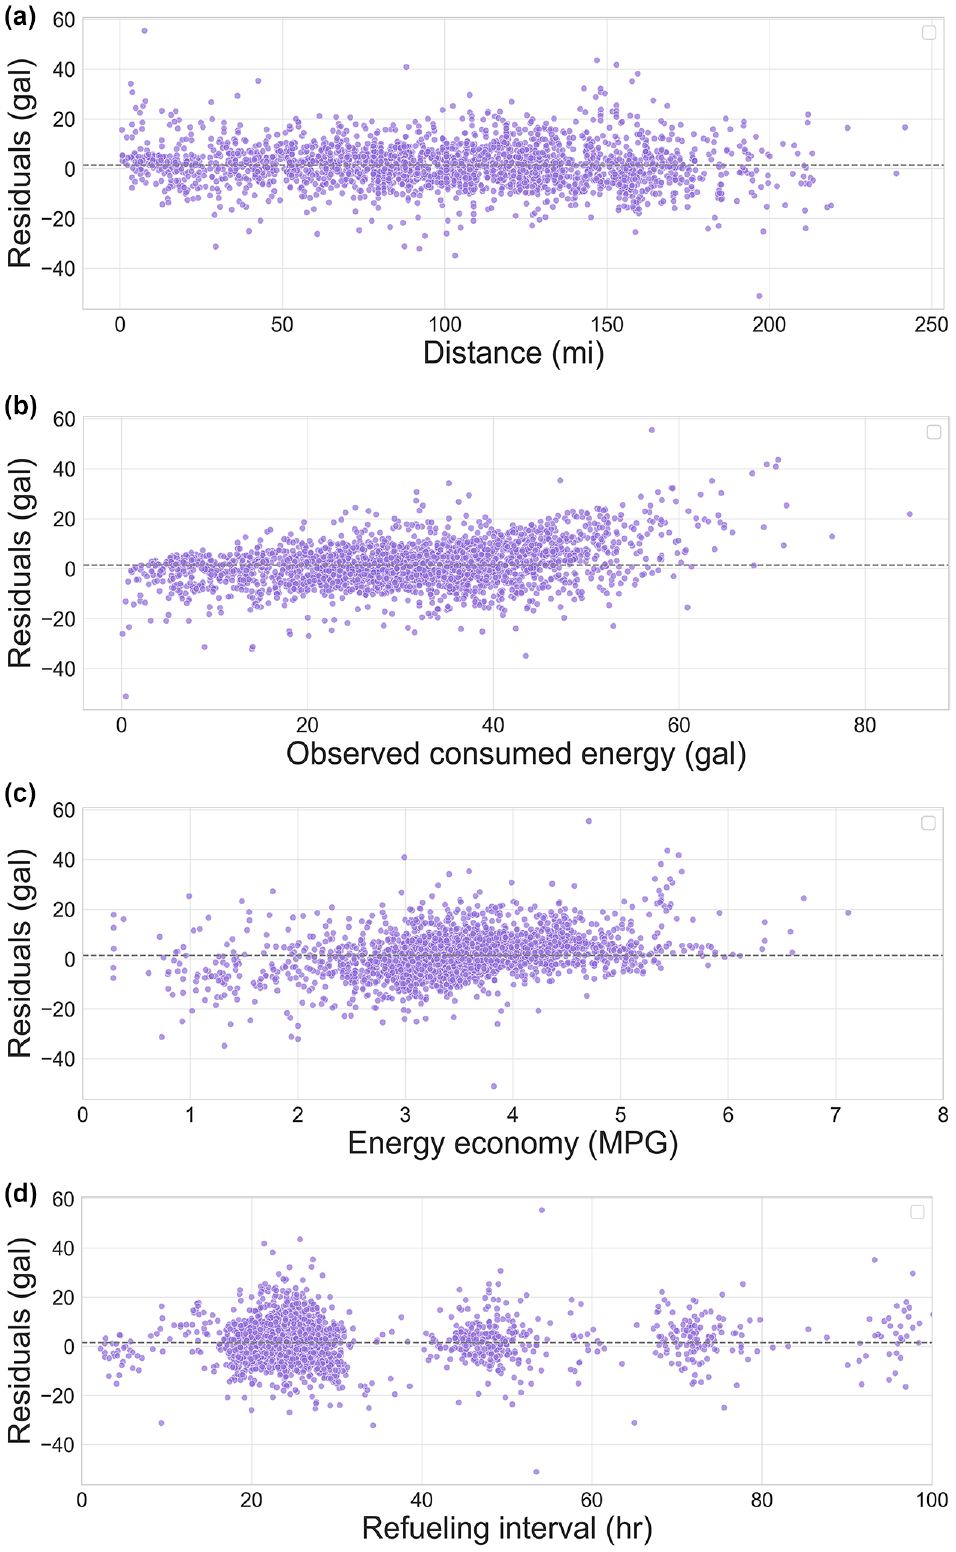
Vehicle refueling interval energy residuals (gal) versus: (a) distance (mi), (b) observed energy (gal), (c) fuel economy (MPG), and (d) refueling interval (h) for conventional diesel bus.
Vehicle refueling interval energy residuals (gal) versus: (a) distance (mi), (b) observed energy (gal), (c) fuel economy, and (d) refueling interval (h) for hybrid electric bus.
Model predictions aggregated at the weekly level for CDB and HEB are compared with approximate weekly observations (Figure 12). The observed values are approximate given the irregularity of the refueling intervals and their variability by vehicle, which results in only a partial observation of the number of gallons consumed in a given day. We show the mean energy economy from the BEB model (0.36 mpKWh) compared with that obtained from the literature (Figure 13).
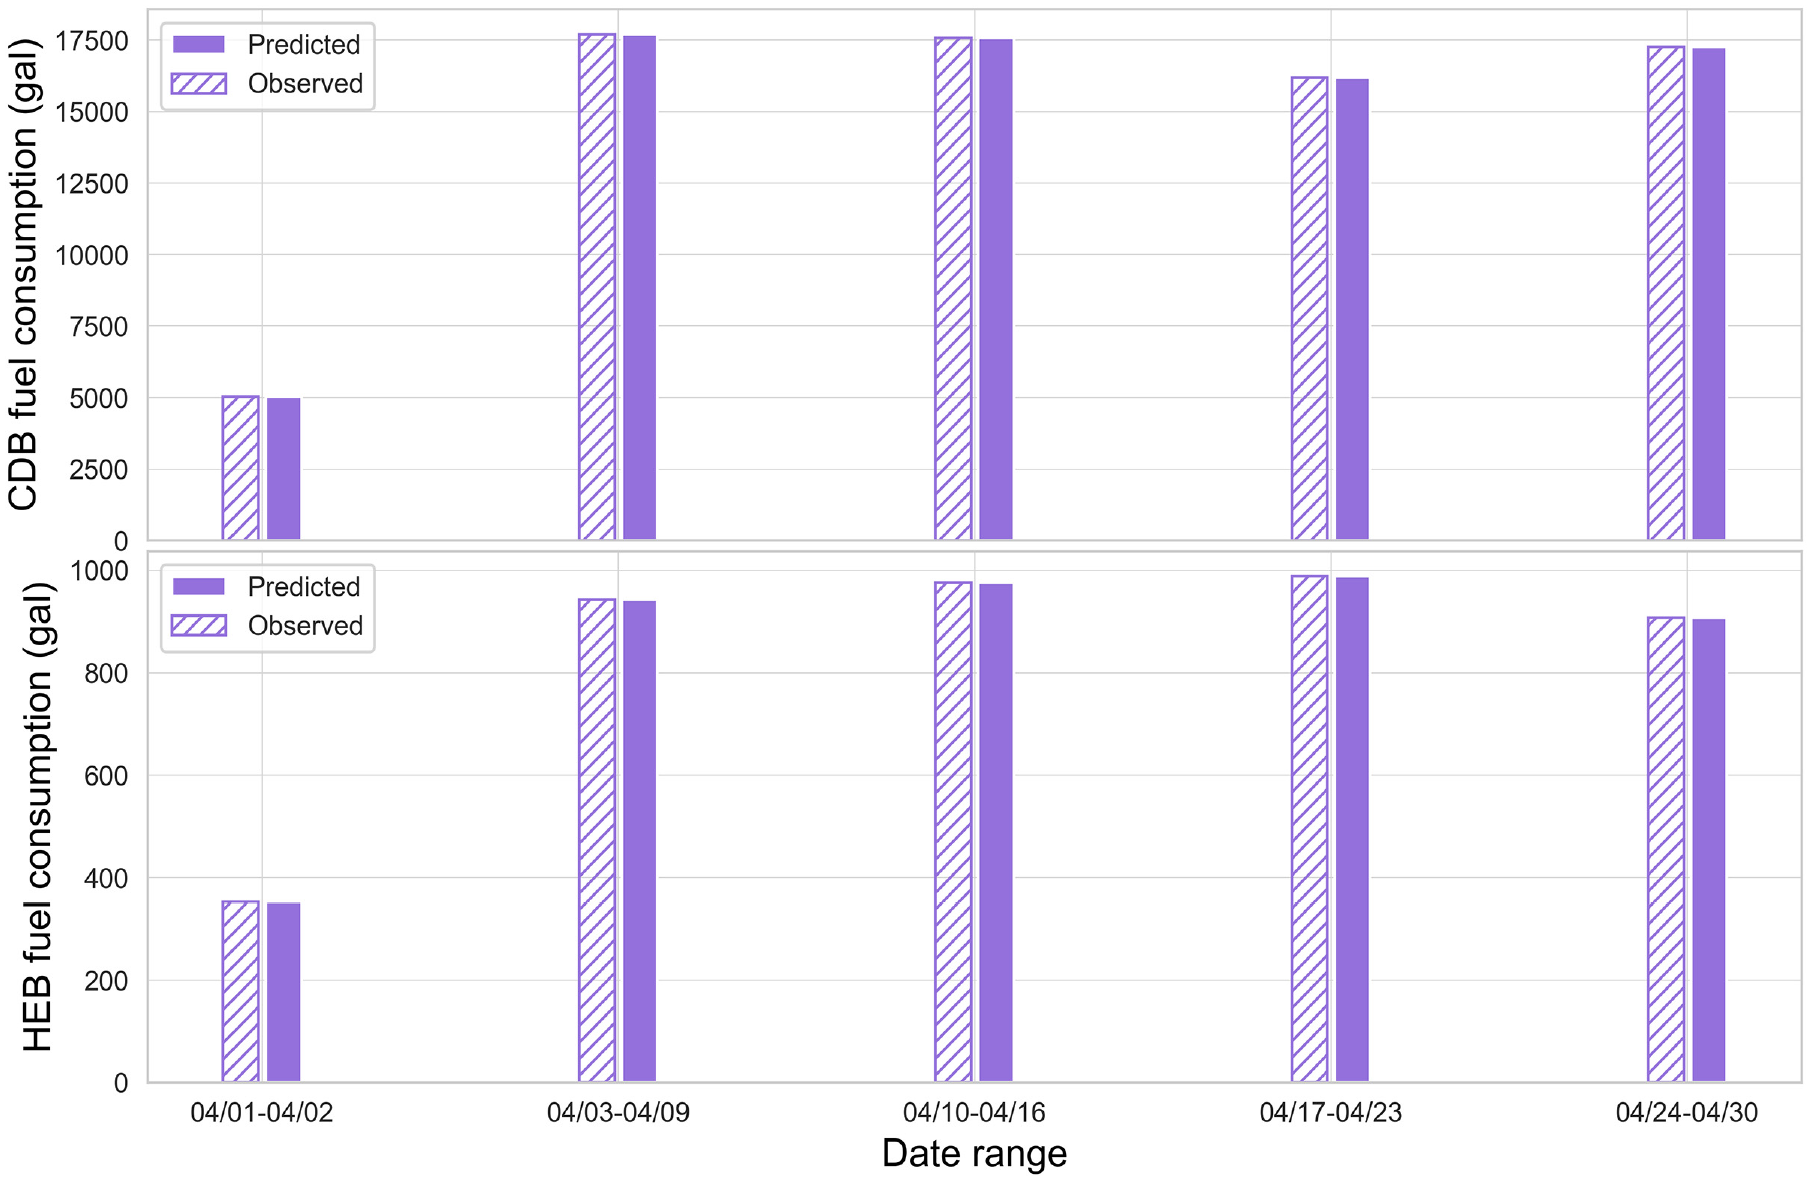
Weekly time series of system-wide energy consumption (gal) for conventional diesel bus (CDB) (top) and hybrid electric bus (HEB) (bottom) in 2022 (first 23 days: training; last 7 days: test).
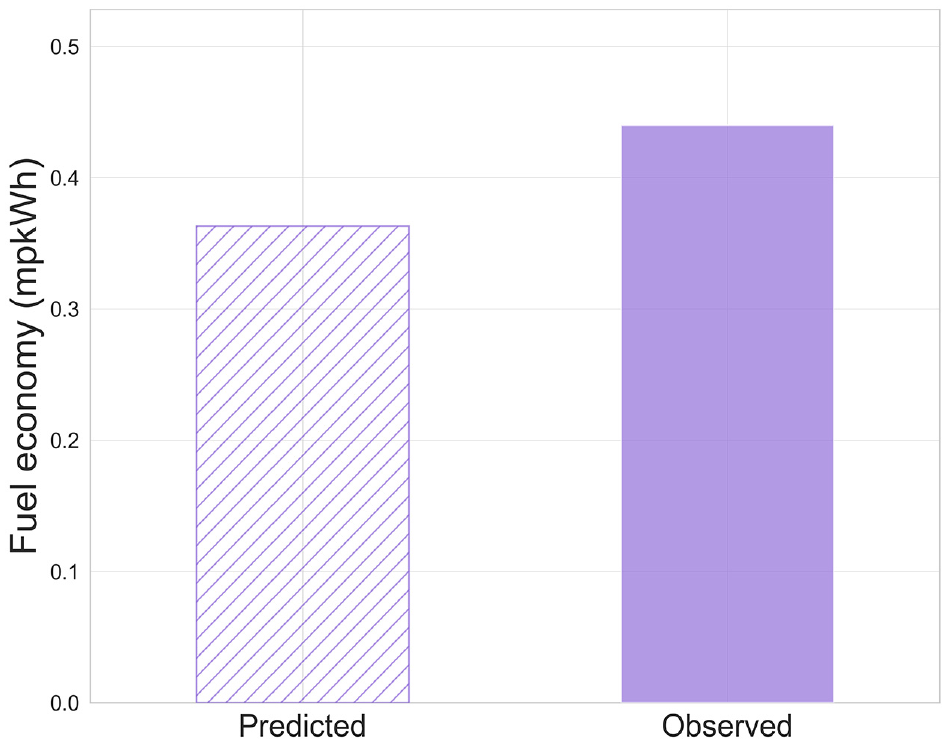
Battery electric bus mean predicted energy economy compared with observed value from the literature.
Hourly Predicted Energy Metrics
We used the calibrated models to predict vehicle energy consumption (gallons for CDB and HEB and kWh for BEB) at each timestamp. We then computed other metrics to investigate system-wide performance for each powertrain type. These metrics are fuel efficiency (MPG for CDB and HEB, and mpkWh for BEB) and energy intensity (gallons per passenger for CDB and HEB, and kWh per passenger for BEB).
In the CDB cases, the period between 2:00 a.m. and 4:00 a.m. has the lowest average per-vehicle energy consumption with a median of 0.57 gal, since the ridership is minimum during this time. However, energy consumption peaks at 2:00 p.m. with a median of 242.24 gal, as ridership is high between 2:00 p.m. and 5:00 p.m. We observe the peak ridership at 4:00 p.m., with a median of 30,637 passengers. Additionally, at 6:00 p.m., vehicles travel a longer distance per gallon (6.02 MPG) possibly because of lower passenger load. Energy consumption is more intense per passenger between 2:00 a.m. and 5:00 a.m. with a median of 0.007 gal per passenger, as ridership is at its minimum during this time period (Figure 14a).
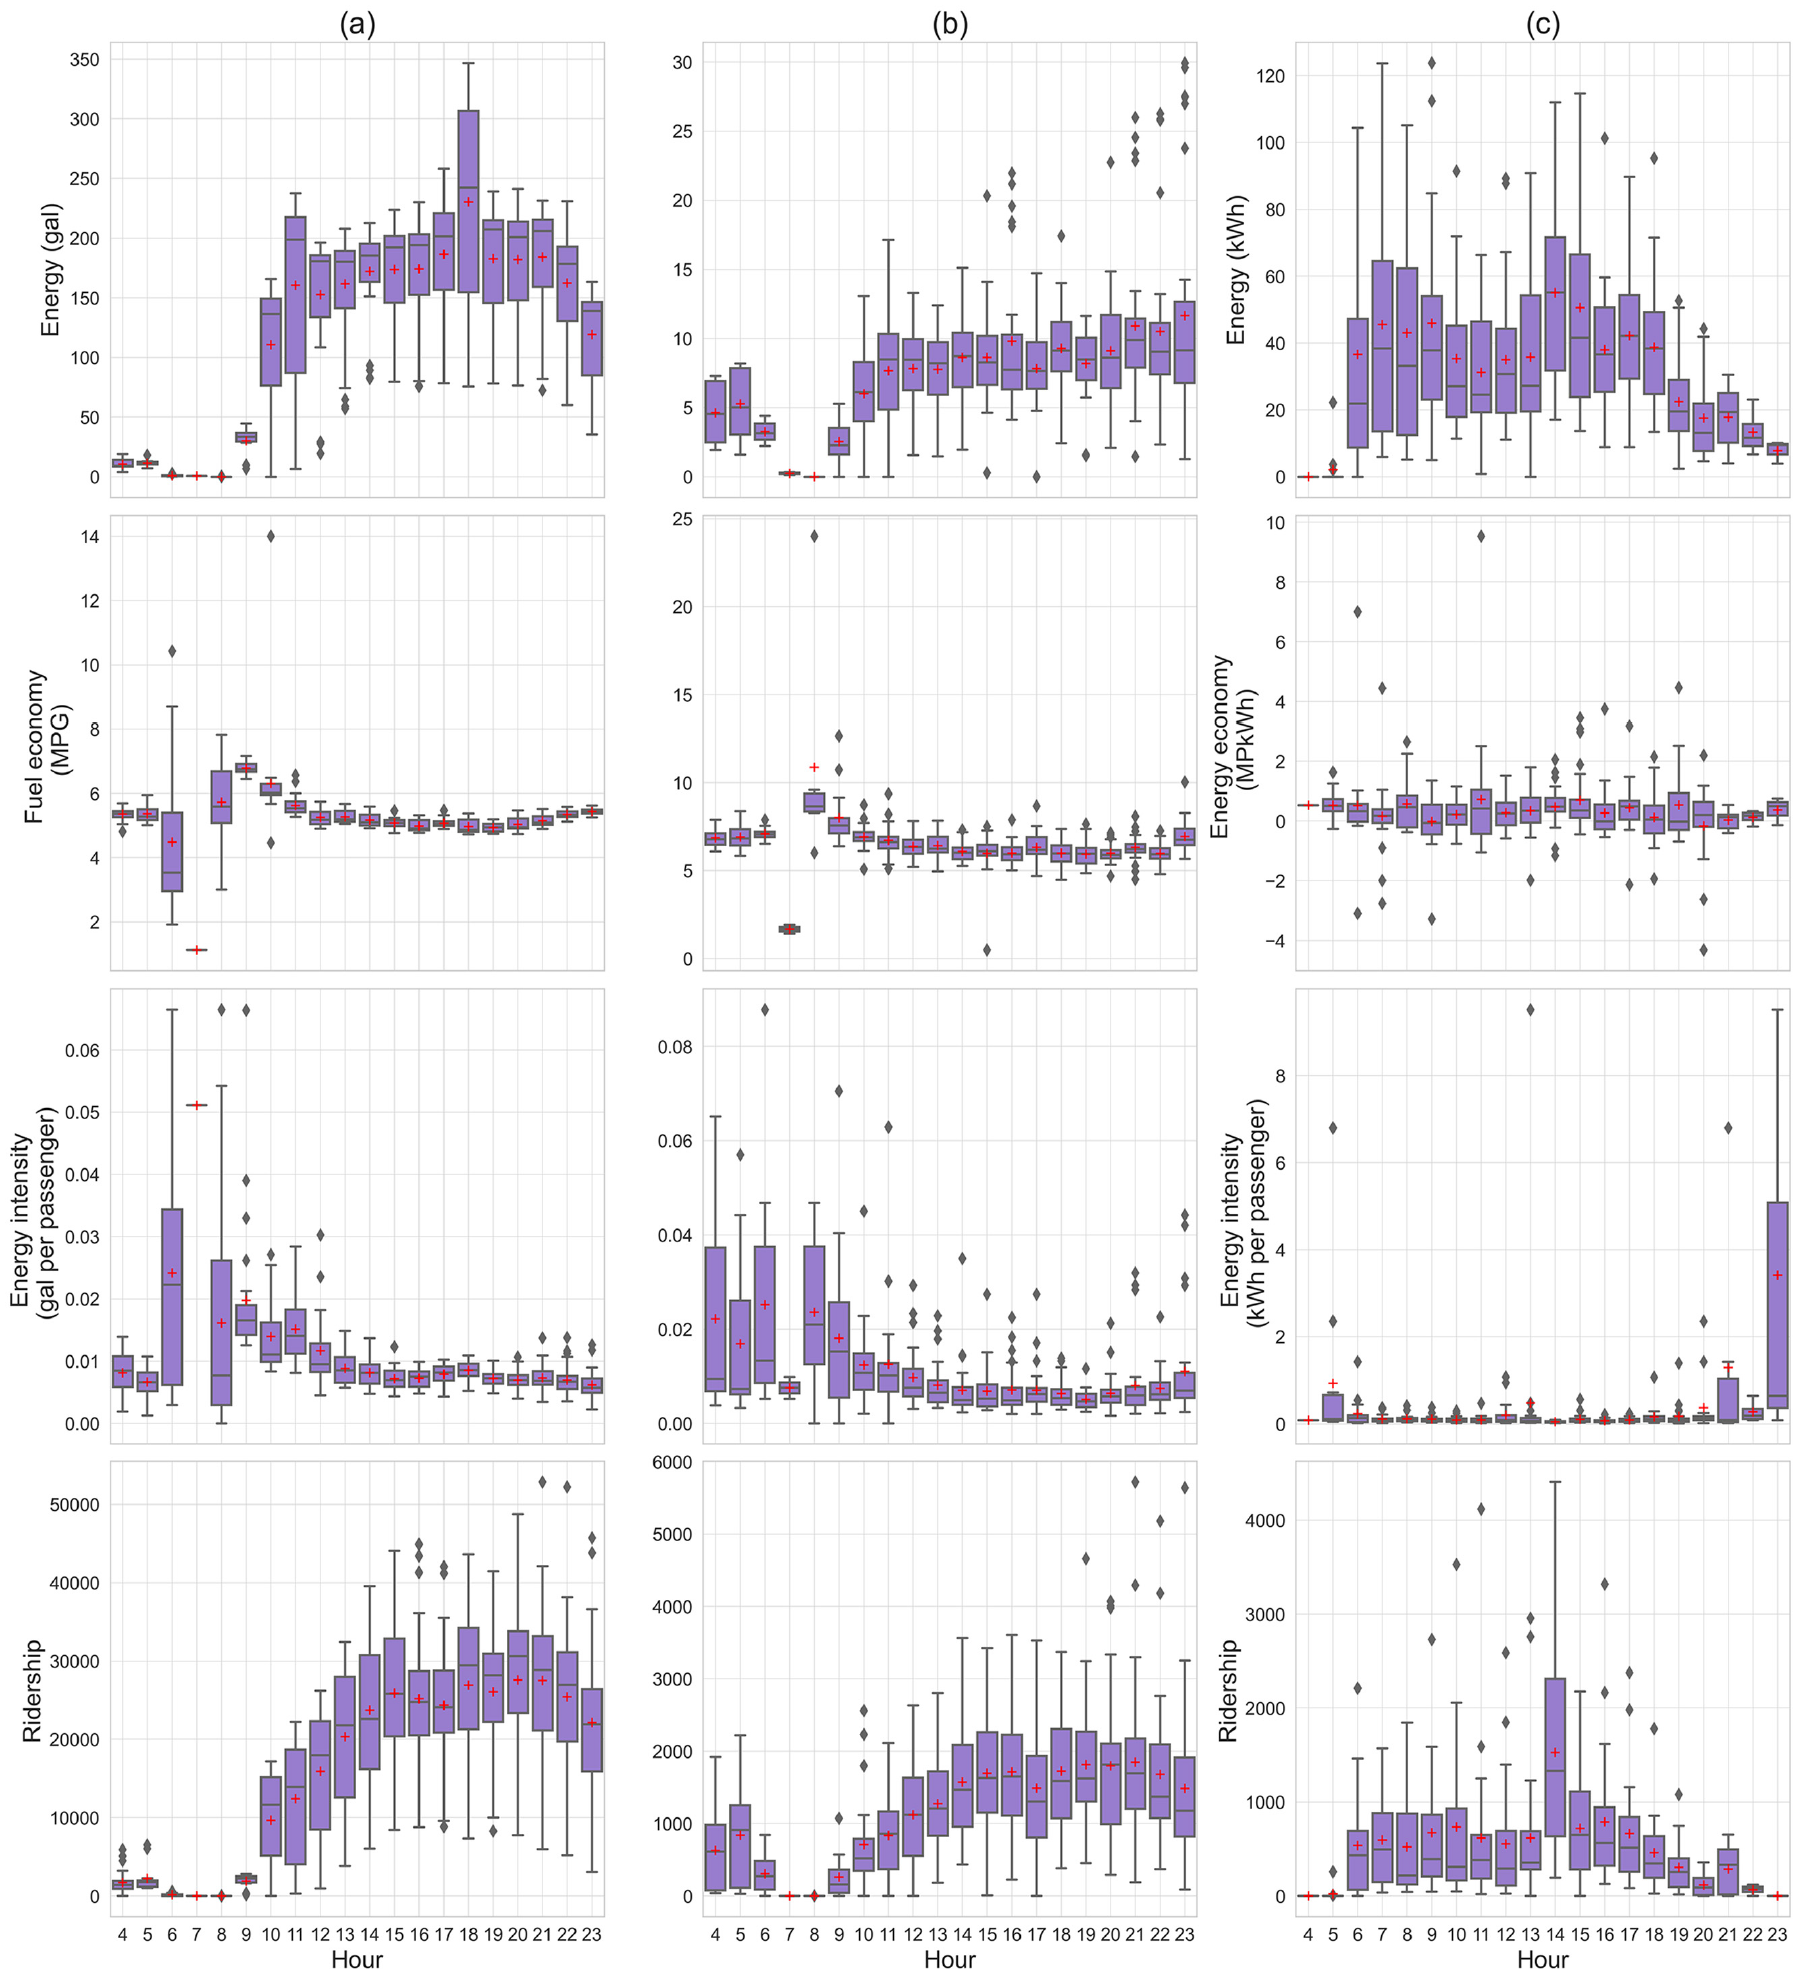
Hourly system-level energy consumption, energy economy, energy intensity, and ridership for: (a) CDB, (b) HEB, and (c) BEB.
For HEB, energy consumption peaks at 7:00 p.m. with a median 9.15 gal, while we observe almost no energy consumed at 4:00 a.m. The highest fuel economy occurs at 4:00 a.m., with a median of 8.64 MPG, and the most intense energy consumption is at 1:00 a.m. with a median of 0.007 gal per passenger, when there are a few passengers onboard. Ridership is at its peak at 4:00 p.m., with a median of 1,812 passengers (Figure 14b).
Energy consumption peaks at 2:00 p.m. for BEB. We observe the highest energy economy (0.73 mpkWh) at 11:00 a.m. and energy intensity (3.41 kWh per passenger) at 11:00 p.m. Ridership peaks at 2:00 p.m. with a median of 1,333 passengers (Figure 14c). Summary statistics for all three powertrain-specific models are provided in Tables 10 and 11.
Summary Statistics of Hourly Energy Prediction Metrics for CDB and HEB
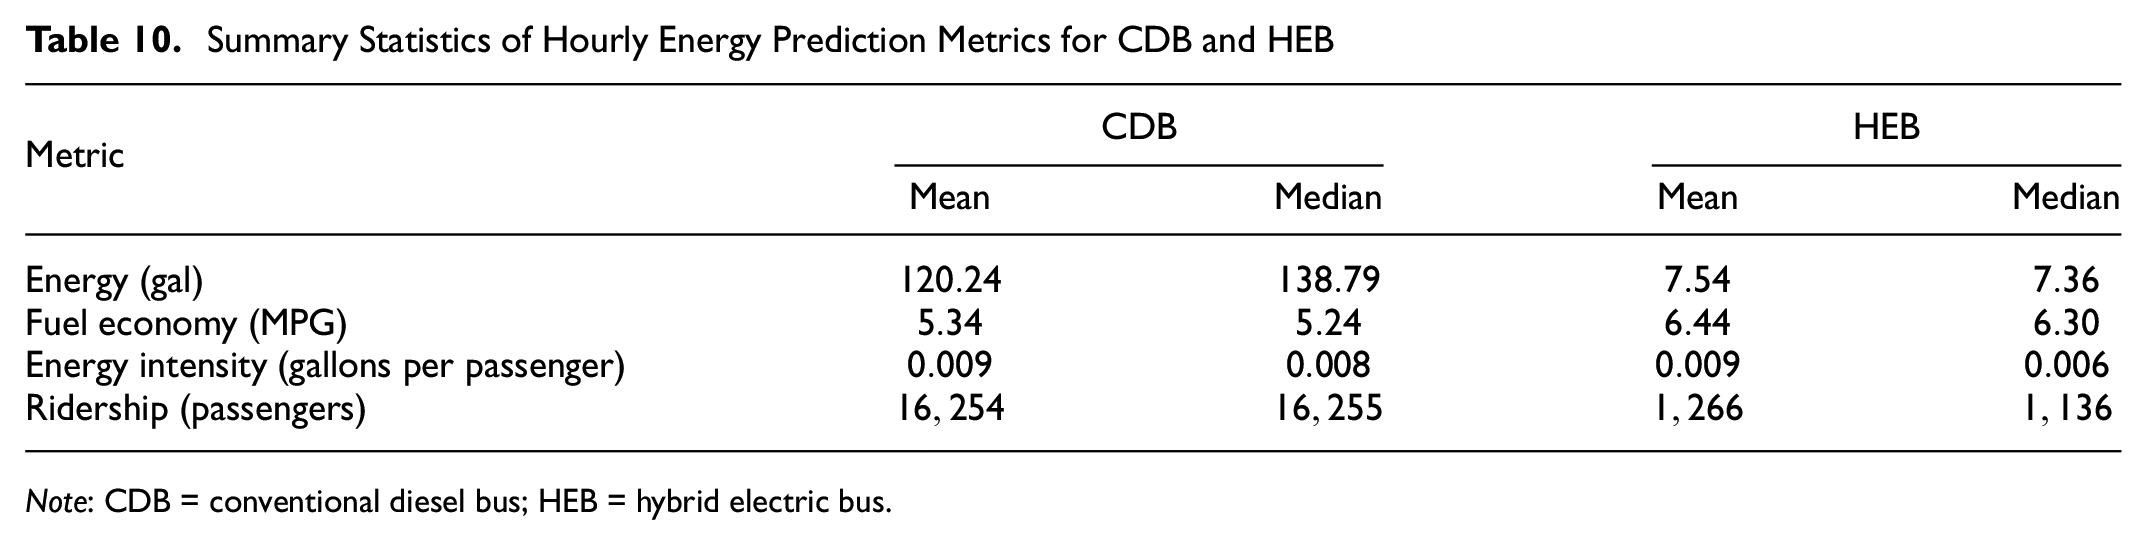
Note: CDB = conventional diesel bus; HEB = hybrid electric bus.
Summary Statistics of Hourly Energy Prediction Metrics for BEB.
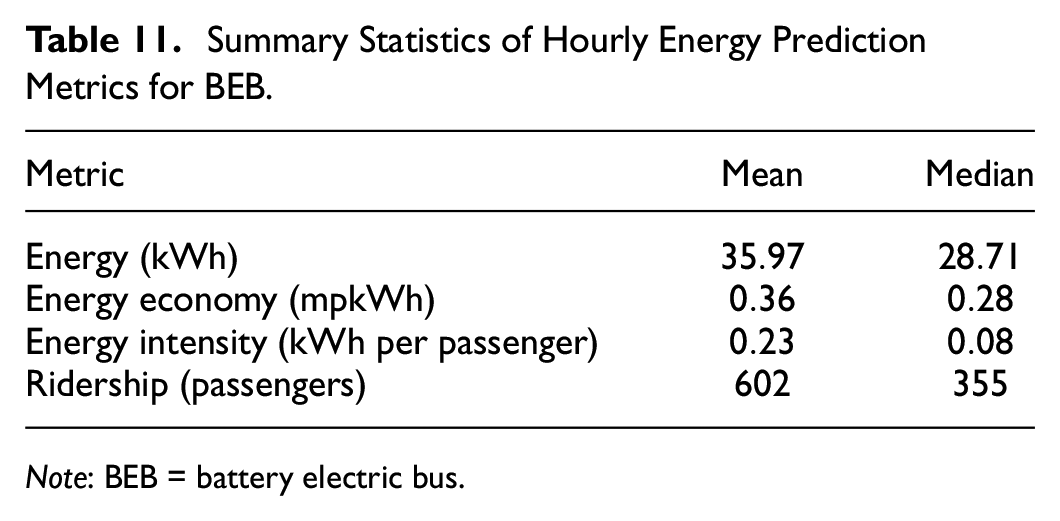
Note: BEB = battery electric bus.
Potential Applications
The proposed systematic approach to model energy consumption has several potential applications, as it provides highly granular energy predictions at the vehicle level. Thus, it can be used to investigate the impacts of demand and congestion at different times of the day. The framework can also be extended to model and predict emissions. With this capability, both energy and emissions can be computed and monitored spatiotemporally. Planning agencies can use this information to understand the zones and routes that consume the most energy or that are exposed to the greatest emissions. Ultimately, using this framework, transit agencies can develop effective fleet electrification strategies. They can prioritize which routes or vehicles to replace based on the powertrain-specific model outputs. Analyses can also include the investigation of energy consumption and emissions exposure for various socioeconomic and demographic segments of the population, given the spatial resolution of the model. Thus, planners can incorporate equity considerations for sustainable decision-making, including electrification and disaster response, among others.
Conclusion
We have developed a framework for predicting the energy consumption of buses based on calibrated vehicle-specific engines, using real-time bus movement data. The framework accurately predicts energy consumption for conventional (CDB), hybrid (HEB), and electric buses (BEB). To demonstrate the effectiveness of our approach, we conducted a case study using the PVTA bus network.
Our integrated framework uses GPS location data to compute real-time vehicle energy consumption using calibrated powertrain-specific models. This novel framework is the first to demonstrate, to the best of our knowledge, a capability to predict highly spatiotemporally resolved vehicle-specific energy consumption for an entire bus network. Further avenues for research include investigating the effects of seasonal fluctuations on energy consumption and refining model calibration via a hierarchical Bayesian estimation method. The models can also be extended to predict vehicle-specific emissions, as well. Ultimately, the framework can be applied by transit agencies to various networks, serving as a valuable decision-support tool for equitable and effective fleet management and replacement, carbon mitigation, and cost reduction strategies.
Footnotes
Acknowledgements
The authors thank Alex Forrest, Tolu Oke, and Benjamin Amand (Pioneer Valley Transit Authority) for supporting this research and providing the data used in the analysis. Their valuable insights and feedback contributed to the quality of this study. We also thank Glenn Barrington, Thomas Vincent, and Matt Moretti (University of Massachusetts Transit Service) for providing further validation data for the study.
Author Contributions
The authors confirm their contribution to the paper as follows: study conception and design: J. Oke, M. Arabi; data collection: M. Arabi; analysis and interpretation of results: M. Arabi, J. Oke; draft manuscript preparation: M. Arabi, J. Oke. All authors reviewed the results and approved the final version of the manuscript.
Declaration of Conflicting Interests
The author(s) declared no potential conflicts of interest with respect to the research, authorship, and/or publication of this article.
Funding
The author(s) disclosed receipt of the following financial support for the research, authorship, and/or publication of this article: The research presented in this paper was funded by the Pioneer Valley Transit Authority via the Federal Transit Administration's Helping Obtain Prosperity for Everyone (HOPE) Program.
Data Accessibility Statement
The authors are solely responsible for the facts, the accuracy of the data and analysis, and the views presented here.