
Abstract
Across the U.S.A., cities are increasingly prioritizing the implementation and enhancement of cycle facilities and networks. One of the goals of this effort is to enhance the safety and comfort of the urban cycling experience. Some of the implemented and planned facility improvements include protected cycle lanes, turning boxes, and newer control devices such as bicycle signal faces. The introduction of the bicycle signal face increases intersection complexity and can influence people’s perceptions of safety and comfort. Often, the bicycle signal symbol is the only distinguishing feature of a bicycle signal, and this could lead to user confusion. This paper describes the results of an online survey conducted in Austin, Texas, which aimed to understand people’s perceptions of bicycle signal faces. The survey was conducted after the installation of experimental bicycle signal faces at 12 intersections throughout the city. The paper also presents the results from a combination of stated and revealed preferences to compare people’s perceptions with their real-life experience of dedicated bicycle signals with bicycle signal faces. In general, perceptions of satisfaction, comfort, compliance, and safety in relation to bicycle signals are positive. For many of the questions, positive perceptions improved with decreasing age, increasing cycling frequency, access to a bicycle, or an encounter with experimental bicycle signals. The most polarizing respondent characteristics are access to a bicycle, cycling frequency, and level of cycling comfort.
Cities across the U.S.A. are aiming to improve the safety and comfort of the urban cycling experience. Based on experiences in other countries that have many cyclists, providing separate cycling facilities along roads with heavy traffic can help cities achieve a high level of safe and convenient cycling ( 1 ). Austin, in Texas, has prioritized the improvement of its cycling facilities and plans eventually to have a cycling network suitable for all ages and levels of ability. Some of the implemented and planned facility improvements include protected cycle lanes, turning boxes, and newer control devices such as bicycle signal faces. To continue the effective introduction of new control devices and facilities, transportation professionals should seek a detailed understanding of the benefits, trade-offs, and user perceptions of each control device or facility.
The introduction of innovative control devices can increase intersection complexity. As various modes of transportation enter the intersection, traffic engineers and urban planners must think carefully about how motorized and nonmotorized road users interact together both to ensure safety within an intersection and to maximize safety, especially for vulnerable road users.
Bicycle-specific control devices are relatively newer in the U.S.A. and are only approved for use in a limited capacity. The 2009 Manual on Uniform Traffic Control Devices (MUTCD) does not address bicycle-specific signal faces, but the Interim Approval for Optional Use of a Bicycle Signal Face (Interim Approval IA-6) allows their use, but only when there are no conflicting movements between cyclists and motorists ( 2 ). Therefore, the impact that bicycle-specific signal faces can have on safety and traffic operations under various configurations requires further experimentation, understanding, and study.
This paper presents a literature review of bicycle signal face usage in the U.S.A., including limitations on use and gaps in the current state of the knowledge. Following the literature review, the paper outlines the findings of an online survey that was conducted in Austin, Texas, after an experiment in which bicycle signals were deployed at 12 intersections. A discussion of the results follows before some conclusions are offered.
Background
Following the lead of cities abroad where cycling is popular, many U.S. cities have been working to make cycling safer and more comfortable by installing bicycle signals. Bicycle signals with a bicycle signal face have been used extensively in Europe and Asia to improve the safety and comfort of cyclists ( 3 ). Aside from the circular signal indication, the first instance of a bicycle signal with a bicycle signal face in the U.S.A. has been cited as having been installed in Davis, California, in 1994 ( 3 , 4 ). After many state, county, and local government agencies requested to do the same, under the auspices of the MUTCD, the Federal Highway Administration issued Interim Approval IA-6 in 2013. As mentioned before, this only allows the optional use of a bicycle signal face if there are no conflicting movements between cyclists and motorists.
The U.S. bicycle symbol closely resembles the symbols used internationally, but the placement of some signal details differs ( 3 ). For example, international cities frequently use smaller nearside bicycle signal faces, but this type of installation is rarely seen domestically. Other examples in China and the Netherlands have bicycle signal faces that include arrows to indicate the allowed bicycle movement. However, in the U.S.A., a subcommittee of the National Committee on Uniform Traffic Control Devices has communicated that they believe arrows and bicycle signals together should not be allowed in the same signal face ( 5 ).
Bicycle signal deployment has been growing since the MUTCD Interim Approval 1A-6 was issued. Before 2013, bicycle signals were in use at more than 40 intersections across various jurisdictions. Following the issue of Interim Approval IA-6, bicycle signals are now present in over 500 intersections in more than 61 jurisdictions ( 4 ). As of 2020, New York (156 intersections), California (70 intersections), Illinois (40 intersections), Washington (51 intersections), Oregon (33 intersections), and Texas (26 intersections), have the most intersections with bicycle signals ( 3 ). The increasing deployment of various bicycle signal configurations has resulted in new questions, for example: What are the safety impacts of these configurations? and What is the public’s perception of the signal faces?
Circular and Bicycle Symbol Indication
In the U.S.A., bicycle-specific signals show either circular or bicycle silhouette symbol indications. Proper installation should combine a bicycle symbol indication with an existing conventional traffic signal or hybrid beacon ( 6 ). Typical appropriate bicycle signal installation scenarios are at complex intersections that may otherwise be difficult for cyclists to navigate, that is, intersections with a high number of crashes between bicycles and motor vehicles, or where standalone cycle paths or multiuse paths cross a street.
MUTCD Interim Approval
The 2009 MUTCD allows the use of an eight-inch circular face to control movement on a cycleway or bicycle movements in Section 4D.07, but does not specifically address bicycle signals with a bicycle signal face. In 2013, the MUTCD issued Interim Approval 16 (IA-16) allowing the optional use of a bicycle signal face as long as there are no conflicting movements between motorists and cyclists ( 2 ). Interim Approval IA-16 provides visual examples of typical vertical and horizontal arrangements for bicycle signal faces. Figure 1 shows a typical vertical bicycle signal face in Austin, Texas.
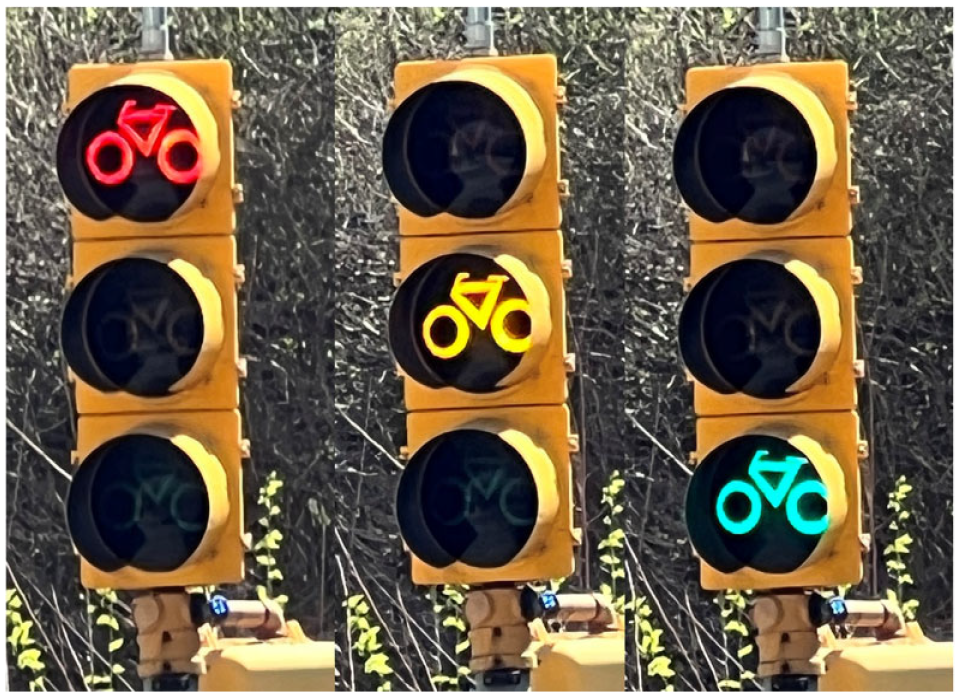
Bicycle signal face located on Rio Grande Street and Martin Luther King Boulevard in Austin, Texas.
Not allowing conflicting movements presents some operational challenges for cities wanting to implement these signals. To elaborate, allowing conflicting movements could decrease delays for all users by reducing the amount of mode-exclusive phasing during a cycle. By allowing more movements during a specific signal phase, a smaller number of phases would be needed to serve all movements within a cycle.
Impact on Safety
Often, the bicycle signal symbol is the only distinguishing feature of a bicycle signal, which according to the principles of human nature can lead to user confusion ( 3 ). In general, the housing, backplates, and mounting practices pertaining to bicycle-specific signals are identical to regular traffic signals ( 3 ). Previous efforts have identified evidence of road user confusion because of a lack of familiarity with the bicycle signals and poor separation between vehicle and bicycle signal faces ( 3 ). Some agencies found that confusion was eliminated with experience gained over time, whereas others found that separating the faces with a new signal pole aided visibility ( 3 ).
Although cyclists are required to obey all traffic signs and signals, certain scenarios and intersection configurations can make the role of the cyclist unclear, potentially leading to dangerous interactions. In general, bicycle-specific signals should facilitate crossings by cyclists by emphasizing when it is safe for the cyclist to enter the intersection. The enhanced clarity should reduce the likelihood of conflicts between all intersection users.
A bicycle signal can help maintain physical separation between cyclists and motor vehicles ( 7 ). Increased separation improves cyclists’ visibility, which, in turn, will help prevent the two modes from colliding. According to the MUTCD, installing a bicycle signal head can help to either reduce the overall number of crashes involving bicycles or reduce the bicycle crash rate by up to 45% if bicycle volumes concurrently increase ( 2 ).
Perceptions of Safety
Along with the actual safety experience, the perception of safety can act as either a facilitator or barrier in relation to bicycle signals. A survey study of the perception of cycling found that noncyclists tend to have more negative perceptions of overall safety and the nuisance of cyclists causing delays ( 8 ). Similarly, a survey was conducted on the experimental bicycle signal on the Mount Vernon Trail, a critical link to the regional cycling network in Alexandria, Virginia, to measure the perception of safety associated with it ( 9 ). The survey results indicated that cyclists believe the signal improves safety, whereas motorists generally believe the bicycle signal has no effect ( 9 ). Although this survey did not find negative perceptions among noncyclists as such, it does highlight that noncyclists tend to have a less favorable opinion of the safety of bicycle signals compared with cyclists.
Overall Research Gaps
Although bicycle signals have had a positive impact on intersection safety, there are still areas of research in relation to their experimental use that warrant attention. For instance, the National Cooperative Highway Research Program (NCHRP) funded research to standardize the use of bicycle signal faces in the U.S.A. The NCHRP effort identified road user comprehension and compliance as the major research gaps ( 3 , 4 ). Because road user comprehension can drive peoples’ perception of the signals, understanding perceptions is a key factor in addressing this research gap.
Methods
To understand motorists’, cyclists’, and pedestrians’ perceptions of separate bicycle signals in relation to comfort, compliance, and safety, an online survey was jointly developed by the Center for Transportation Research at the University of Texas at Austin and the City of Austin. The survey was conducted from September 17 to October 5, 2018 and was available to people living in Austin, Texas. It was distributed through the city’s Public Information Office via Nextdoor and through public social media pages. The responses were analyzed with Qualtrics, R, and Tableau. Open-ended responses were grouped by respondent characteristics and reviewed qualitatively.
The survey aimed to understand how the Austin population feels about the signals with regard to comfort, safety, and compliance. The gender and age split for the survey are very similar to the general Austin population (Table 1). Except for the 15 or under age group, the survey seems to mirror the frequency age distribution of the general Austin population reasonably well, with the survey population deviating on average +/-6.8% from the general population. However, a chi-square test does show a statistically significant difference between the two groups.
Comparison between Actual Population and Survey with Regard to Gender and Age Split
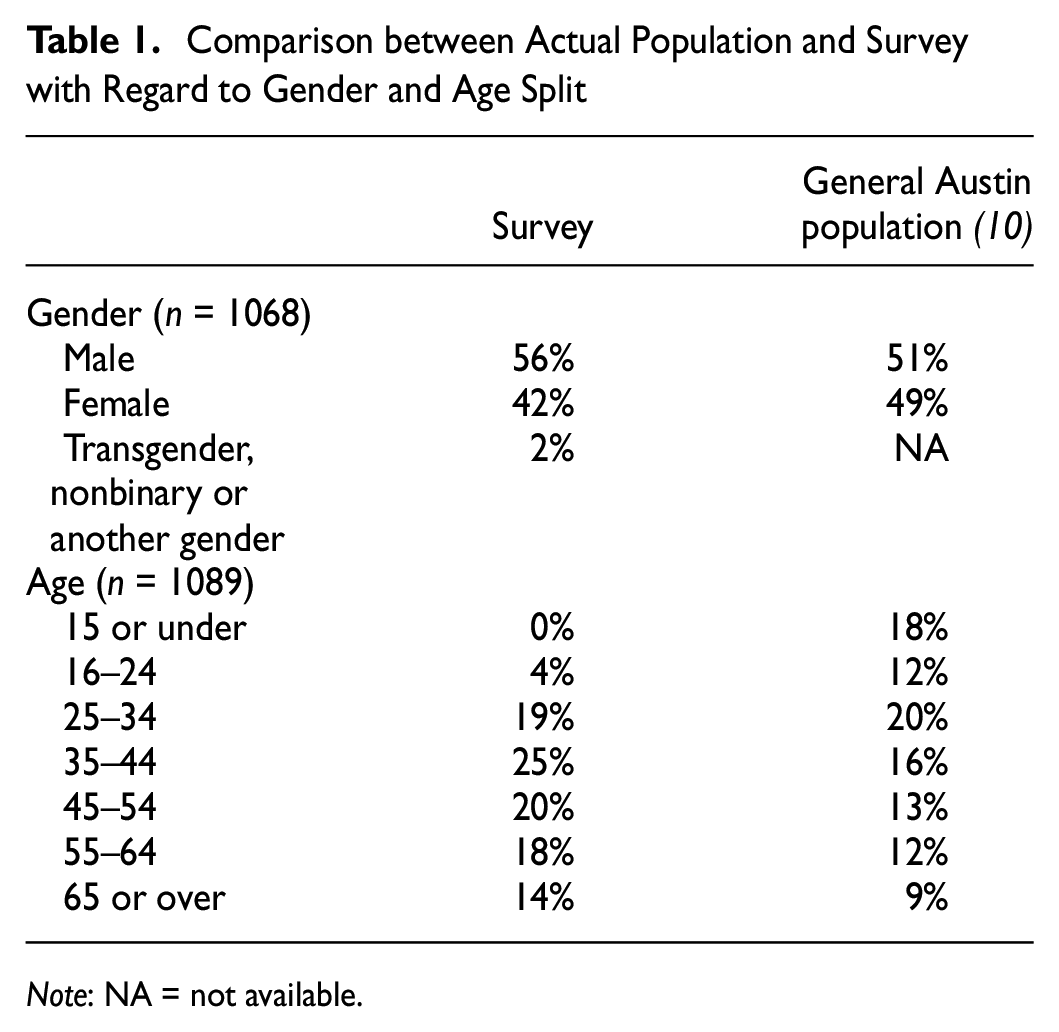
Note: NA = not available.
Findings
Demographics, Bicycle Usage, and Exposure to Experimental Signals
Table 2 lists the respondent characteristics from the bicycle signals perceptions survey. In general, respondents were well distributed among gender and age categories. They were mainly motorists (58%) and cyclists (35%) who had encountered the experimental bicycle signals in Austin (62%), have access to a bicycle (87%), and cycle for mostly recreational purposes (51%). Access to a bicycle was described as owning a bicycle or being able to rent or borrow one.
Respondent Characteristics
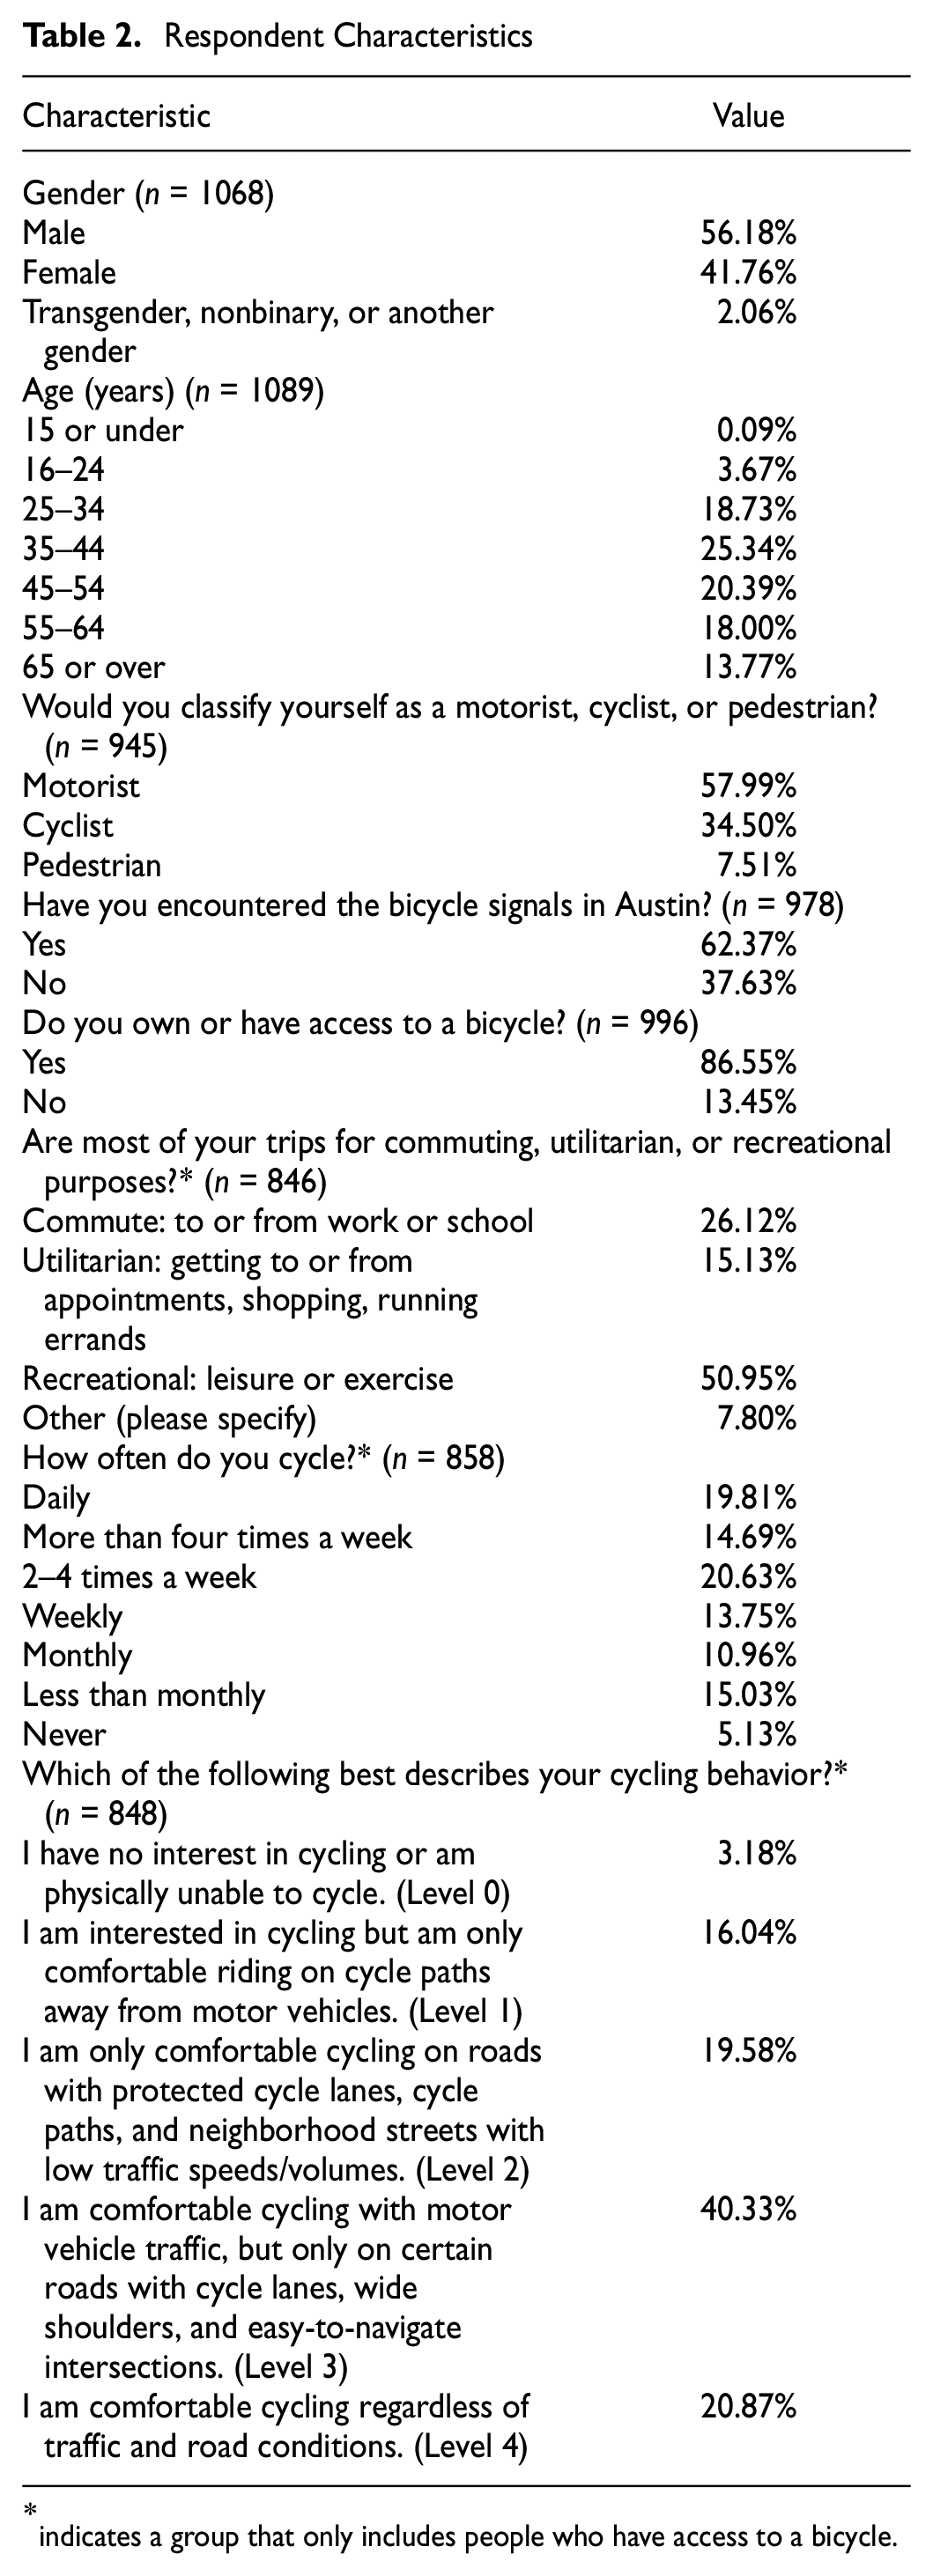
indicates a group that only includes people who have access to a bicycle.
At the time of the survey, the experimental use of bicycle signal faces was in place at 12 intersections. Many of them were installed on Third Street, a popular cycling corridor in the downtown area. Those who had encountered the signals (62%) were later asked to answer revealed preference questions, whereas those who had not (38%) were asked stated preference questions about comfort and safety.
People who responded as having access to a bicycle were asked to elaborate on their usual type of trip, cycling frequency, and their level of comfort with cycling. The usual type of trip was almost evenly split between recreational (51%) and nonrecreational (49%). For the nonrecreational categories, respondents could choose from “utilitarian,”“commute,” or “other.” Those who selected the “other” category were forced to specify what they meant by this to continue moving through the survey. On reviewing the responses, the research team found that respondents were mostly either (a) evenly split between recreational, utilitarian, and commute, or (b) that they didn’t cycle at all. The “other” category was a very small fraction (8%) of the responses. More than half of the respondents (55%) cycle twice a week or more, and only 5% never cycle. Finally, respondents described their comfort level with regard to cycling by choosing one of five prewritten statements.
Because one of the goals of the survey was to understand perceptions of comfort with regard to bicycle signals, survey respondents were asked to select a statement that best described their cycling behavior. These statements were created with Roger Geller’s typology of the four types of cyclists in mind (
11
): strong and fearless; enthused and confident; interested but concerned; and no way no how. About 40% of respondents chose the following statement: I am comfortable cycling with motor vehicle traffic, but only on certain roads with cycle lanes, wide shoulders, and easy-to-navigate intersections.
This indicates that the most frequently chosen response falls within the “enthused and confident” category. The two statements that aimed to capture the “interested but concerned” category were the following: I am interested in cycling, but am only comfortable riding on cycle paths away from motor vehicles. I am only comfortable cycling on roads with protected cycle lanes, cycle paths, and neighborhood streets with low traffic speeds/volumes.
In total, about 36% of survey respondents agreed with these statements. Only 3% of respondents were in the “no way no how” category and chose the following statement: I have no interest in cycling or am physically unable to cycle.
This fraction is even smaller than the fraction of those who say they never cycle (5%), which implies that even those who never cycle have some sort of interest in cycling.
Overall Satisfaction
Respondents who had encountered the experimental bicycle signal faces were asked how satisfied they were with the signals overall. Figure 2 shows a divergent Likert chart of the response. Here, 0 means “extremely dissatisfied” and 10 means “extremely satisfied.” The chart is centered around the neutral response (= 5) and divides this in half exactly to account for the possibility that the response could go in either the positive or negative direction. The bubbles in each bar show the mean value of the response for that variable.
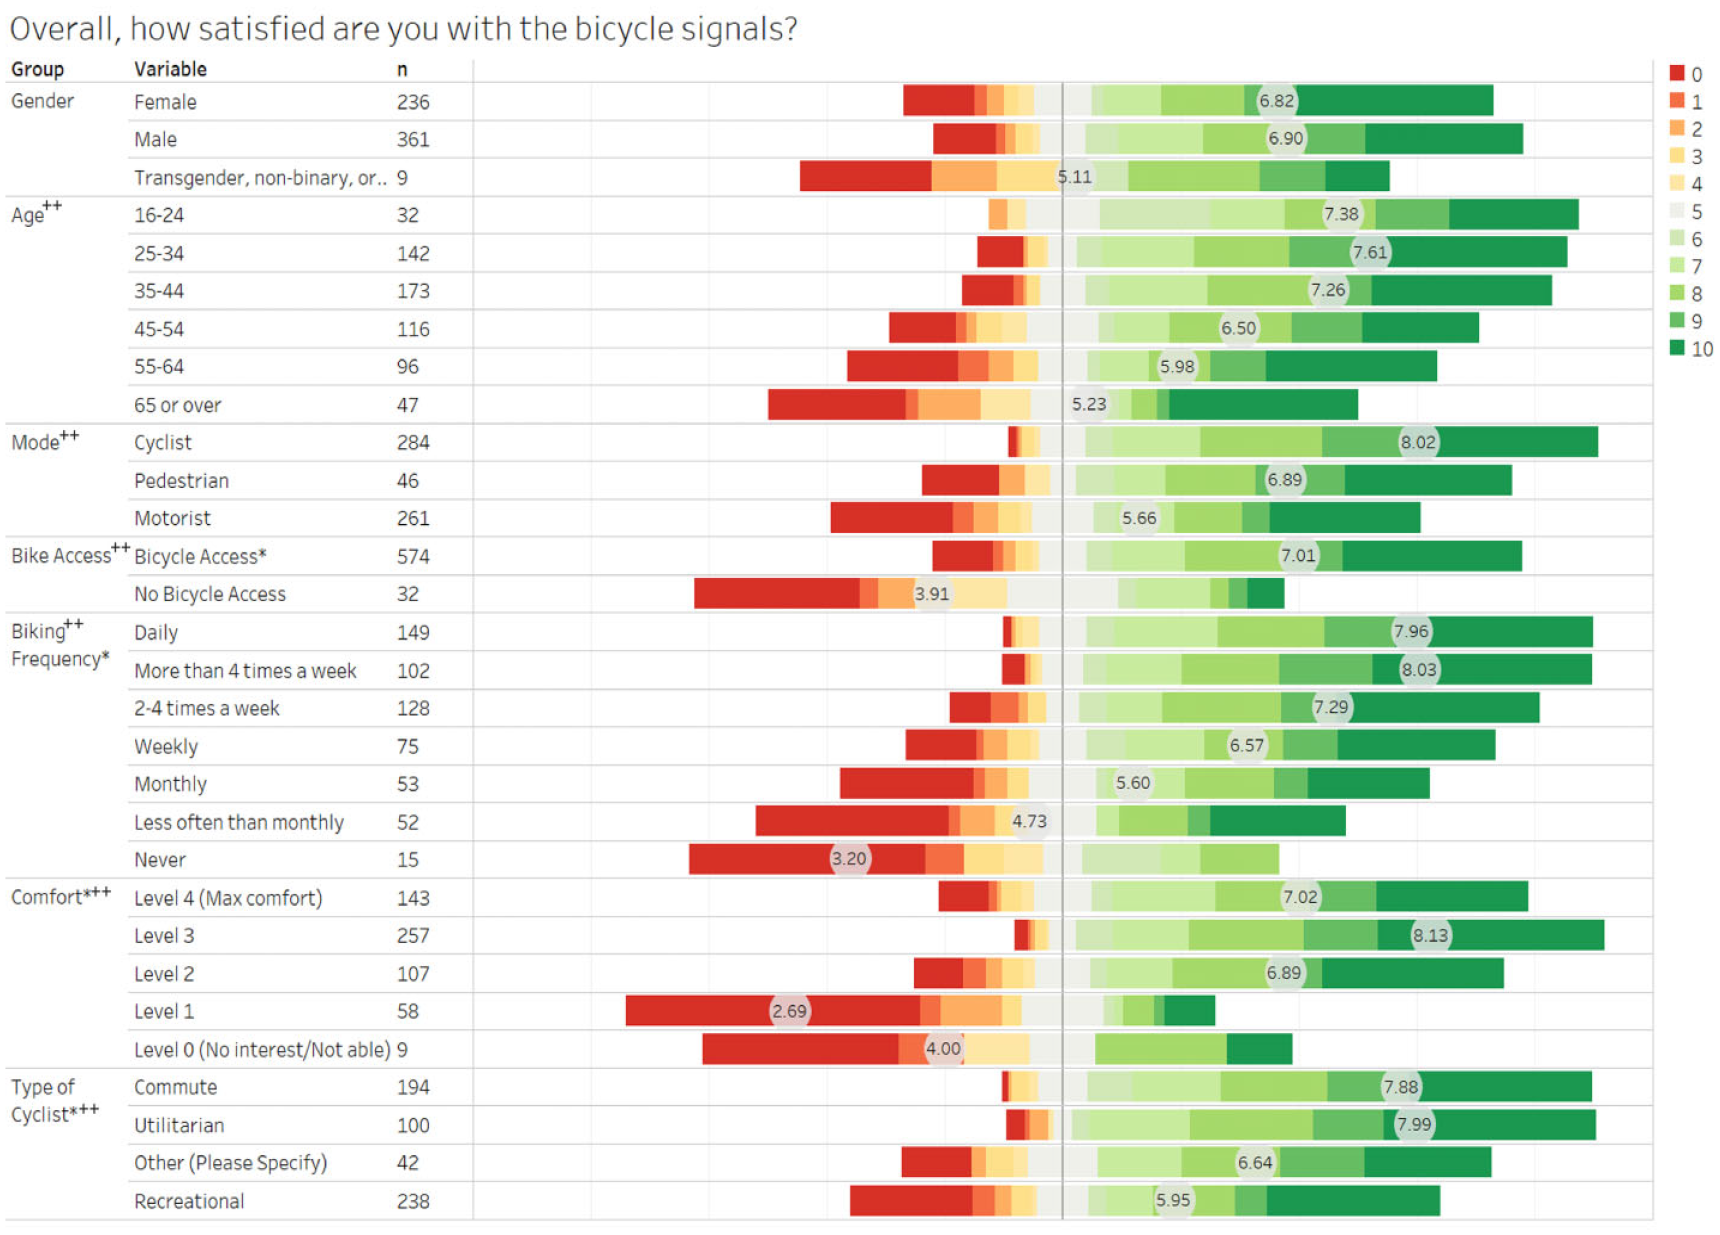
Overall satisfaction with bicycle signals.
The survey respondents’ view of overall satisfaction with the bicycle signals is positive to very positive in almost all the categories, indicating that people in general really do like the bicycle signals. The only categories with a negative overall satisfaction are people who have no access to a bicycle (3.9), who cycle less than monthly (4.7) or never (3.2), and who agree with the two lowest levels of cycling comfort. The most negative score (2.69) was given by the group of people (n = 58) who are “only comfortable riding on cycle paths away from motor vehicles.”
All variable groups have a statistically significant difference in mean response, except for gender. Figure 2 shows that overall satisfaction increases with decreasing age or increased cycling frequency. Access to a bicycle also seems to polarize the overall response to this question. Those who have no access to a bicycle (3.91) have a much more negative perception of overall satisfaction with the bicycle signals compared with those who have access to a bicycle (7.01).
Perceptions of Comfort
Stated Perceptions of Comfort
Survey respondents were asked to state how they think comfort level changes with the addition of bicycle signals at an intersection and, in general, responded that the comfort level improves. Figure 3 shows a divergent Likert chart of the response to the two questions that address stated comfort perceptions. The solid dots on the chart represent the center of the response. Dots on the “Stays the same” band are divided in half between leaning positive and leaning negative.
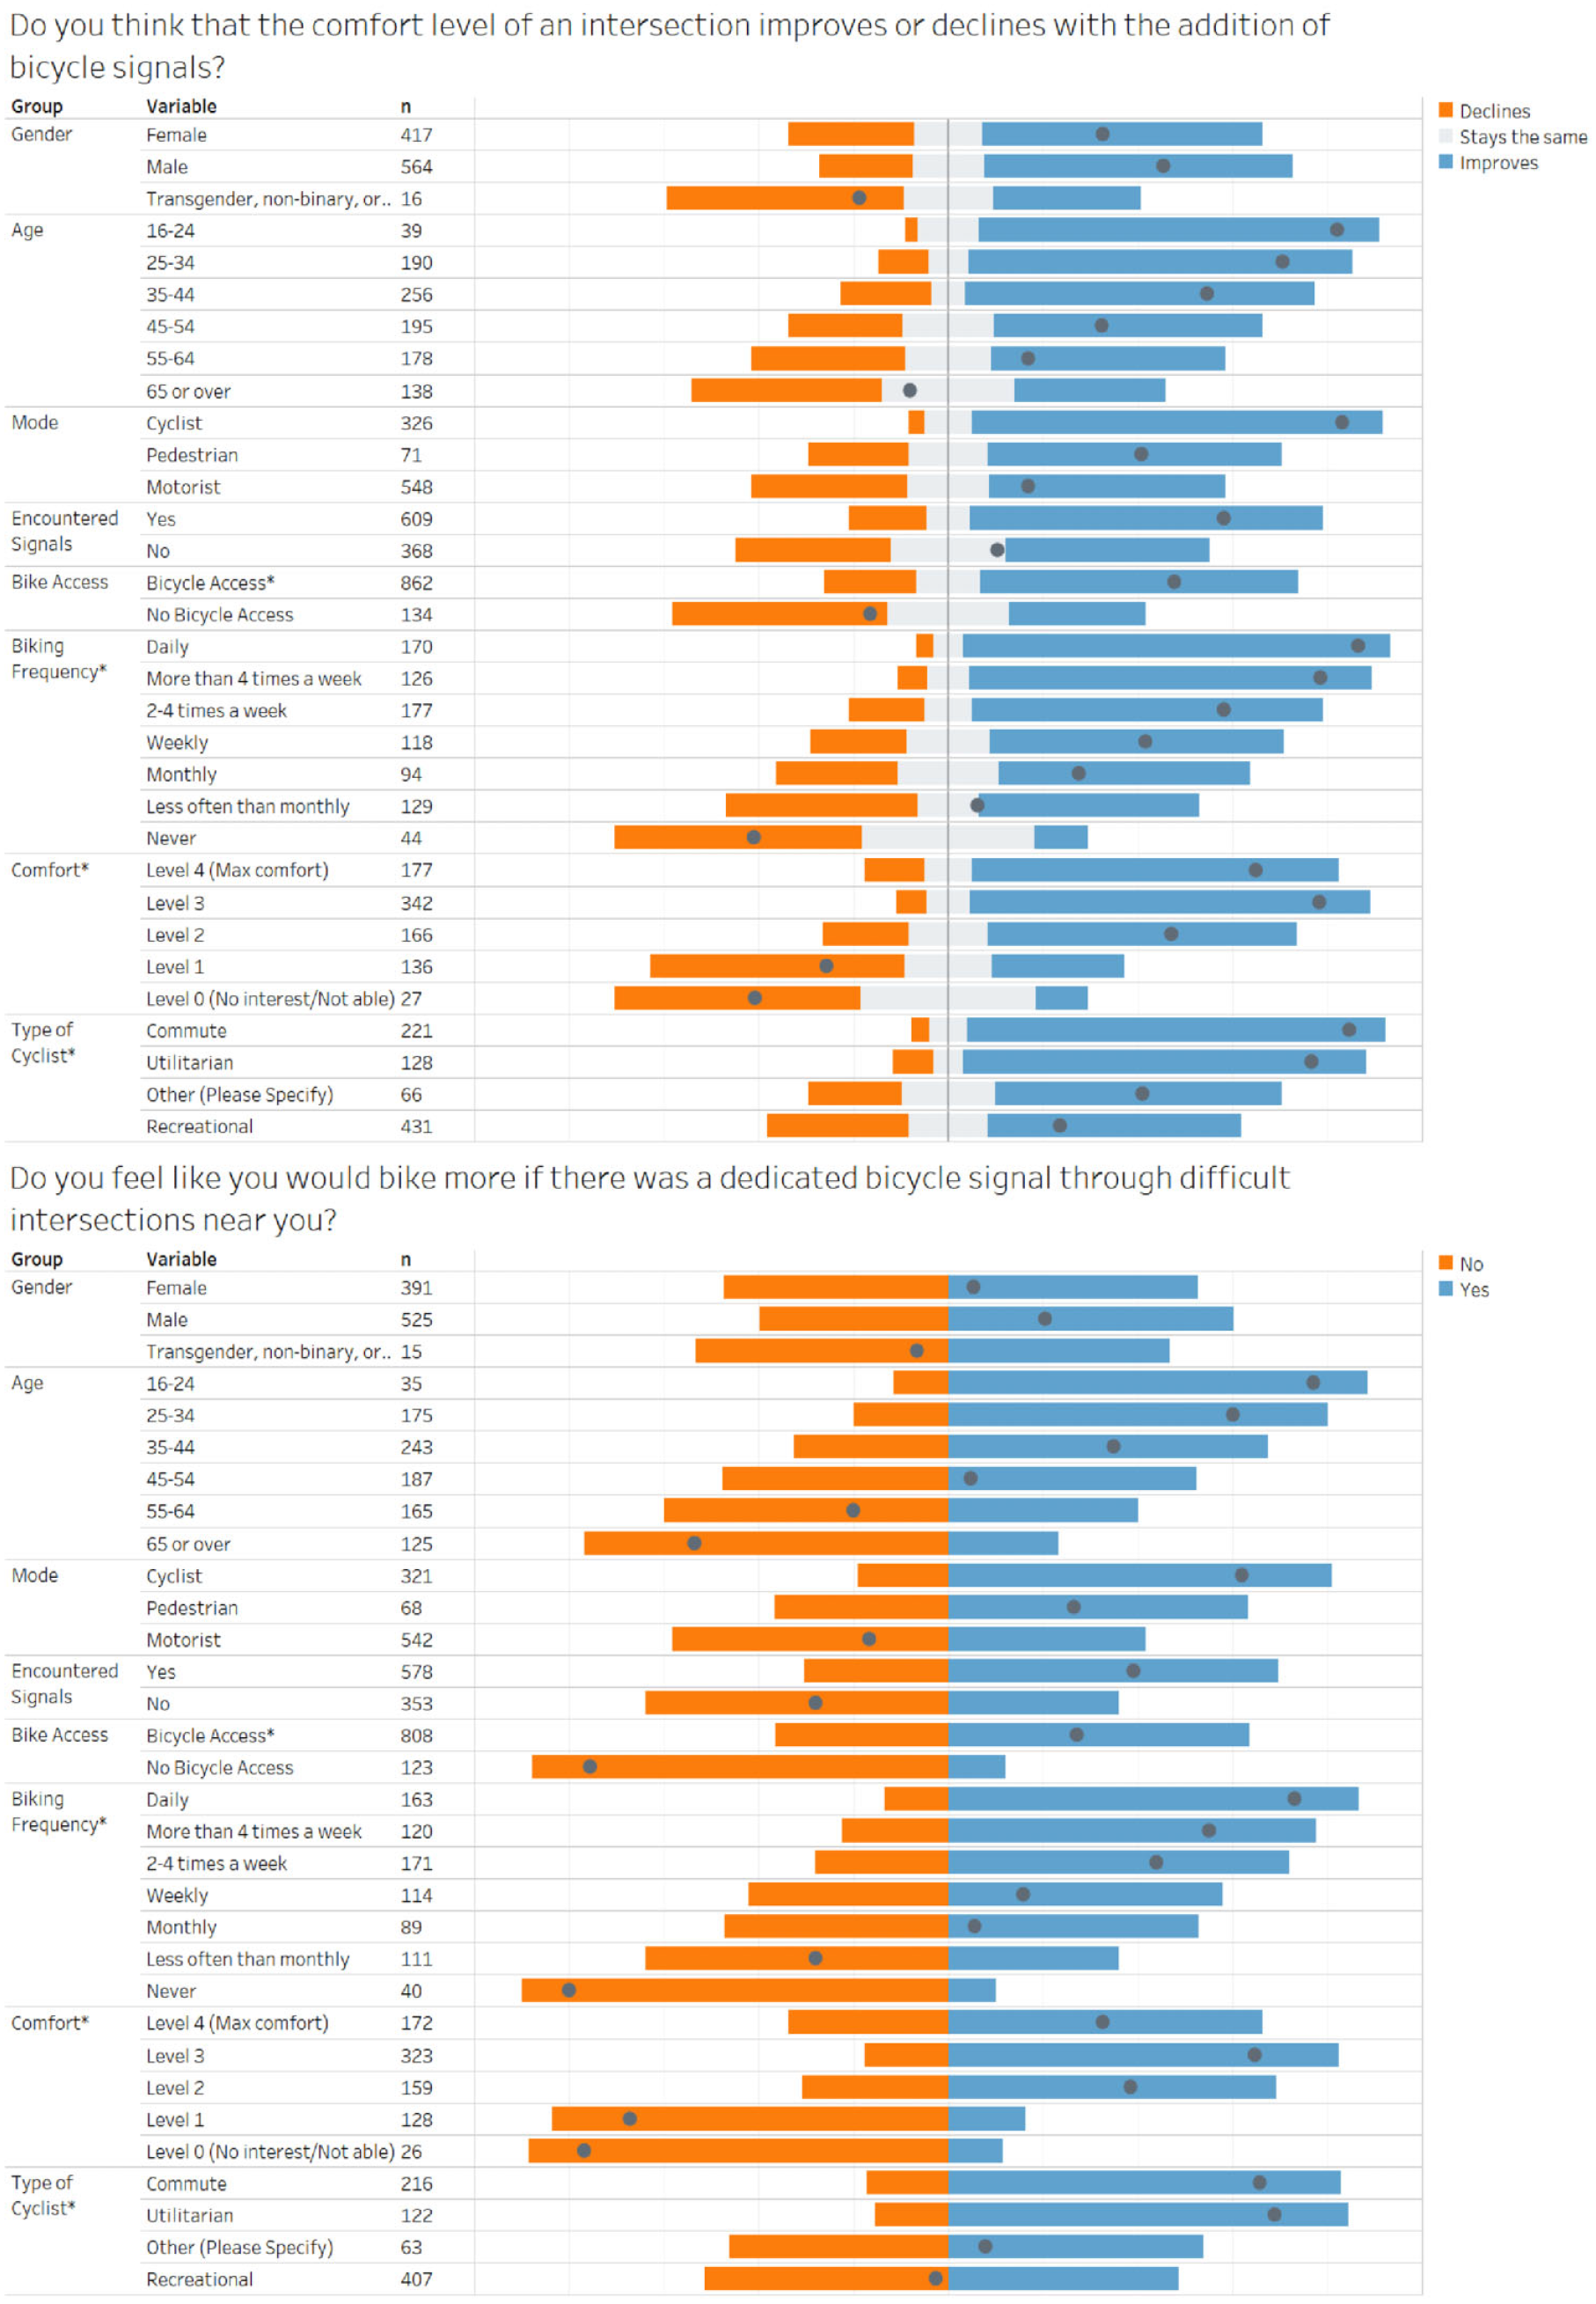
Stated perceptions of comfort by respondent characteristics.
Those who are 65 and over (n = 138), have no access to a bicycle (n = 134), never cycle (n = 44), or agree that the two lowest levels of cycling comfort lie on or lean toward the negative side, believe, in general, that comfort declines with bicycle signals. There is a very stark difference in perception between the people who (a) have no interest in cycling or lack the ability to cycle, or who are only comfortable riding on cycle paths away from motor vehicles (the two lowest levels of cycling comfort), and (b) the remaining higher levels of cycling comfort. The center of the response jumps from one extreme to the other with the main difference being the interest in cycling alongside motor vehicle traffic in some form. For this question, all variables are significant and Table 3 summarizes the percentage and statistical breakdown of the responses to this question and of the responses to the other nonnumerical Likert-style questions that follow. The rest of the respondents are on the positive side or lean toward it and believe that comfort improves with the addition of a bicycle signal.
Statistical Breakdown of Nonnumerical Likert Questions
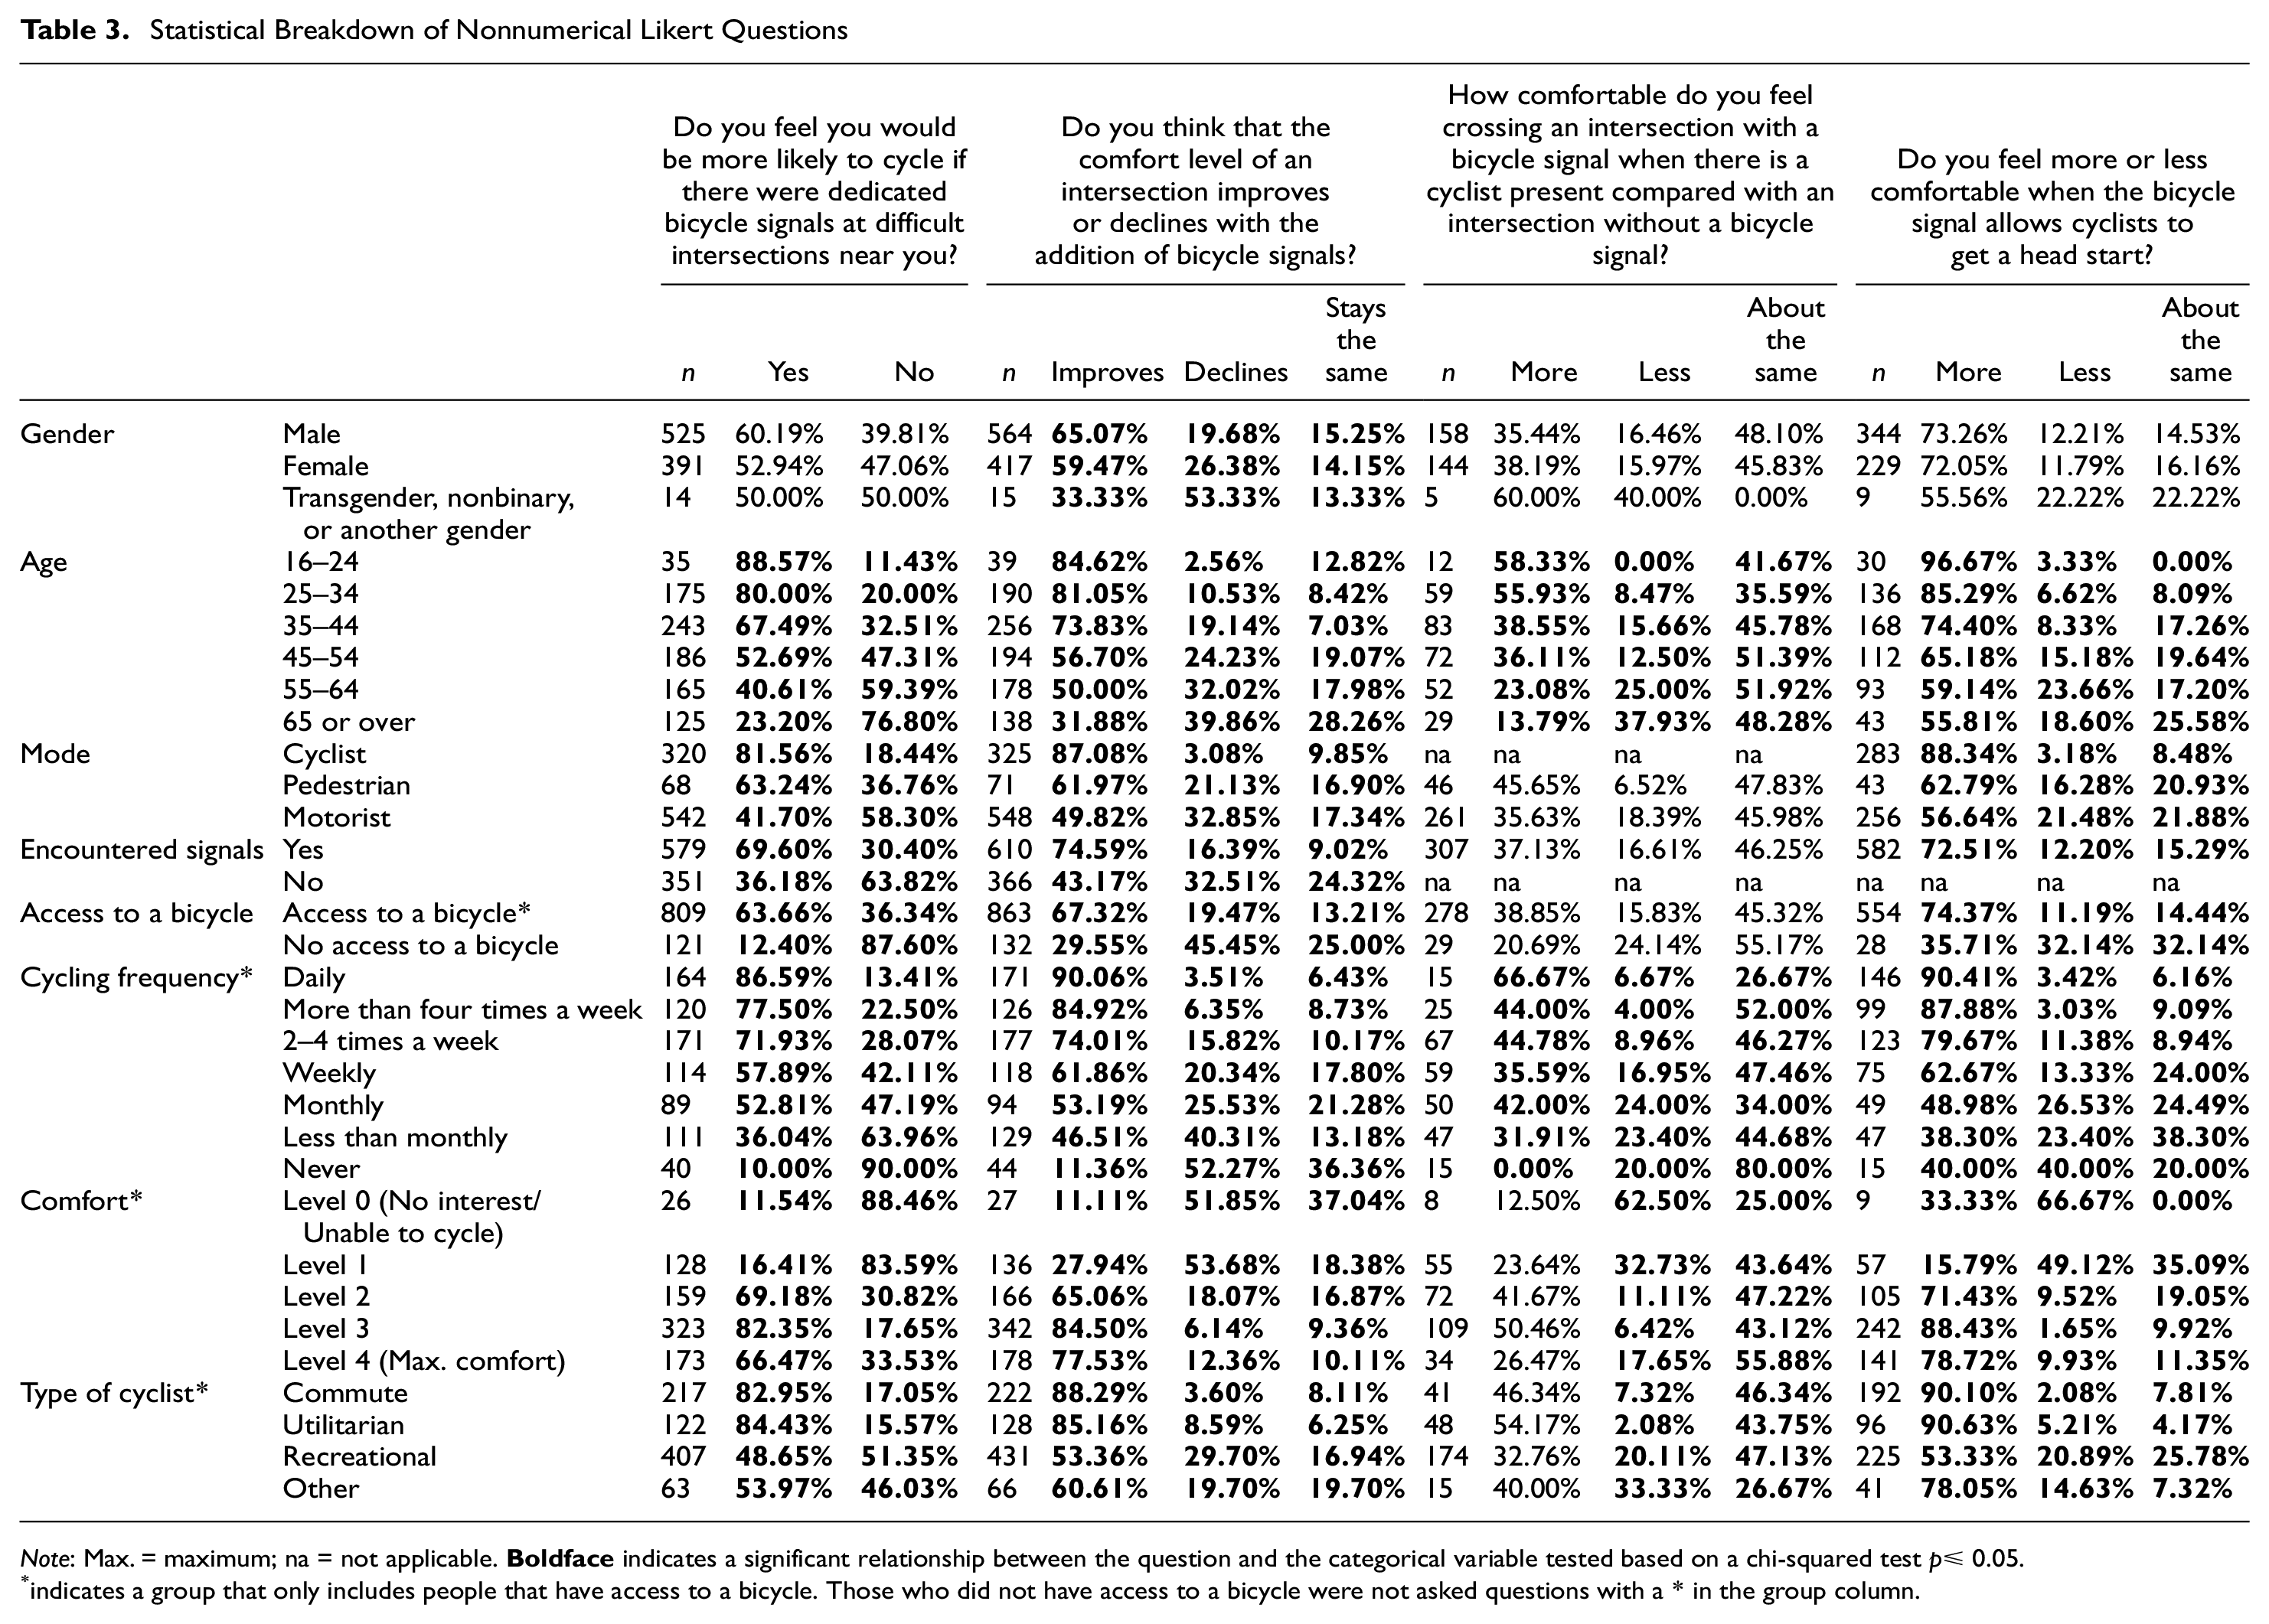
Note: Max. = maximum; na = not applicable.
indicates a group that only includes people that have access to a bicycle. Those who did not have access to a bicycle were not asked questions with a * in the group column.
Figure 3 shows perceptions of comfort at intersections with bicycle signals improve with decreasing age, increasing cycling frequency, an encounter with an experimental bicycle signal face, or access to a bicycle. In addition, males tend to have a more favorable view of an improvement in comfort than females, whereas people who identify as “another gender” tend to have a negative view. The improvement in perception from an encounter with the bicycle signals highlights that this improves people’s instinctive perception of them. Because improved comfort can potentially lead to increasing cycling frequency, respondents were also asked to state whether they felt they would cycle more if there were dedicated bicycle signals at intersections near them.
The second stated perception of comfort question (Figure 3) asked respondents to state whether they felt they would change their cycling behavior and cycle more if there was a dedicated signal at difficult intersections near them. Those who are 45 or younger, have encountered the signals, have access to a bicycle, cycle monthly or more frequently, are comfortable cycling alongside motor vehicles at least in some capacity, or are nonrecreational riders, believe they would cycle more. All variables apart from gender are statistically significant (Figure 3). Those who do not believe they would cycle more frequently include people who are 55 or older, identify as motorists, do not have access to a bicycle, never cycle, are only interested in riding on cycle paths away from motor vehicles, or are recreational riders.
Comparing this response with the previous question about comfort, not every group that believe comfort improves with bicycle signals felt they would cycle more. People who are aged between 55 and 64, cycle less than monthly, or are recreational riders, agree that comfort improves with bicycle signals. However, they do not believe they would cycle more if they had bicycle signals near them.
Revealed Perceptions of Comfort
People who had encountered the bicycle signals were asked two questions about comfort in relation to them and, in general, indicated that comfort levels tend to improve (Figure 4). Motorists and pedestrians were asked how they felt about crossing an intersection with a bicycle signal and a cyclist present. The band representing the “About the same response” is wide compared with the question below that addresses comfort with an advanced green signal, but most of the responses lean toward the feeling more comfortable side or are definitely on it. Those who feel about the same but perhaps lean more toward feeling less comfortable are 55 or older, have no access to a bicycle, never cycle, or are only interested in riding on cycle paths away from motor vehicles. The only people who believe there is less comfort at intersections with bicycle signals are those who have no interest in cycling or lack the ability to ride a bicycle (n = 8).
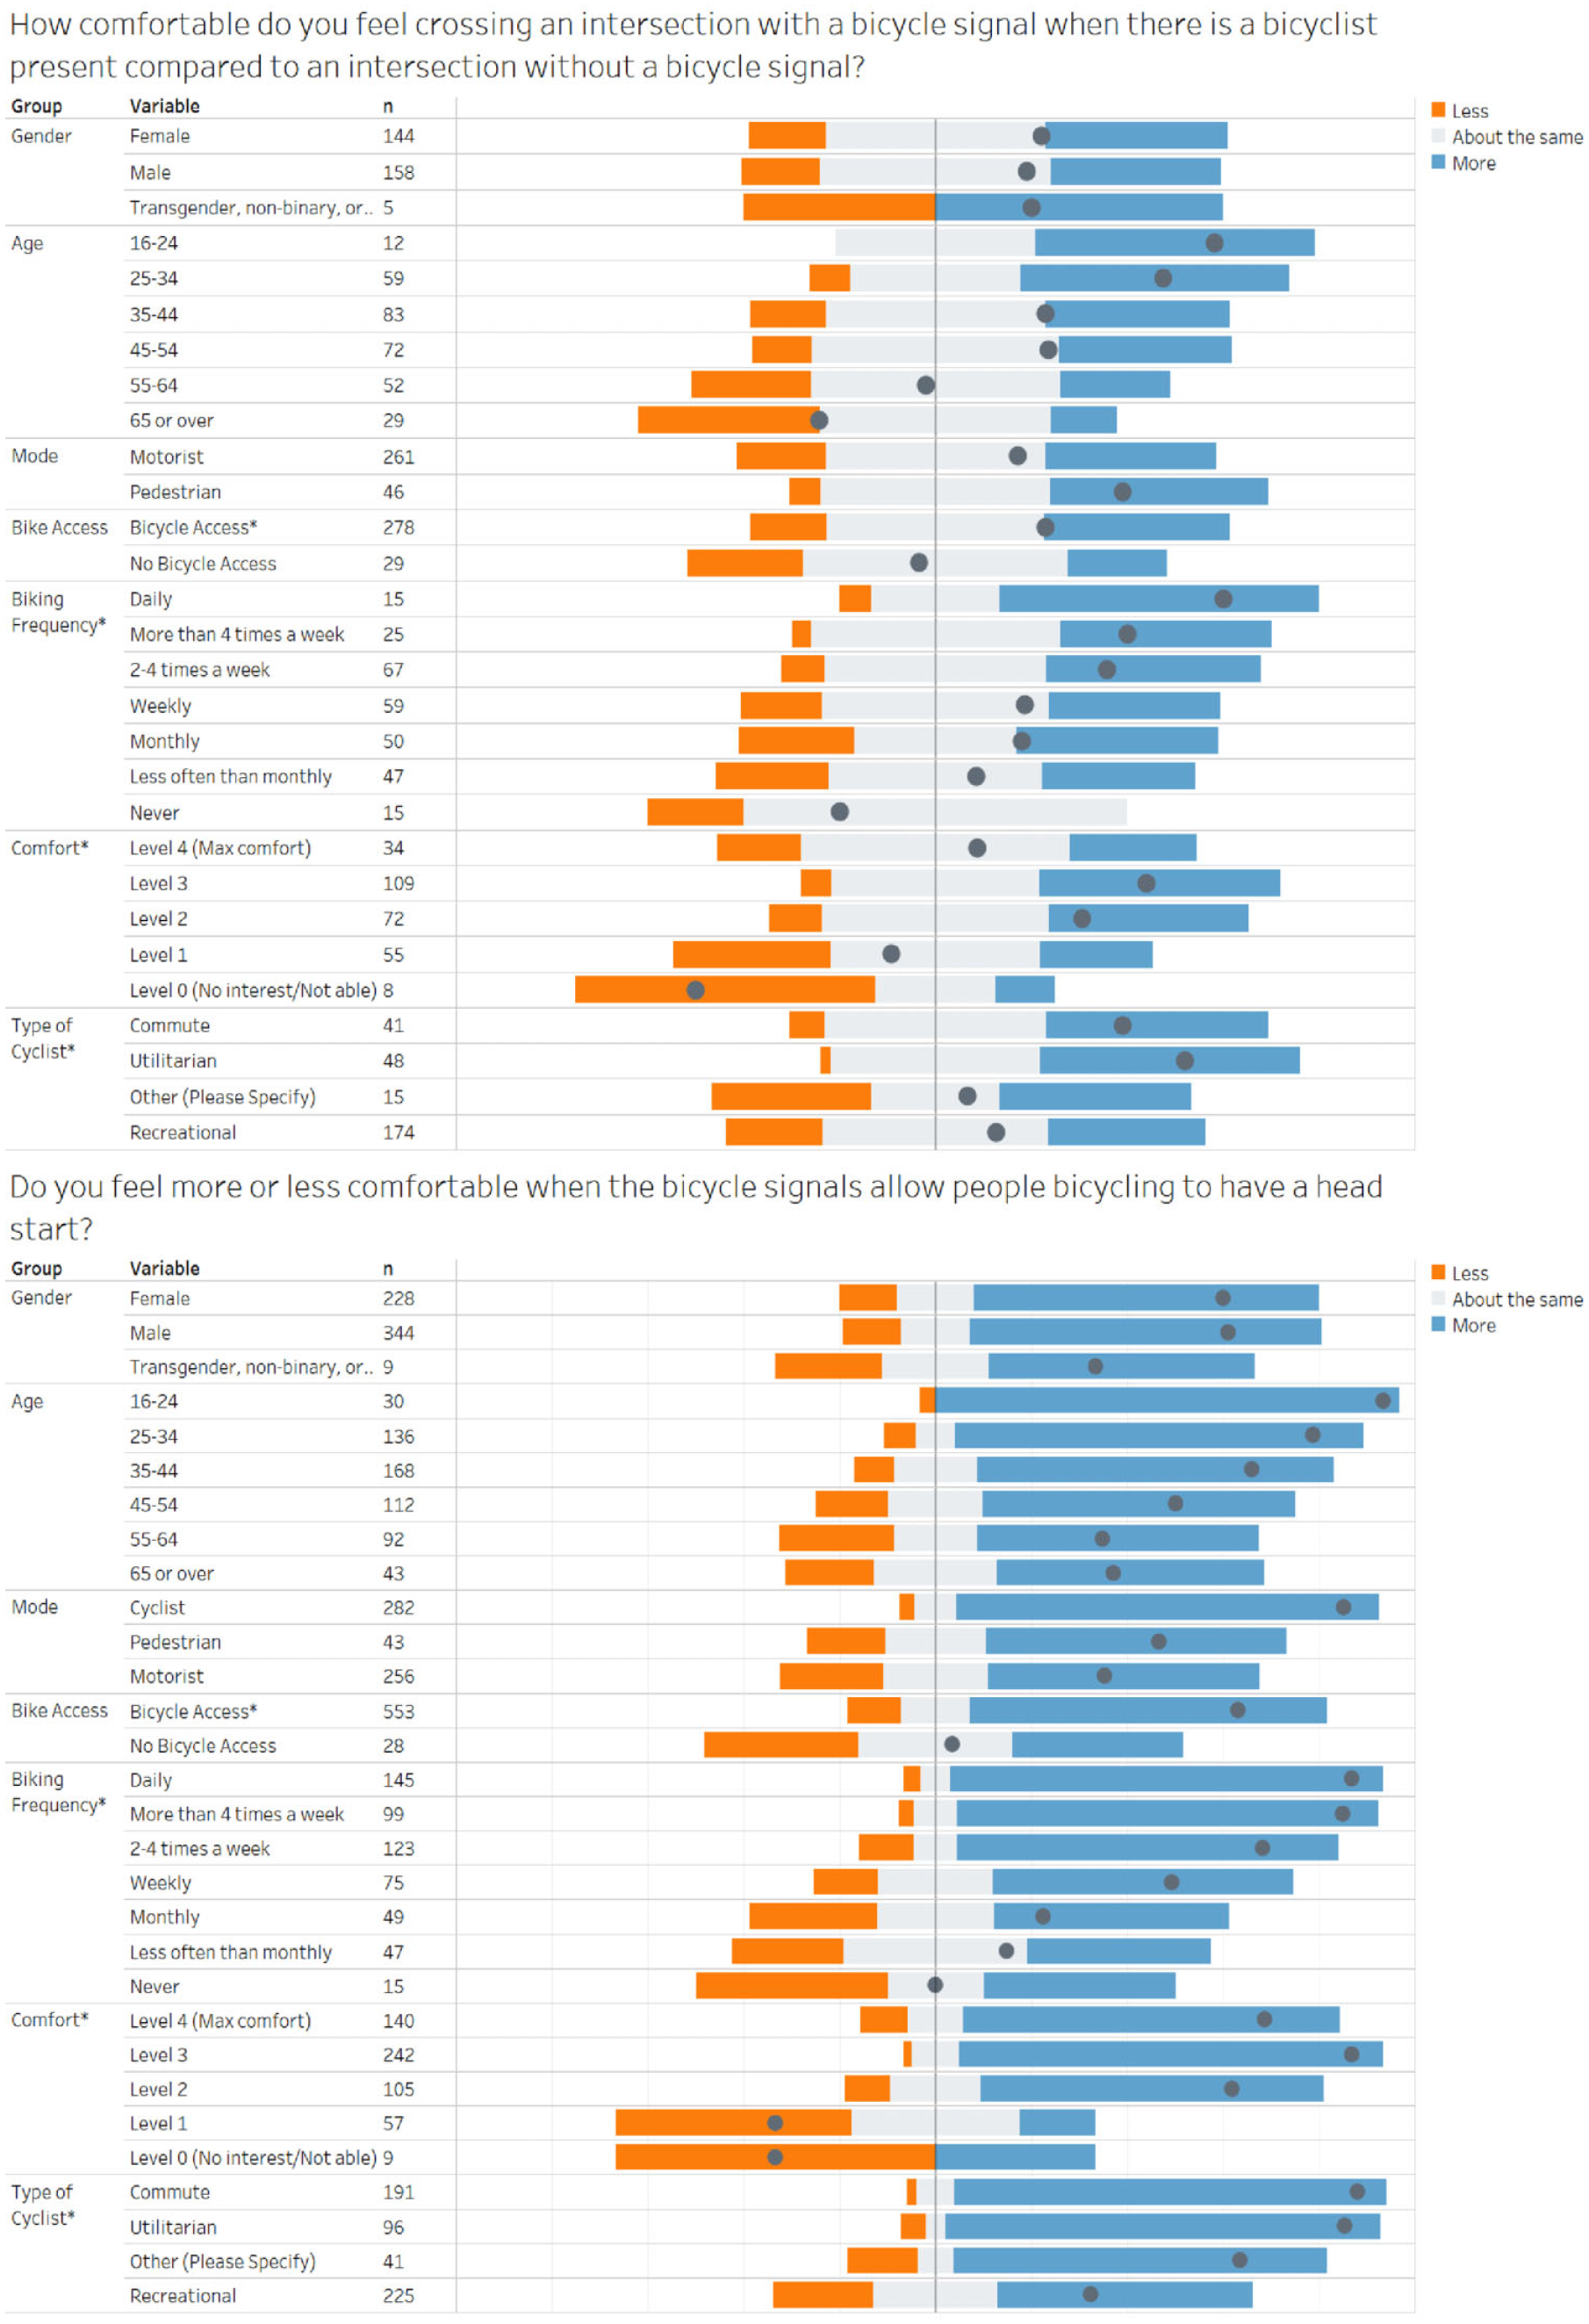
Revealed perceptions of comfort by respondent characteristics.
The response with regard to comfort with the advanced green signal for bicycles was overwhelmingly positive. The intensity of this positive view increases with decreasing age and increasing cycling frequency, see Figure 4. The “About the same” band becomes narrower with increasing cycling frequency, possibly because the issues that the advanced green signal addresses, such as preventing right hook collisions, are more noticeable to those who cycle more often. Those with no interest in cycling or who lack the ability to cycle (n = 9) and those who only want to ride on cycle lanes away from motor vehicles (n = 57) are the only groups with a negative view of the advanced green signal phasing strategy. However, in this case, even those with no access to a bicycle, who had a negative view of all the other comfort questions, leaned toward feeling more comfort with the advanced green signal for cyclists.
Perceptions of Signal Compliance
Stated Perceptions of Cyclist Signal Compliance
Most respondents generally agree that cyclists are more likely to follow traffic signals if there is a dedicated bicycle signal present at an intersection. The only groups who do not agree that the bicycle signals would improve cyclist signal compliance are those aged 65 or older, who do not have access to a bicycle, never cycle, lack the ability to cycle, or only wish to ride on cycle paths away from motor vehicles. Positive perception increases with decreasing age and with increasing cycling frequency, see Figure 5.
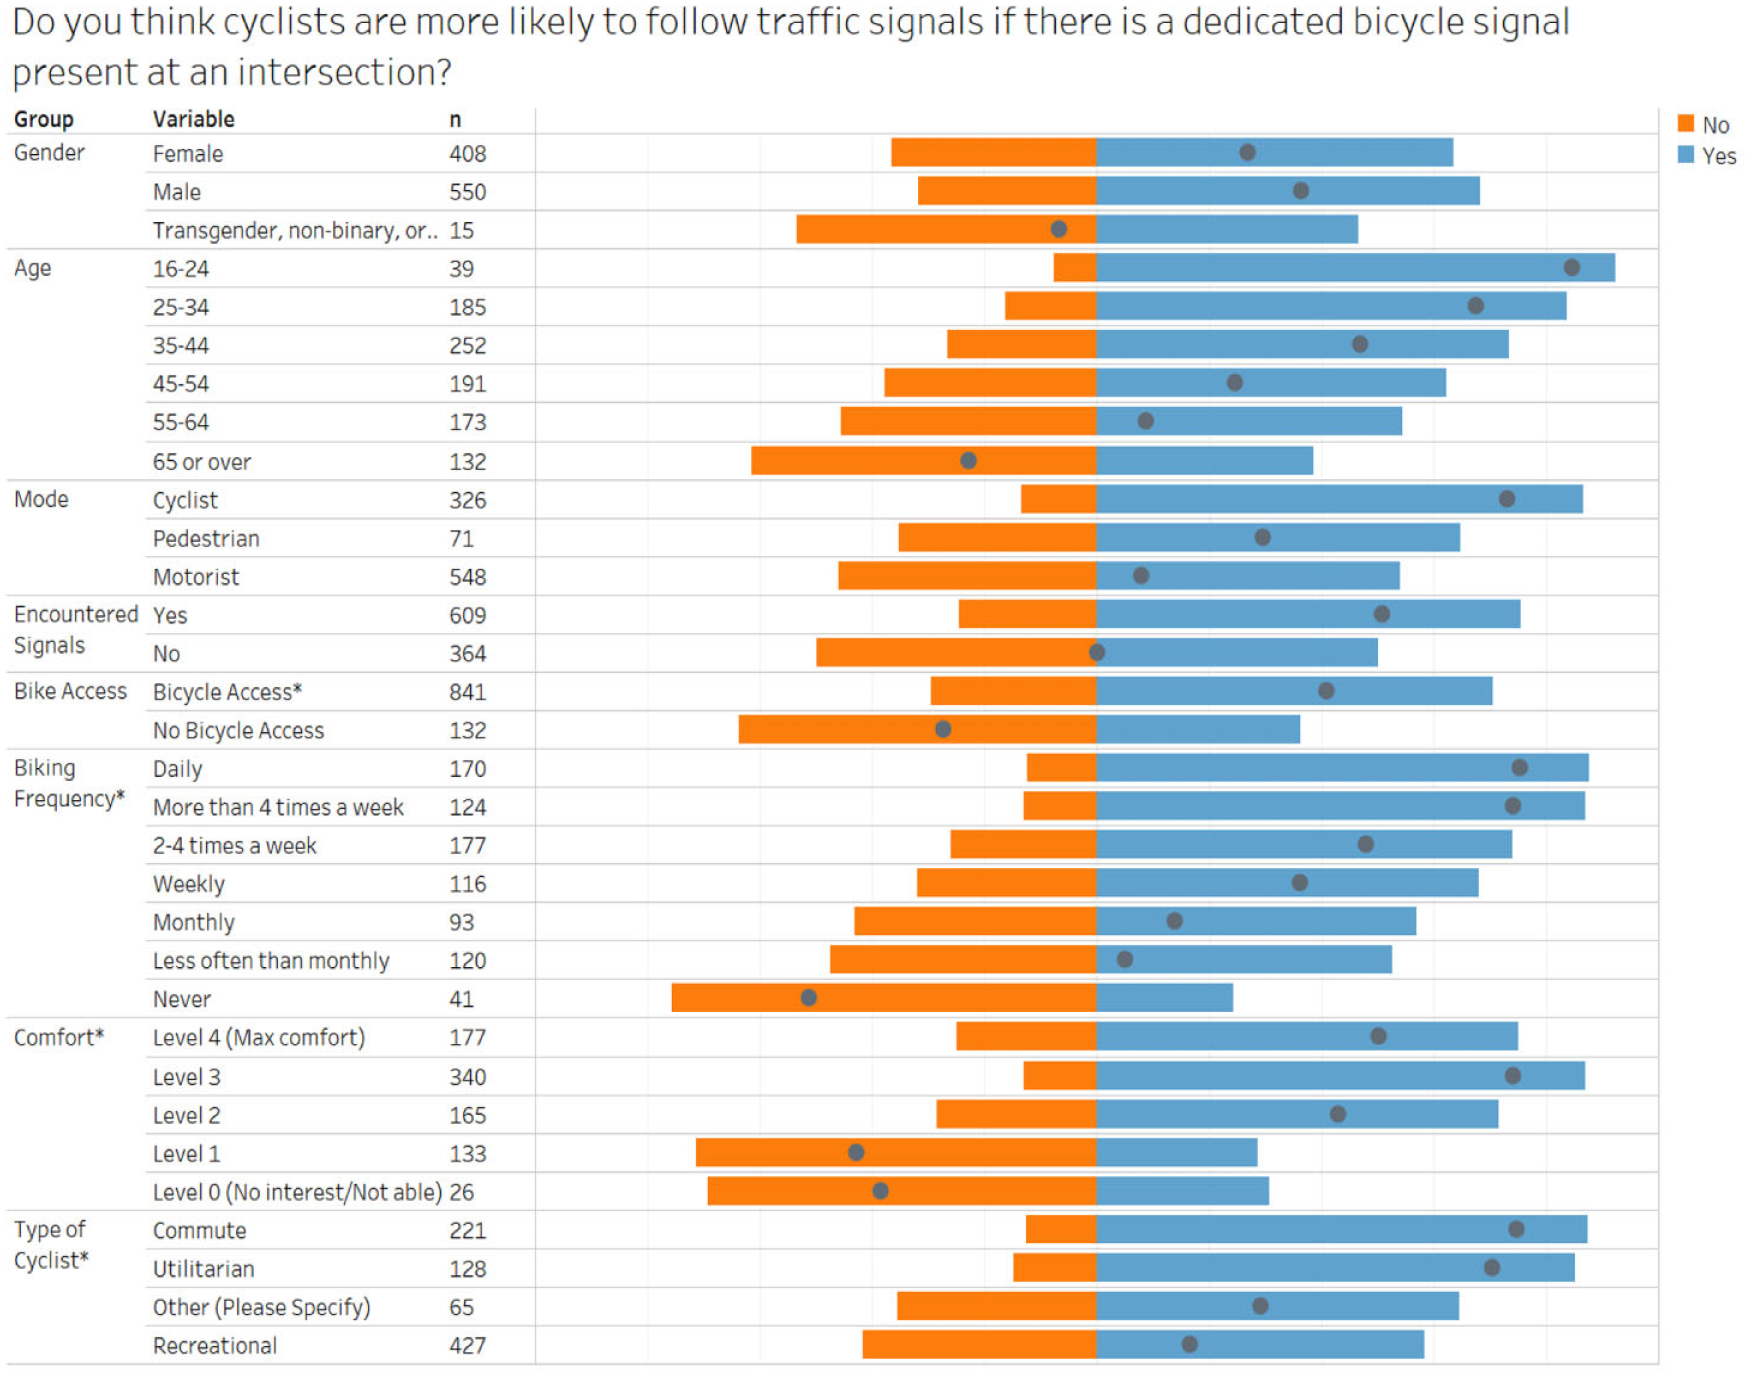
Stated perceptions of signal compliance by respondent characteristics.
Select subgroupings of the variable groups show some quite drastic opposing views on perceptions of cyclist signal compliance. For example, people who have access to a bicycle believe that cyclists are more likely to follow traffic signals, whereas people who do not have access to a bicycle believe the exact opposite. Another contradictory viewpoint concerns those who have no interest in cycling or lack the ability to do so and those who only want to ride on cycle paths away from motor vehicles (the two lowest comfort levels) as opposed to those who are willing to ride in closer proximity to motor vehicles. People with some degree of tolerance to motor vehicles believe that cyclists are more likely to comply with signal indications. Again, those who are opposed to cycling close to motor vehicles completely disagree. Respondents who have not encountered the bicycle signals (n = 364) are fairly evenly split as to whether they believe these would improve cyclist compliance. However, people who have encountered the signals show an improved perspective, with the consensus falling a long way to the right on the positive side of the response.
Revealed Perceptions of Cyclist Signal Compliance
When those who had encountered the bicycle signals were asked how often they see cyclists running red lights at intersections with and without dedicated signals, the overall response flips between mostly compliant and mostly noncompliant. Figure 6 shows a divergent Likert chart of revealed perceptions of cyclist compliance. The top chart shows that for a vast majority of the variables, the response leans toward a mostly compliant view of cyclists at intersections with a dedicated bicycle signal (the survey indicated 0 to mean “Never”). The 65 and over group (4.62), who had a stated negative perception of compliance in Figure 5, show they lean toward a more compliant perception of cyclists at intersections with bicycle signals. The only groups who revealed negative perceptions of cyclist compliance are those who never cycle (7.00), lack the ability to cycle, or who are only interested in riding on cycle paths away from motor vehicles (6.33 and 6.50, respectively).
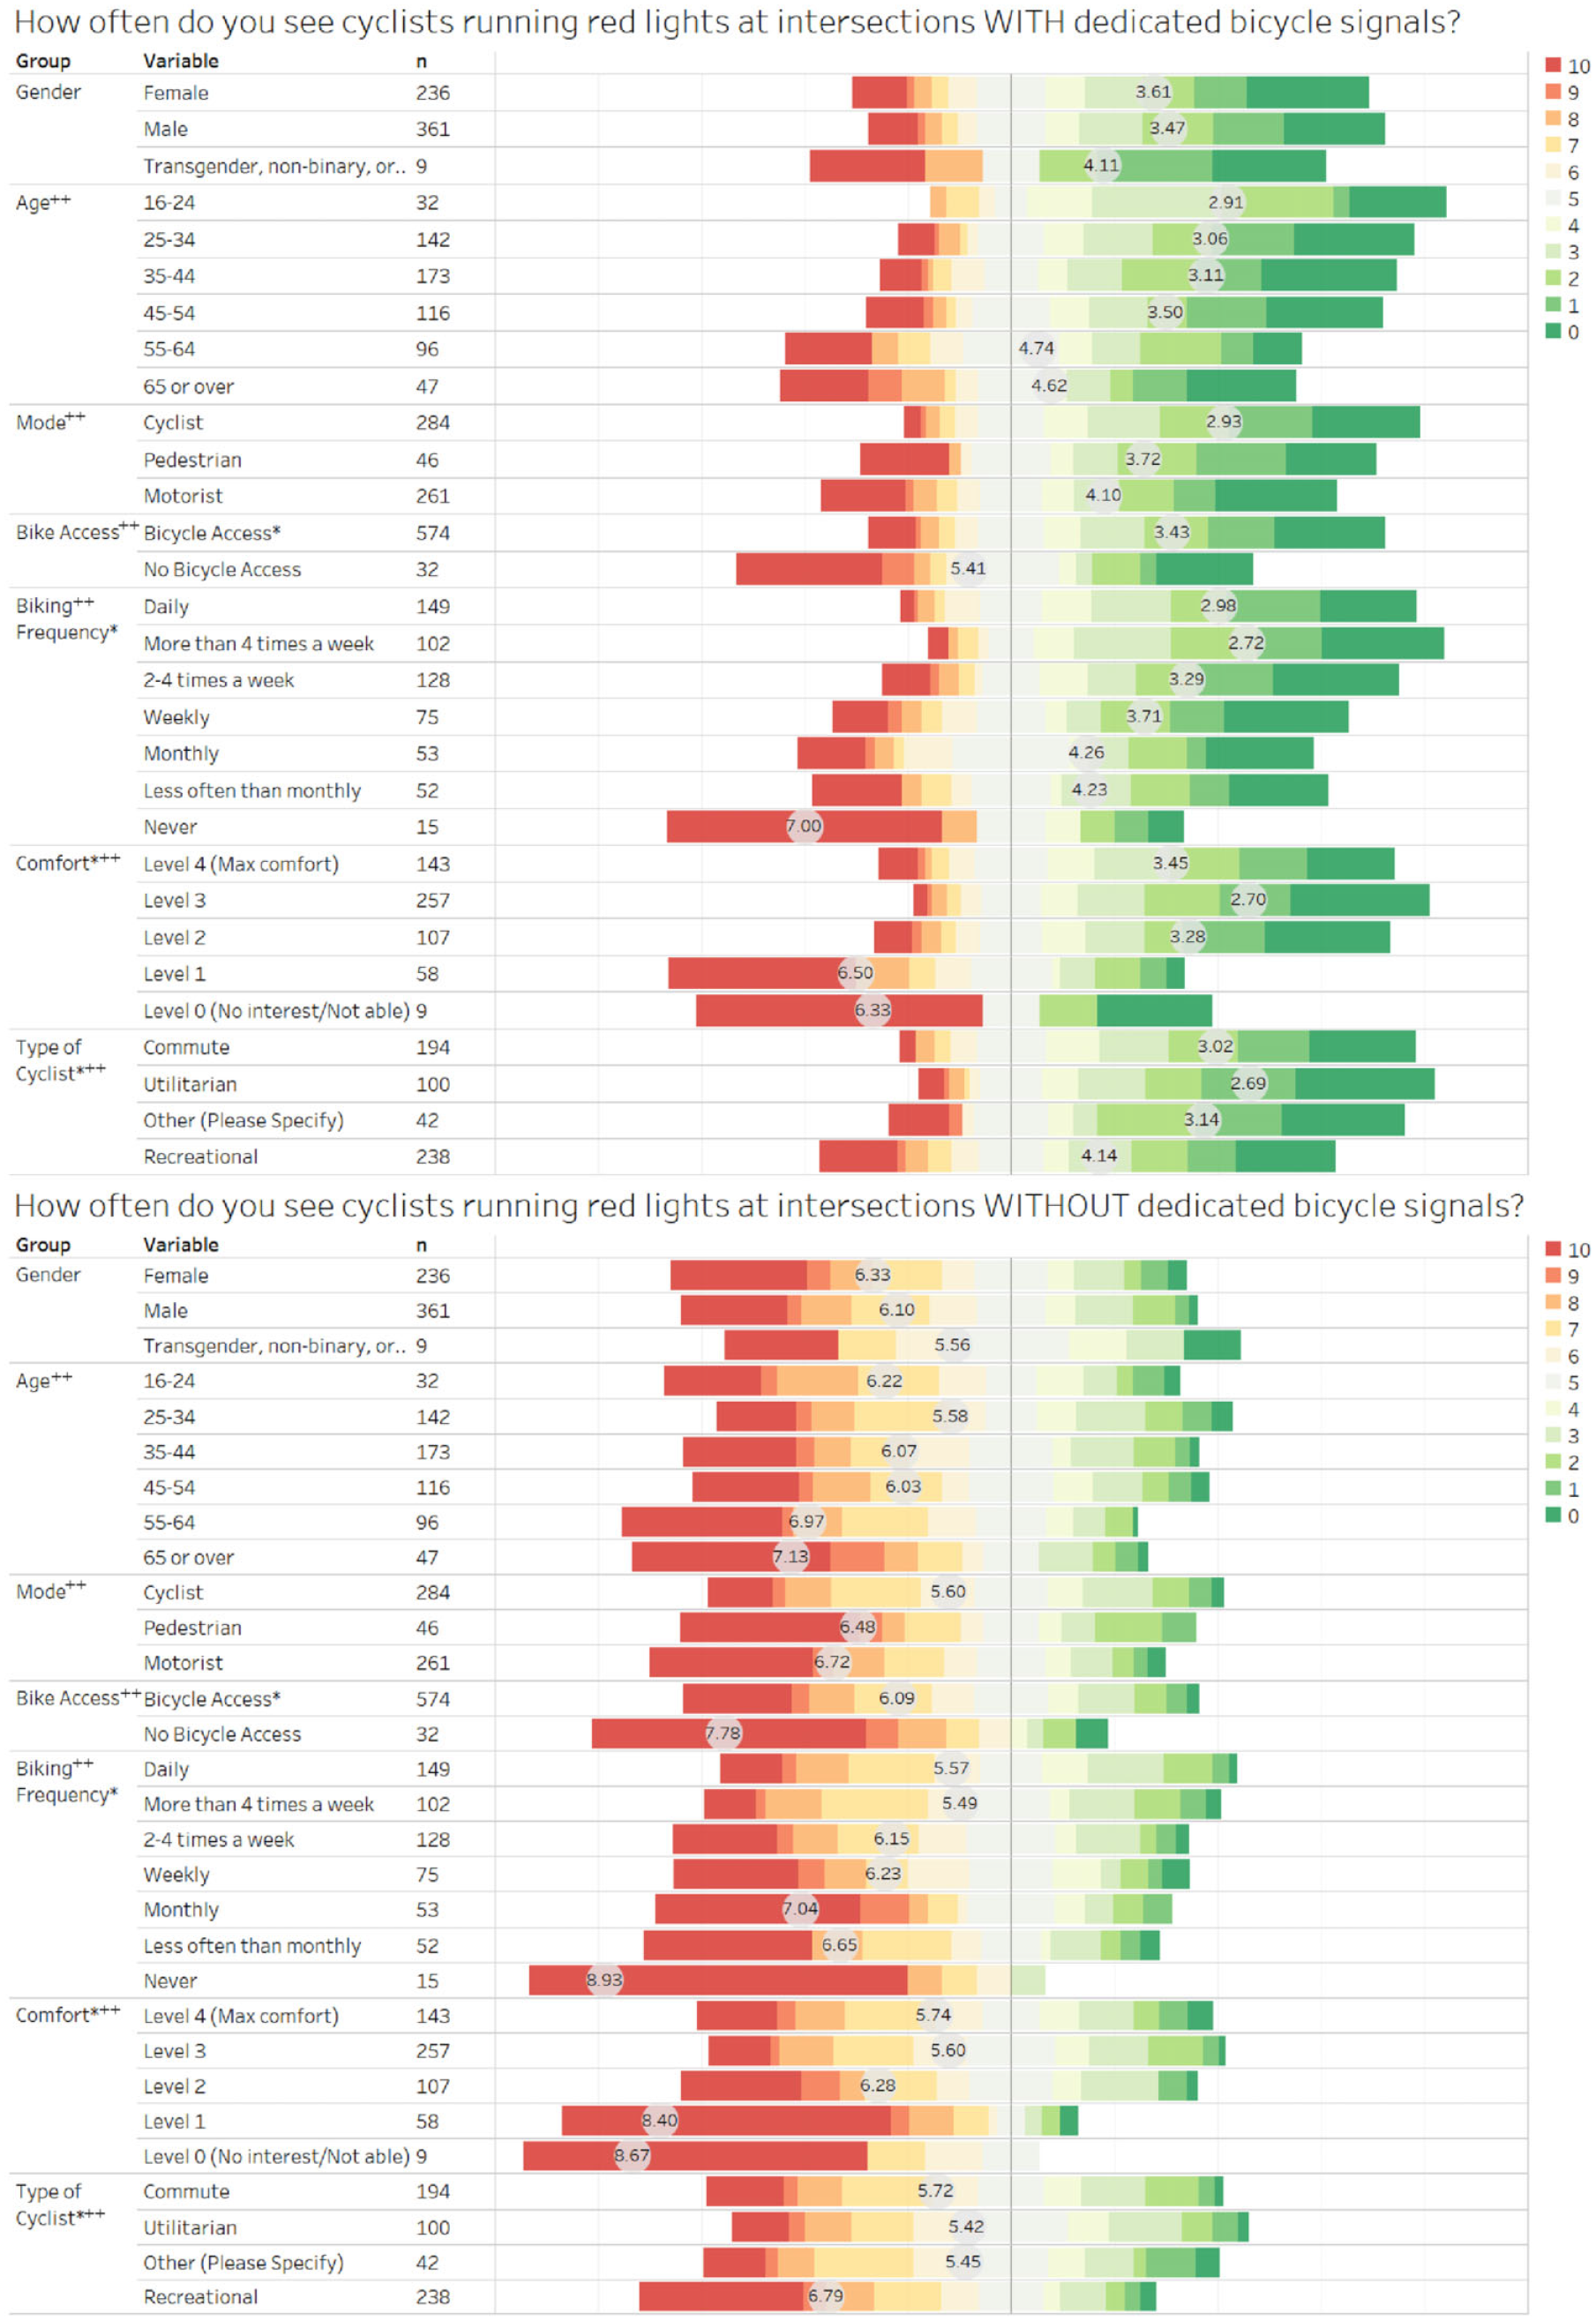
Revealed perceptions of compliance by respondent characteristics.
When asked how often they see cyclists running a red light at intersections without dedicated signals, every group flipped to leaning more toward a perception of noncompliance. All respondents lean toward seeing cyclists running signals more frequently than not. Some respondents indicated in an open-ended response that they feel the bicycle signal helps raise awareness of cyclist presence. One respondent noted that they feel they need to enter intersections without bicycle signals on red to ensure they can get ahead of waiting vehicles and make their presence known.
Perceptions of Safety
All respondents were asked to indicate whether they felt bicycle signals improved safety for cyclists crossing at an intersection, and the overall response is positive. Positive perceptions of safety increase with decreasing age and increasing cycling frequency, see Figure 7. The only groups that lean toward the negative are those aged 65 or over, those who have no access to a bicycle, those who never cycle, lack the ability to cycle, or those who only want to ride on cycle paths away from motor vehicles. Those aged 65 and over, although leaning toward the negative, are close to evenly split between having a negative and positive perception.
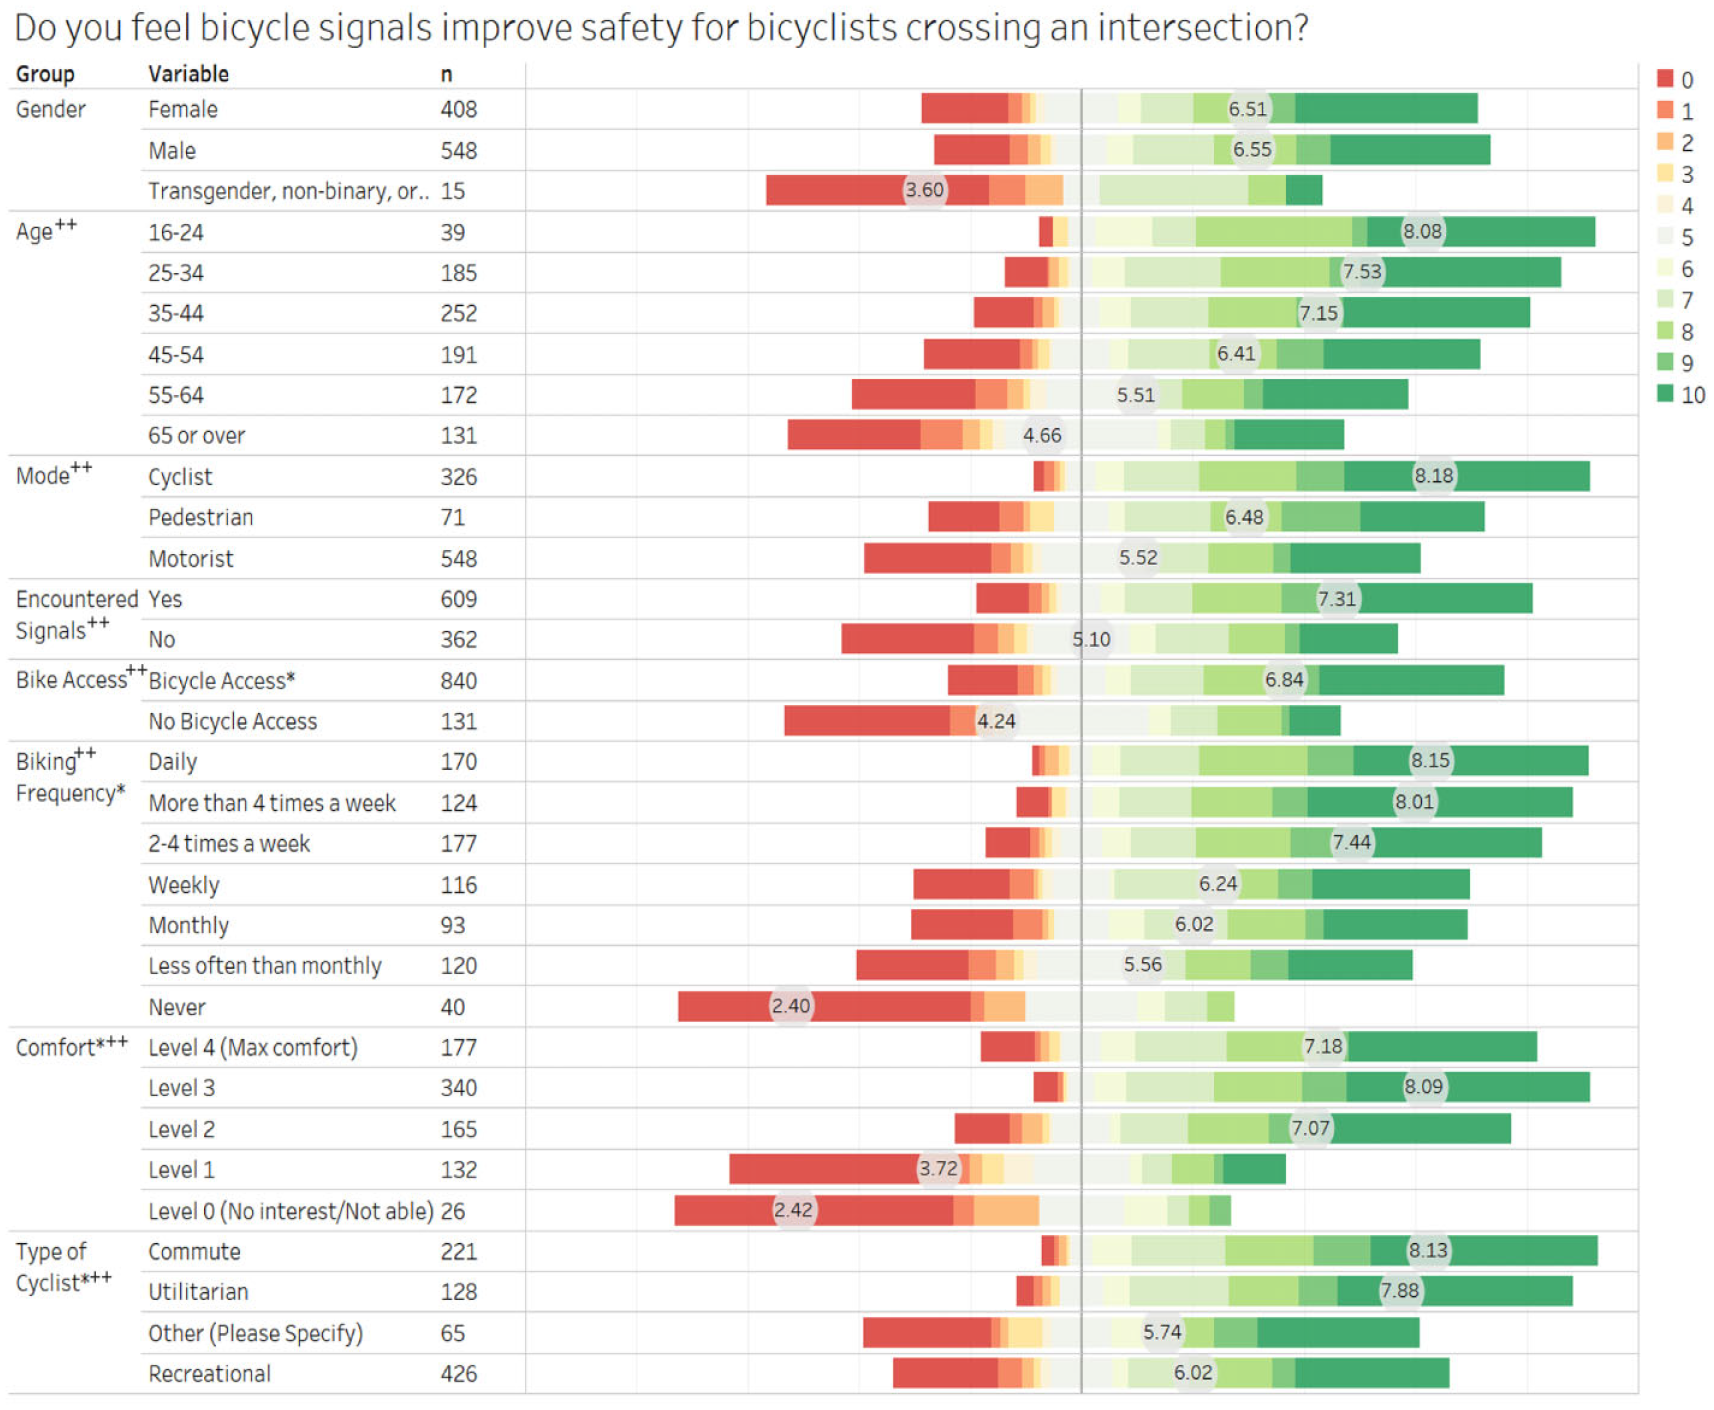
Stated perceptions of safety by respondent characteristics.
Stated Perception of Cyclist Safety
Like the other questions, the most polarizing respondent characteristics are access to a bicycle, cycling frequency, and level of comfort. The mean response jumps from well on the negative side over to the positivie side when moving from the “never” cycle category (2.40) to the “less than monthly” category (5.56). For level of comfort, the mean response for the group that is interested in cycling but only on paths away from motor vehicles (3.72) jumps from being on the negative side to being well on the positive one when there is some tolerance for low traffic volumes and low speeds (7.07).
Discussion of Results and Conclusions
The combination of stated and revealed preferences provides a useful comparison between people’s perceptions and their actual real-life experience of dedicated bicycle signals with bicycle signal faces. In general, perceptions of satisfaction, comfort, compliance, and safety with regard to bicycle signals are positive. For many of the questions, positive perceptions are more likely with decreasing age, increasing cycling frequency, access to a bicycle, or an encounter with the experimental bicycle signals. Perceived safety and comfort can influence a person’s mode choice and, therefore, potentially influence whether more people decide to use new and unfamiliar facilities. From a planning and engineering standpoint, understanding how the public feel about a new control device can guide decisions on whether to continue installing more of the same.
The survey revealed overall satisfaction with the signals for almost all groups. The survey respondents’ view of overall satisfaction with the bicycle signals is positive to very positive among almost all the categories, indicating that people are happy with them.
With regard to perceptions of comfort, people generally agree that comfort improves in both the stated and revealed questions. Not every group that believed comfort improved with a dedicated bicycle signal felt they would cycle more. For the stated comfort questions, people who are aged between 55 and 64, cycle less than monthly, or are recreational riders agree that comfort improves with bicycle signals. However, they do not believe they would cycle more if they had bicycle signals near them. For the revealed comfort questions, motorists and pedestrians lean toward comfort improving with bicycle signals, despite a wide band representing the “About the same” response. With regard to advanced green signals for bicycles, the overall response was overwhelmingly positive. In this case, even those who had no access to a bicycle, who had a negative view for all the other comfort questions, leaned toward feeling more comfortable when this was installed.
The overall perception of signal compliance and safety in relation to bicycle signals is positive for both the stated and revealed preference questions. Respondents generally agree that cyclists are more likely to obey traffic signals if there is a dedicated bicycle signal present at an intersection. The only groups who do not agree that the bicycle signals would improve cyclist signal compliance are those 65 or older, those who do not have access to a bicycle, never cycle, lack the ability to cycle, or who are only interested in cycling on paths away from motor vehicles. When those who had encountered the bicycle signals were asked how often they saw cyclists running red lights at intersections with and without dedicated signals, respondents overwhelmingly agreed that cyclists complied with signals at intersections with dedicated signals and did not comply at those without them. Finally, there is an overall positive perception of safety, but the most polarizing respondent characteristics are access to a bicycle, cycling frequency, and level of comfort.
Footnotes
Acknowledgements
The authors thank Aleksiina Chapman, Dylan Johnstone, and Renee Orr for their support in carrying out this study. The authors also gratefully acknowledge the survey participants and the undergraduates who helped with debugging the survey instrument.
Author Contributions
The authors confirm contribution to the paper as follows: study conception and design: N. Wilkes, C. Baumanis, R. Machemehl; data collection: C. Baumanis; analysis and interpretation of results: C. Baumanis; draft manuscript preparation: C. Baumanis, J. Hall, R. Machemehl. All authors reviewed the results and approved the final version of the manuscript.
Declaration of Conflicting Interests
The author(s) declared no potential conflicts of interest with respect to the research, authorship, and/or publication of this article.
Funding
The author(s) disclosed receipt of the following financial support for the research, authorship, and/or publication of this article: This research was supported by the City of Austin and the Center for Advanced Multimodal Solutions Grant Number: 69A3551747133.