
Abstract
Our foremost purpose with this research is to specify a new method of freight optimization that shippers can utilize to satisfy their budget conditions while confronting the market’s necessities. This paper designs an optimization model for tactical planning that minimizes the cost of highway transportation operations. The findings and analysis of China and Pakistan’s shipping sectors shed light on the implications of cost trade-offs between multimodal and intermodal transportation. As this study is based on the ExWorks incoterms, we developed a mixed-integer linear programming (MILP) model to formulate the cost-minimization problem, bearing in mind the internal cost constraints of transportation. The Pareto optimal solutions are generated by a multi-objective genetic algorithm (MOGA) in the MATLAB optimization solver with the support of the Pareto fitness function to balance the costs of multimodal and intermodal transportation in delivering 40 ft container units from China to Pakistan. The solution to the problem demonstrates that the cost of multimodal freight transportation is higher than that of intermodal freight transportation. However, significant changes occur when rail carrying capacity is increased. The cost of intermodal transportation for a 40 ft container from Shanghai, China, to Kasur, Pakistan, is 4712 USD, while multimodal transportation costs 7119 USD. Additionally, this study can be expanded by examining transit times associated with multimodal and intermodal freight distribution for imports and exports.
Keywords
Road transportation is the most frequent means of freight movement, accounting for over 60% of global domestic freight flow ( 1 ). It has a detrimental influence on sustainability because of its extensive use ( 2 ). Its broad use has a negative influence on sustainability ( 3 ). Road transportation accounts for 93% of all external transportation expenditures, which include costs related to accidents, air pollution, the changing climate, noise, congestion, and delay. Other external expenses linked with road traffic include the cost of producing gasoline and energy, the cost of restoration, and the time wasted on nonmotorized travel ( 4 ).
The importance of trade volume (imports and exports) in Pakistan as a bordering country of China cannot be overestimated ( 5 ). According to World Bank reports, in 2021, total imports had risen to over 60 billion USD, as shown in Figure 1, which also shows the figure as a percentage of gross domestic product (GDP) from 2000 to 2021 ( 6 ).
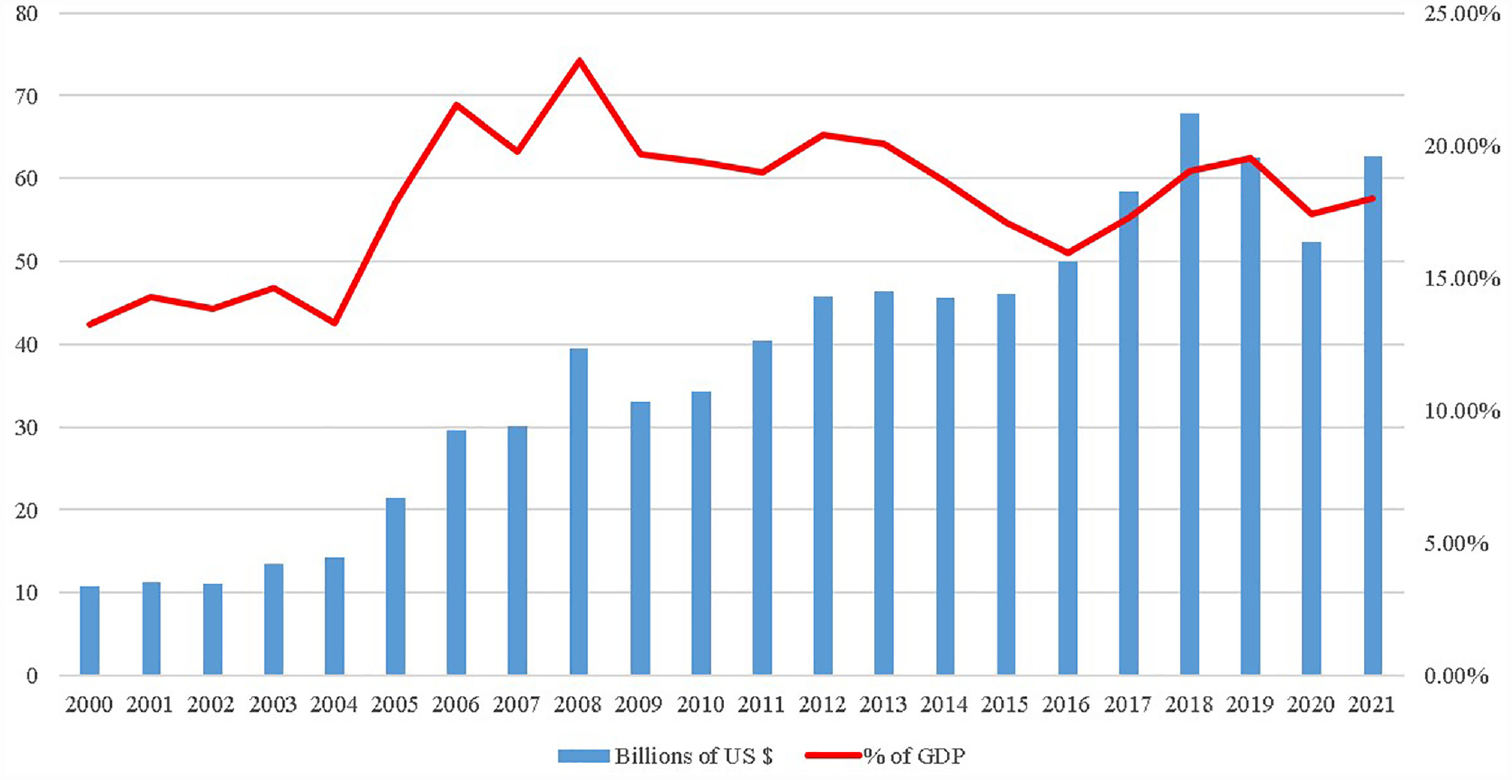
Pakistan’s total imports growth from 2000 to June 2021, and the percentage change of gross domestic product (GDP).
Figure 2 displays Pakistan’s total imports in billion USD with the percentage change from 2000 to 2021. In the past 5 years, imports have reached an all-time high. In addition, the percentage change in imports indicates an overall upward trend in imports.
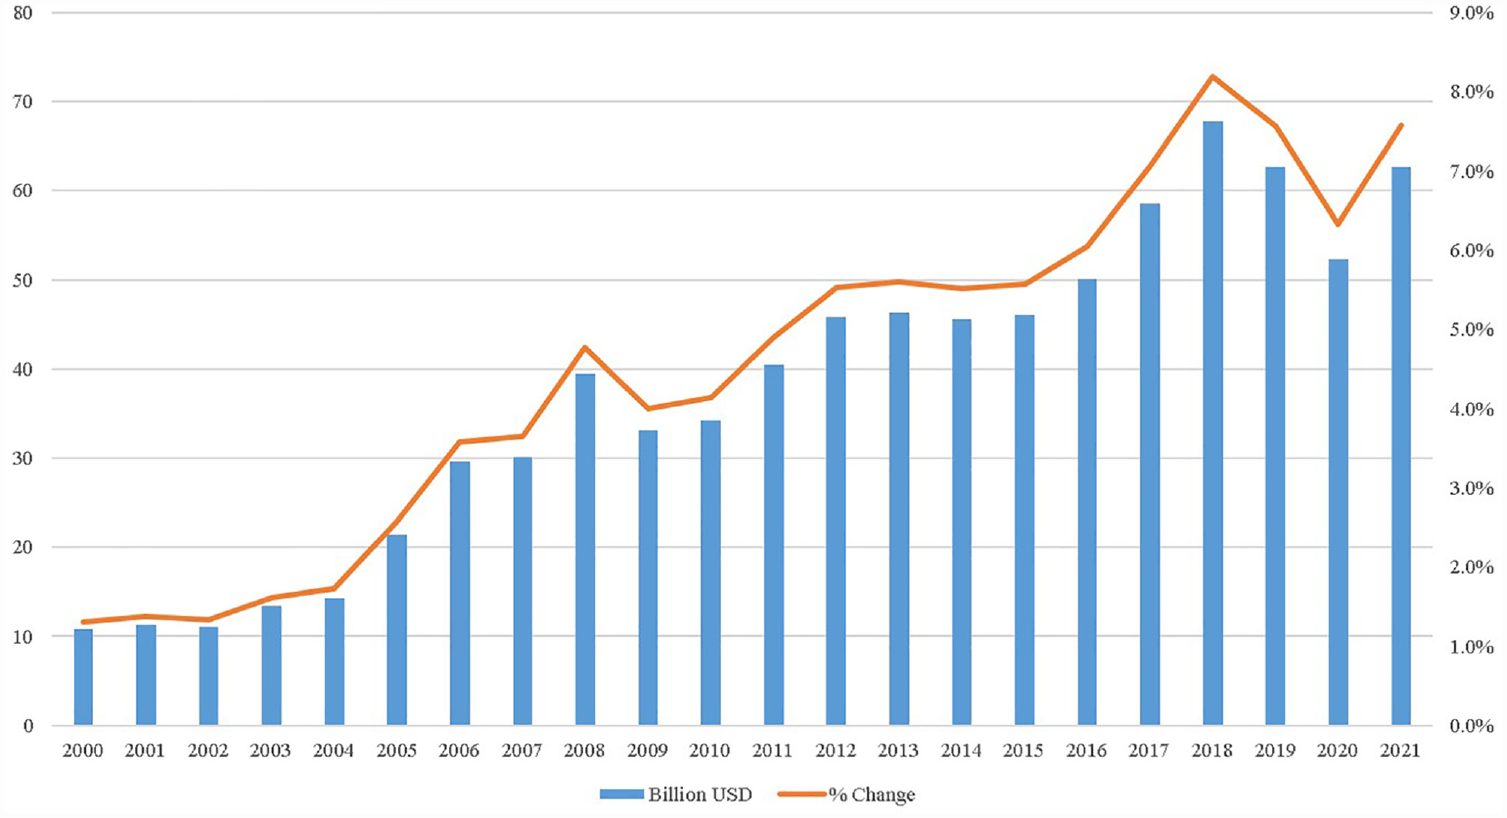
Total imports data of Pakistan 2000 to 2021 with percentage change in imports (billion USD).
According to official figures, China’s exports to Pakistan, were worth 22 billion USD at the end of 2021, an increase of 4% from 2020 and a 12% increase in the total imports since 2000. The state bank of Pakistan publishes the total imports from China and imports from other countries every month ( 7 ). Figure 3 depicts the trend of Pakistan’s total imports from China.
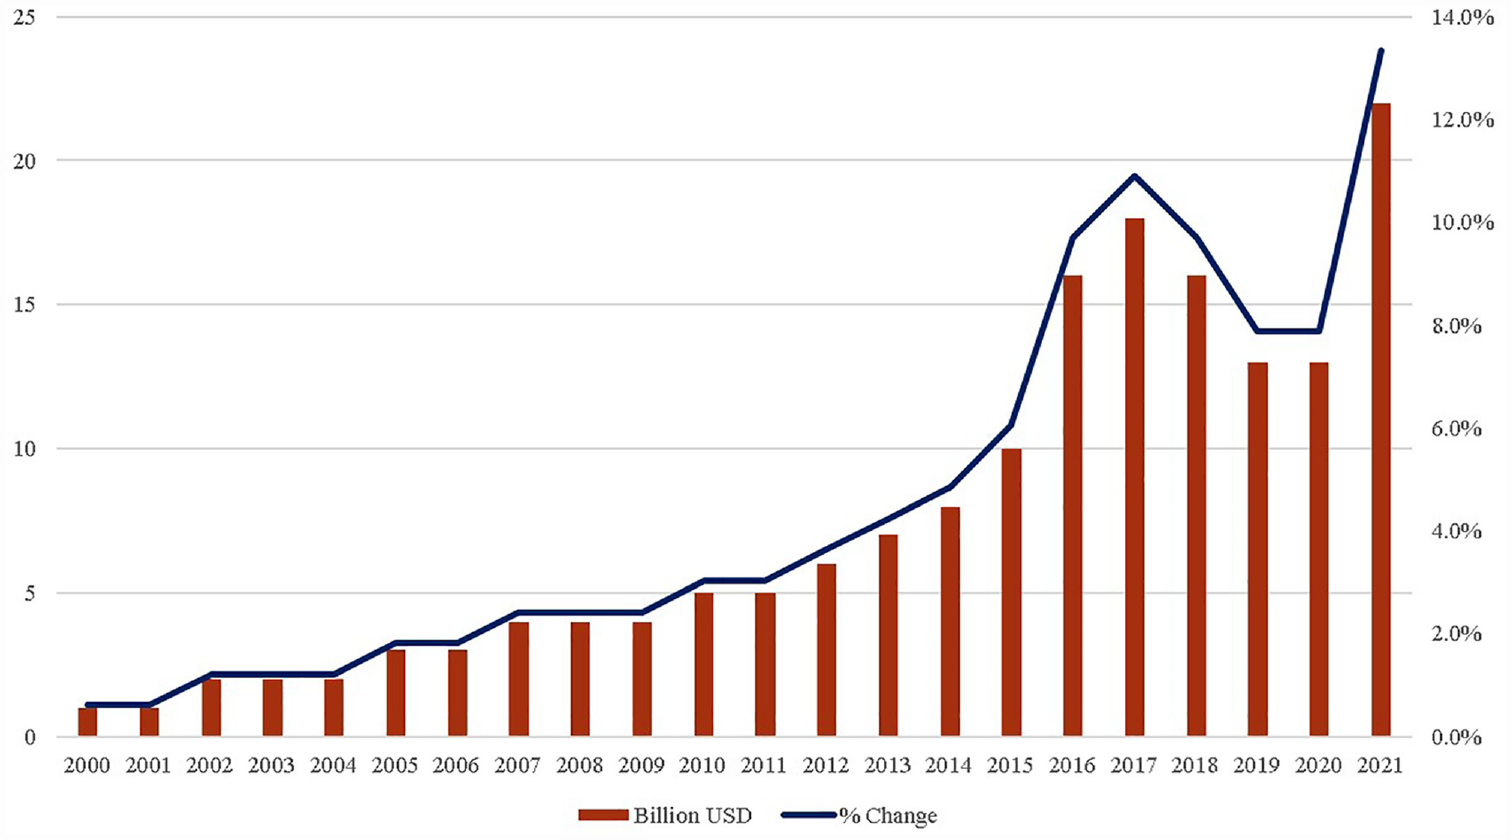
Pakistan’s total imports from China from 2000 to 2021.
The rising cost of transportation has become a major problem for a wide range of industries and organizations around the world. Ocean freight costs will have risen rapidly in 2022 because of port lockdowns and closures. It is critical to figure out what is causing this increase ( 9 ) and how it will be managed. Since September 2020, ocean freight has risen rapidly on nearly all trading routes.
The supply chain has been disrupted by a rise in freight charges and a shortage of containers in Pakistan ( 10 ). As a result, the beneficial effects of the government’s efforts to keep the economy moving forward throughout the pandemic have been diminished. The depreciation of the Pakistani rupee has significantly affected the cost of imported raw materials, resulting in a decrease in industrial output and an increase in the cost of finished items ( 11 – 13 ). Shipments have been delayed because of high freight costs, overcrowding in ports, and a lack of ships and containers. As a result, manufacturers and exporters have no choice but to pass on the increased production costs to their customers. It has been shown that global freight expenses have increased by an average of 400% to 600% over the past few years, along with significant delays in the delivery of goods. However, studies such as ( 14 ) confirm the impact of high road transportation costs on the overall cost of transportation compared with the intermodal and multimodal networks.
This study aims to aid in minimizing supply chain costs because cost minimization is a top priority in today’s logistics, transportation, and supply chains. This research will assist decision-makers in top management in industry, law- and policymakers, freight forwarders, and production planners in selecting the optimal cost decision for the delivery of full container units or less-than-full container units for the import or export of goods (especially to the industries producing huge volumes such as paper and board industries with an annual production of millions of tons). As a preliminary study on Pakistani transportation and logistics, this report will serve as a foundation for future research on developing a cost framework. In addition, Pakistan’s imports are expanding (the highest imports in 2021, such as an all-time high of 100% in November 2021). However, rising global fuel prices are affecting transportation rates, and researchers have confirmed that road transportation is expensive ( 14 ). Therefore, this study provides solutions to minimize transportation costs in the freight industry. The key contributions of this research are as follows:
Developing a mixed-integer linear programming (MILP) model for multimodal and intermodal transportation operations between China and Pakistan;
Investigating the intermodal and multimodal transportation networks in the Pakistan–China transportation sectors by using real-world data which takes into account the objective of cost minimization;
Providing cost breakdown analysis of multimodal transportation;
Providing cost breakdown analysis of intermodal transportation;
Generating Pareto solutions for decision-makers who can then easily identify sustainable solutions using a multi-objective genetic algorithm (MOGA) for the cost-minimization MILP problem;
Comparing Pareto solutions of transportation networks applied in the study.
This paper is divided into six sections. The next section provides a literature review of intermodal and multimodal transportation, methods, imports and exports, and solution methods utilized in the literature. The third section contains detailed information about the mathematical model’s assumptions for the bi-objective intermodal and multimodal transportation problems, the technical background for defining the problem in a real-world scenario, and some information about the solution methodology. The fourth section details the initial data and a few parameters used in the calculations. The fifth section summarizes the outcomes of the real-world case and compares two distinct modes of transportation. Finally, the sixth section describes the problem and suggests some possible next steps.
Literature Review
Intermodal transportation is one of the most environmentally friendly and cost-effective modes of transportation ( 15 ). Several distinct trends have emerged in the freight transportation sector. In numerous regions of the globe, new brands are appearing, and the customer base is expanding. In contrast, various trade laws facilitate and expedite international trade ( 16 ). After the 2008 financial crisis, numerous industries conducted audits to reduce costs and boost performance. Shipping, transportation, and logistics service providers (LSPs) have been urged to reduce expenses without sacrificing quality. Increasing cooperation and integration has long been viewed as a means for businesses to better utilize their resources. Intermodal freight transportation is considered to be more environmentally friendly than unimodal systems because of the numerous advantages offered by the modes of transportation it uses ( 17 ).
As a result of the expansion of global trade and the increase in the volume of transportation, the transportation system can facilitate a shift from automobiles to more environmentally friendly modes of transportation, such as rail and sea ( 18 ). This will reduce external costs for these transportation companies, such as those related to congestion, noise, and accidents. However, building an intermodal transportation network is more complicated than operating a unimodal system because it requires the participation of multiple partners and decision-makers to ensure the intermodal system’s reliable operation. Recent research has focused on the numerous constraints that impede the design and operation of intermodal logistics networks and their future expansion. According to the findings, many intermodal providers choose to set their shipping rates based on profit maximization, despite predicting how their customers will react if they choose the road option ( 19 ).
Intermodal shipping means transporting cargo by two or more forms of transportation ( 20 , 21 ). One of the most productive strategies implemented to minimize the negative environmental impacts of road transportation is to encourage freight transportation to take place via more cost-effective modes of transportation, such as those used by intermodal transportation ( 22 ). Rail, inland waterway, and short maritime transport shipping are the main modes of intermodal transportation, whereas road usually serves as the final leg and pre-haulage ( 23 ). A good example of the United States government’s assistance in this area is its support for a program that seeks to establish a national intermodal transportation system in the country, which will help to move people and goods in an economically and environmentally sound manner ( 24 ). To compare 36 potential transportation paths from China to the Indian Ocean, researchers have been creating an intermodal networking optimization model. The proposed model takes into account several objective functions, some of which conflict with one another, including the minimization of transport costs, transit times, and variances, and the maintenance of continuity and suitability between the flow nodes of rail, road, and waterway transport. The most desirable routes are determined by an intermodal transportation network that links four key locations in India to two major starting points in China. The study results indicate that developing new routes in Asia may affect existing transportation patterns and increase competition ( 22 ). Table 1 shows some key existing studies for comparison with our study.
Key to Existing Studies, Methods, Solutions, and Regions
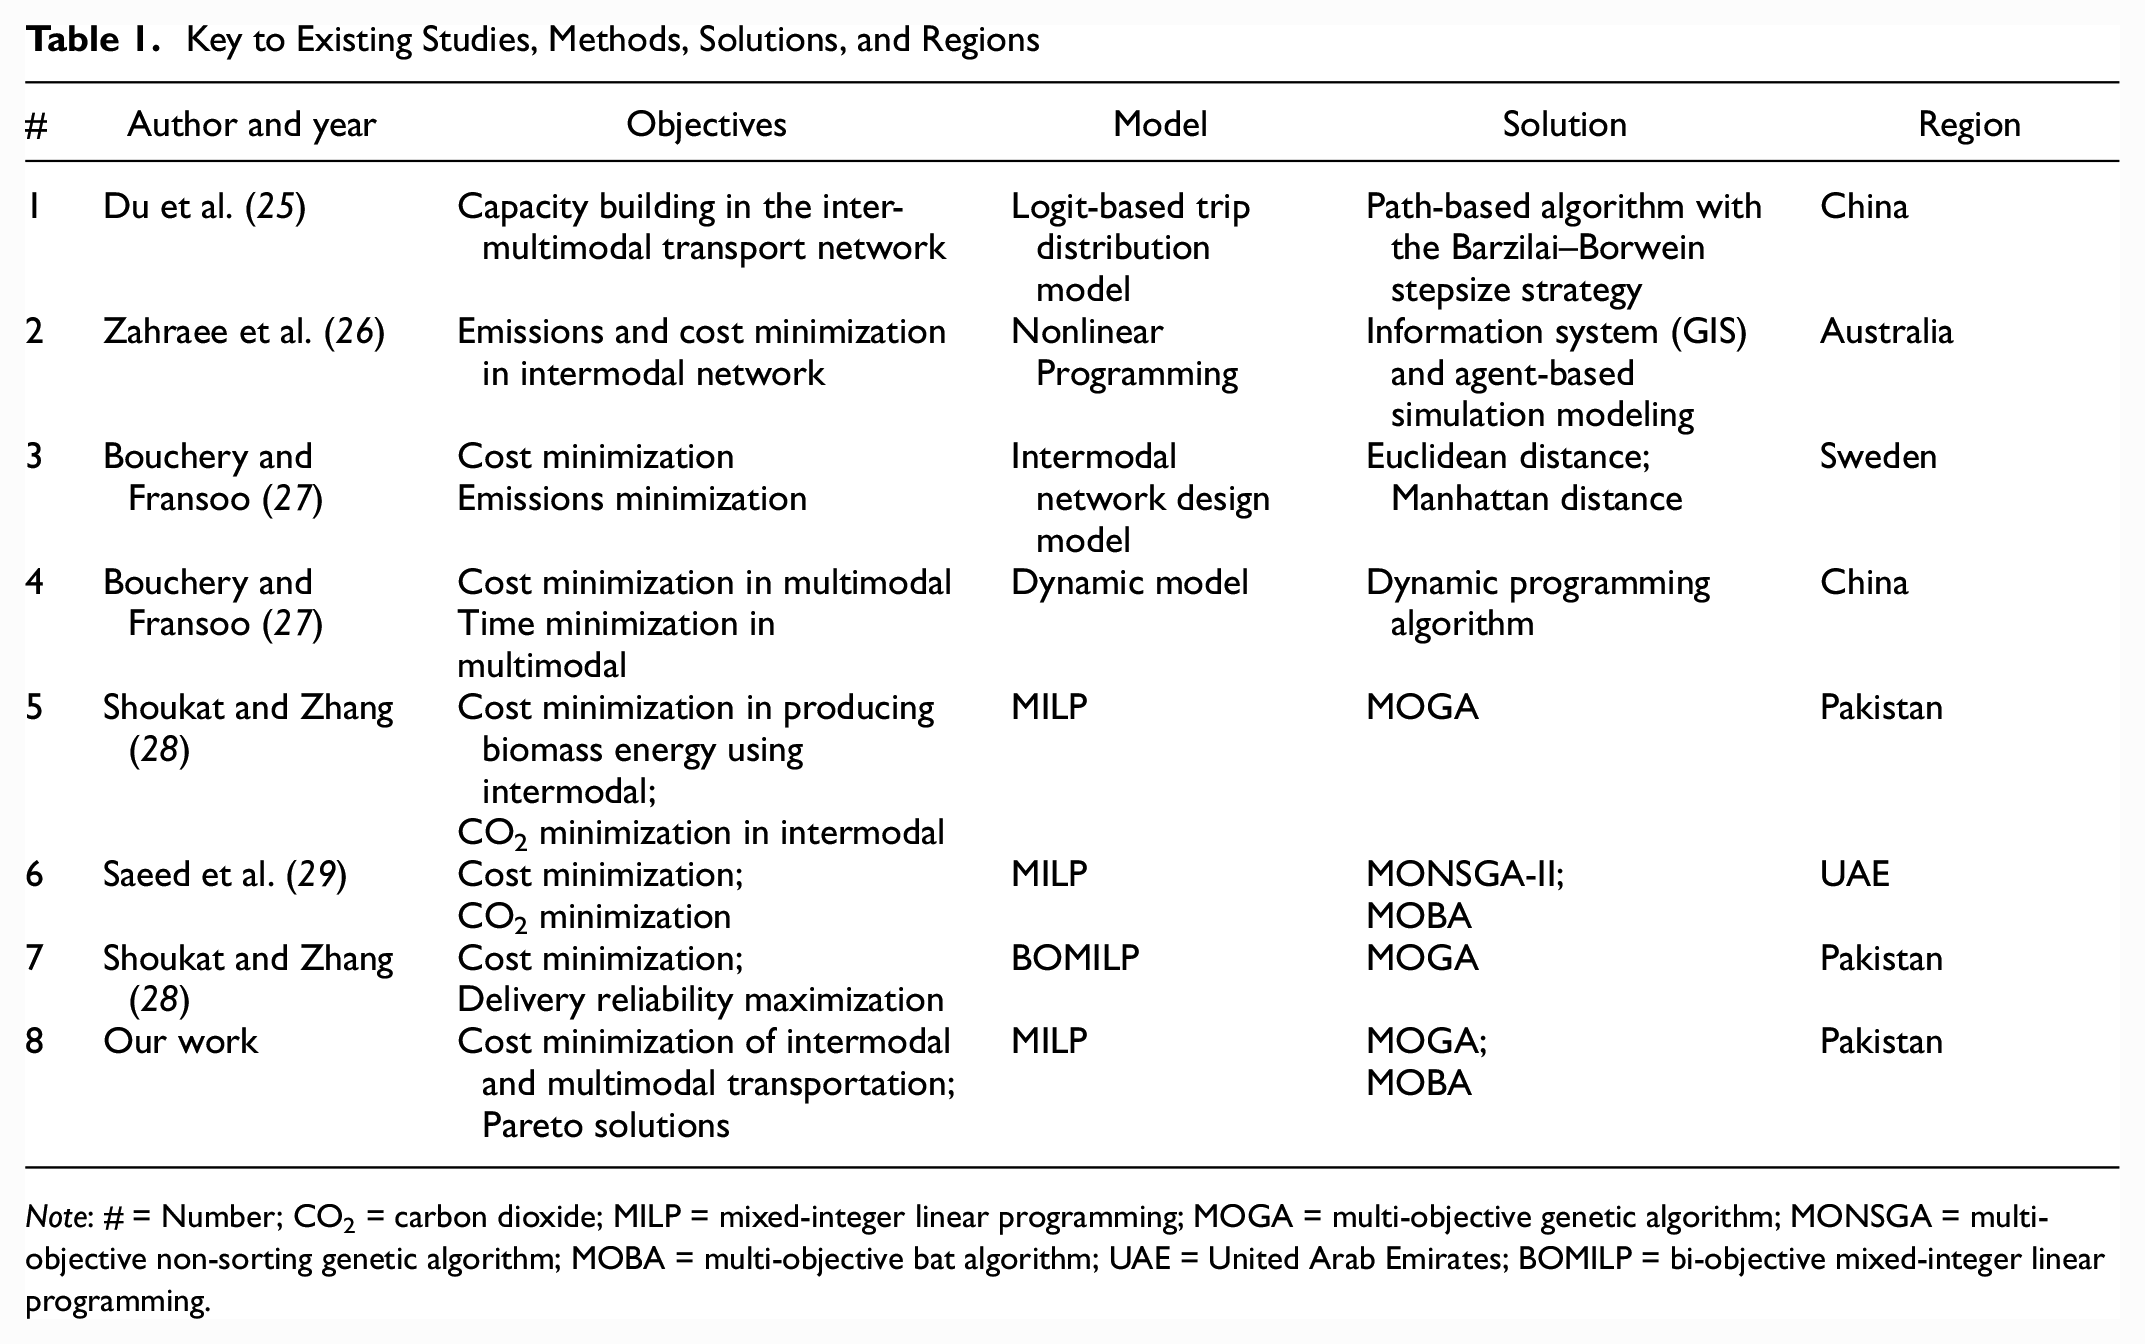
Note: # = Number; CO2 = carbon dioxide; MILP = mixed-integer linear programming; MOGA = multi-objective genetic algorithm; MONSGA = multi-objective non-sorting genetic algorithm; MOBA = multi-objective bat algorithm; UAE = United Arab Emirates; BOMILP = bi-objective mixed-integer linear programming.
Import and Export in China and Pakistan
Including road transportation, the shipping industry transports more than 80% of all world trade, making it a vital component of international trade development. Import and export of large quantities of goods require shipping containers, as they allow the transportation of goods ( 21 ). Additionally, China is a significant factor in the oil industry, and the security of the oil supply chain is central to its policies. Of China’s oil supplies, 77% arrive by sea, and 83% of these sea-borne shipments pass through the Malacca Strait, which the country will want to avoid becoming a choke point. Nearly three-quarters of China’s oil imports arrive by sea, with nearly two-thirds passing through the Malacca Strait, which is vulnerable to bottlenecks. During the reform and opening-up period, the Chinese economy has grown almost every year, with average annual GDP growth of nearly 9.8%, and with annual GDP growth exceeding 10% after 1992, demonstrating China’s continuing commitment to economic openness ( 30 ).
The studies on transporting goods have recently become more focused on the emerging markets of China and other Asian countries. The distribution process from the manufacturer to the dealer is known as “outbound logistics.” In comparison, “inbound logistics” refers to the supply chain processes that occur between vendors and manufacturers ( 31 ).
With the growing export of Chinese products, when it comes to moving goods from China to Europe, the maritime route and the Eurasian land bridge are similar in time and cost. The land bridge is faster than sea transport for the transportation of goods. A study conducted in the U.S. states that goods transported by train have a greater impact on freight transportation. A ship typically travels less than 20 mph, with a top speed of around 25 knots. A train’s speed means that the trip takes roughly 5 to 6 days less than a ship’s voyage, depending on how far the trip goes. When freight transportation is utilized via train rather than through the waterways, the effects on shipping can be seen. A ship’s typical cruising speed is below 20 knots and it moves around at less than 20 mph daily. It takes 5 to 6 days less time to travel by train than by ship, and this is because the train travels faster. To calculate the cost of shipping, a 20 ft equivalent unit (TEU) and four different shipping routes are used ( 32 ). According to the research, modern transportation business practices have little effect, as previously believed, on high logistics costs and inadequate physical infrastructure for import and export. The impact of infrastructure quality on exports is being examined. The research found that better infrastructure in exports helps exporters, cutting down on transport costs. The data imply that the most important determinant of transportation costs and trade volume is the lowest quality of transportation infrastructure present in the two trading nations ( 33 ).
Methods and Solutions
Increased international trade has fueled the multimodal transportation trend and academic interest in the subject over the last few decades. As a result of its positive impact on transportation economics, it has become increasingly popular in recent years ( 34 ). It reduces transportation costs by 20% while increasing train loading space utilization by 63% compared with a unimodal road system (haulage). Multimodal transportation’s role in reducing transportation’s impact on the environment and economy has also given rise to studies. CO2 emissions can be reduced by up to 57% in a multimodal network compared with a single-modal network ( 35 ). While transportation studies account for most logistics research, they frequently concentrate on stand-alone transport or logistics as an integral aspect of a company’s production operations. In addition, there is comprehensive information on how to model the transportation network issue and guidance on how to solve network design and operation issues ( 36 ).
Many studies have been using network design models and algorithms to increase efficiency for problems with general constraints, such as shortest paths and minimum cost flows. Nearly all the proposed solutions in the literature have been tailored to cargo movements and ocean transport. Several intermodal and multimodal models are available that combine road and rail operations. Many studies have been done to minimize the intermodal and multimodal container or trailer cost on highways and public roads, as well as the importance of network design and methods in multimodal transportation being thoroughly discussed ( 37 ).
In the past, heuristic methods were used to simulate and optimize transportation routes for multimodal and intermodal transportation. The researchers examined the multimodal transportation route between Busan and Rotterdam using a dynamic programming method, concentrating on transportation costs and time limitations. A MILP model ( 38 , 39 ) was used to frame and solve the bi-objective problem of minimizing costs while also reducing CO2 emissions. The data were provided by one of Asia’s largest logistics service companies. According to Pareto fronts, road freight transit costs 64% more than multimodal freight transport ( 37 ).
The importance of solution methods along with modeling cannot be cast aside. For multi-objective optimization problem solutions, it is widely agreed that two standard methods are employed when looking for Pareto solutions to multi-objective optimization problems: the constraint approach and the weighting approach (denoted as -constraint methods). Natural selection, the fundamental concept behind evolutionary computation, is applied to population-based problem-solving using the genetic algorithm (GA) ( 40 ). Evolutionary algorithms are negatively affected by the Pareto set’s large size problem ( 41 ). When dealing with problems involving continuous and discrete functions, GAs can be used as a global optimization tool to achieve the best solution. A simple GA, on the other hand, may exhibit slow convergence and, as a result, instability.
Problem Statement
A MILP model that examines the cost function of various transportation modes is presented in this section, along with the definition and design of the problem.
Problem Definition
Our topic is described as a bi-objective MILP problem because the primary goal is to minimize the total cost of cargo activities between nodes (minimizing the cost of intermodal and multimodal transportation). This problem’s primary purpose is to reduce the adverse effects of road transportation, which include high transportation costs, excessive fuel consumption for logistic systems, and congestion. Throughout the problem, each container is assigned a single type of product, and the problem begins with logistics operations at a major logistics hub in the Chinese city of Shanghai. One kind of truck with a carrying capacity measured in 40 ft containers between the origin–destination pairs is transporting the cargo. The trucks will be transferred from trucks to ferries at the transshipment points. Also assumed is that the container ship capacity will remain constant, with each ship capable of transporting 130 (40 ft) containers at any given time. Following the transfer points, trucks are used to transport the final mile of the journey.
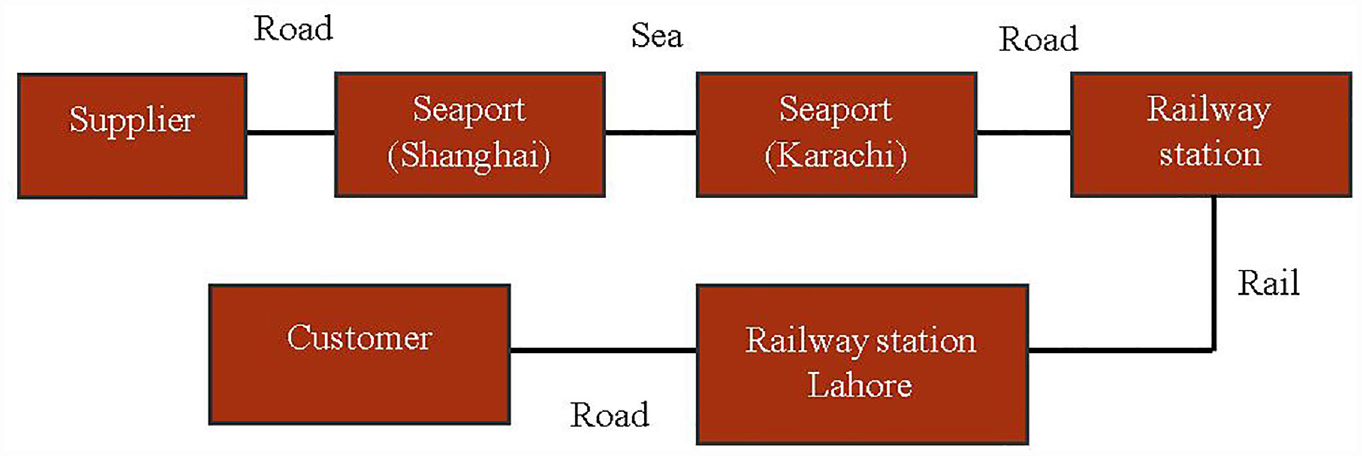
Cases are developed using actual data from a large logistics service provider in China and Pakistan, to support decision-makers with an understanding of the logistics process and its dynamics. The result is the development of a scenario that begins with loading Chinese cargo onto trucks capable of being used in intermodal or multimodal transportation. Then, the operation moves on to these trucks and semi-trailers from the Shanghai port. Trucks use road transportation to transport their cargo to the Shanghai seaport, and they can complete the journey in a single day. Transportation of shipments from the Karachi seaport to their final destination in Kasur via Lahore, Pakistan, can be accomplished by road or rail. Figure 4 shows the research methodology’s flowchart to minimize highway transportation costs and compare the intermodal and multimodal transportation networks.
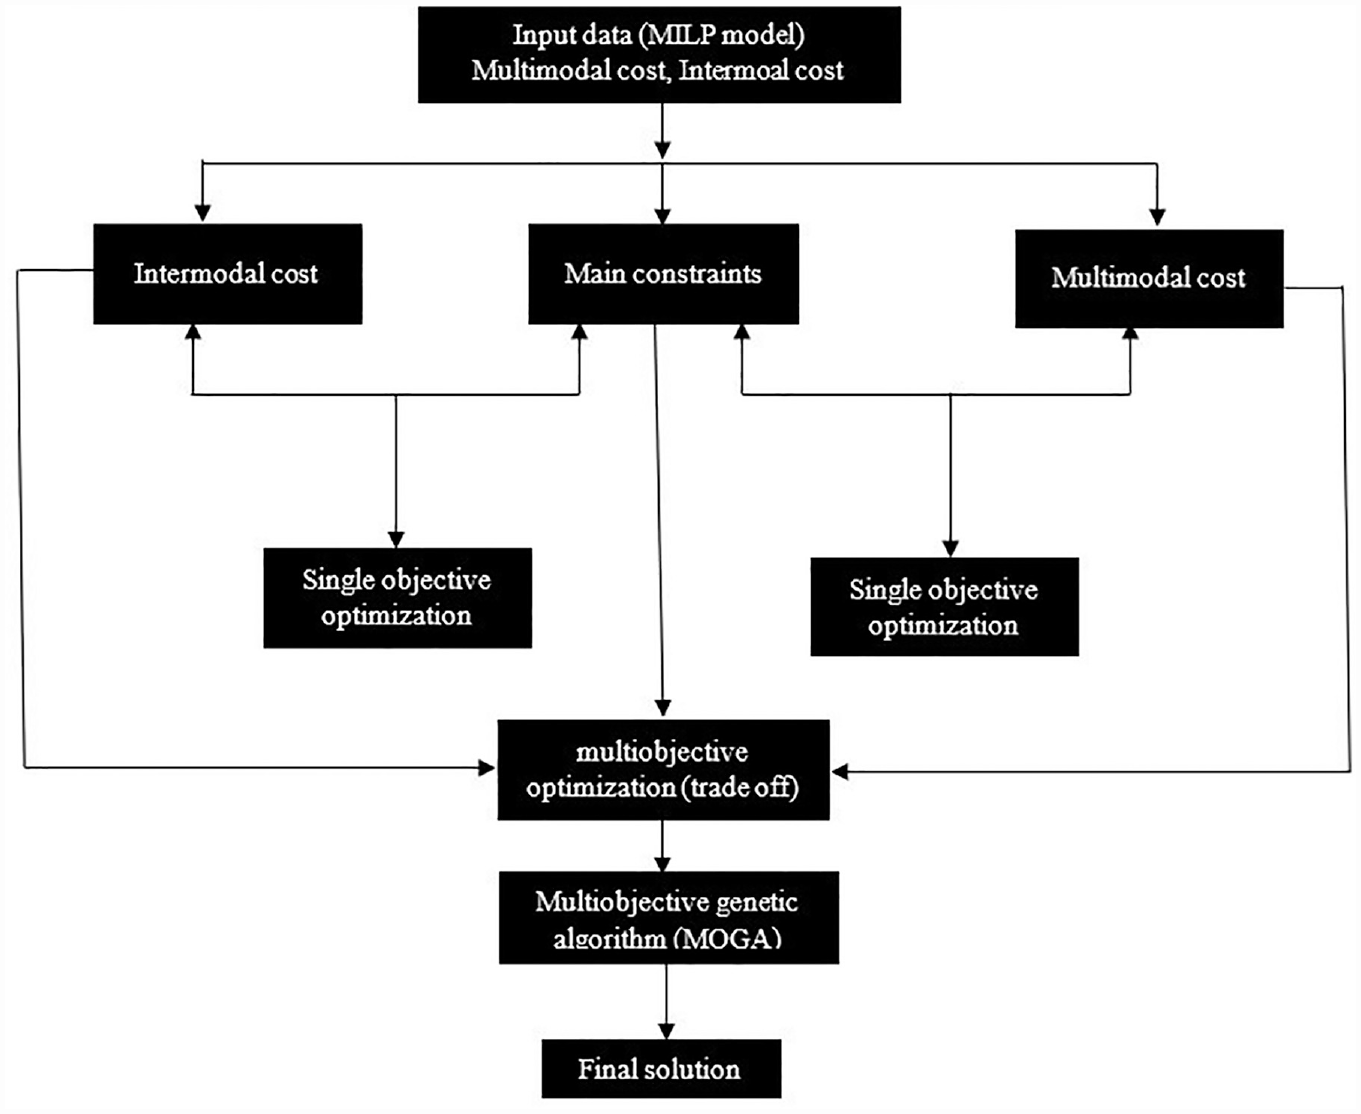
Flowchart of research methodology.
Bi-objective Optimization Model
Our research applies the MILP model’s ideas to strategic planning in both intermodal and multimodal systems. Ships transport containerized cargo from overseas ports to domestic ones. After being released from a domestic seaport, containers must first clear customs before being sent along an interior transportation network to end-customer distribution locations in an inland city. Because of the convenience of trucking for inland transit, such deliveries always begin and end with the usage of trucks.
A new optimization approach for the strategic design of intermodal and multimodal networks is introduced here. Transportation costs can be decreased with this model’s assistance, and it is intended to be used for intermodal and multimodal transport. Cost minimization is one of the primary objectives of transportation planning ( 42 , 43 ).
Bi-objective optimization, which considers costs and efficiency, is preferable to single-objective optimization. Decision-makers in the real world often have to find a middle ground between opposing objectives ( 42 ). This model is developed in the context of a scenario in which a freight integrator is an entity in charge of making decisions. This study will make the following assumptions: the freight integrator will only use one type of container ship, and there will be no capacity constraints for container transport during the sea leg. The optimization of hinterland container transportation and the modal split situation is the primary focus of this study, and ExWorks incoterms will be applicable. The model formulation is presented in this section, and the corresponding explanations are provided in the following sections.
Sets
N A set of nodes, let N = F
A A set of arcs, let
Decision Variables
Parameters
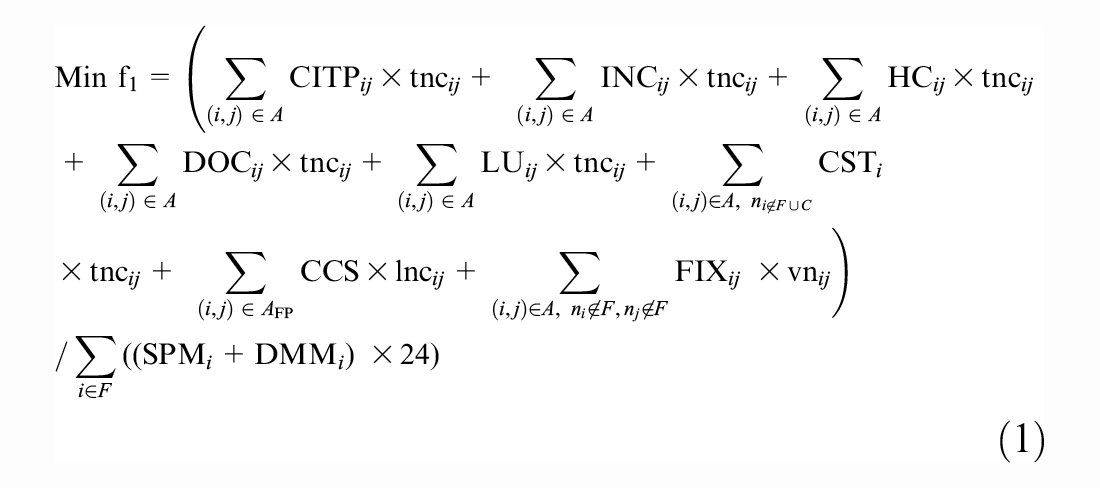
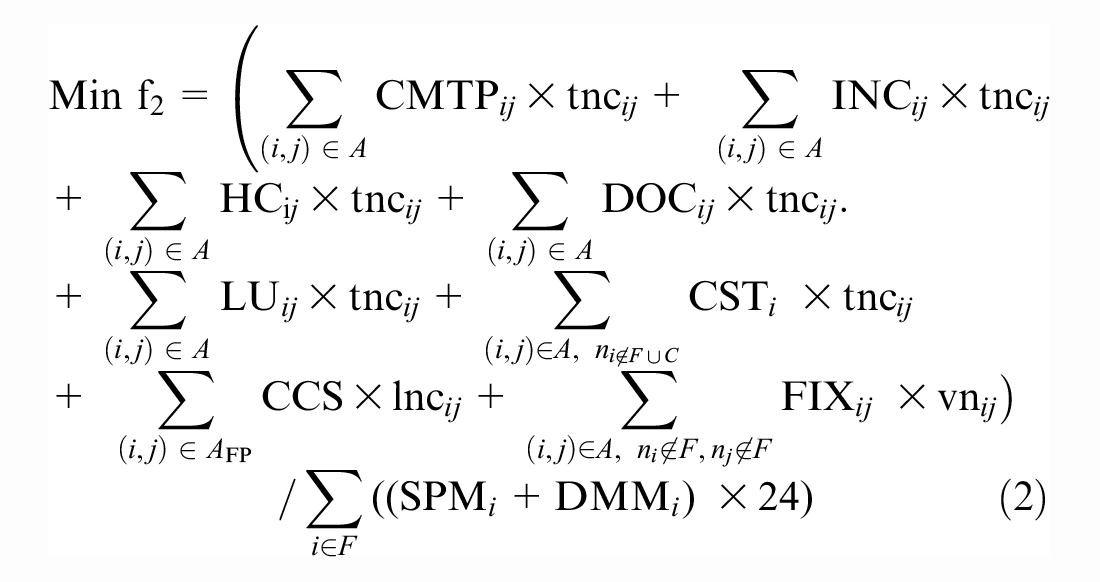
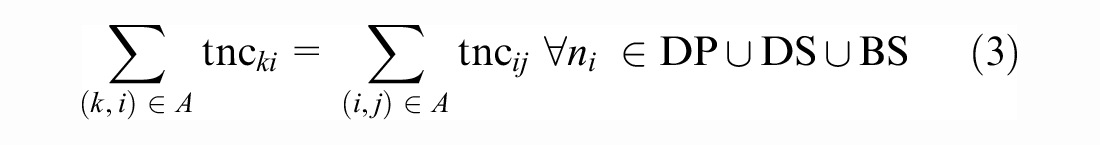


Cost minimization for a fully loaded container in an intermodal/multimodal freight distribution network is shown by Equations 1 and 2. Included in (1) and (2) are the constant costs associated with operating the vehicles during transportation, as well as the variable costs associated with the available quantity of goods for inspection, handling, documentation, loading, unloading, container storage, customs clearing, and duty clearance. The equilibrium between container intake and outflow is represented by Equation 3. The limits on supply and demand for containers are shown in Equations 4 and 5. Equation 6 shows each inland arc’s vehicle supply. The quantity of containers at each inland arc is related to the number of trucks available in Equation 7. The capacity limits of transportation nodes can be seen in Equation 8. The total number of containers and fully loaded containers on the transport arc are shown in Equation 9. As shown by Equations 10 to 13, choice variables can have no negative values.
Solution Methodology
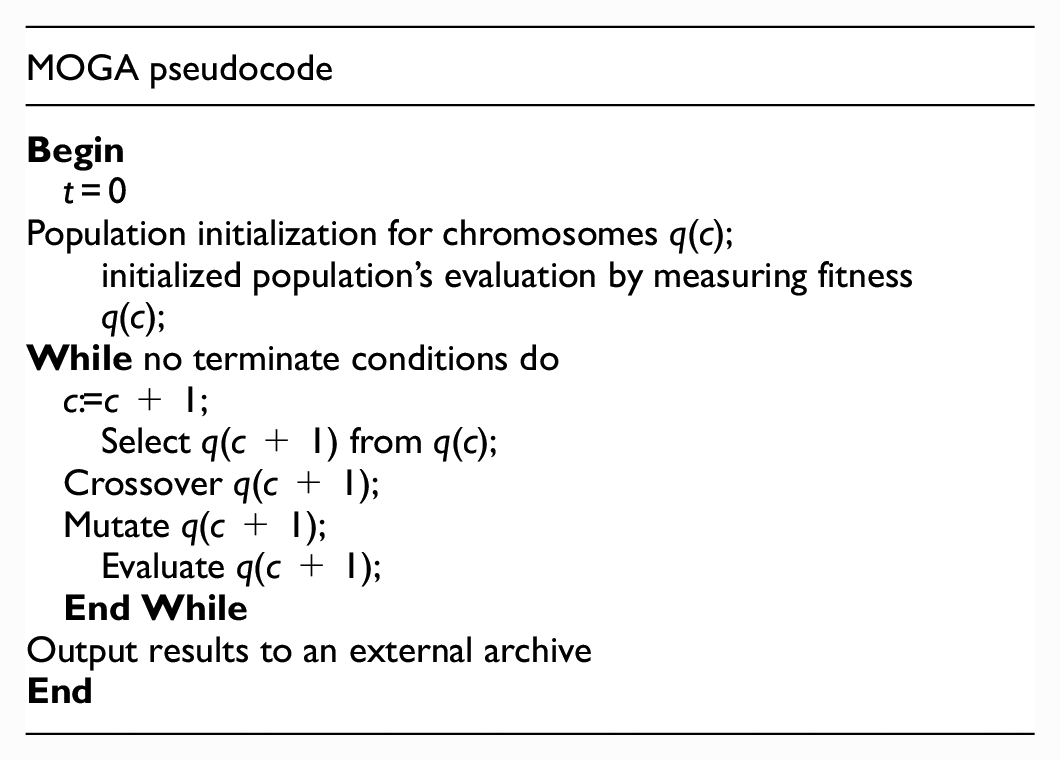
We used MOGA, which was developed by Holland ( 40 ), to identify the Pareto solutions to the bi-objective MILP problem of cost minimization in intermodal and multimodal transportation. GA is based mainly on three operators: mutation, selection, and crossover. GA is important because it acts as a universal optimizer capable of solving any issue. Furthermore, it is simple to implement and strike a balance between exploring and exploiting with the appropriate parameter settings and sound reasoning.
MOGA appears to be the most widely utilized method today. One of its key advantages is that it is population based, allowing researchers to uncover multiple intriguing solutions in a single run. It is a powerful and all-purpose search and optimization tool. MOGA, unlike traditional optimization methods, is population based rather than iterative, so individuals evolve concurrently while the final population includes the best of the best. The ultimate expression of a population’s evolutionary potential, as determined by the combined impacts of numerous genetic operators on the present population, is population renewal. Natural selection, genetic crossover, and random mutation are the three fundamental genetic operators. All of these genetic operations significantly affect the GA’s performance. Therefore, GAs are distinguished by their parallelism and efficient global information utilization. A GA relies heavily on communication between the system and the population. Each interaction technique includes a selection operation on the population that adheres to a set of rules. By carefully selecting members of the population and then exposing them to mutation and genetic crossover, a new population can be produced. Iterations of this procedure are performed until convergence is achieved. In addition, the structure of MOGA is analogous to that of a single-objective GA (SOGA) technique. MOGAs vary in how fitness is assigned and selected, while SOGAs differ mostly in how fitness is determined. In this study, we use the MATLAB programming environment to codify the mathematical model we established for GA in the form of M-files.
The GA can be put into action using the following measures:
Initial population assessment;
Selecting the healthiest parents;
Creating a new generation from both parents;
Mutation of the new generation;
Going back to the population’s best-found individual and repeating step 2 until the operation is finished.
The Pareto optimal solution is a set of “non-inferior” solutions in the objective space that together provide an upper bound beyond which no additional gains can be made without sacrificing some other objective. Several studies in the existing body of literature have used MOGA as a solution methodology. In one study, a mathematical model is formulated to minimize total cost and delivery time in the transportation of goods between origins and destinations. The multi-objective optimization problem is solved by generating Pareto optimal solution using MOGA ( 44 ).
In another study, the cost reduction problem of transportation in biomass energy generation is investigated. MILP is used to formulate the problem, while MOGA is used to create Pareto optimum solutions ( 28 ). In another work, the MILP problem is used to develop a bi-objective optimization to minimize delivery time and transportation costs. The multi-objective non-sorting GA (MONSGA) and the multi-objective bat algorithm (MOBA) are used to classify the best solutions ( 29 ). Furthermore, delivery reliability and cost concerns are formulated, and optimal solutions to trade-offs between competing objectives are obtained by applying MOGA ( 28 )
Computational Experiments
In this section, we will examine the initial data used for building the model and give a general overview of the actual case and how it was used in the previous sections of this study. One important aspect of the transportation network covered in depth is the assumptions made for designing and operating the multimodal system.
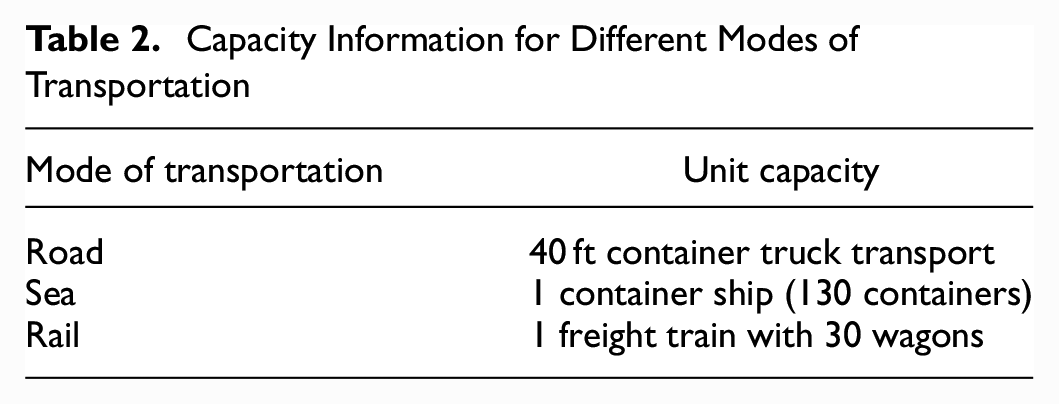
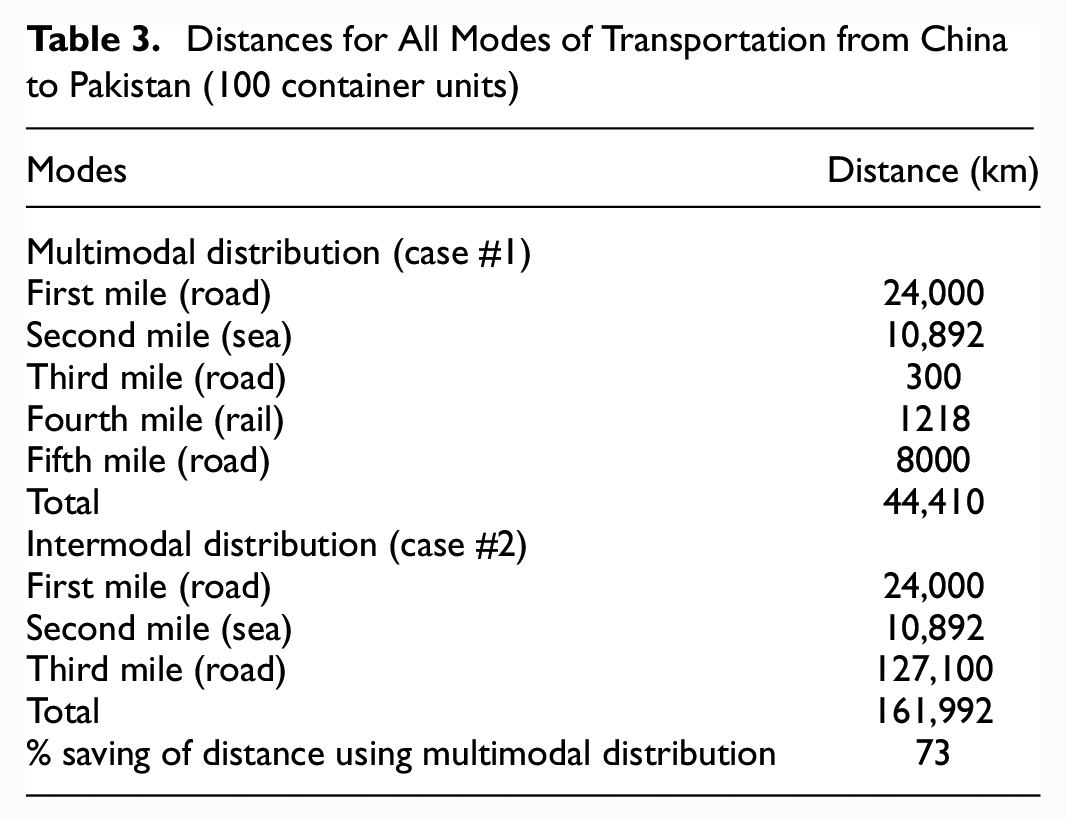
When conducting our research, we relied on authentic data from one of Pakistan’s largest logistics providers, as well as the key location centers, loading and unloading hubs, links among different locations, type of vehicles, capacities of vehicles, cost of transfer between different transportation modes, cost of raw materials, limits of operations, customer demands, suppliers capable of producing raw material, operational constraints, and historical trend of shipments. Table 2 shows the capacities of trucks, trains, and ferries for transporting goods from China to Pakistan. Table 3 shows the distances in all modes of transportation from China to Pakistan. Table 4 shows the distribution of costs for all modes of transportation from China to Pakistan.
Capacity Information for Different Modes of Transportation
Distances for All Modes of Transportation from China to Pakistan (100 container units)
Distribution of Cost for All Modes of Transportation from China to Pakistan
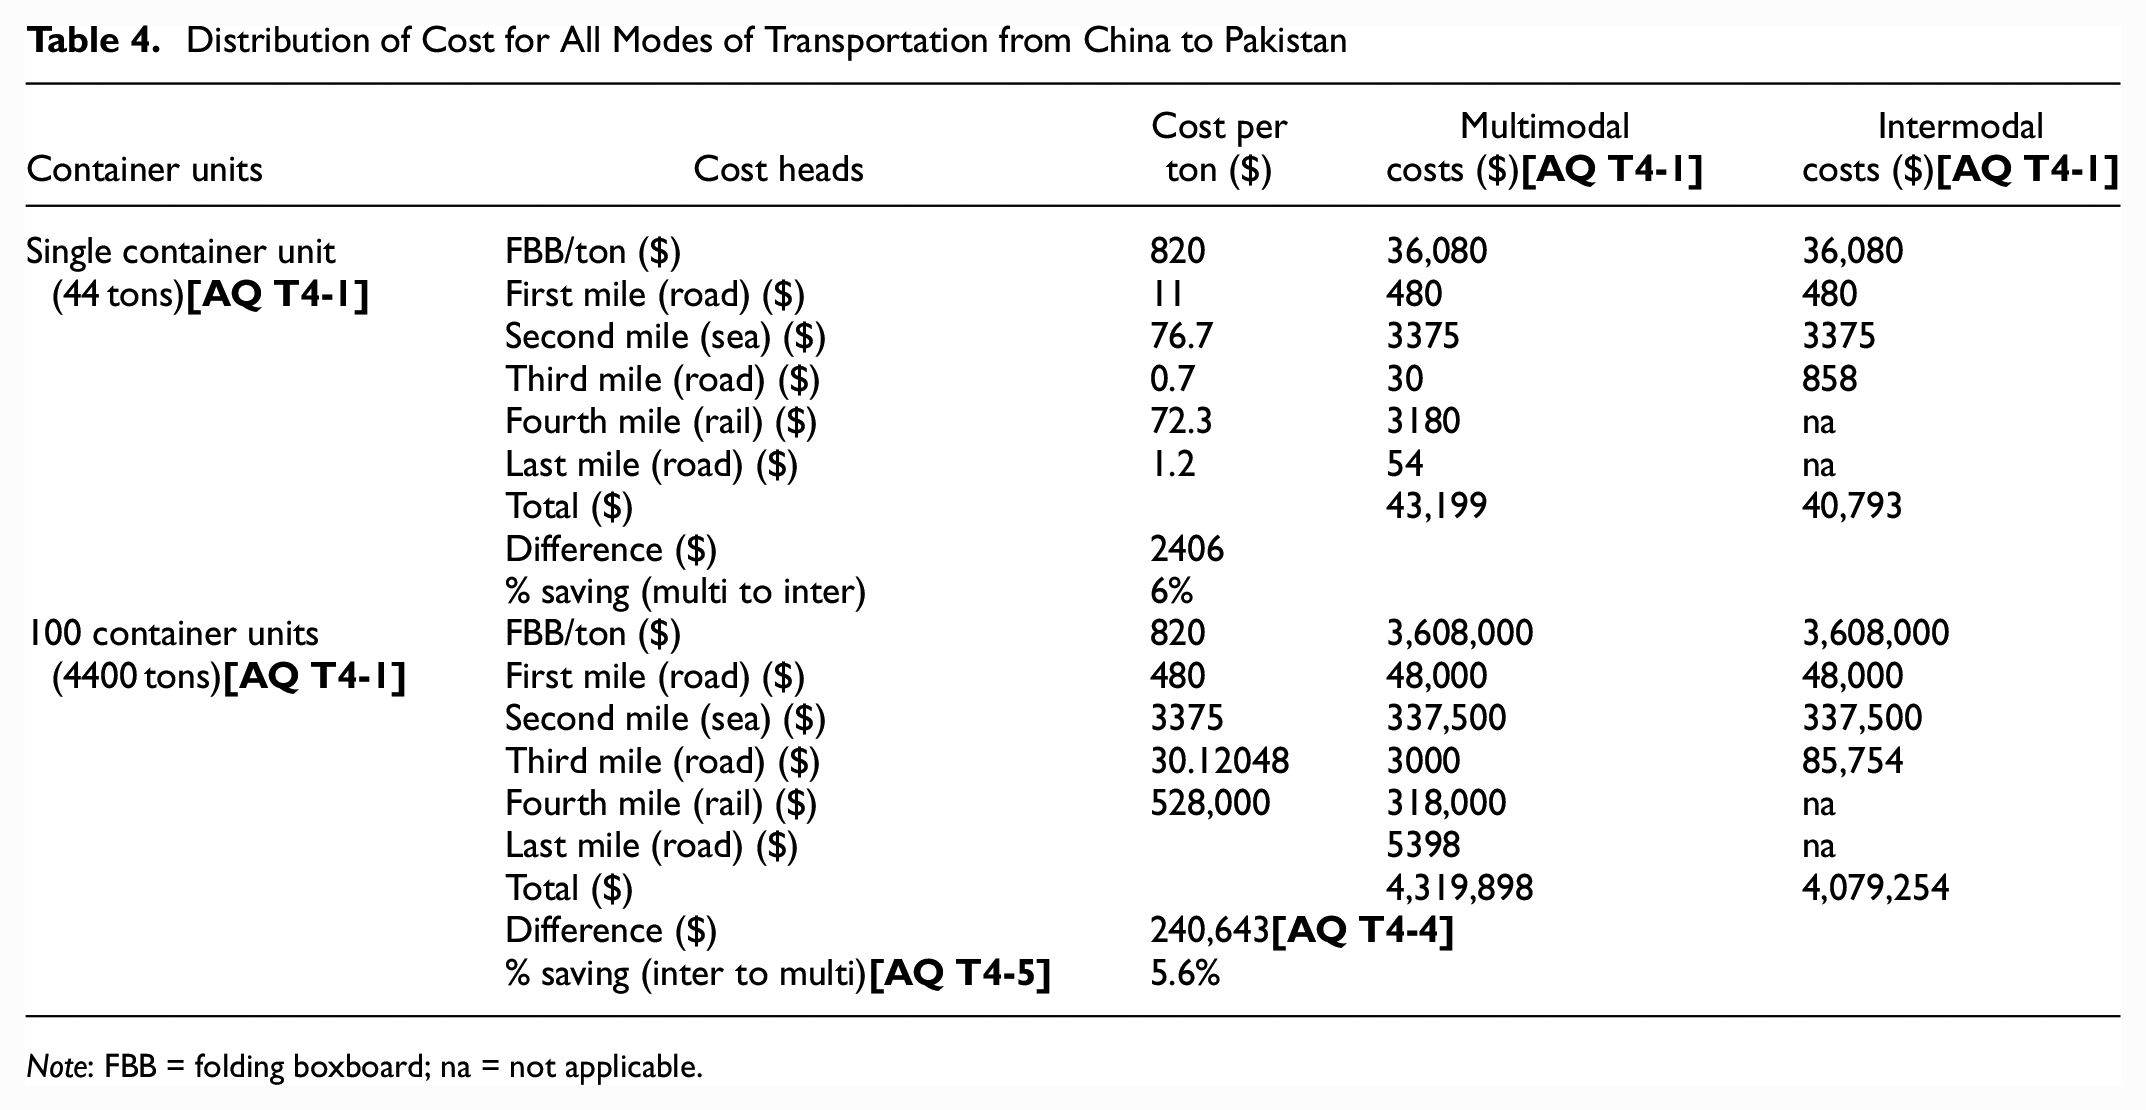
Note: FBB = folding boxboard; na = not applicable.
Results
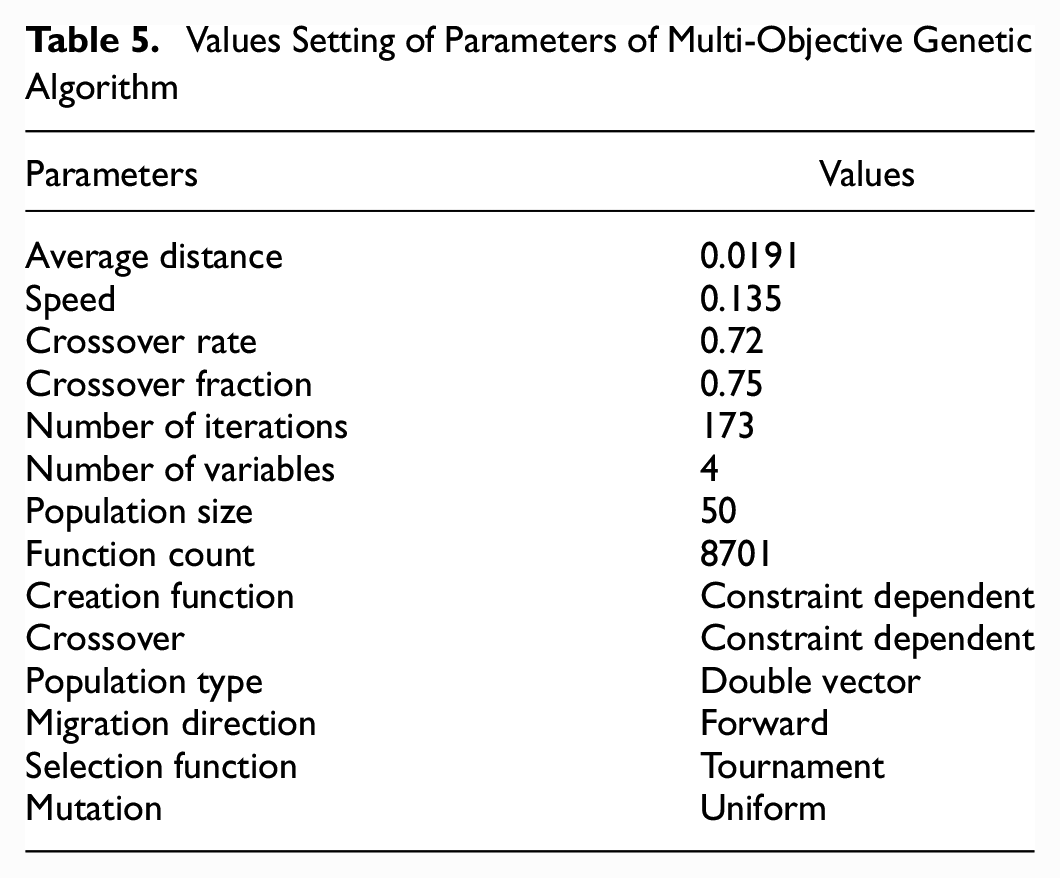
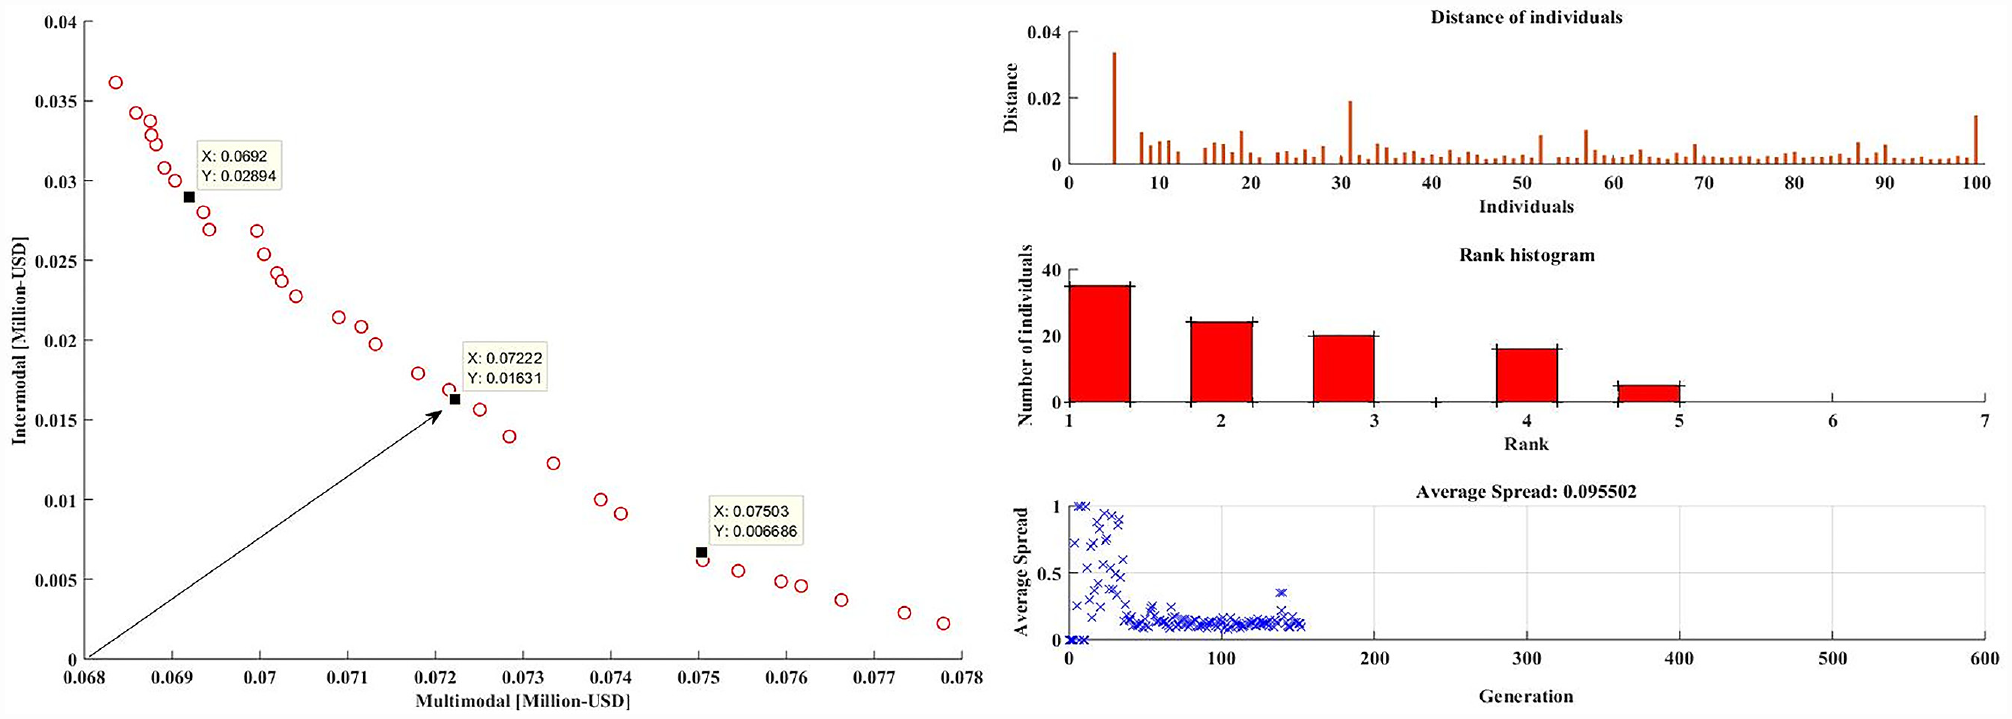
In this section, we looked at our mathematical model in various scenarios, with the most significant difference being the number of transshipments and the cost of transfer in the network in each scenario. Then, using real-world data from the Pakistan–China multimodal and intermodal network, we can generate Pareto solution sets using GA ( 40 ) proposed for total transportation cost. The model is executed on a computer equipped with an Intel Core I5 2520 M CPU, which operates at 2.50 GHz and has 4.00 GB of RAM. Further, Tables A1 and A2 show the chromosome selection in the bit string, function values, and decision variables (double vector) for cost minimization. The parameters of MOGA and exchange rates are given in Tables 5 and 6.
Values Setting of Parameters of Multi-Objective Genetic Algorithm
Exchange Rates during 2021 (USD to PKR)
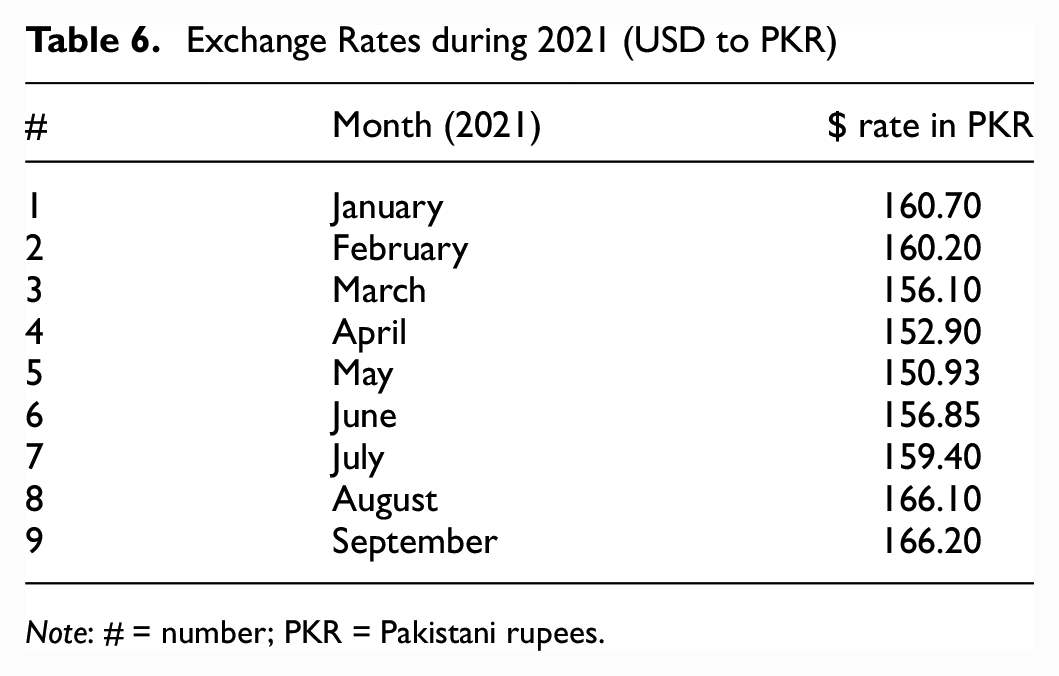
Note: # = number; PKR = Pakistani rupees.
Case #1 (Multimodal Distribution)
Figure 5 depicts the graphical network representation of case #1. This case contains four transshipments. The operation begins with road transportation from a wood pulp manufacturing plant in Shanghai, China, to the Shanghai seaport. The total distance covered by the truck in the first-mile delivery is 240 km carrying a 40 ft container. After the container is transferred from trucks to a ship at the Shanghai terminal, it is transported to the port of Karachi, Pakistan, where it is unloaded. The total distance between the seaports of Shanghai and Karachi is 10,892 km. At this port, the container is transferred from the ship to the trucks and then driven 3 km to the Karachi railway station. A freight train is loaded with cargo at the Karachi railway station on its way to the Lahore railway station. The distance between the two railway stations is 1218 km. Last-mile delivery by road transport is used to transport the cargo to the customer over a distance of approximately 80 km.
Schematic representation of case #1.
When importing goods into Pakistan, the customs duty on imports assists in calculating the total cost of the goods. This can be applied to financial feasibility studies, budgetary requirements, and supply chain financing, among other things. This is particularly important for traders and manufacturers who wish to import a wide range of goods used for various purposes in their operations. A duty structure consists of duties and taxes such as customs duty (20%), additional customs duty (7%), regulatory duty (10%), sales tax (17%), additional sales tax (3%), income tax (12%), and additional sales tax (3%), among others.
The cost of wood pulp (also known as folding boxboard, or FBB) is $820 per ton. The trucking cost for transporting 44 tons of material as a first-mile delivery is $480. The cost of the ship shipment, which includes toll taxes, inspection, quality checking, handling, loading, and unloading, is $3375 for a 44 ton shipment. The cost of trucking in Pakistan is $30 for third-mile delivery, and the cost of rail between Karachi and Lahore is $ 0.072 per kilogram and $72.28 per ton of cargo. The total cost of rail freight delivery for 44 tons is $3180.72. In addition, the cost of last-mile delivery is $54.
Including the material price, the total cost of multimodal freight transportation from Shanghai, China, to Kasur, Pakistan is $36,080 + $480 + $3375 + $30 + $3180 + $54 = $43,199 for the delivery of 44 tons of wood pulp. The total cost of all transport modes comes to $7119. Transport by road costs $564, rail costs $3180, and sea transport costs $3375. Thus, road transportation accounts for 7.9% of transports costs, rail transportation for 44.6%, and sea freight transportation for 47.4%. Toll taxes, inspection, quality control, handling, loading, and unloading costs are all included in the costs mentioned above. Figures 6 and 7 show the locations of the multimodal distribution and sea shipping route between Shanghai, China, and Karachi, Pakistan.
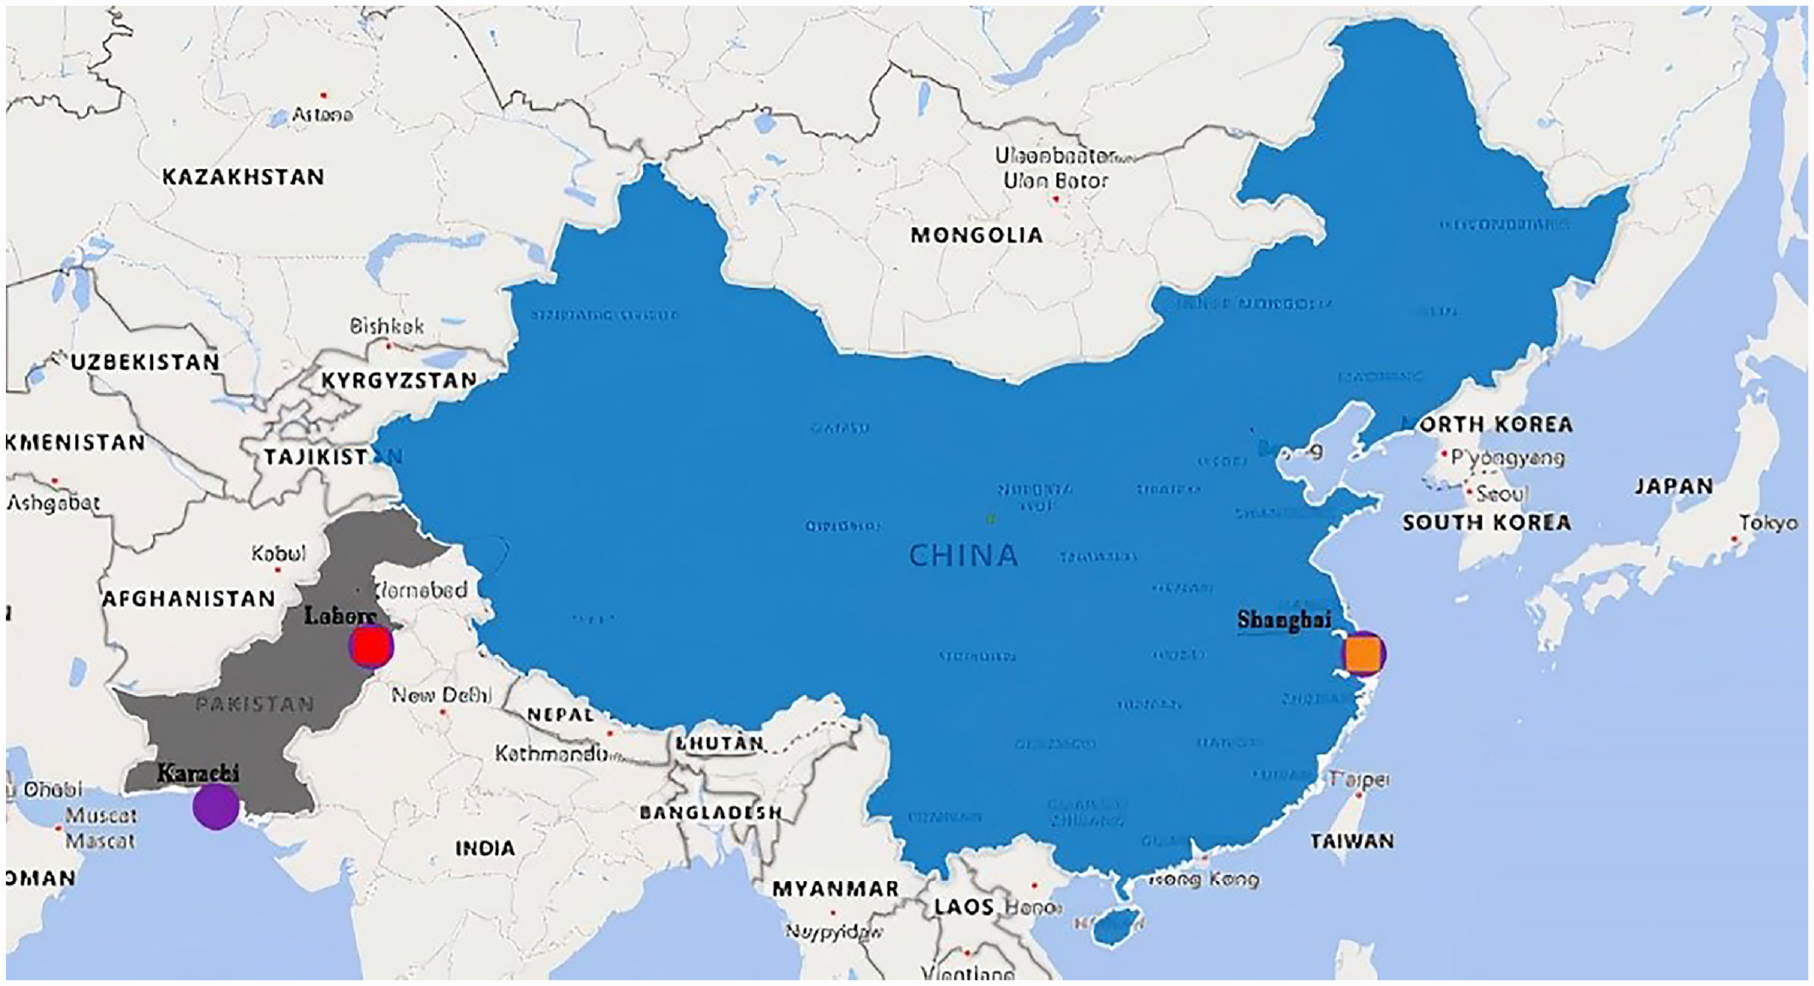
Locations of the multimodal distribution network (Pakistan–China).
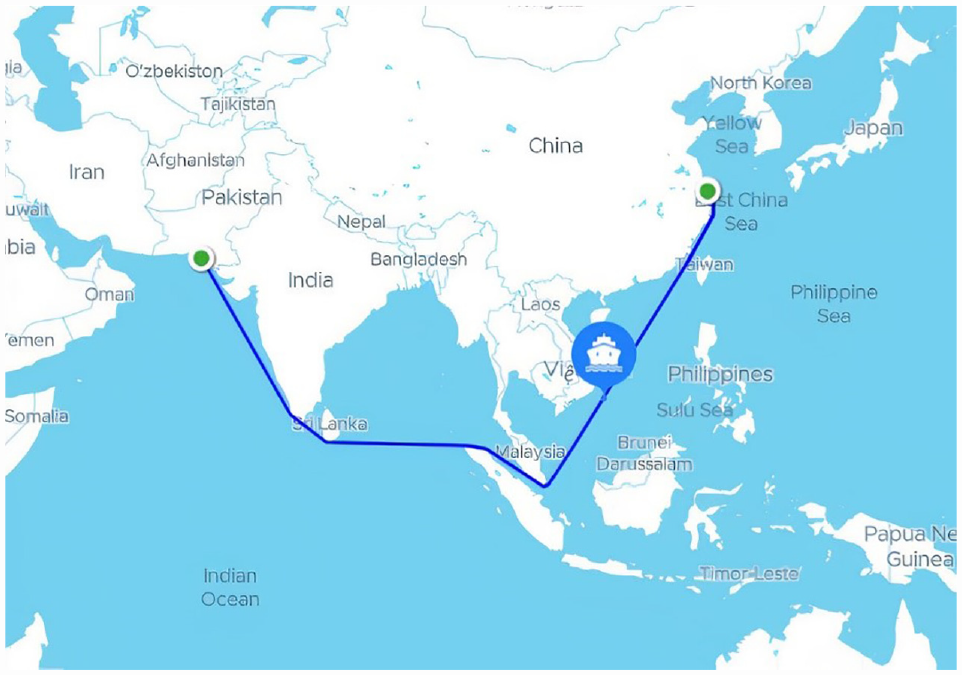
Shipping route between Shanghai and Karachi.
Case #2 (Intermodal Distribution)
Figure 8 depicts the graphical network representation of case #2. The operation begins with road transportation from a wood pulp manufacturing plant in Shanghai, China, to the Shanghai seaport. The total distance covered by the truck in the first-mile delivery is 240 km carrying a 40 ft container. After being transferred from trucks to a ship at the Shanghai terminal, the container is transported by ship to the port of Karachi, Pakistan. The total distance between the seaports of Shanghai and Karachi is 10,892 km. At this port, the container is transferred from the ship to trucks and is now on its way to Kasur, Pakistan. The last-mile delivery distance from the Karachi seaports to Kasur is 1271 km.

Schematic representation of case #2.
Wood pulp (FBB) costs $820 per ton. The cost of trucking 44 tons of material as a first-mile delivery is $480. For the delivery of 44 tons of material, the shipment cost is $3375. The cost of transporting a 40 ft fully laden container in Pakistan is $ 0.26 per kilometer. Last-mile delivery costs $858. Toll taxes, inspection, quality checking, handling, loading, and unloading costs are included in all the abovementioned costs.
According to the following equation, the total cost of intermodal freight transportation from Shanghai in China to Kasur in Pakistan, including material costs, is $36,080 + $480 + $3375 + $858 = $40,793 for the delivery of 44 tons of wood pulp. In the delivery of 44 tons of cargo, the total cost of all modes of transportation (excluding the cost of raw materials) is $4712. The total cost of road transportation is ($480 + $858 = $1338), and the total cost of sea freight transportation is $3375, so that road transportation accounts for 28% of total transport costs and sea freight transportation for 72%.
In the delivery of 44 tons of material from Shanghai to Kasur, the cost of multimodal transportation, excluding raw material charges, is $7119, excluding raw material charges. On the other hand, the cost of intermodal transportation is $4712. It is calculated that cost savings of 34% are realized by switching from multimodal to intermodal transportation, with the difference between the two modes being $7119 − $4712. However, the importance of rail for transporting large volumes cannot be ignored in this case. The cost of multimodal transportation for moving 100 containers using the same settings can be reduced significantly if the carrying capacity is increased as illustrated in Table 2. As shown in Table 3, a cost saving of 34% is possible in the movement of 100 containers. Further, this cost can be minimized by increasing the carrying capacity of multimodal transportation. Figure 9 illustrates the computational results and comparison of MOGA and multi-objective particle swarm optimization (MOPSO), showing that the MOGA computational efficiency is better than that of MOPSO.
Cost comparison of multimodal transportation network.
Figure 10 compares the calculation times of MOGA and MOPSO (evolutionary algorithms). MOGA outperforms MOPSO in computation. Studies have been conducted to examine the differences and similarities between MOGA and MOPSO ( 45 , 46 ). Once both algorithms were in place, their fitness values and execution times were compared to conclude the course scheduling process efficacy. Results revealed that the GA was able to collect a transport plan with a highest fitness value of 0.021 and a fastest execution time of 9.36 s, while the particle swarm optimization (PSO) algorithm managed a fitness value of 0.099 and a processing time of 61.95 s in the same iteration. This demonstrates that the MOPSO fitness value is superior to that of MOGA, even though MOGA may be executed in less time ( 47 ).
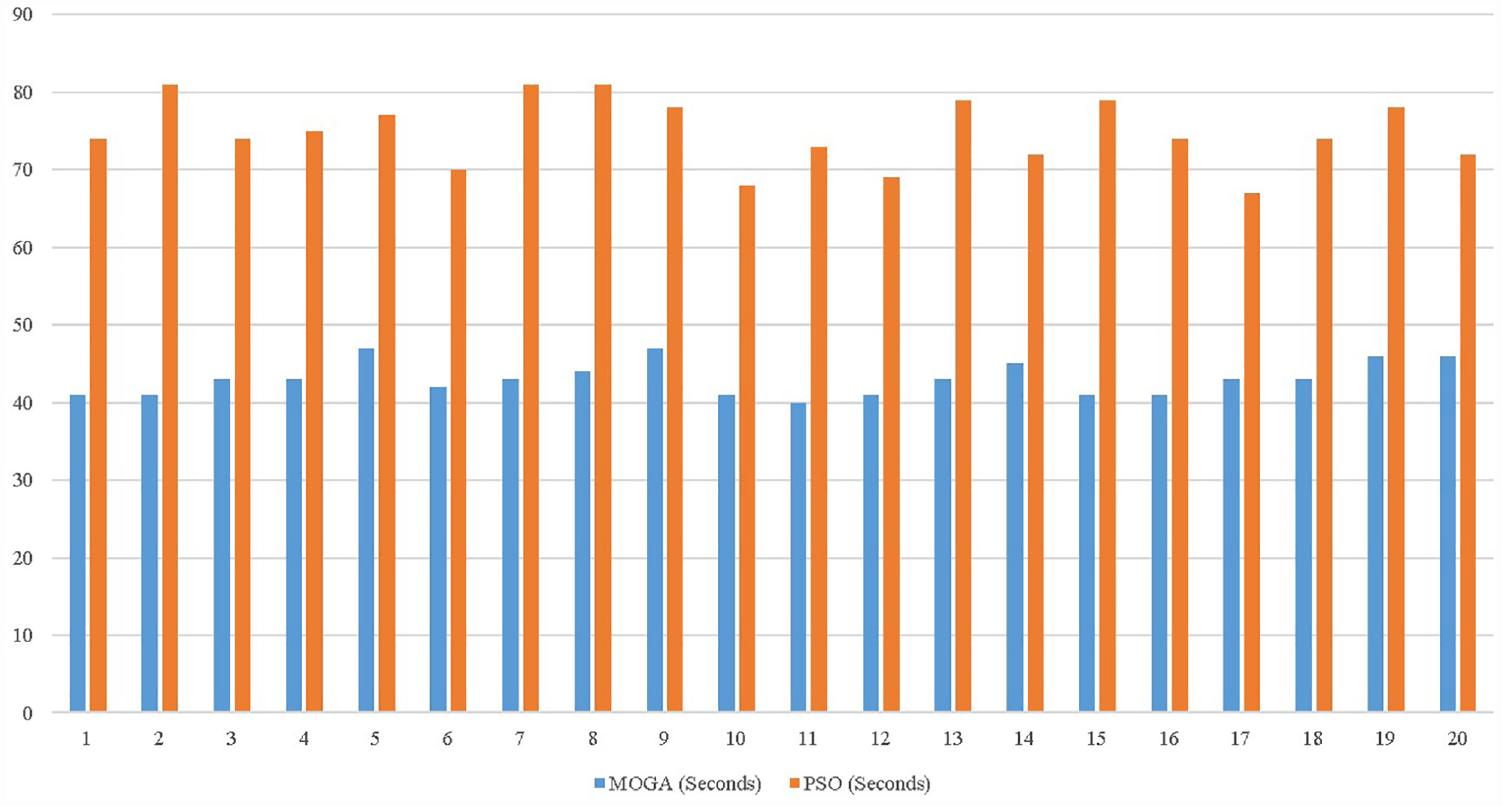
Computational comparison between MOGA and PSO.
The application of the solution to the problem indicates that the cost of transporting freight via multimodal methods is higher than the cost of transporting freight using intermodal methods. Nevertheless, major shifts take place whenever the carrying capacity of the railway is raised. From Shanghai, China, to Kasur, Pakistan, the cost of transporting a 40 ft container using intermodal means is $4712, whereas the cost of transporting the same container via multimodal means is $7119. The findings of our study are confirmed by the studies of ( 22 ), who proposed a model with multiple and competing objective functions, such as minimizing transport costs, transit times, and variances while ensuring continuity and compatibility between rail, road, and waterway transport flow nodes. The intermodal transportation network identifies the most appealing routes that connect two important Chinese origins with four Indian destinations. The route development may have an impact on Asia’s current transportation patterns as well as its competitiveness. Moreover, compared with a unimodal road system, it has been shown that a multimodal network reduces transportation costs by 20% while increasing train loading space utilization by 63% ( 48 ).
Conclusions
Based on a mathematical optimization model, a novel tactical approach to the problem of intermodal network design was developed as a result of this research. To boost their competitiveness, freight integrators have taken the risk of delivering excessively advanced solutions. Therefore, optimizing cargo movements simultaneously on the sea and land legs has become a need. The logistics sector comprises a vast array of functions. Some shippers prefer to save money on shipping by using multiple forms of transportation, while others want their items delivered as quickly as possible. This research proposes a cost-effective approach for multimodal and intermodal network optimization to address these issues.
The research presents a case study of container imports from inland China, and key findings are extracted from it. The ability to achieve higher load factors significantly reduces the cost of door-to-door transport, which reduces the cost of production by reducing transshipment. Second, multimodal freight transportation is more cost-effective for larger freight volumes for a variety of reasons, the most important of which are: discounts on sea shipping for larger volumes offered by various freight forwarding companies, as well as increased capacity of freight rails to transport freight safely and easily even in the presence of road transportation.
This paper adds a great deal of value not only to the academic community but also to the industrial community. Under consideration of cost, the model optimizes intermodal and multimodal container flows between ports in the hinterland. The primary contribution of this paper is that, through innovative service design, this model benefits both freight operators and one-stop LSPs. Additionally, it provides insights to government policymakers on how to develop inland transportation infrastructures at a reasonable cost. Some limitations exist, such as the amount of fuel consumed at each stage of the transportation process from the supplier’s factory to the customer’s factory, the number of stops, and the percentage of fuel used. A deeper investigation into the inefficient use of vehicle resources and the costs associated with product delivery is possible. A future study could look at shipping speeds and how different shipping companies perform when delivering shipments on schedule. Second, in multimodal operations, it is possible to compare the transit, delivery, and waiting times at each stage of the freight movement.
Supplemental Material
sj-docx-1-trr-10.1177_03611981231171157 – Supplemental material for Upstream Logistics Optimization from Shanghai, China to Kasur, Pakistan: An Implementation of Mixed-Integer Linear Programming
Supplemental material, sj-docx-1-trr-10.1177_03611981231171157 for Upstream Logistics Optimization from Shanghai, China to Kasur, Pakistan: An Implementation of Mixed-Integer Linear Programming by Rizwan Shoukat and Zhang Xiaoqiang in Transportation Research Record
Footnotes
Author Contributions
The authors confirm their contribution to the paper as follows: study conception and design: Rizwan Shoukat, Zhang Xiaoqiang; data collection: Rizwan Shoukat; analysis and interpretation of results: Rizwan Shoukat, Zhang Xiaoqiang; draft manuscript preparation: Rizwan Shoukat. All authors reviewed the results and approved the final version of the manuscript.
Declaration of Conflicting Interests
The author(s) declared no potential conflicts of interest with respect to the research, authorship, and/or publication of this article.
Funding
The author(s) received no financial support for the research, authorship, and/or publication of this article.
Data Accessibility Statement
The paper includes the data used to support the findings of the study.
Supplemental Material
Supplemental material for this article is available online.
References
Supplementary Material
Please find the following supplemental material available below.
For Open Access articles published under a Creative Commons License, all supplemental material carries the same license as the article it is associated with.
For non-Open Access articles published, all supplemental material carries a non-exclusive license, and permission requests for re-use of supplemental material or any part of supplemental material shall be sent directly to the copyright owner as specified in the copyright notice associated with the article.