
Abstract
Unlike much of the existing research into the environmental impacts of home shopping and delivery activities, which focus on evaluating the operational efficiency of home delivery failures, this paper aims to investigate the CO2 emissions associated with treatments of failed-delivery parcels. The paper considers the potential environmental profits from using some innovative home delivery solutions: 1) the utilization of new home delivery solutions, under which the self-pickup point (SPP)/smart cabinet (SCB) is used as an intermediate address for customer’s collection and 2) upgrading fuel-powered goods vehicles to battery vans to make deliveries. Two sets of vehicle routing problem models for fuel-powered vans and battery vans are established. A sample network comprising of 500 customers and several SPPs/SCBs in Beijing, China, is proposed in the case study, to verify the proposed models and heuristics. The numerical results suggest that: 1) reductions in CO2 per average parcel delivered by new home delivery solutions increase with the ratio of home delivery failures, 2) it is proved that using battery freight vehicles obtains more environmental benefits than using the fuel-powered vans, and 3) customers’ personal trips for collecting their failed-delivery packages from the local depot or SPPs/SCBs share a large proportion of CO2 per parcel.
The research has practical implications for both government and industry practitioners. Possible suggestions include: 1) promote a cleaner transportation mode for residents, by encouraging them to either take the bus or drive a battery passenger car, 2) careful design of a combined SPP and SCB network in urban areas, and 3) accelerate the process of vehicle electrification in the logistics industry by issuing allowances for purchasing electric vehicles from the government.
Keywords
The home shopping market in China is under rapid development lately. Despite the global economic recession which followed the COVID-19 pandemic, internet shopping channels keep rising fast. It was estimated that 6.19 billion people among 8.27 billion internet users were buying online in China in 2021. The home shopping market was valued as $561 billion in China, increased by 31% since 2018 ( 1 ). Seasonal shopping holidays further increase the Chinese home shopping market. For example, the transactions of “1212” internet shopping day in China were valued as $59.2 million on a single day, December 12, 2021 ( 2 ). At the same time, the home delivery service is a fast-growing industry to fulfill those internet orders. It was reported that, in 2021, every internet user in China received 97 packages delivered to their home. It is certain that home shoppers’ experiences with home delivery services are decisive to the success of an online retailer.
With the rise of internet shopping business and home delivery service, some considerations come up concerning the passive impacts of last-mile solutions on operational costs and air quality. A growing consensus of opinion among scholars and industry practitioners is that home delivery activities for fulfilling internet shopping orders are bad for the environment. One common concern is that a significant amount of air pollution comes from frequent home delivery activities, especially the emissions associated with settlements of home delivery failures. Statistics indicate that the number of licensed freight vehicles increased rapidly in China, with 39% annual increase since 2010, but, in contrast, passenger vehicles increased only 11% per year during the last 11 years ( 3 ). It might confirm the truth of enormous market demand for internet shopping in China. As a result of increased fright vehicle traffic, air pollution from delivery vans grows fast, and this has gained increasing attention from both governments and industry practitioners. Special concerns are given to the failed delivery. In reality, if the first-time delivery is unsuccessful, some carriers have to make a second, and even a third delivery attempt. After that, the customer needs to collect their package from the carrier’s depot which is normally distant from the residential area. Under these circumstances, not only do failed-delivery packages cause air-pollution in cities, they also increase the processing burden on both carriers and customers. It was reported that around 67 million packages in the UK in 2020 were not successfully signed for on the first-time delivery attempt because of no one being at home, with consequential economic losses of $1.1 billion ( 4 ).
However, some people might have different opinions toward the environmental impacts of home delivery activities. One common argument is that, with the internet shopping channel, the customers do not need to visit the physical stores themselves. The virtual shopping and home delivery service might avoid the road traffic and the corresponding air pollution associated with physical shopping trips. The need to quantify the environmental impacts of home delivery activities stimulates this research.
The Chinese government has acknowledged that road transport related to logistics activities is a primary source of air pollution. As a positive policy to optimize the environment, the Ministry of Transport of China has started to implement a range of measures to replace regular fuel-powered vehicles with battery vehicles. In Beijing, a city with a permanent residential population of 19 million, all regular fuel-powered vans were strictly prohibited from traveling in all the administrative regions of Beijing city after January 2017. Nowadays, fuel-powered vans have all been successfully substituted by electric vehicles (EVs) for urban logistics operations in the whole of Beijing. However, some scholars believe that using EVs might generate extra recharging time costs and battery wear costs. There are some conflicting opinions in the industry toward the environmental implications of last-mile delivery activities. There is also uncertainty about the benefits of using battery freight vehicles for making home deliveries, considering the life cycle of emissions from EVs. The need to quantify the environmental effects of using battery vans instead of regular fuel-powered vans for making home deliveries further stimulates this research.
Unlike much of the existing research into the environmental impacts of home shopping and delivery activities, which focus on evaluating the operational efficiency of home delivery failures, this paper aims to investigate the CO2 emissions associated with treatments of failed-delivery parcels. There are three specific objectives of the current paper. The first is to investigate the CO2 emissions produced by home delivery activities as CO2/parcel. The second is to quantify the CO2 savings from the utilization of battery freight vehicles for making deliveries. The third is to evaluate the extra CO2 emissions generated from handling the delivery failures.
The paper is structured as below. The literature review follows the introduction section. Then, the mathematical models for home delivery using fuel-powered vehicles and EVs are presented separately. The results of a real case study in north Beijing are presented and analyzed. The research conclusions and future research directions are provided at the end.
Literature Review
The related papers are classified into two groups. The first group of papers relates to the routing and scheduling problems for regular delivery operations using fuel-powered vehicles.
Rodrigue implemented a long-term survey of home delivery operations recorded by a carrier in a residential area ( 5 ). The results suggested temporal frequency of deliveries as annual, weekly, daily, and hourly records. Unnikrishnan and Figliozzi compared home delivery operations before, during, and after COVID-19 in a world-class urban cluster in the U.S. West Coast ( 6 ). The results suggested there were dominant increases in household home deliveries during COVID-19 lockdowns. Significant differences were observed in the tendency to home shopping before, during, and after COVID-19. Mommens et al. proposed a multi-agent model to analyze the sustainability of the e-retailing business in Belgium ( 7 ). Comparisons were made between home deliveries and unattended deliveries, among urban, urbanized, and rural regions. The results indicated that home delivery service is preferable in rural and urbanized regions. Unattended deliveries were more capable of being sustained in urban regions.
Yu et al. addressed a vehicle routing problem (VRP) with considerations of time window requirements, uncertain travel time, and customers’ cancellations, by minimizing the cost of carriers’ overtime penalty and customers’ waiting time cost. The model permitted the inclusion of a new customer into the current delivery trip ( 8 ). Dos Santos et al. proposed an integer two-echelon VRP model for home delivery operations, with the inclusion of both specialized and provisional carriers ( 9 ). In case of a failed delivery, lockers were used as an optional delivery address designated by customer. Under these circumstances, a dynamic model was proposed to address the redelivery routing of failed-delivery packages. Ancele et al. investigated cooperation among carriers by setting up a VRP model considering both collection and delivery operations. CPLEX combined with the use of simulated-annealing-based heuristics was designed for model solution, with high computational efficiency ( 10 ). Pan et al. formulated a multi-trip time-dependent VRP model with time windows (TDVRPTW) with the objective of minimizing the overall driving distance while simultaneously satisfying time window requirements, vehicle loading capacity constraint, and maximum driving time constraint ( 11 ).
The second group of papers relates to the routing and scheduling problems for home delivery operations using battery vans.
Lam et al. solved an electric vehicle routing problem with time windows (EVRPTW) with the objective of minimizing the total costs of EVs considering intra-route and inter-route constraints ( 12 ). A branch and cut algorithm combined with Benders and Dantzig–Wolfe decomposition was used to solve the model. A numerical example with 100 customers was used to validate the model. Bac and Erdem evaluated the impacts of some negative factors on the cost-efficiency of EVs in the field of logistics, including the limitation in driving distance, difficulties in locating a recharging pile, and time duration of battery recharging ( 13 ). An EVRPTW was established and a variable neighborhood descent heuristics was used for model solution. Concerning the EVRPTW problem, similar research can be found by Chen et al., Amiri et al., and Vincent et al., but with the inclusion of mixed fleet vehicles ( 14 – 16 ). Lately, increased interest in the field of EVRP is given to nonlinear partial charging of EV. Guo et al. established an integer programming model consisting of a non-linear charging model and a battery wear model. The computational results indicated that wise planning of an EV network could reduce the operational costs of a carrier running EVs ( 17 ). Similar studies include Karakatič, and Zang et al. ( 18 , 19 ).
Mathematical Models for Home Delivery Using Fuel-Powered Vehicles
Home Delivery Models
Door-to-door (DTD) home delivery model
Self-pickup point (SSP) home delivery model
A carrier delivers to the customer only once.
Packages that are failed are diverted to the nearest SPP on the same round.
The customer picks up the failed package from a local SPP.
The EV needs to visit the charging station (if necessary) at a certain point of the delivery process (Figure 1c and d ).
Smart cabinet (SCB) home delivery model
Intelligent home delivery (IHD) model
A carrier visits each SCB only once.
If the customer is not willing to use SCB, the carrier delivers to their home. Under the circumstance of two delivery failures, the package is diverted to the nearest SCB.
If the customer who agrees to use SCB as an intermediate reception address, the package is then delivered to the nearest SCB.
The EV needs to visit the charging station (if necessary) at a certain point of the delivery process (Figure 1g and h ).
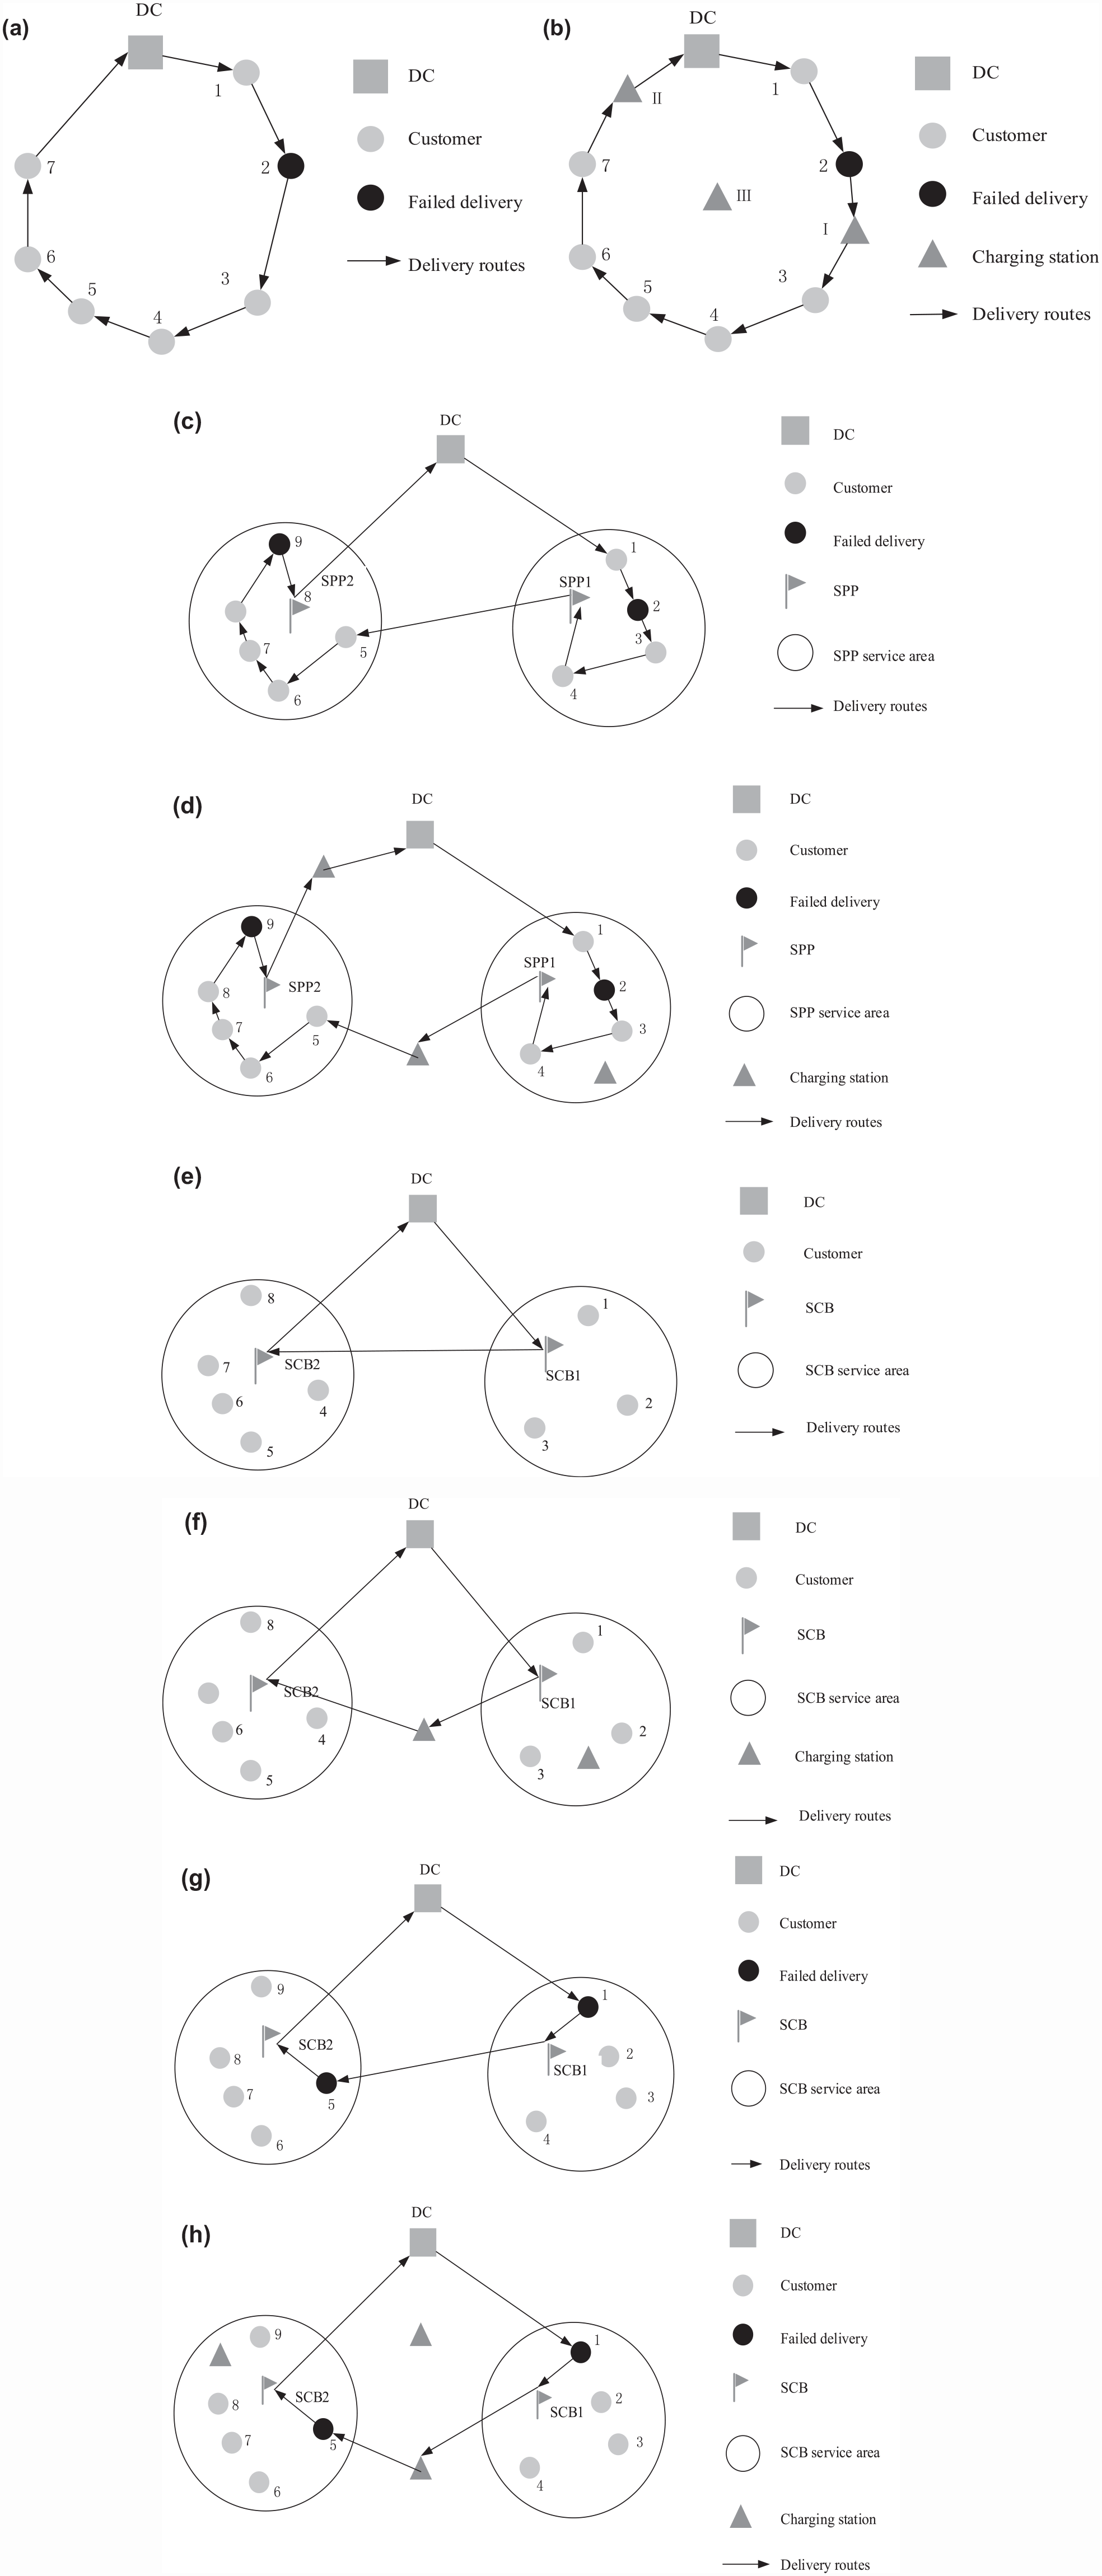
(a) DTD model using fuel-powered vehicle, (b) DTD model using battery EV, (c) SPP model using fuel-powered vehicle, (d) SPP model using battery EV, (e) SCB model using fuel-powered vehicle, (f) SCB model using battery EV, (g) IHD model using fuel-powered vehicle, and (h) IHD model using battery EV.
Mathematical Models for Home Delivery Operations Using Fuel-powered Vehicles
CO2 emissions are computed based on the distance traveled by both carriers and customers. The carrier’s delivery rounds are optimized through a typical VRP model, with inclusion of first-time delivery attempts and second-time attempts (if necessary). The potential CO2 savings from the use of EVs for making deliveries and the use of new home delivery methods for handling failed home deliveries can then be derived.
Statistics show that the average driving speed in Beijing is 44.338 km/h. Considering the impact of freight load and fuel type, the average CO2 emission factor of a typical light goods vehicle (LGV) (with maximum authorized payload of less than 4.5 tonne and vehicle length of less than 6 m) in Beijing is 0.374 kg/km. It is then possible to quantify CO2 emissions based on the carrier’s delivery distance (in km) obtained in this research under four home delivery models. As for the CO2 emission factor of a battery electric LGV (with maximum authorized payload of less than 4.5 tonne, overall driving distance of 100,000 km, driving range of 170 km, and electricity consumption of 70 kW-h per 100 km), it is important to consider the life-cycle emissions of EVs including both the electricity production and the consumption process, with the former accounting for 10%–40% of an EV’s emissions of its life cycle. Considering that, currently, the electric energy structure in China mainly relies on fossil fuels such as coal and oil, the process of burning fossil fuels obviously produces significant amounts of CO2. Based on the statistics that the electricity emission factor in Beijing is 0.884 kg CO2/(kW-h) and the electricity consumption per 100 km of battery electric LGV, the CO2 emission factor of a battery electric LGV is 0.199 kg/km considering the life cycle of the vehicle (including raw material acquisition, parts manufacturing, vehicle assembly, vehicle usage, maintenance, and recycling).
Model Assumptions
Parcel collection from customer’s home is not considered.
Customer demand is given and needs to be satisfied.
All delivery vehicles need to return to the depot at the end of the delivery round.
Delivery vehicles are of the same type.
Fuel refilling is not considered.
The construction fee or rental fee for SPPs and SCBs is not considered.
Variables and Notations
Table 1 presents all variables to be used in the model.
Variables to Be Used in the Proposed Model
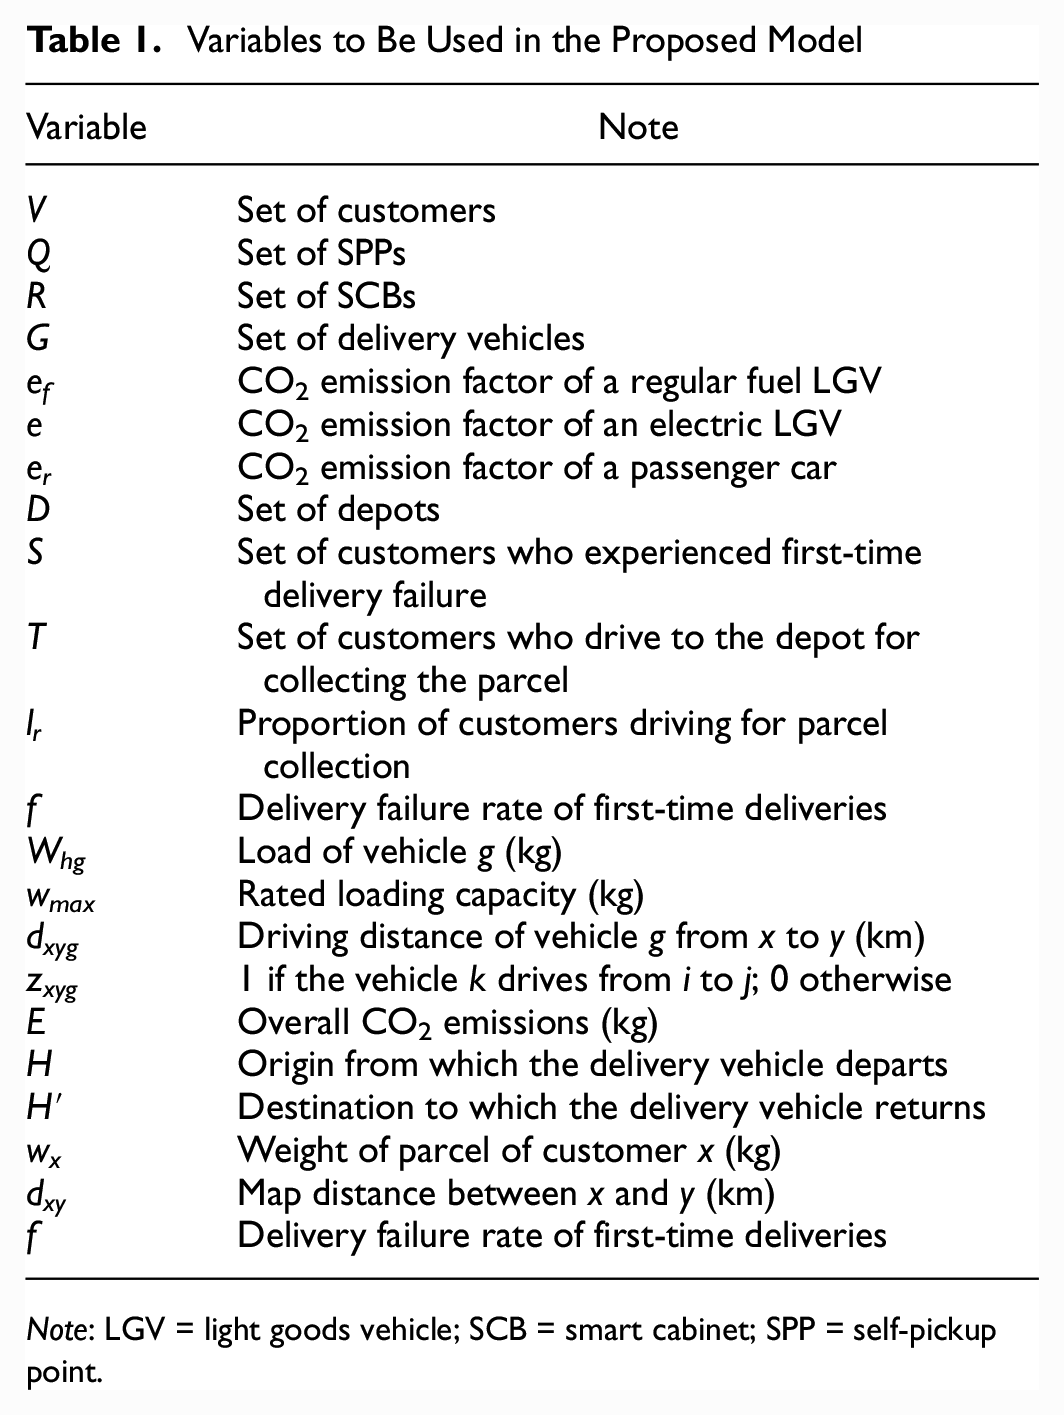
Note: LGV = light goods vehicle; SCB = smart cabinet; SPP = self-pickup point.
DTD Home Delivery Model
S.T.


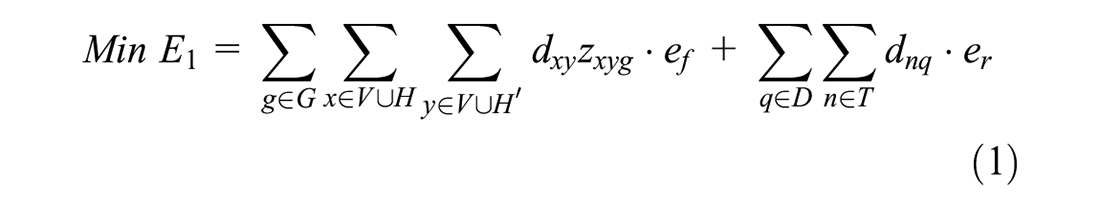
Equation 1 minimizes the total CO2 emissions associated with carriers making deliveries and customers picking up the failed delivery. Equations 2 and 3 ensure that each customer needs be visited once within a delivery round. The failed first-time delivery has to be delivered on the next round. Equation 4 tries to make a flow balance. Equations 5 and 6 ensure that the origin and destination of a delivery round is the carrier’s depot. Equation 7 is the load capacity constraint. Equation 8 determines the delivery sequence.
SPP Delivery Model
S.T.

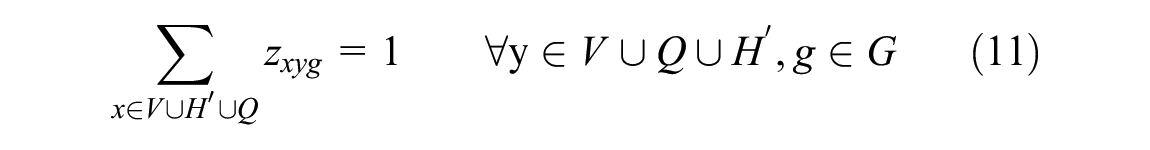
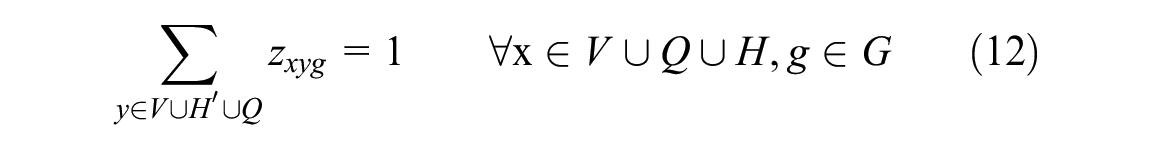


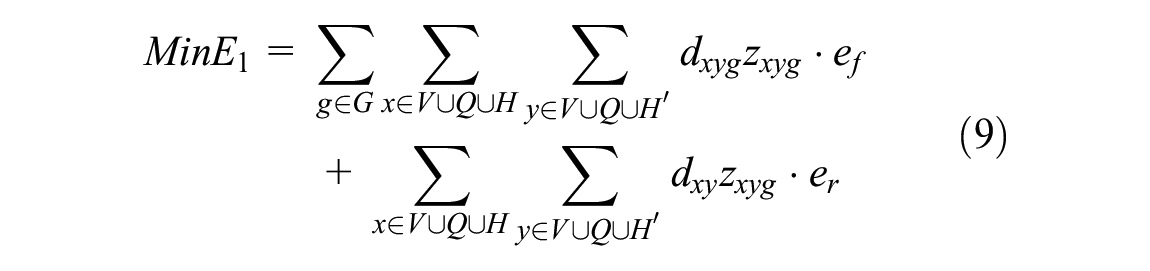
Equation 9 minimizes the total CO2 emissions associated with the carrier’s trip in making deliveries and the customer’s trip in driving to the SPP for picking up the failed delivery. Note that, under the SPP model, the failed first-time delivery is taken to the nearest SPP at a certain point of the delivery round. Equations 10 and 11 ensure that each customer needs to be visited once within a single delivery round. Equation 12 indicates that a vehicle needs to depart from the customer’s home after it fulfills the delivery order. Equations 13 and 14 ensure that a delivery vehicle starts from the carrier’s depot and returns to it after all the deliveries are made. Equation 15 limits the loading capacity. Equations 16 to 19 ensure that the SPP is the last visiting point within the service area of this SPP. Equation 20 makes sure that two SPPs cannot be visited successively. Equation 21 define the decision variables which determine the delivery sequence and consider the inclusion of a charging station in the trip (if necessary).
SCB Home Delivery Model
S.T.


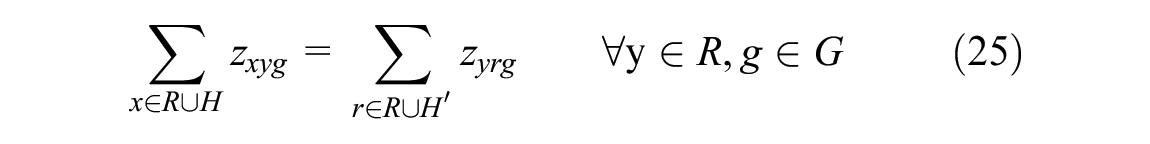


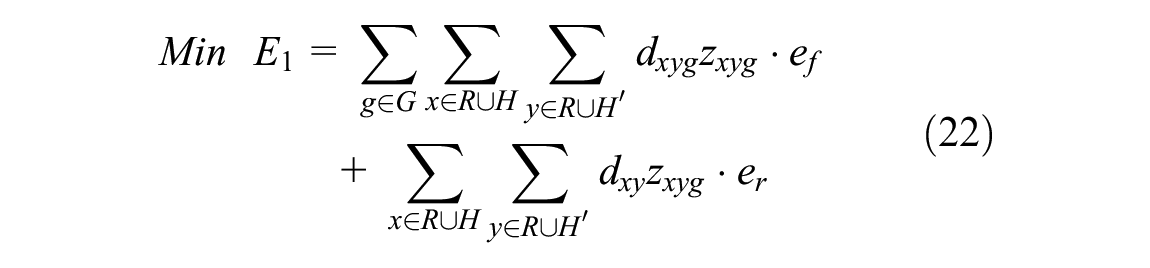
Equation 22 minimizes the total CO2 emissions associated with the carrier’s trip in making deliveries to SCBs and the customer’s trip in driving to SCBs for picking up the delivery. Equations 23 and 24 ensure that each customer needs be visited once within a delivery round. Equation 25 tries to make a flow balance. Equations 26 and 27 ensure that the origin and destination of a delivery round is the carrier’s depot. Equation 28 is the loading capacity constraint. Equation 29 is a decision variable.
IHD Home Delivery Model
S.T.

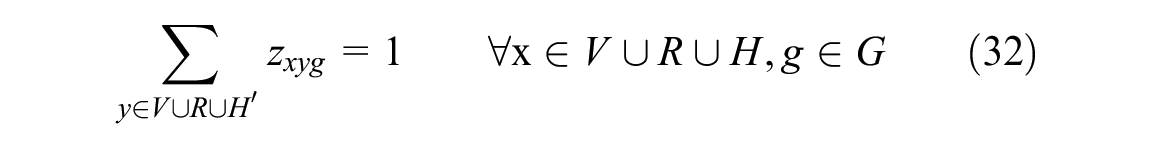


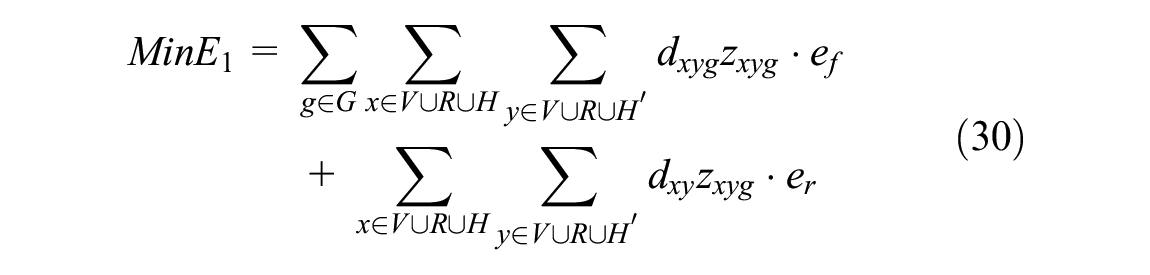
Equation 30 minimizes the total CO2 emissions associated with carrier’s trip in making deliveries to SCBs or to the customer’s home, and the customer’s trip in picking up the parcel from an SCB. Note that, under IHD delivery model, the carrier delivers to the home of a customer who refuses to use an SCB. Otherwise, the parcel is delivered to the nearest SCB directly. Equations 31 and 32 ensure that each customer needs be visited once within a delivery round. Equation 33 tries to make a flow balance. Equations 34 and 35 ensure that the origin and destination of a delivery round is the carrier’s depot. Equation 36 is the loading capacity constraint. Equations 37 and 38 make sure that the SCB is the last visiting point within the service area of that SCB. Equations 39 and 40 try to make a flow balance. Equations 41 and 42 guarantee that any two customers served by different SCBs cannot be visited successively. Equation 43 determines the delivery sequence.
It is known that VRP is an NP-hard problem. A hybrid ant colony tabu search (TS) algorithm is developed here (Figure 2). The ant colony optimization (ACO) algorithm is widely used to solve hard combinatorial optimization problems in the field of transportation. To better control the pheromone distribution, this paper incorporates TS techniques to balance exploration and exploitation, and to find high-quality solutions for the VRP. TS is a neighborhood-search-based method which utilizes a memory structure to avoid being trapped in local optima. It improves the efficiency of the searching process by storing a tabu list of local solutions that were used to restrict the search by forbidding moves to some poor neighbor solutions that already have been visited. We present the implementation steps of the proposed algorithm in Figure 2.
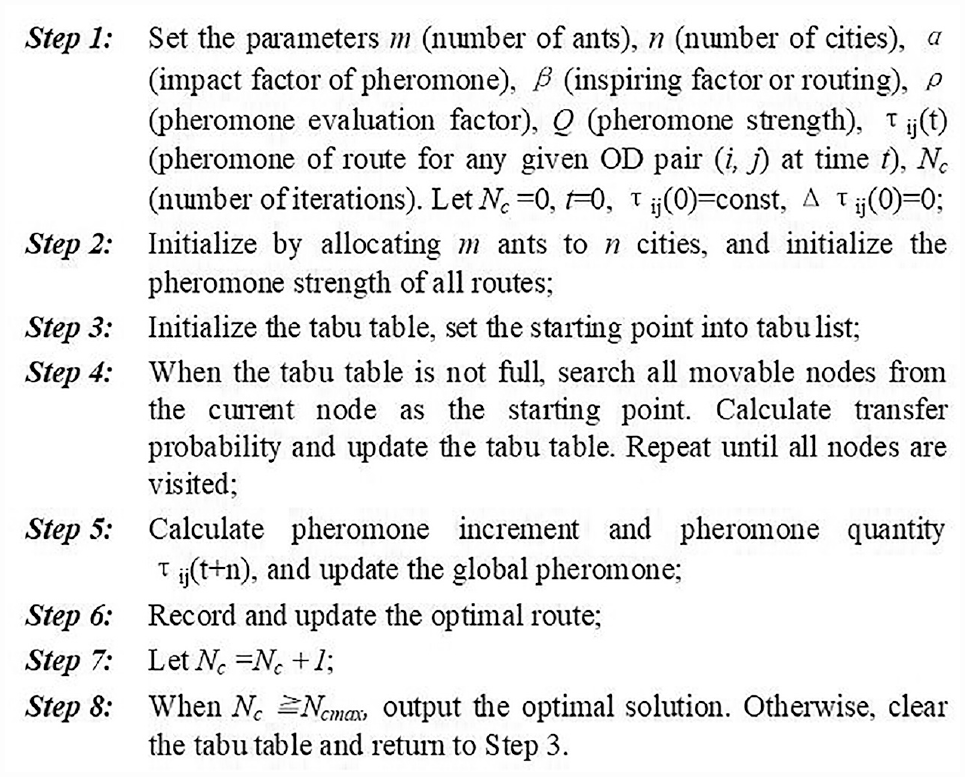
Process of ant colony algorithm combined with tabu search.
Case Study
A carrier, H, who serves a densely populated residential area in north Beijing is selected in this case study, because it currently runs all the four delivery models mentioned above and owns a widespread SPP and SCB network in Beijing. A real network with 500 customers, 16 SPPs, and 16 SCBs is constructed (1,260 m2, population 980,000). Figure 3 presents the addresses of all customers, SPPs, and SCBs.
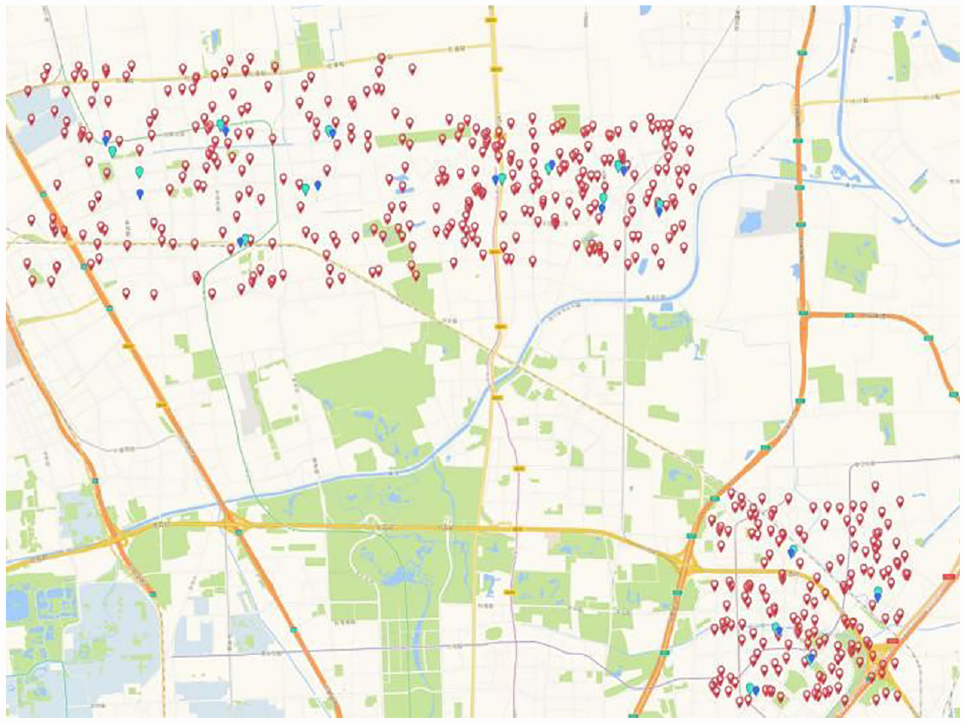
A map showing the addresses of residents, self-pickup points (SPPs), and smart cabinets (SCBs).
Basic Data
The impacts of different proportions of home delivery failures on CO2 emissions are evaluated, shifting from 0% to 40%. Computations are firstly performed for a successful first-time delivery in the DTD model. This value is then used as a reference point when various delivery failure ratios are compared.
It is assumed that, if the first delivery attempt fails, half of second home deliveries fail too. It is a commonsense that the depot of the carrier company is normally distant from the large residential area. In this case study, the depot is 11.2 km away. Therefore, it is assumed that 80% of customers drive a car to the depot. By contrast, the locations of SPPs and SCBs are close to customers’ houses. The average walking distance to an SPP is 1.0 km, and 0.9 km to an SCB. Only a slight proportion of people (2%) would drive to SPPs and SCBs, considering the probability of a combined journey.
Results Analysis
Table 2 presents CO2 emissions associated with carriers in making deliveries and customers in retrieving their missed parcels under four delivery models.
CO2 Emissions of Fuel-Powered Vehicles for Making Deliveries to 500 Customers
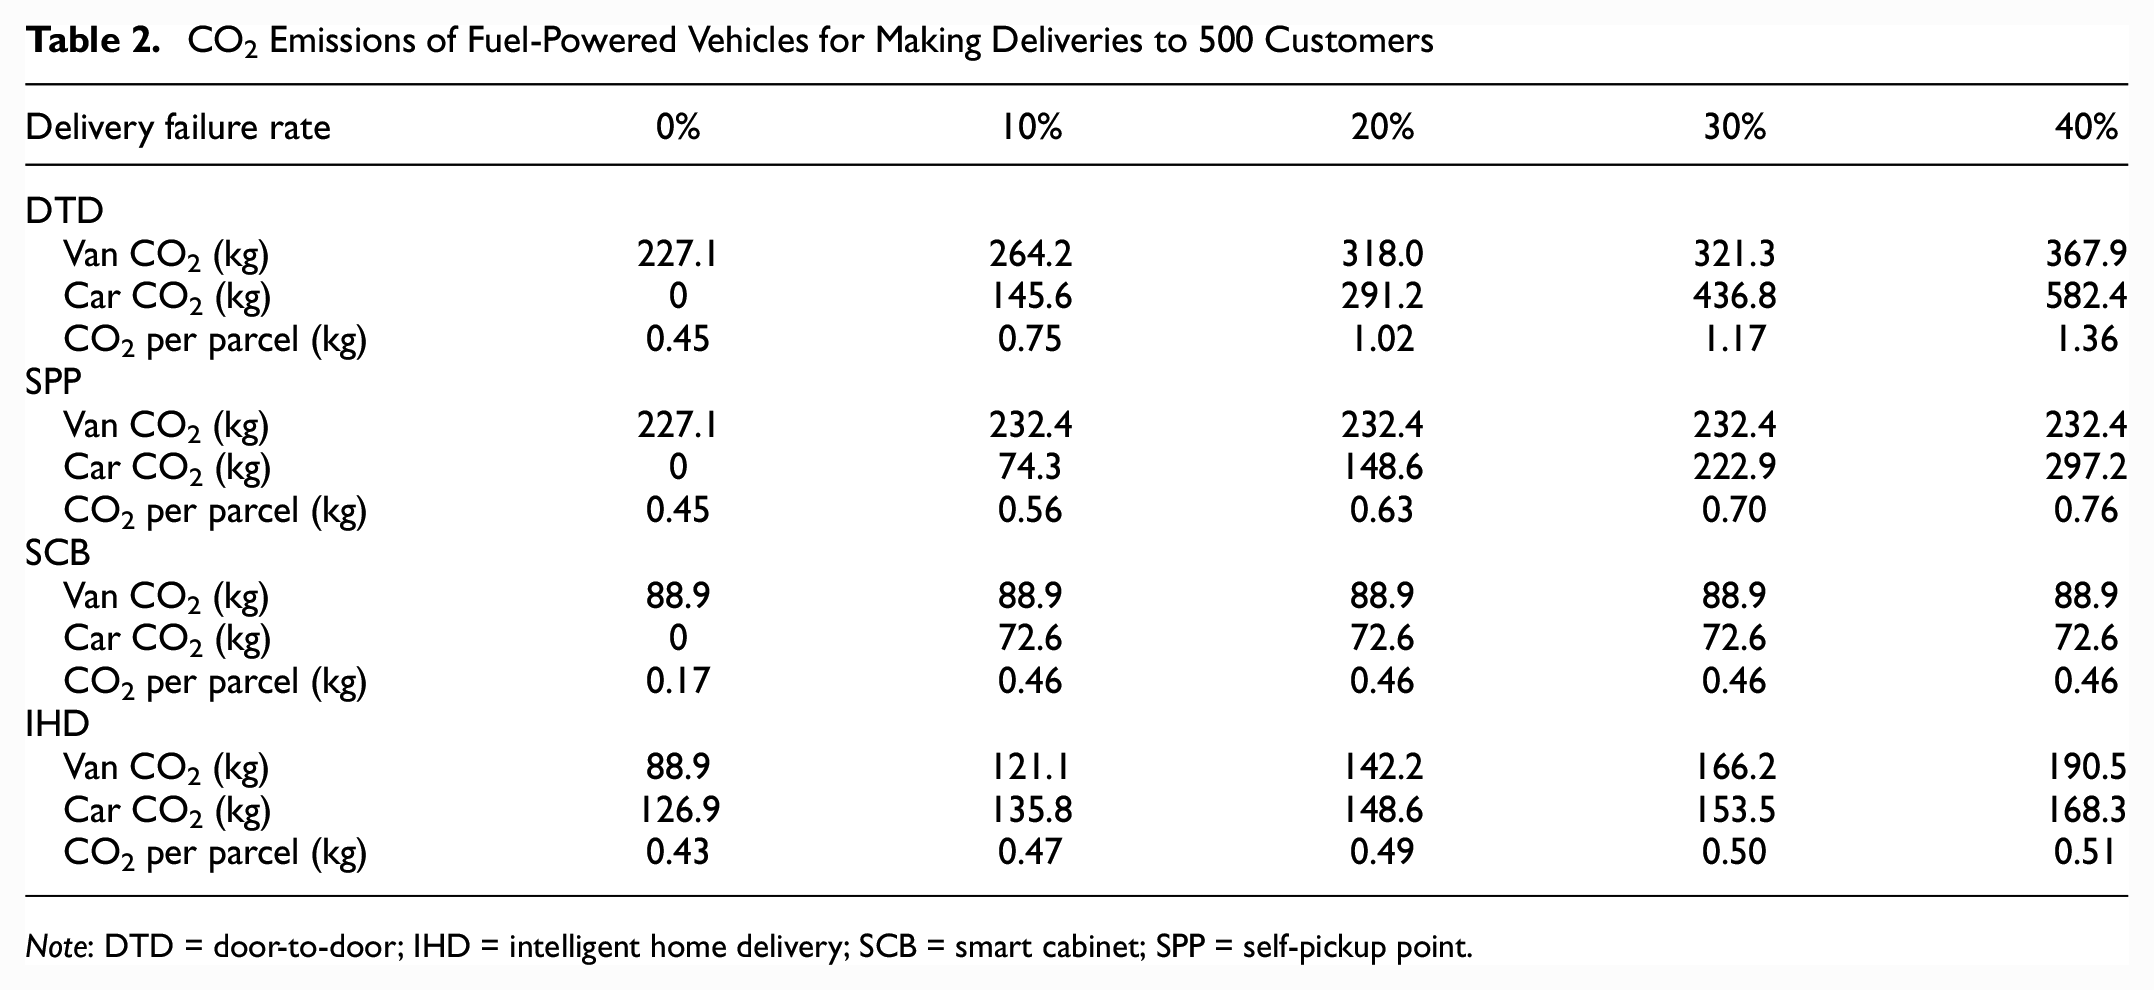
Note: DTD = door-to-door; IHD = intelligent home delivery; SCB = smart cabinet; SPP = self-pickup point.
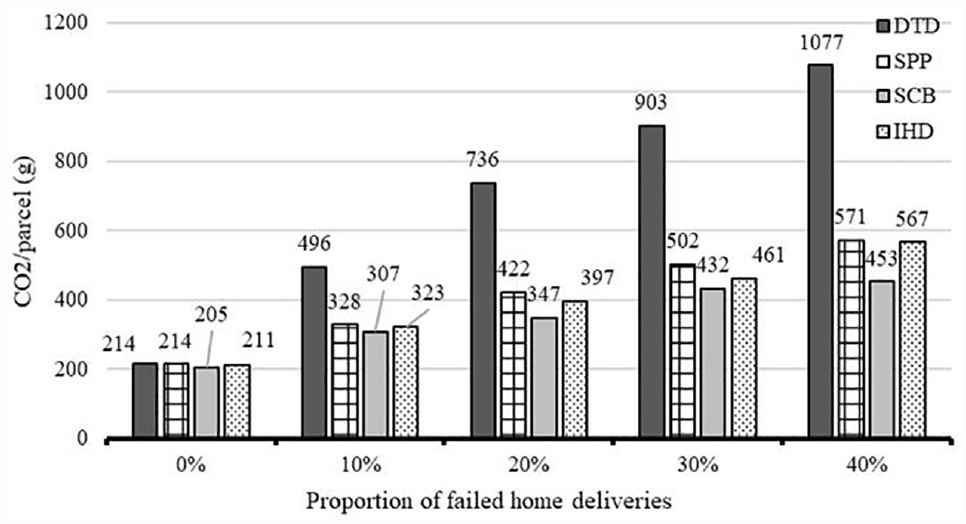
Table 2 suggests that the treatments of the failed deliveries greatly increase the carriers’ CO2 in the DTD model because of the extra efforts in making the second-time delivery attempts. When 40% of deliveries fail, 62% extra CO2 emissions per parcel are produced in the DTD model. Obviously, it is of great practical consequence to develop efficient delivery models to deal with those failed packages. In this research, CO2 emissions are further calculated per unit drop considering the combined contributions to air pollution from both carriers’ delivery trips using a van and customers’ collection journeys using a car. Figure 4 presents the variations of CO2/parcel (gram) among the four delivery models under different delivery failure ratios. The SPP, SCB, and IHD models are all proved to substantially reducing pollution measured as CO2 per parcel, with the SCB model being the most effective (by between 36.9% and 65.9% for a variety of ratios of delivery failures). Additionally, the reductions in van CO2/parcel through using those three models grows with the delivery failure proportion. For example, for 40% of delivery failures, the CO2/parcel produced by the DTD model is decreased by a maximum of 66% through the utilization of the SCB model. It thus indicates a very positive future by promoting SPP/SCB/IHD delivery models to accommodate the increasing needs of home shopping in urban area in which there is high possibility of nobody being at home during the daytime. A combined design of SCB and SPP networks might improve the sustainability of the last-mile solutions in the city, which leads to a future research direction.
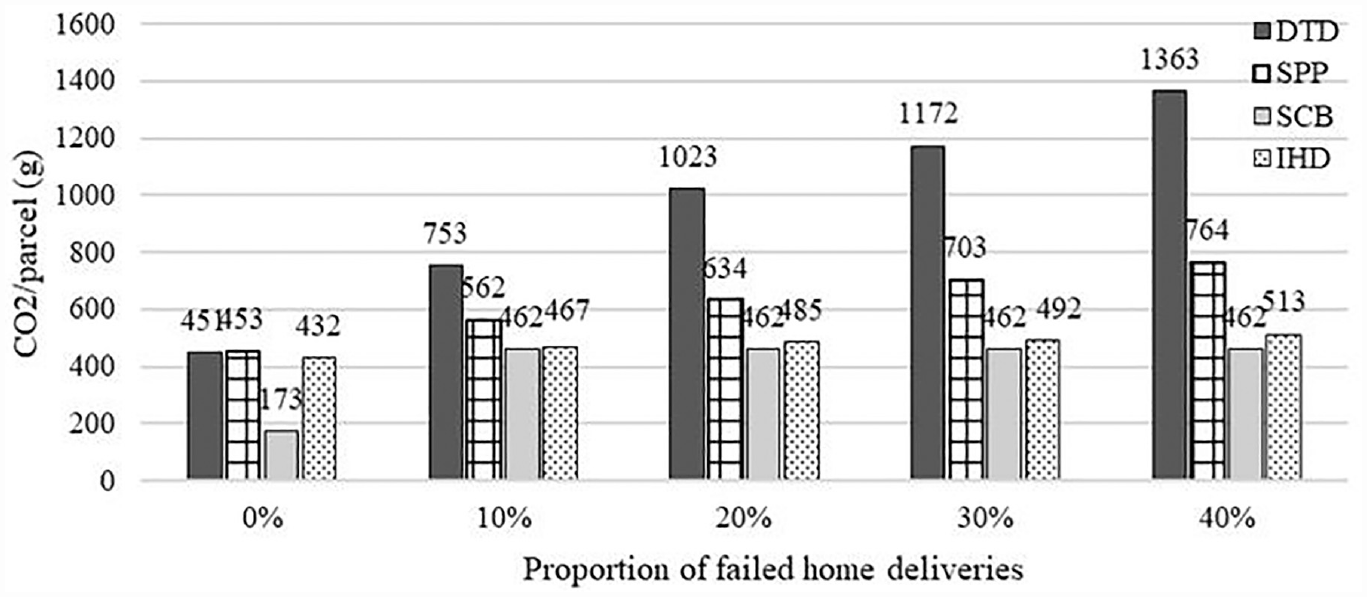
CO2/parcel of home delivery models using fuel-powered vans.
To further investigate the respective contribution of van and car to CO2 emissions per parcel, Figure 5 illustrates the ratio of emission source either from the delivery van or personal car. The results suggest that the personal collection trips to/from the carrier’s depot cause a significant proportion of the CO2 emissions per parcel, up to 48% overall under 40% of delivery failures in the DTD model. It thus indicates that the customers’ emissions associated with collecting the missed packages could be potentially reduced by using SPPs and SCBs as intermediate collection points instead of the depot. Surely, the advantage of the SCB and SPP models will be more remarkable if the depot is even further away from the city center and the SCBs or SPPs are even closer to customers.
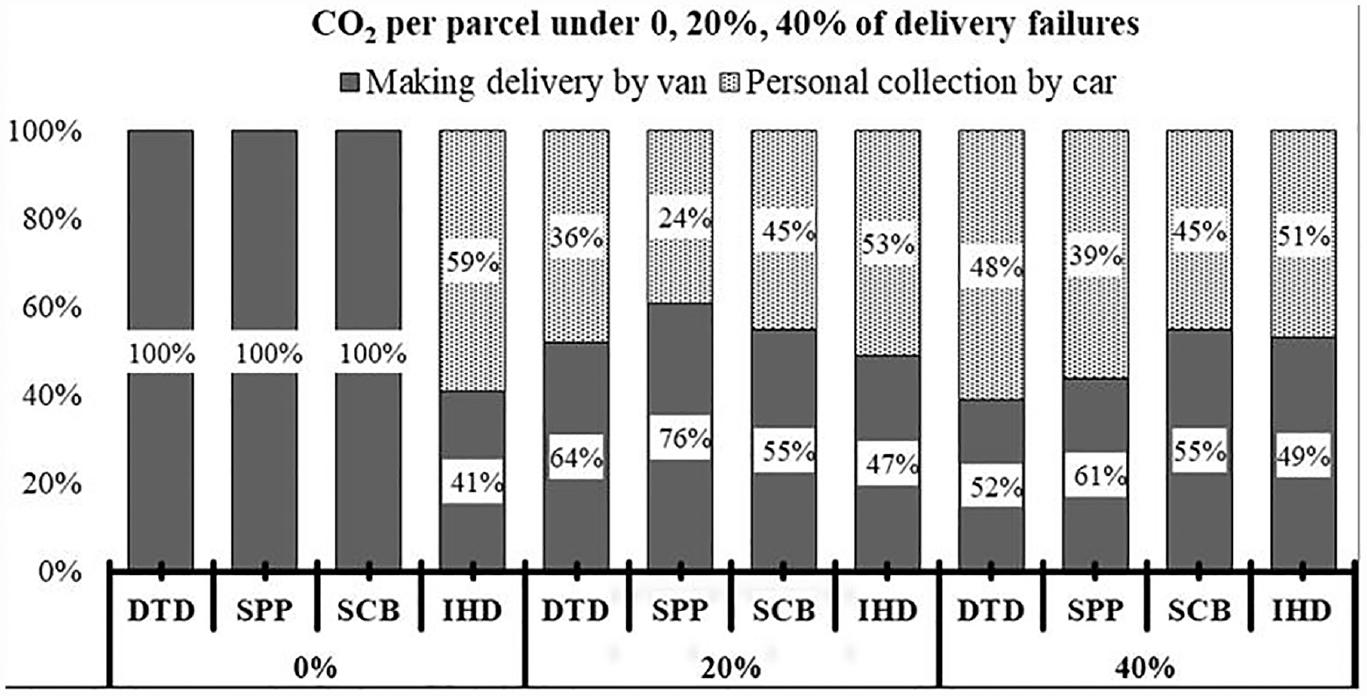
Ratio of CO2/parcel of delivery van or personal car.
Mathematical Models for Home Delivery Using EVs
Mathematical Models
Model Assumptions
Pick-up from customers’ homes is not considered.
Customer demand is given.
All delivery vehicles need to go back to the depot at the end of the delivery process.
Delivery vehicles are of the same type.
Vehicle electricity consumption does not vary with load.
The EV needs to visit the charging station (if necessary) at a certain point of the delivery process.
A network of public recharging stations is given.
The construction fee or rental fee for SPPs and SCBs is not considered.
Variable Definition
Table 3 presents all the variables to be used in the proposed model.
Variables to Be Used
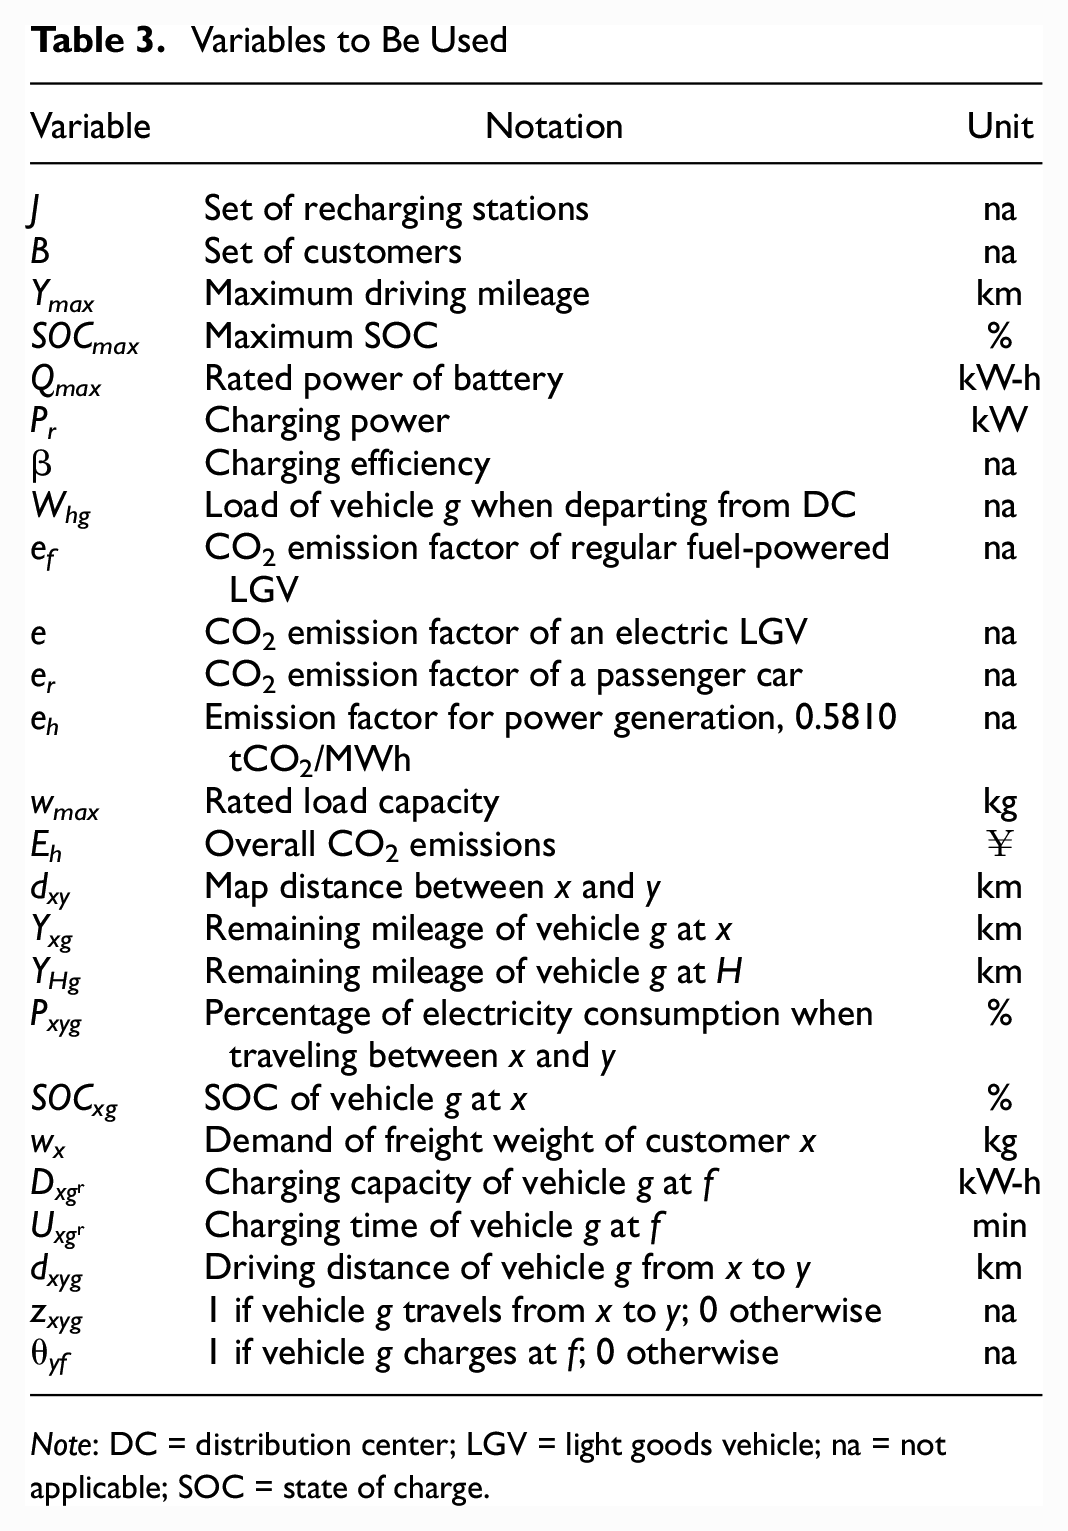
Note: DC = distribution center; LGV = light goods vehicle; na = not applicable; SOC = state of charge.
DTD Home Delivery Model
S.T.


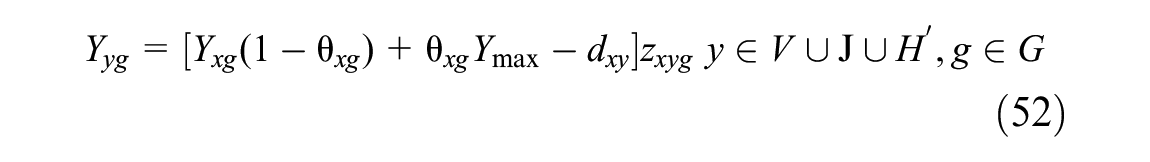


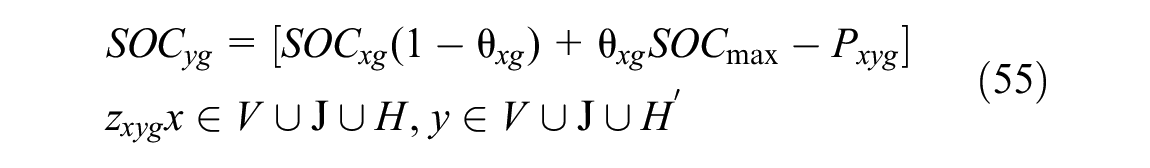


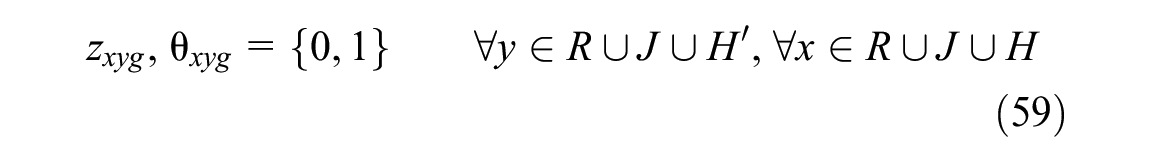
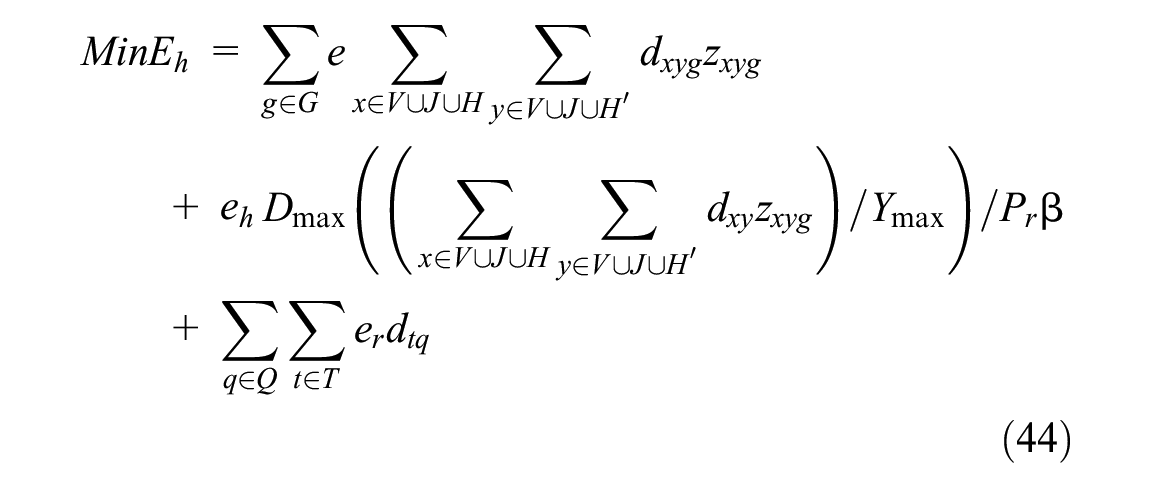
Equation 44 aims to minimize the sum of transport emissions of delivery vehicles and private cars, and emissions associated with power generation for re-charging. Equations 45 and 46 ensure that each customer needs to be visited once within a single delivery round. Equation 47 guarantees the balance of traffic flow. Equations 48 and 49 ensure that the origin and destination of a delivery round is the carrier’s depot. Equation 50 is the loading capacity constraint. Equation 51 indicates that the remaining mileage of the EV is equal to or greater than 0. Equation 52 determines the remaining driving distance. Equations 53 and 54 suggest that the battery is full when departing from the depot and the state of charge (SOC) is maximum. Equation 55 calculates the SOC. Equations 56 and 57 determine the charging capacity and charging time, respectively. Equation 58 infers that the EV needs to go to a designated recharging station. Equation 59 determines the delivery sequence and considers the inclusion of charging stations in the trip (if necessary).
SPP Home Delivery Model
S.T.


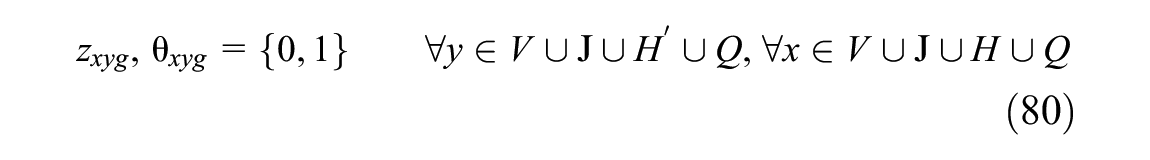
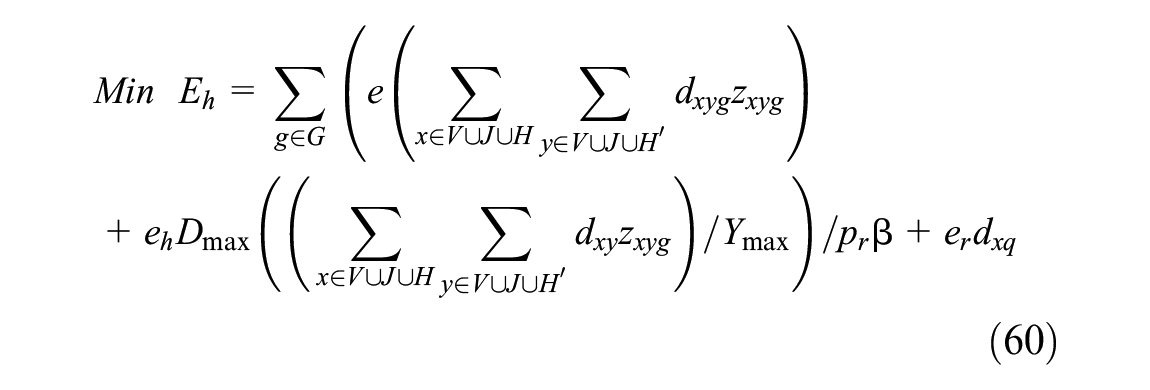
Equation 60 aims to minimize the sum of transport emissions of delivery vehicles and private cars, and emissions associated with power generation for EV re-charging. Equations 61 and 62 ensure that each customer needs to be visited once within a single delivery round. Equation 63 guarantees the balance of traffic flow. Equations 64 and 65 ensure that the origin and destination of a delivery round is the carrier’s depot. Equation 66 is the load capacity constraint. Equations 67 to 70 ensure that the SPP is the last visiting point within the service area of this SPP. Equation 71 makes sure that any two SPPs are not connected directly. Equation 72 indicates that remaining mileage of the EV is equal to or greater than 0. Equation 73 determines the remaining driving distance. Equations 74 and 75 suggest that the battery is full when departing from the depot and the SOC is maximum. Equation 76 calculates the SOC. Equations 77 and 78 determine the charging capacity and charging time, respectively. Equation 79 infers that the EV needs to go to a designated recharging station. Equation 80 determines the delivery sequence and considers the inclusion of charging stations in the trip (if necessary).
SCB Home Delivery Model
S.T.


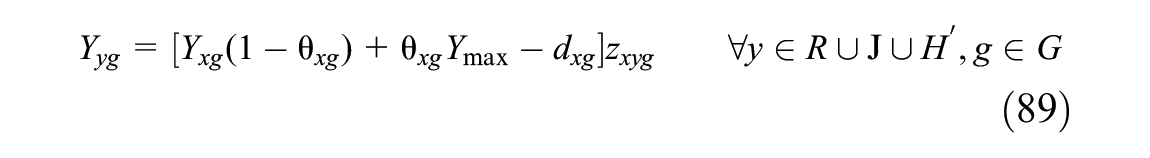


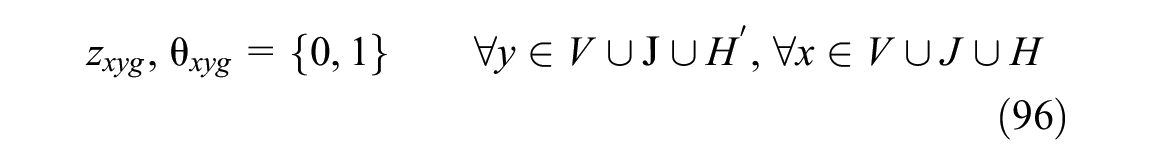
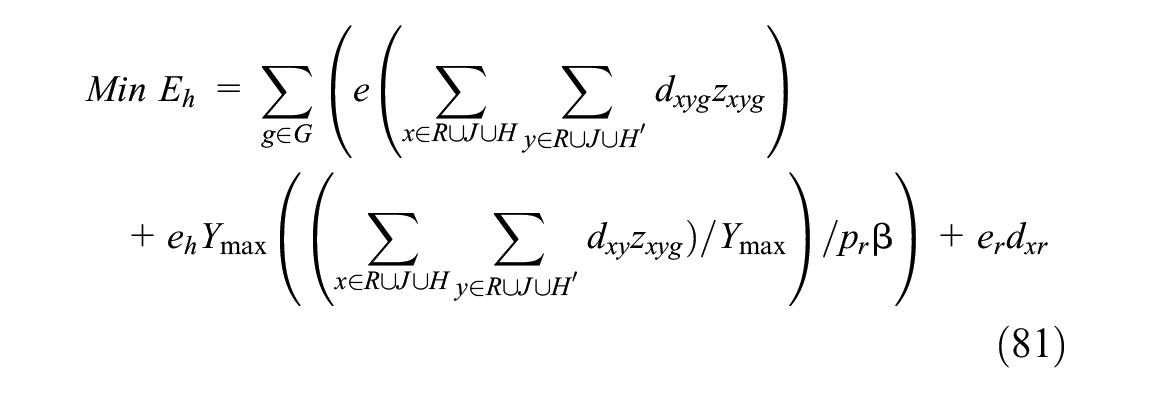
Equation 81 aims to minimize the sum of transport emissions of delivery vehicles and private cars, and emissions associated with power generation for EV re-charging. Equations 82 and 83 ensure that each customer needs to be visited once within a single delivery round. Equation 84 guarantees the balance of traffic flow. Equations 85 and 86 ensure that the origin and destination of a delivery round is the carrier’s depot. Equation 87 is the loading capacity constraint. Equation 88 indicates that remaining mileage of the EV is equal to or greater than 0. Equation 89 determines the remaining driving distance. Equations 90 and 91 suggest that the battery is full when departing from the depot and the SOC is maximum. Equation 92 calculates the SOC. Equations 93 and 94 determine the charging capacity and charging time, respectively. Equation 95 infers that the EV needs to go to a designated recharging station. Equation 96 determines the delivery sequence and considers the inclusion of charging stations in the trip (if necessary).
IHD Home Delivery Model
S.T.


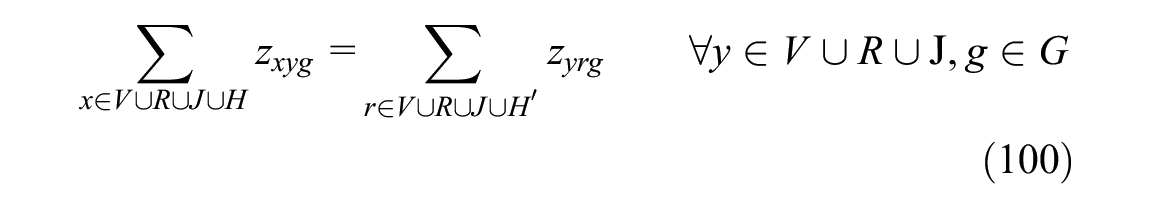


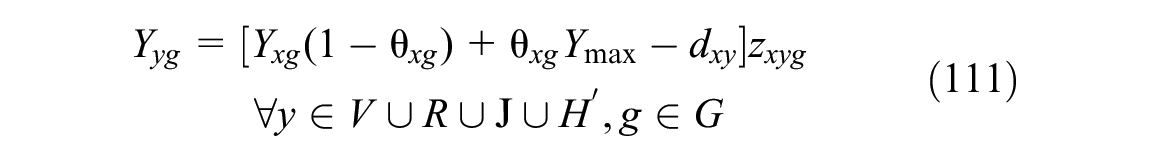


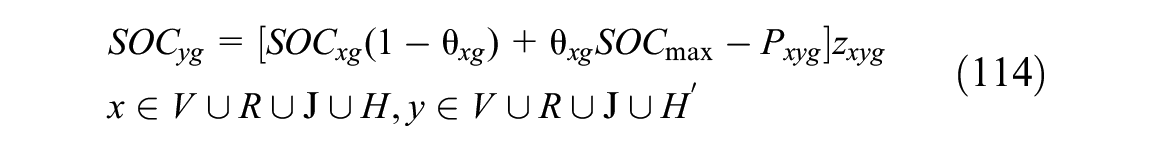


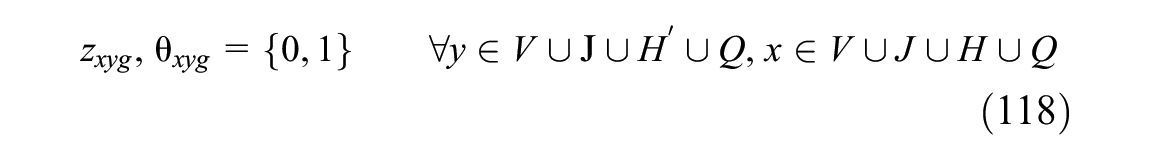
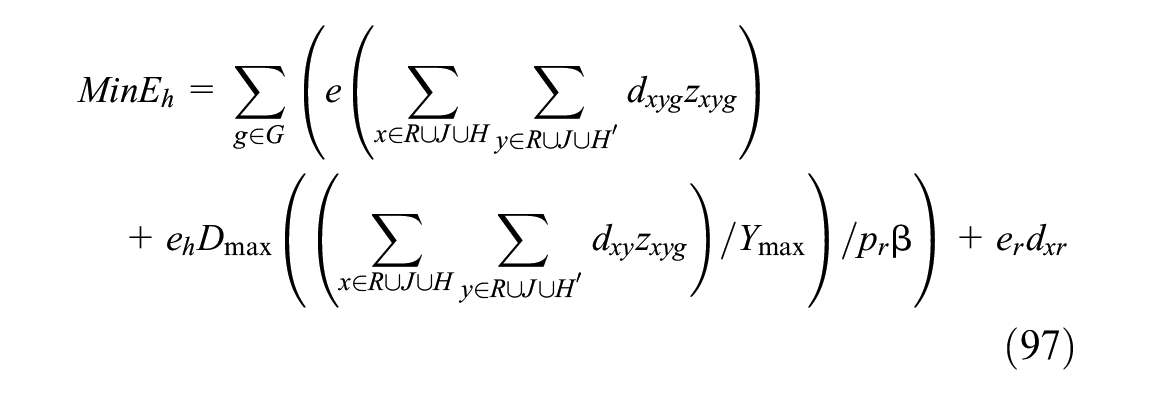
Equation 97 aims to minimize the sum of transport emissions of delivery vehicles and private cars, and emissions associated with power generation for EV re-charging. Equations 98 and 99 ensure that each customer needs to be visited once within a single delivery round. Equation 100 guarantees the balance of traffic flow. Equations 101 and 102 ensure that the origin and destination of a delivery round is the carrier’s depot. Equation 103 is the loading capacity constraint. Equations 104 to 107 ensure that the SCB is the last visiting point within the service area of this SCB. Equations 108 and 109 ensure that any two customers served by two individual SCBs cannot be visited be visited successively. Equation 110 indicates that remaining mileage of the EV is equal to or greater than 0. Equation 111 determines the remaining driving distance. Equations 112 and 113 suggest that battery is full when departing from the depot and the SOC is maximum. Equation 114 calculates the SOC. Equations 115 and 116 determine the charging capacity and charging time, respectively. Equation 117 infers that the EV needs to go to a designated recharging station. Equation 118 determines the delivery sequence and considers the inclusion of charging stations in the trip (if necessary).
Solution Algorithm
An improved ant colony algorithm is proposed in Figure 6 for model solution.
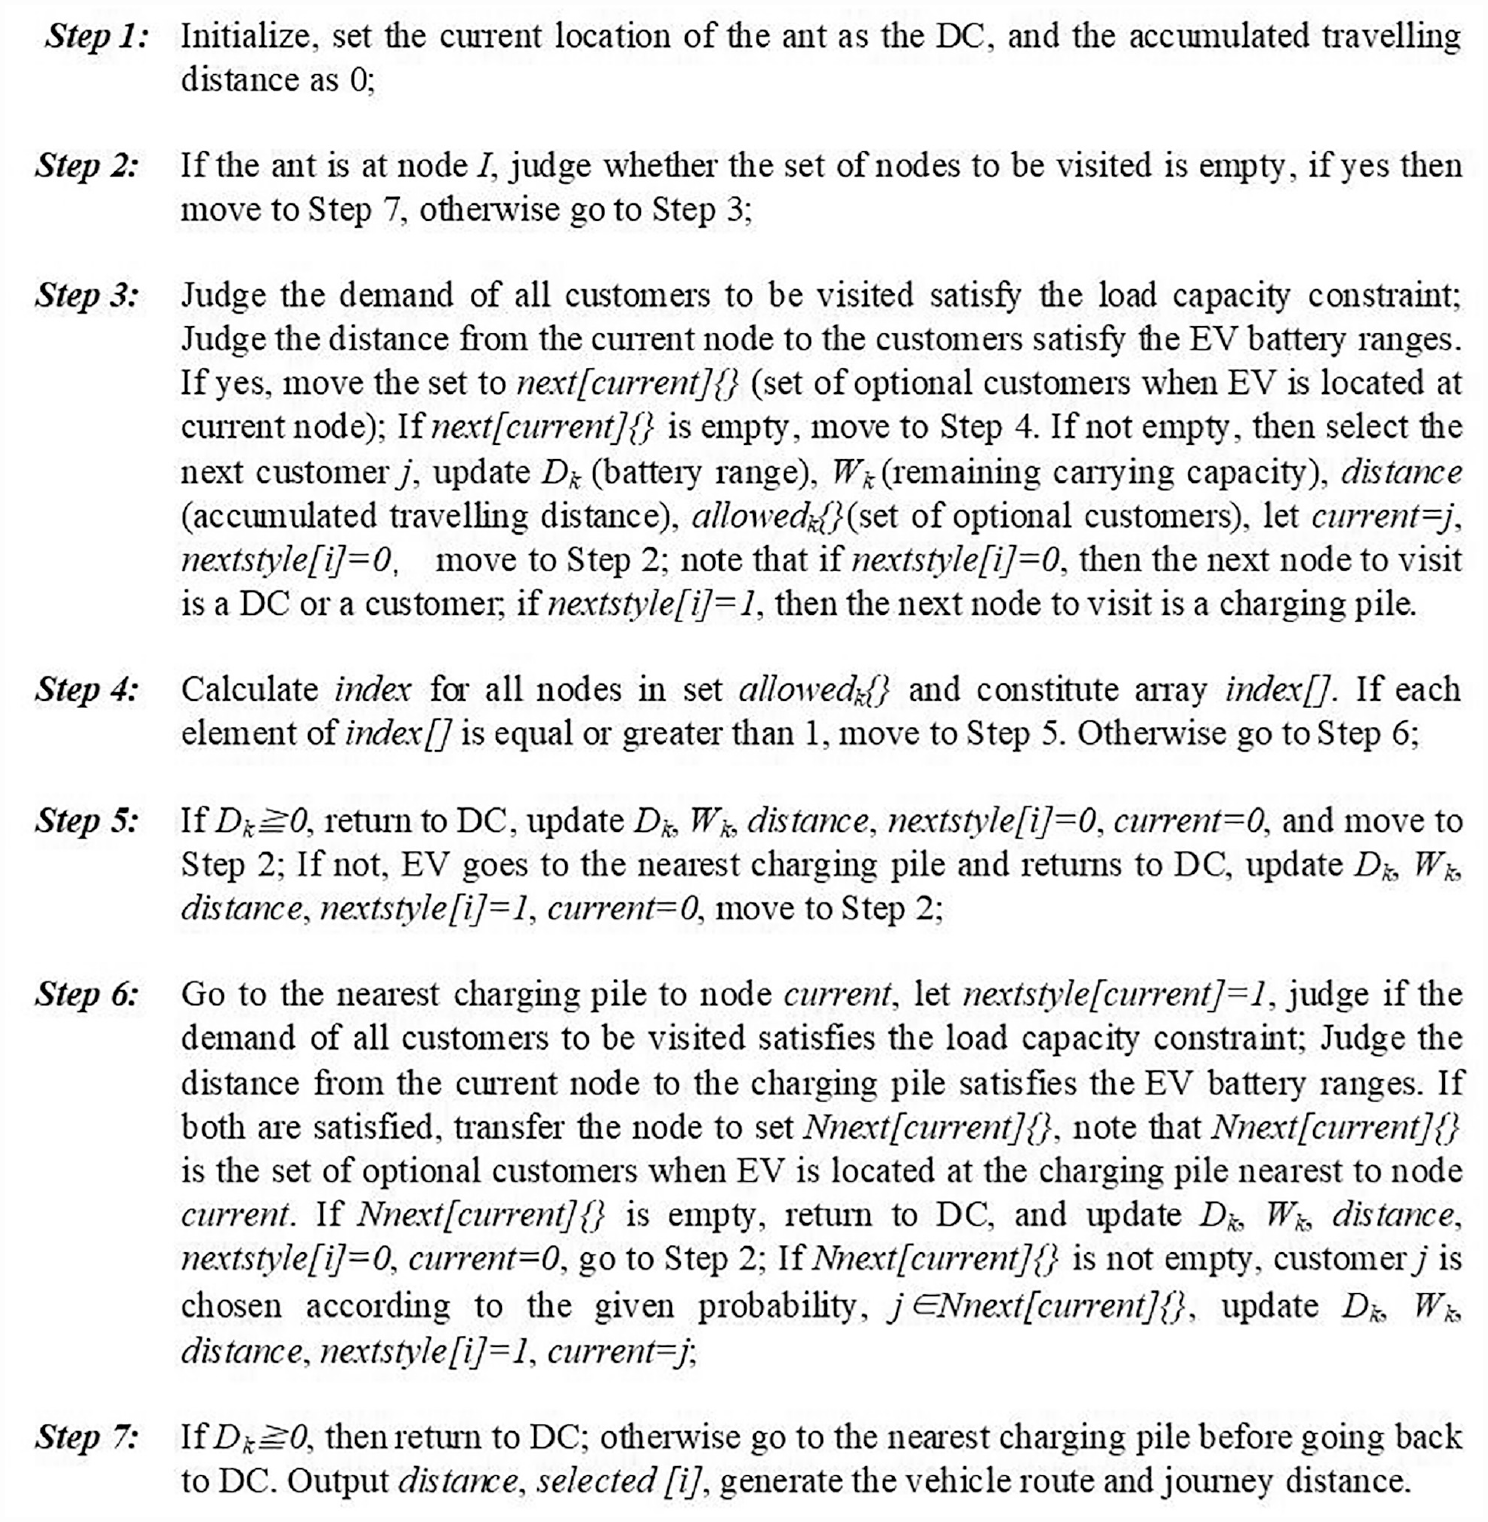
Flowchart of the proposed ant algorithm for the electric vehicle routing problem model solution.
Case Study
The same sample network as in Figure 3 is used as a case study here. The computational results are presented in Table 4 and Figure 7.
CO2 Emissions of Battery Freight Vehicles for Making Deliveries to 500 Customers
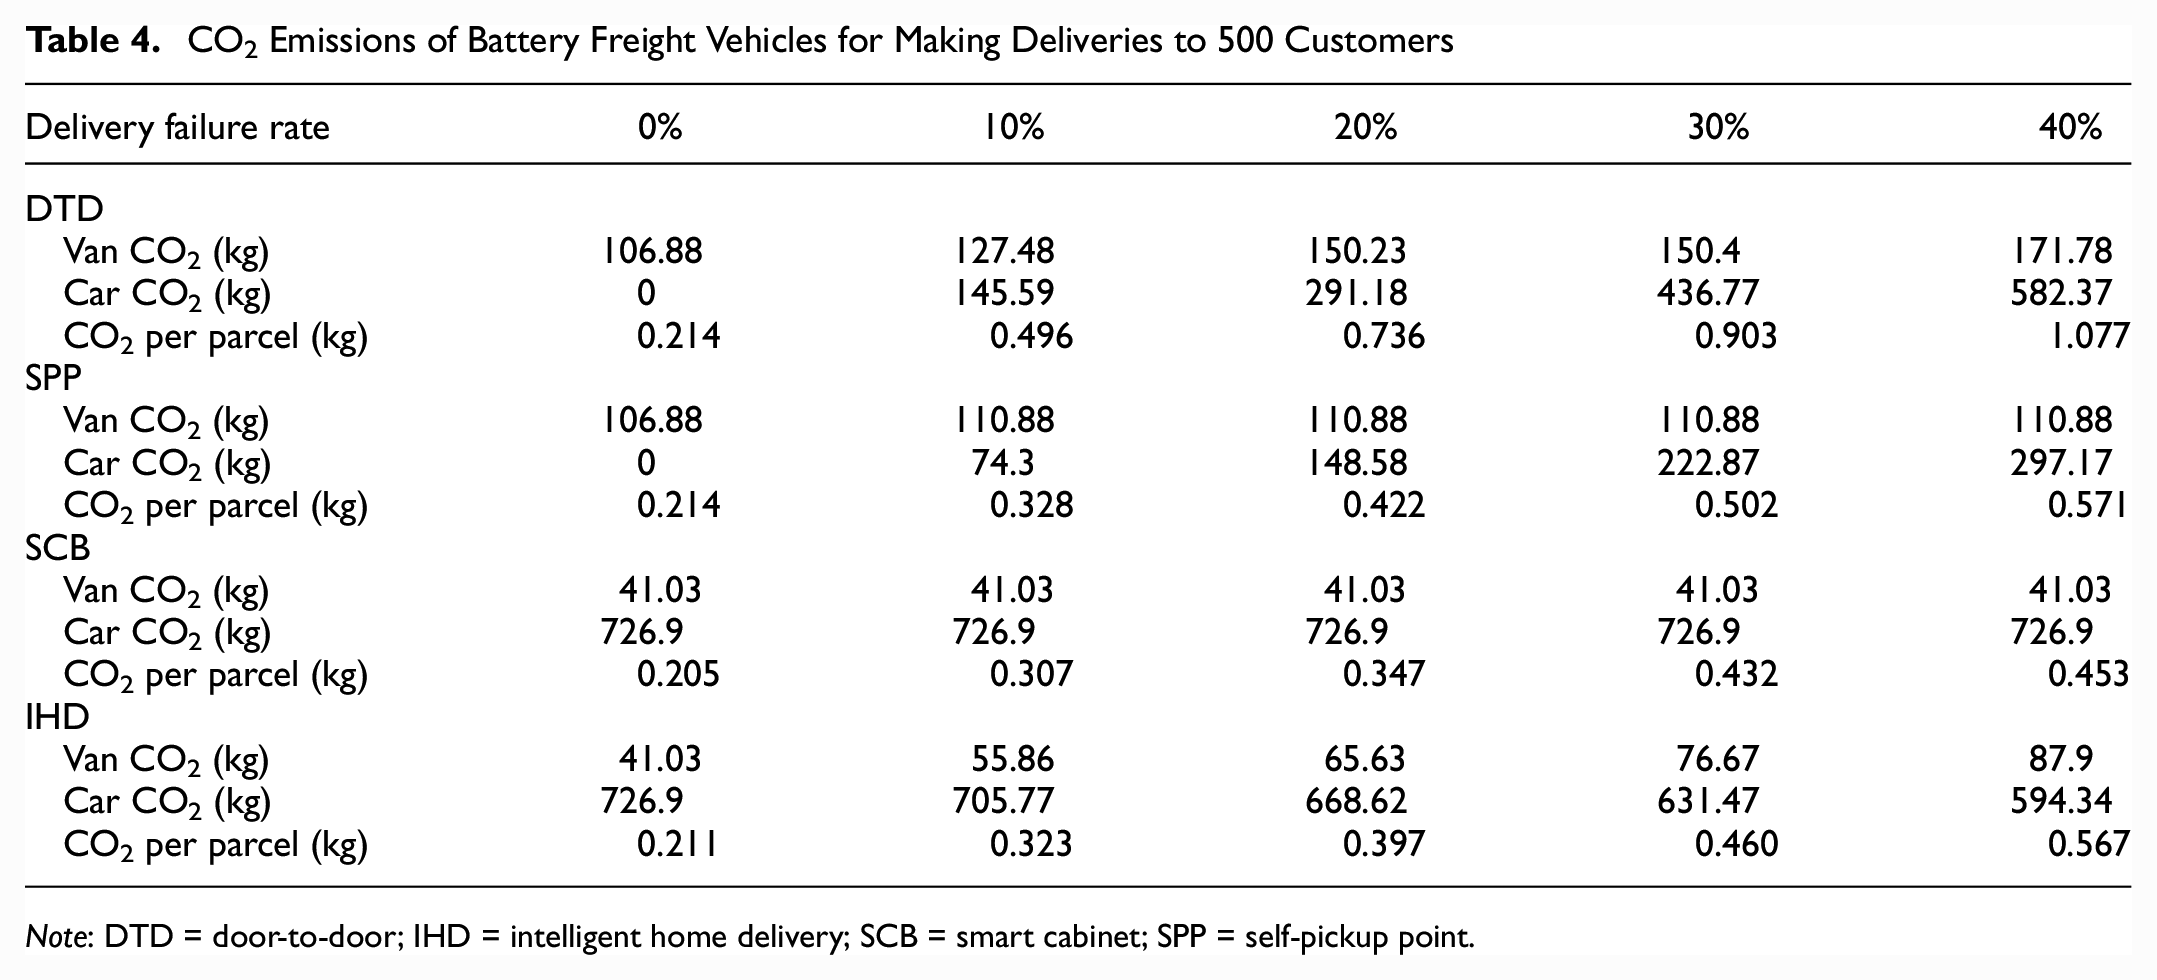
Note: DTD = door-to-door; IHD = intelligent home delivery; SCB = smart cabinet; SPP = self-pickup point.
CO2/parcel of home delivery models using battery vans.
All three new home delivery models using EVs are capable of significantly reducing CO2 emissions per parcel. For example, emissions of CO2 per average package increase from 214 g when all first-time deliveries are successful, to 1,077 g under the worst-case scenario when 40% of deliveries fail. The reductions increase with the ratio of first-time delivery failures. For example, the reductions made by the SPP model in CO2 per average package increase from 1% to 47% when the delivery failure ratio increases from 0% to 40%. Among those three new delivery models, the SCB model is the most effective solution in reducing the CO2 emissions. The finding is in line with the conclusion from the case study in Figure 3.
It is time to proceed to undertake a comparative analysis of using battery vans against using fuel-powered vans for making last-mile deliveries under a variety of delivery failure ratios (Figure 8).
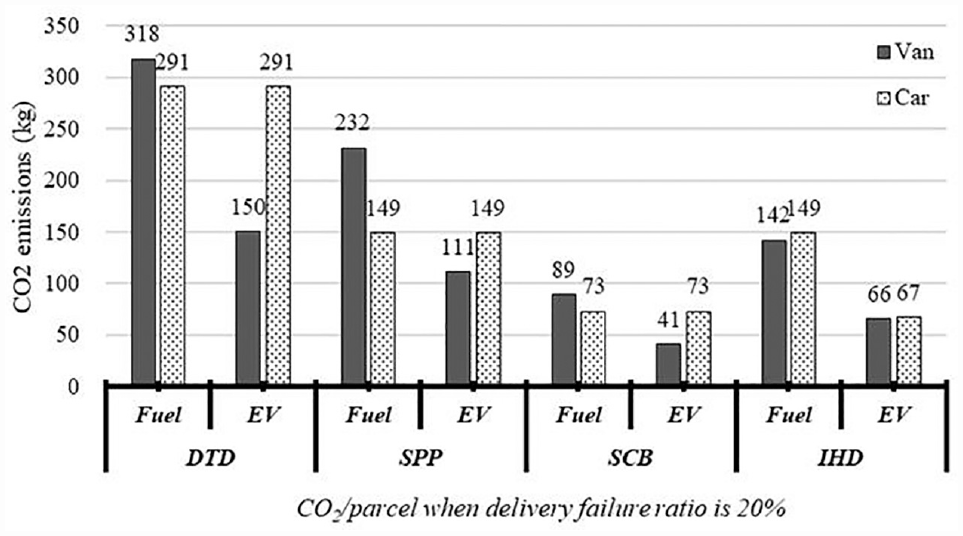
Comparative analysis of CO2/parcel of four home delivery models using battery freight vans and regular fuel-powered vans.
Figure 8 illustrates the CO2 emissions (in kg) of using battery freight vehicles and regular fuel-powered vans for making home deliveries, when 20% of first-time deliveries fail. The most outstanding finding is that using EVs under SPP/SCB/IHD delivery models is always more environmentally friendly than using fuel-powered vehicles. For example, when using EVs to serve 500 customers, the SPP, SCB, and IHD models are capable of reducing the carriers’ overall CO2 emissions by 53% on average, compared with using regular fuel-powered vans. It is, therefore, reasonable for government to persuade carrier to upgrade their delivery vehicles to EVs, considering the benefits for the environment of using EVs. Beijing Municipal Government makes a subsidy of ¥10,000 per vehicle for the carrier company when an electric van is purchased.
To further compare the individual contributions from carriers’ delivery journeys and customers’ collection trips to CO2/parcel, Figure 9 presents the share of van and car in the CO2/parcel under 20% of delivery failure ratio. It is found that, when battery freight vehicles are used, the majority of CO2 emissions per parcel (ranging from 57% to 78%) come from customers’ collection trips either from the depot or from SPPs and SCBs. It might indicate a brighter future of reducing CO2 emissions if customers use electric passenger cars for collecting the missed parcels. How to promote EVs for both customers and carriers needs to receive attention from the government, to systematically achieve further environmental benefits.
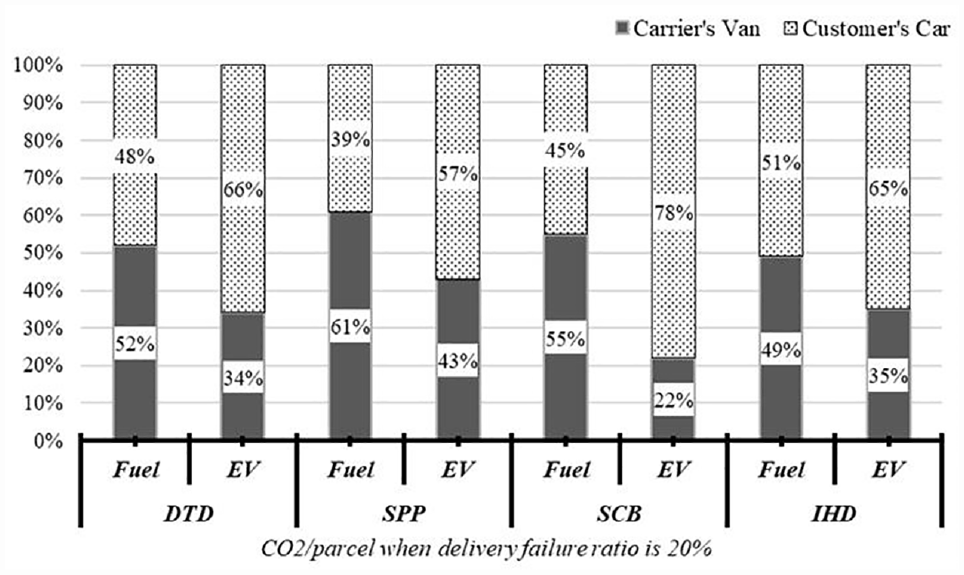
Comparative analysis of contributions from carriers and customers to CO2/parcel of four home delivery models.
Conclusions and Practical Implications
What is clear from the findings of this research is that:
1) Customers’ private trips for collecting their failed-delivery packages from the local depot or SPPs/SCBs create a large proportion of CO2 per parcel. Therefore, it is necessary for the government to promote a cleaner transportation mode for residents, by encouraging them to either take the bus or drive a battery passenger car.
2) Positive implications on CO2 emission reductions are quantified when battery freight vehicles are used for making delivery activities instead of using regular fuel vans. The benefits of EVs are not only achieved by carriers but also the whole society, considering the CO2/parcel here is computed based on both logistics service providers and home shoppers.
3) The CO2 emission reductions made by new home delivery solutions increase with the ratio of home delivery failures. Diverting the missed packages to SPPs/SCBs as intermediate addresses, instead of the carriers’ local depot, in an urban area where home shopping channels are more popular and delivery failures are more often in working hours, brings much more environment benefit.
4) Careful design of a combined SPP and SCB network could lead to further reductions in CO2 emissions per average parcel, including the locations of newly established SPPs and SCBs, the charge to the user to use SPPs/SCBs, and so forth. The research idea of this paper is to quantify the potential savings of using SPP/SCB models for handling failed deliveries on CO2 per parcel. SPPs and SCBs can also be utilized as goods return by customers.
This research has several practical implications for both carrier companies and customers by developing a more environmentally sustainable last-mile solution. From the point view of a carrier company, this paper quantifies the negative impacts of failed home deliveries on the carrier. After that, this paper suggests that diverting the failed packages to alternative locations (SPP/SCB) will significantly reduce the transport emissions associated with handling delivery failures. Under the pressures of air quality and cost control, it might be a choice for the carrier to cooperate with SPP/SCB service providers. From the point view of customers, the research has quantified the potential CO2 emission reductions from the saved customer trips in collecting their failed-delivery packages from the carriers’ depots. Convenience stores, railway stations, and locker boxes could all be the potential locations for receiving failed-delivery packages. With the acknowledgement of carriers and customers, this paper will help them to make decisions about setting up a SPP/SCB network and measuring its performance.
Future research directions include: 1) vehicle electricity consumption varies with load—future research should consider the impacts of the load of EVs on energy consumption, 2) fleet design of missed usage of EVs and fuel vehicles for making home deliveries is another research direction, and 3) allowance of partial recharging should be investigated in the future.
Footnotes
Author Contributions
The authors confirm contribution to the paper as follows: study conception and design: L. Song; data collection: B. Wang; analysis and interpretation of results: Q. Bian; draft manuscript preparation: L. Shao. All authors reviewed the results and approved the final version of the manuscript.
Declaration of Conflicting Interests
The author(s) declared no potential conflicts of interest with respect to the research, authorship, and/or publication of this article.
Funding
The author(s) disclosed receipt of the following financial support for the research, authorship, and/or publication of this article: This research is funded by China Railway Great Project P2021X009.