
Abstract
The Virginia Department of Transportation currently requires the use of the indirect tensile cracking test (IDT-CT) in accordance with ASTM D8225 in its balanced mix design specifications to evaluate the cracking resistance of several unmodified dense-graded asphalt surface mixtures. Although some studies have been performed, there is still limited information on testing processes that may have effects on the test results. This paper addresses the identification and assessment of factors that could have a significant effect on the cracking tolerance index (CT index) test results based on the IDT-CT when used for mixture quality control and acceptance by an agency, for example, specimen conditioning method, loading rate, and data collection frequency. Test results suggested that device type might be a significant factor for mixtures with relatively low CT index values. IDT-CT results were not dependent on the type of conditioning method (i.e., dry or wet). Further, they were not dependent on the loading rate applied, regardless of the machine type (servo-hydraulic or screw-drive) or the data collection frequency used over a range of 1 to 100 Hz. Sets of four and three test specimen replicates had single-operator and multi-laboratory precision estimates similar to those determined for five-replicate data sets.
Keywords
The Virginia Department of Transportation (VDOT) currently requires the use of the indirect tensile cracking test (IDT-CT) performed in accordance with ASTM D8225 in its balanced mix design (BMD) specifications. A minimum cracking tolerance index (CT index) of 70 is required by VDOT to lessen the cracking susceptibility of BMD mixtures based on extensive testing of specimens compacted from reheated plant-produced asphalt mixtures ( 1 – 4 ). VDOT has been evaluating mixtures designed using BMD since 2019 ( 3 , 5 ) and is in the process of implementing its BMD specifications. This has led to the need for the development of precision statements for ASTM D8225 and the need to determine the effect of various factors that could affect the use of the test during quality control and acceptance.
Several recent studies have looked at the effect of various factors on the CT index but have not addressed VDOT’s concerns. During NCHRP Project 09-57A ( 6 ), ruggedness testing was included in the IDT-CT to evaluate seven factors: specimen thickness; specimen center location; air void content; loading rate; contact load; test temperature; and conditioning method. Results indicated that the only significant factor was air void content, although the specified test tolerance for air voids could not be reduced for practical reasons. Analysis of the other factors indicated that the acceptable loading rate tolerance could be increased from 50 ± 2 mm/min to 50 ± 3 mm/min, qualifying more test equipment/devices to perform the test without affecting results. Newcomb et al. ( 7 ) evaluated several Minnesota asphalt mixtures from projects constructed in 2018 and found that the time between sample molding and testing could vary by as much as two weeks without affecting the IDT-CT results. Moore et al. ( 8 ) evaluated the effect of test devices by considering five unique loading frames and an independent data acquisition system mounted on one of the frames using seven asphalt mixtures. One device was operating differently enough from the other five that results could not be considered equivalent; for the other five devices, the results were equivalent.
Because of the need to address test variability, the Virginia Transportation Research Council (VTRC) evaluated the IDT-CT using two interlaboratory studies to develop precision estimates for ASTM D8225 ( 9 – 11 ). During these studies, additional work was performed to identify and assess potential factors that could have significant effects on CT index test results when used for mixture quality control and acceptance. This paper addresses those factors that could have a significant effect on IDT-CT results and, thus, the CT index when used for mixture quality control and acceptance by an agency: specimen conditioning method; loading rate; and data collection frequency.
Methods
Materials
Four dense-graded asphalt mixtures, Mixtures A, B, C, and D, were designed and used to evaluate the IDT-CT ( 11 ). Mixture A was a 65-gyration 9.5 mm nominal maximum aggregate size (NMAS) Superpave mixture produced using a performance grade (PG) 64E-22 asphalt binder with a reclaimed asphalt pavement (RAP) content of 30%. Mixture B was a 50-gyration 12.5 mm NMAS Superpave mixture produced using a PG 64S-22 asphalt binder and did not contain RAP. Mixture C was a 65-gyration 9.5 mm NMAS Superpave mixture produced using a PG 64S-22 asphalt binder with an RAP content of 15%. Mixture D was a 65-gyration 9.5 mm NMAS Superpave mixture produced using a PG 58S-28 asphalt binder with an RAP content of 30%. The four mixtures were designed and produced in the laboratory by a third-party independent laboratory such that the CT index values determined for each mixture were spread across a range from 50 to 300.
IDT-CT Testing
Testing was conducted at 25 ± 0.5°C in accordance with ASTM D8225-19, Standard Test Method for Determination of Cracking Tolerance Index of Asphalt Mixture Using the Indirect Tensile Cracking Test at Intermediate Temperature. Five replicate specimens were tested. The load-displacement curve and specimen dimensions according to diameter and thickness were then used to calculate the CT index.
Data Quality
All data collected from IDT-CT testing were evaluated to assess data quality ( 12 ), which was considered acceptable if the following conditions were met:
No seating load was applied.
The load was applied at the specified constant load rate of 50 ± 2 mm/min (or that required for specific evaluation).
The test ended only when the applied load dropped to 0.1 kN or less after reaching the peak load.
In addition, the CT index results were evaluated to determine that data set variability was in accordance with the precision estimates established by the VTRC ( 9 – 11 ), as shown in Table 1. The results represented in Table 1 indicate that specimen preparation induces additional variability in the precision estimates for multi-laboratory comparisons.
Precision Estimates for the CT Index
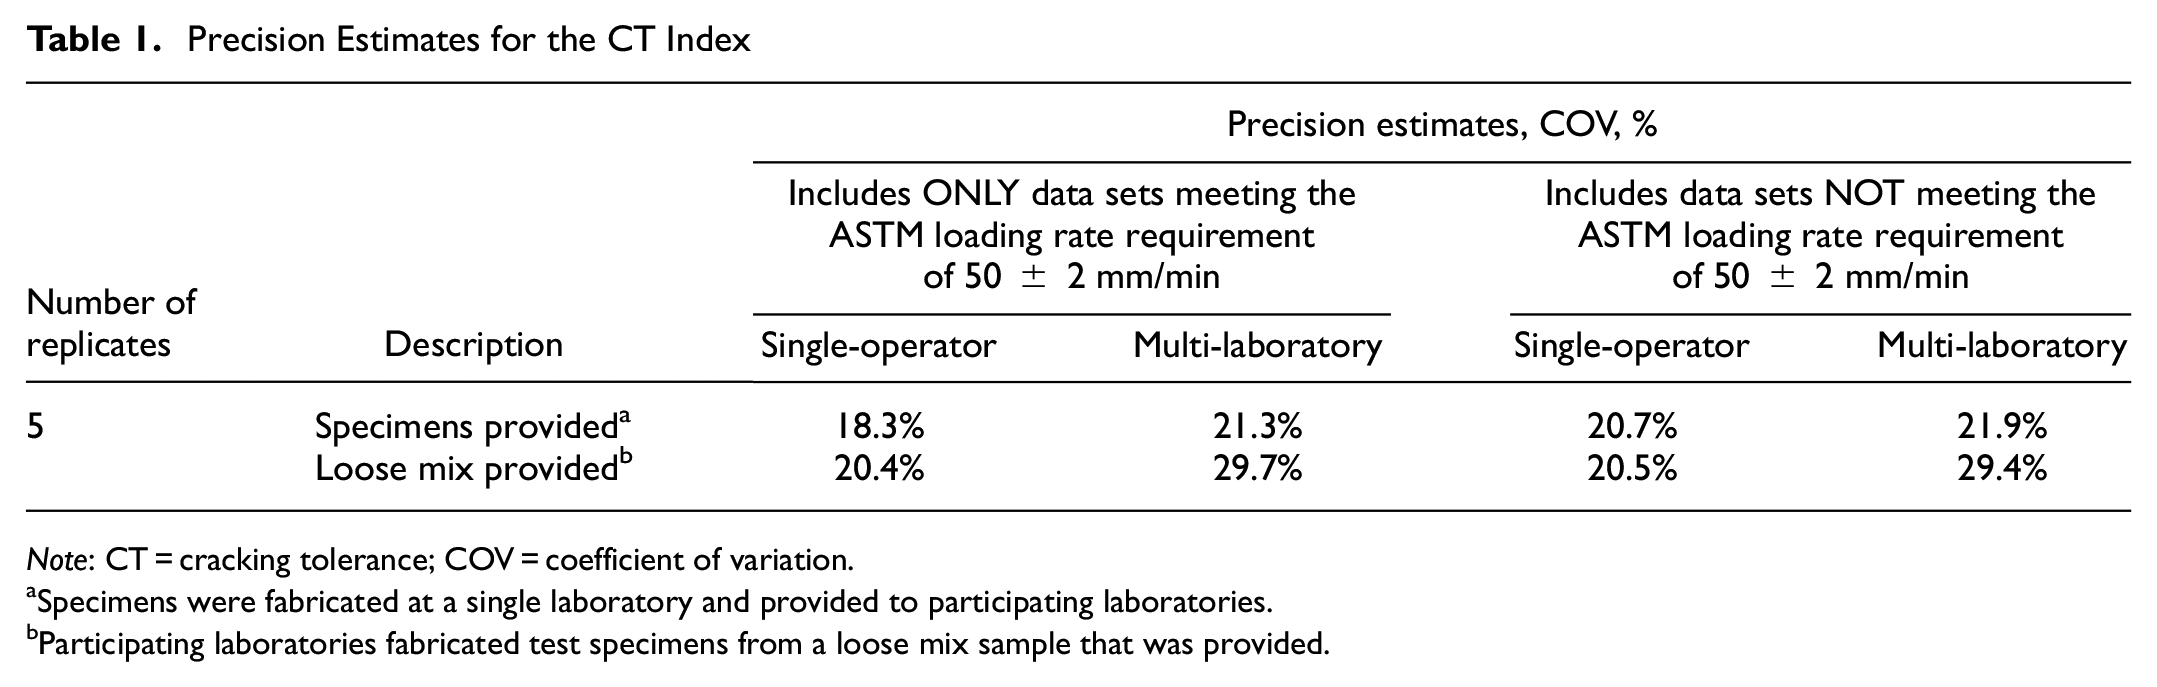
Note: CT = cracking tolerance; COV = coefficient of variation.
Specimens were fabricated at a single laboratory and provided to participating laboratories.
Participating laboratories fabricated test specimens from a loose mix sample that was provided.
Experiments
Specimen Conditioning Method
The feasibility of performing the IDT-CT on wet specimens was evaluated. Currently, VDOT specifies that the IDT-CT be performed on dry specimens conditioned in an environmental chamber or placed in leak-proof plastic bags in a water bath for 2 h until the specimens reach a temperature of 25°C. In other words, the test specimens must remain dry during the conditioning process. Testing wet specimens consisted of placing specimens in a water bath for 2 h, removing a specimen, immediately drying it to the saturate surface dry condition, and performing the IDT-CT. For both methods, it was required that the IDT-CT be completed less than 4 min after the test specimen was removed from the conditioning environment.
Testing was performed on specimens sent to laboratories along with detailed instructions for carrying out the tests. Five laboratories participated: one independent testing laboratory; three VDOT district laboratories; and the VTRC laboratory. Mixtures A and B were used, and laboratories performed testing on two sets of specimens per mixture type, with one set conditioned using the dry method and the other set conditioned using the wet method. All testing was performed using the same make and model of servo-hydraulic test equipment.
Testing instructions and guidelines were provided to ensure consistency in testing. These included guidance for inspecting test specimens for visual damage (e.g., cracks, creep, etc.), instructions for measuring the diameter and thickness of each tested specimen, and instructions on how to condition the specimens in “dry” and “wet” conditions. All laboratories were asked to submit the raw data (time, load, and displacement measurements) for all tested specimens, and data quality was assessed for each specimen on receipt.
Loading Rate
The effect of loading rate on the IDT-CT results was investigated. Specimens from Mixtures A, B, C, and D were tested in the VTRC laboratory. Testing was performed using a servo-hydraulic test machine and a screw-drive test machine. Five specimens per mixture were tested at each of five loading rates for each machine: 46, 48, 50, 52, and 54 mm/min. All testing was performed on dry conditioned specimens at a temperature of 25°C. The raw data, time, load, and displacement measurements were collected and data quality was assessed before analysis.
Data Collection Frequency
The effect of data collection frequency on the IDT-CT results was assessed. A six-order polynomial function as shown in Equation 1 was fitted to the load-displacement data for each specimen evaluated. The time and displacement corresponding to when the applied load dropped to 0.1 kN after the peak load was reached were determined from the IDT-CT raw data and used to generate a load-displacement database artificially, using the fitted model of Equation 1 per specimen for each of the 12 considered frequencies: 1, 5, 10, 20, 30, 40, 50, 60, 70, 80, 90, and 100 Hz.

where
P = load, kN
l = displacement, mm
a1, a2, a3, a4, a5, and a6 = fitting parameters.
Results and Discussion
Specimen Conditioning Method
Each laboratory reported five replicate measurements for each mixture evaluated. Figure 1 presents the average CT index values per mixture for each laboratory. Table 2 shows the descriptive statistics of the CT index for Mixtures A and B and dry and wet conditioning modes. Figure 2 compares the average CT index value collected from specimens conditioned using the dry and wet modes for both mixtures.
Descriptive Statistics for CT Index Values of Untrimmed Data for Mixtures A and B after Dry and Wet Conditioning
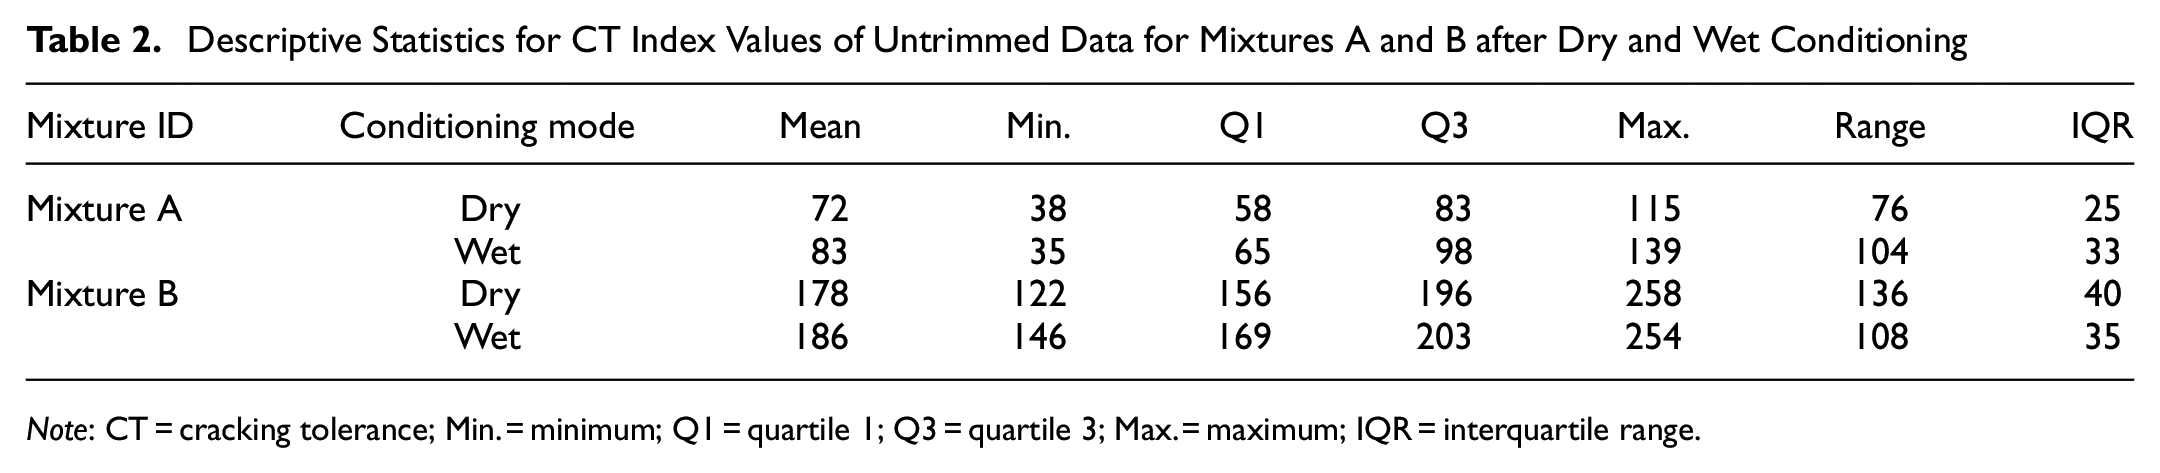
Note: CT = cracking tolerance; Min. = minimum; Q1 = quartile 1; Q3 = quartile 3; Max. = maximum; IQR = interquartile range.
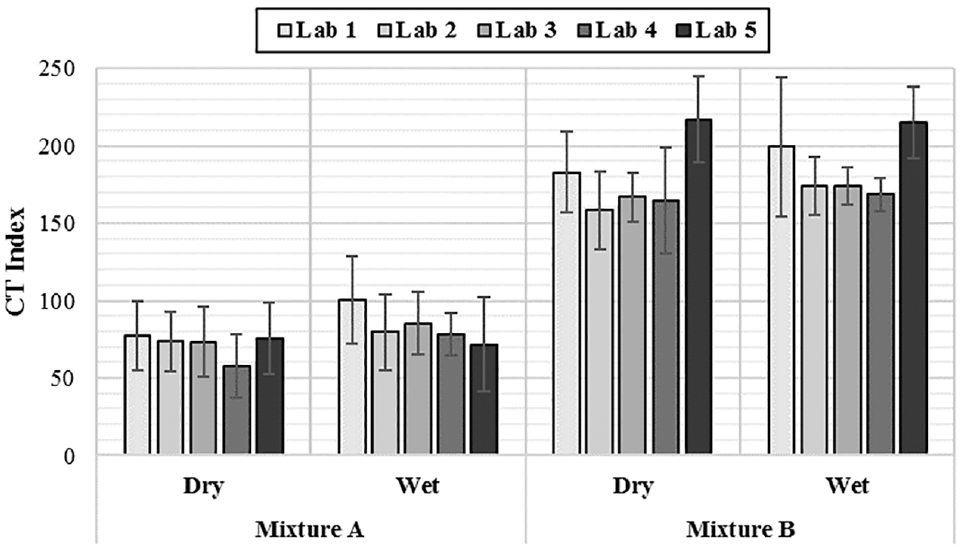
Average CT index values for Mixture A and Mixture B after dry and wet conditioning. I-bars show ±1 standard deviation.
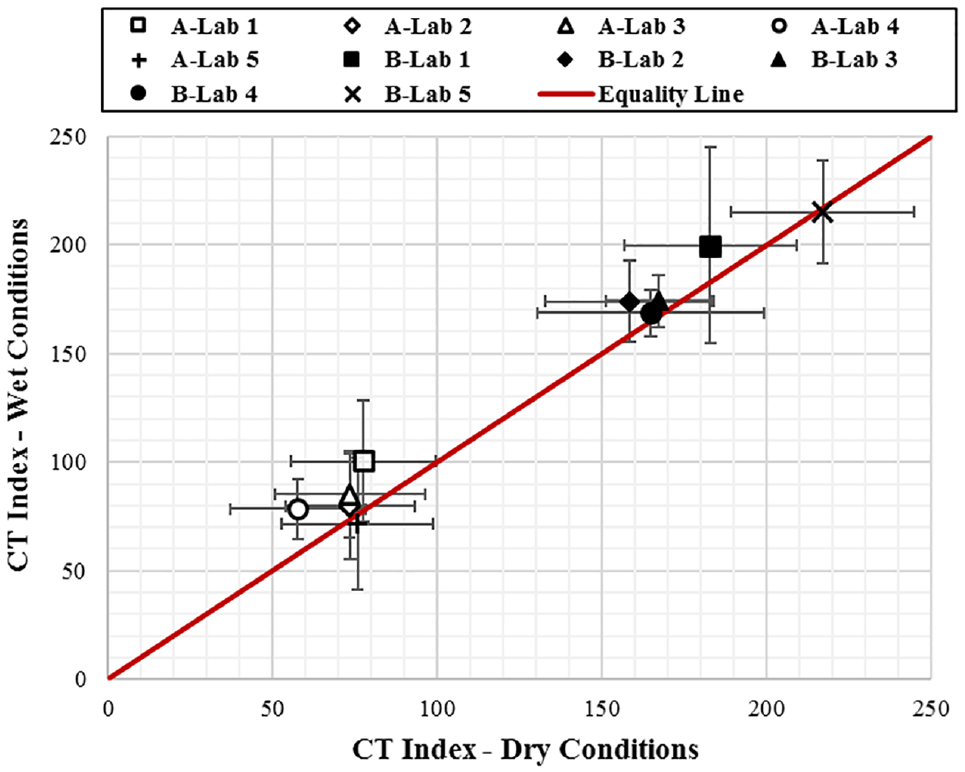
Dry versus wet CT index values for Mixtures A and B. I-bars show ±1 standard deviation.
Statistical Analyses
An analysis of variance (ANOVA) at a 95% confidence interval was performed to determine if there was a statistically significant difference in the CT index results for the two conditioning methods. For the response variable “CT index,” the parameters used as factors in the analysis model were “Mixture type,”“Conditioning method,” and “Laboratory.” Four interaction terms (“Mixture type*Conditioning method,”“Mixture type*Laboratory,”“Conditioning method*Laboratory,” and “Mixture type*Conditioning method*Laboratory”) were also added into the model as factors. The assumption of normality was satisfied for the dry and wet CT index data. Minitab software was used in the analysis ( 13 ). Table 3 presents the ANOVA results for the CT index. The test results were statistically different by the conditioning method and by mixture type specific to a laboratory.
Summary of ANOVA Results for the CT Index—Dry and Wet Specimens
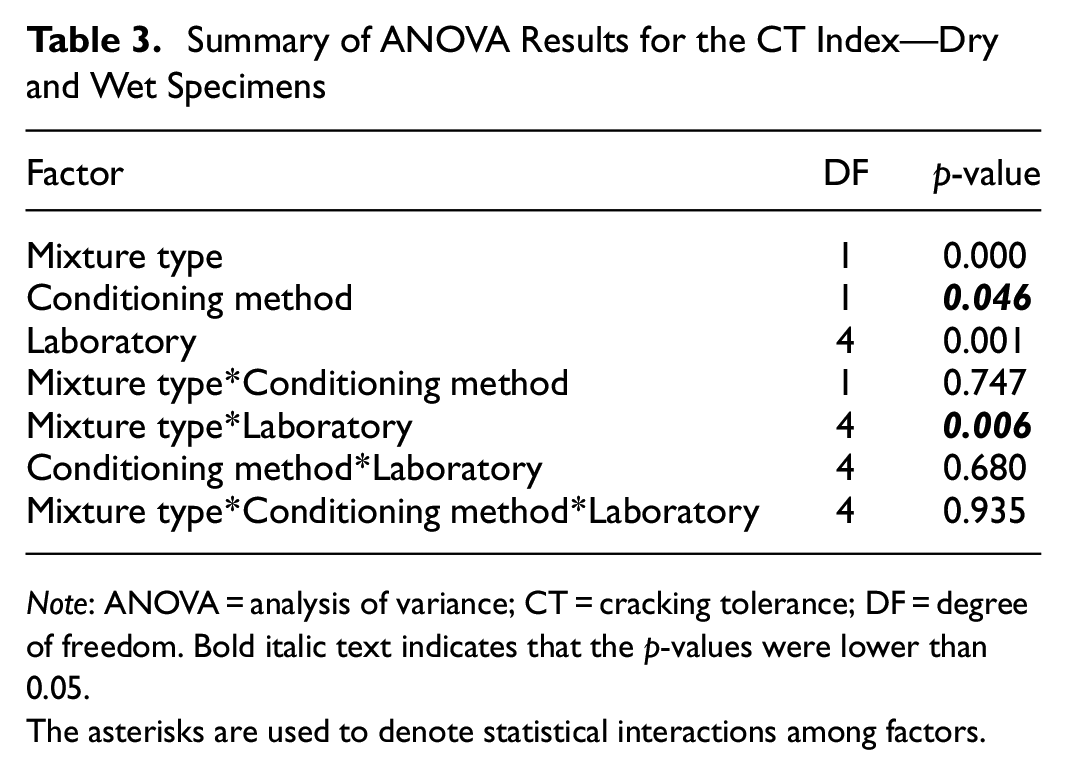
Note: ANOVA = analysis of variance; CT = cracking tolerance; DF = degree of freedom. Bold italic text indicates that the p-values were lower than 0.05.
The asterisks are used to denote statistical interactions among factors.
A pairwise comparison using the Tukey method, shown in Table 4, was performed to identify the statistically significant observations in the data. The observations that do not share a letter indicate a statistically significant difference in their means. Overall, the analysis indicated there was a statistical similarity between the CT index data collected using the dry and wet conditioning methods for a given mixture and laboratory. The statistical differences observed came solely from the test results of Mixture B from Lab 2 in the dry condition, and differed from the test results of Mixture B for all other laboratories, whether the data were obtained in dry or wet conditions; the test results for Mixture B from Lab 2 were the same for the dry and wet testing, as can be seen in Table 4. A similar analysis was performed in which the Mixture B data from Lab 2 under dry and wet conditions were removed. No statistical differences were observed. Thus, the conditioning method is not a statistically significant factor for the CT index.
Summary of Tukey Pairwise Comparison for the CT Index—Dry and Wet Specimens
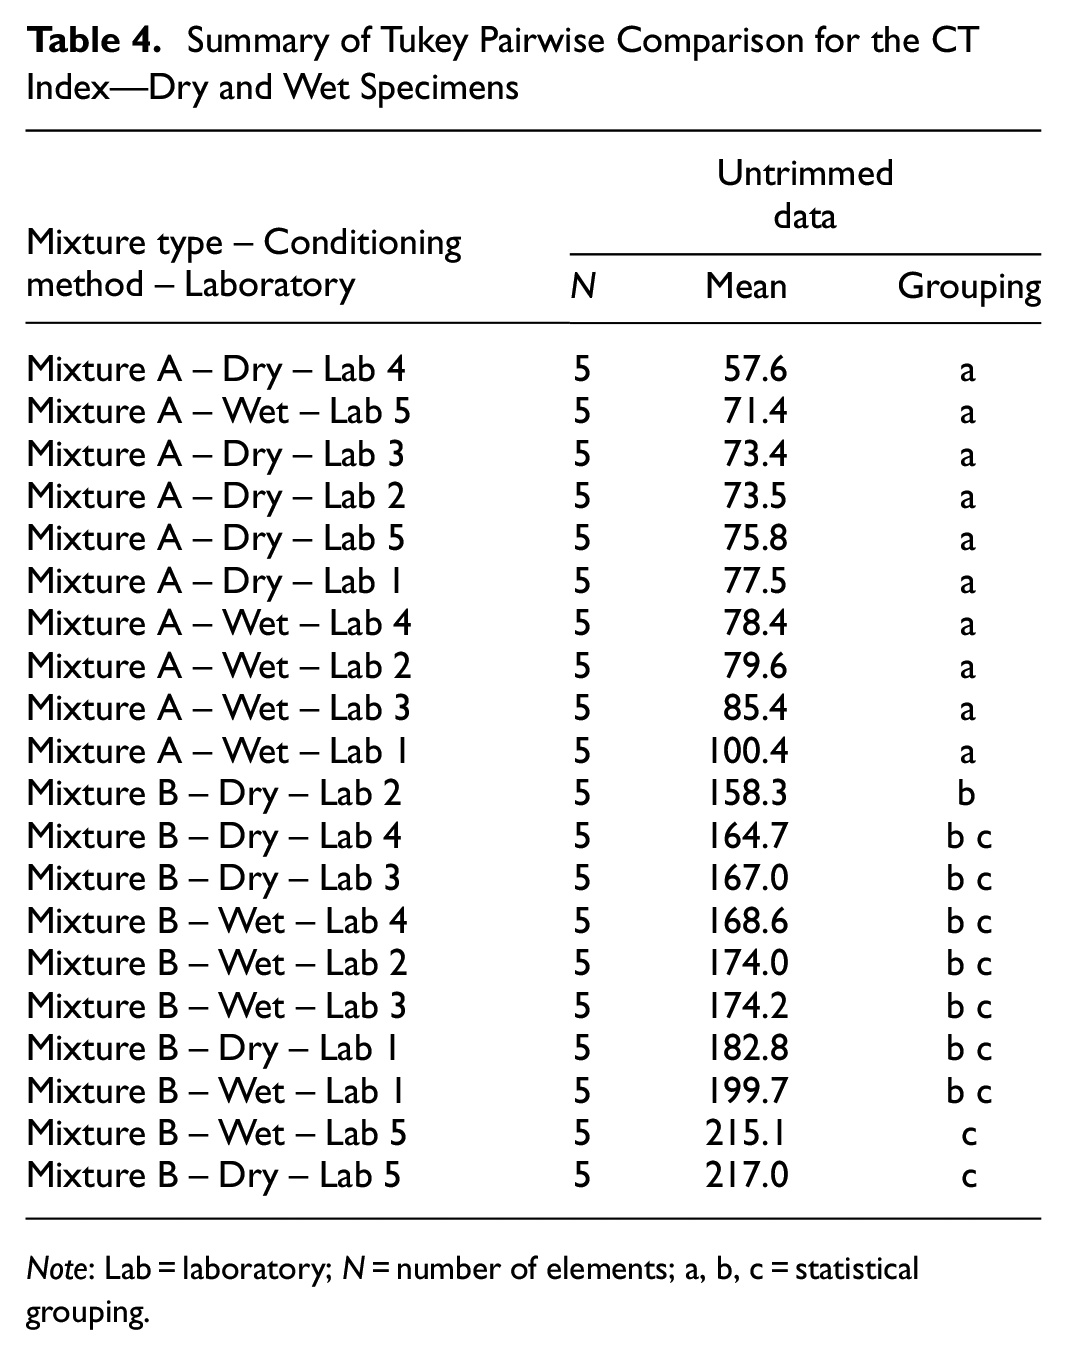
Note: Lab = laboratory; N = number of elements; a, b, c = statistical grouping.
Loading Rate
Loading Rates: Servo-Hydraulic versus Screw-Drive Machines
Figure 3 compares the nominal loading rates to which the IDT-CT devices were set before testing and the exact measured loading rates computed using the data collected during testing. For the servo-hydraulic machine, as shown in Figure 3a, the nominal and measured loading rates were almost identical, indicating effective control of the applied load and rate of loading. However, the measured loading rates were lower than the nominal loading rates for the screw-drive machine, shown in Figure 3b. Moreover, the difference in magnitude between the nominal and measured loading rates increased with the increase in the nominal maximum loading rate. Based on this, the effect of loading rate should be considered when using a screw-drive machine.
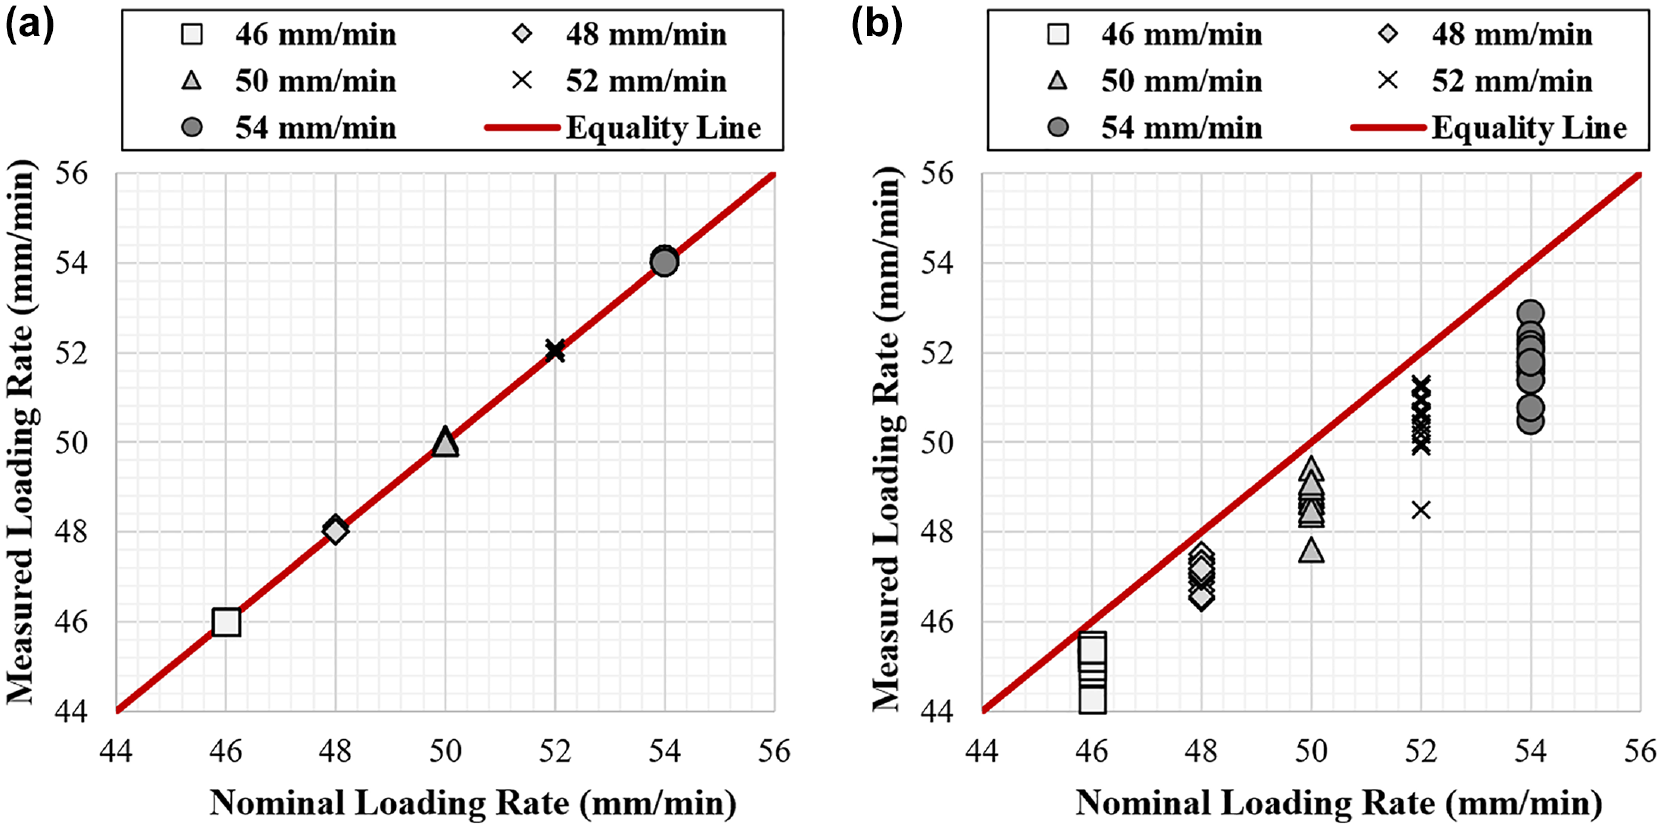
Comparison of nominal and measured loading rates for evaluated specimens of Mixtures A, B, C, and D using (a) servo-hydraulic machine, and (b) screw-drive machine.
Analysis of Data Collected Using a Servo-Hydraulic Machine
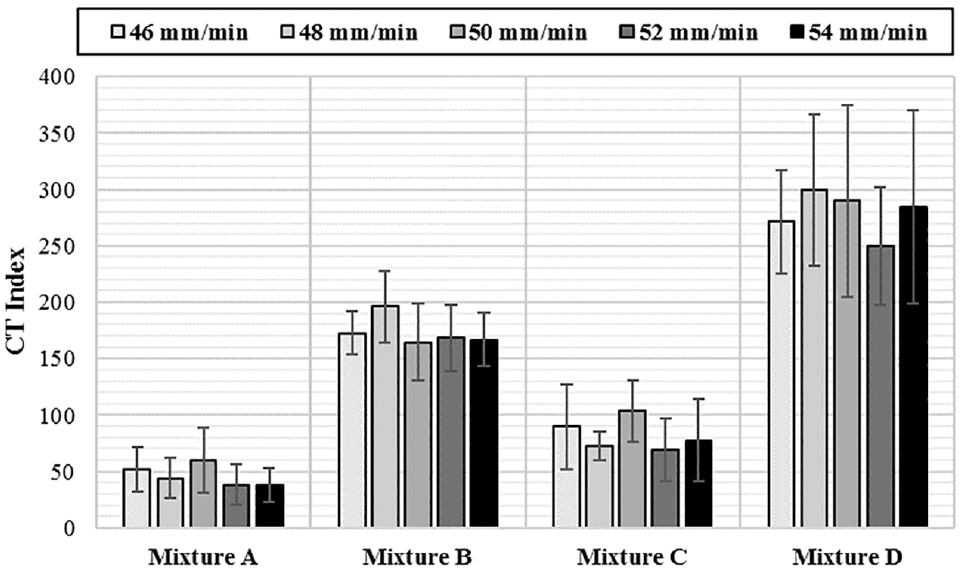
Figure 4 presents the CT index values for each evaluated mixture collected using a servo-hydraulic machine for each of the five loading rates. Table 5 presents the ANOVA results at a 95% confidence interval of the CT index with respect to mixture type (Mixtures A, B, C, and D) and loading rate (46, 48, 50, 52, and 54 mm/min). The interaction factor “Mixture type*Loading rate” was considered in the analysis. “Mixture type” was identified as a statistically significant factor (p < 0.05). A pairwise comparison using the Tukey method was performed using both the nominal and measured loading rates. Only the analysis performed using the nominal loading rate is shown in Table 6. In general, the observations that do not share a letter indicate a statistically significant difference in their mean CT index values. Regardless of the combination, for each evaluated mixture, the average CT index at the five loading rates belonged to the same group, indicating that “Loading rate” is not a statistically significant factor when a servo-hydraulic machine is employed.
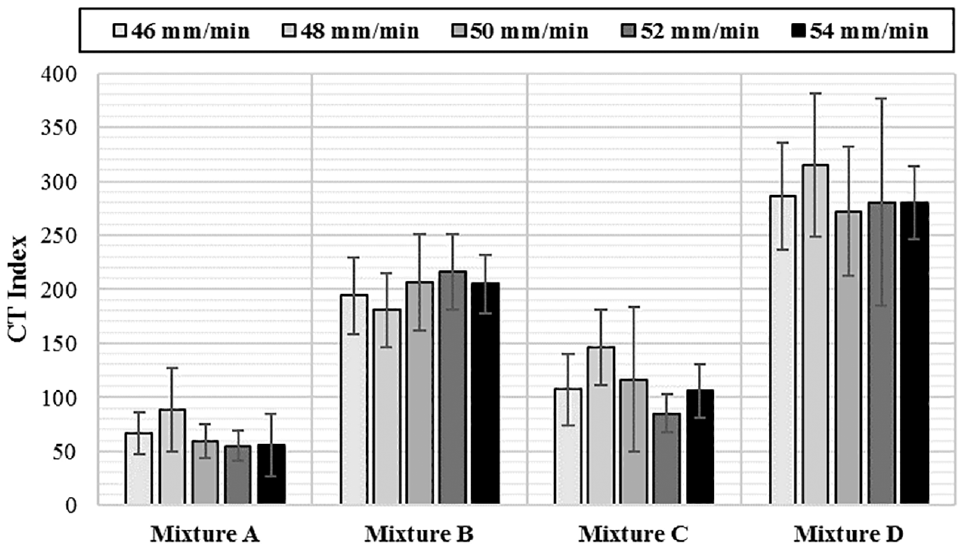
Average CT index values for Mixtures A, B, C, and D at five loading rates using a servo-hydraulic machine. I-bars show ±1 standard deviation.
Summary of ANOVA Results for the CT Index—Mixtures A, B, C, and D at Five Different Loading Rates Using a Servo-Hydraulic Machine
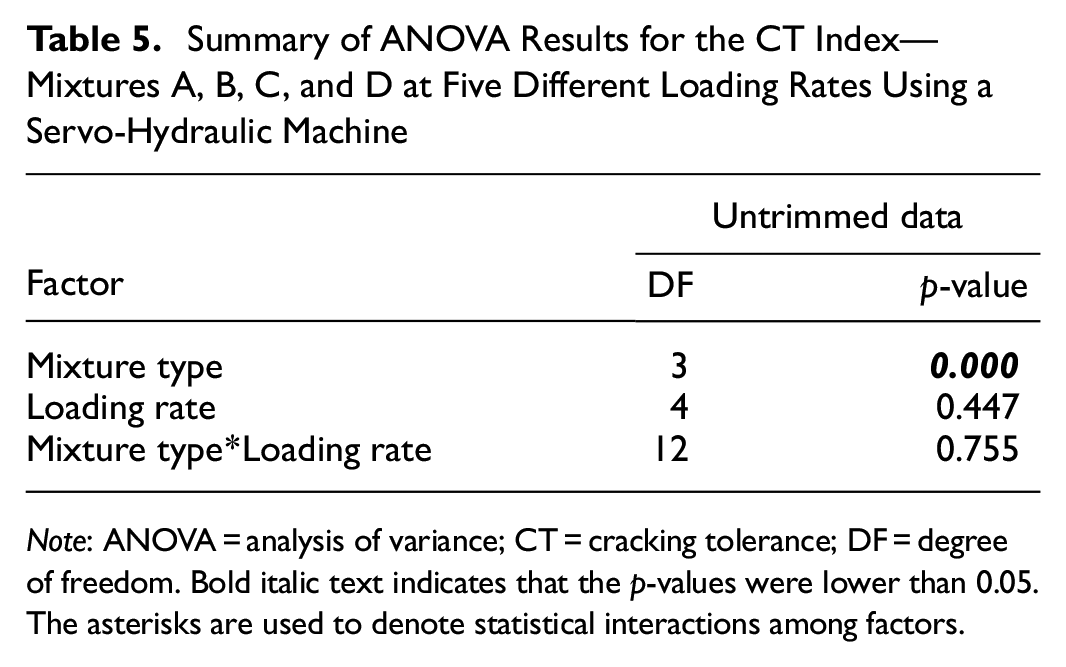
Note: ANOVA = analysis of variance; CT = cracking tolerance; DF = degree of freedom. Bold italic text indicates that the p-values were lower than 0.05.
The asterisks are used to denote statistical interactions among factors.
Summary of Tukey Pairwise Comparison for the CT Index—Mixtures A, B, C, and D at Five Different Loading Rates Using a Servo-Hydraulic Machine
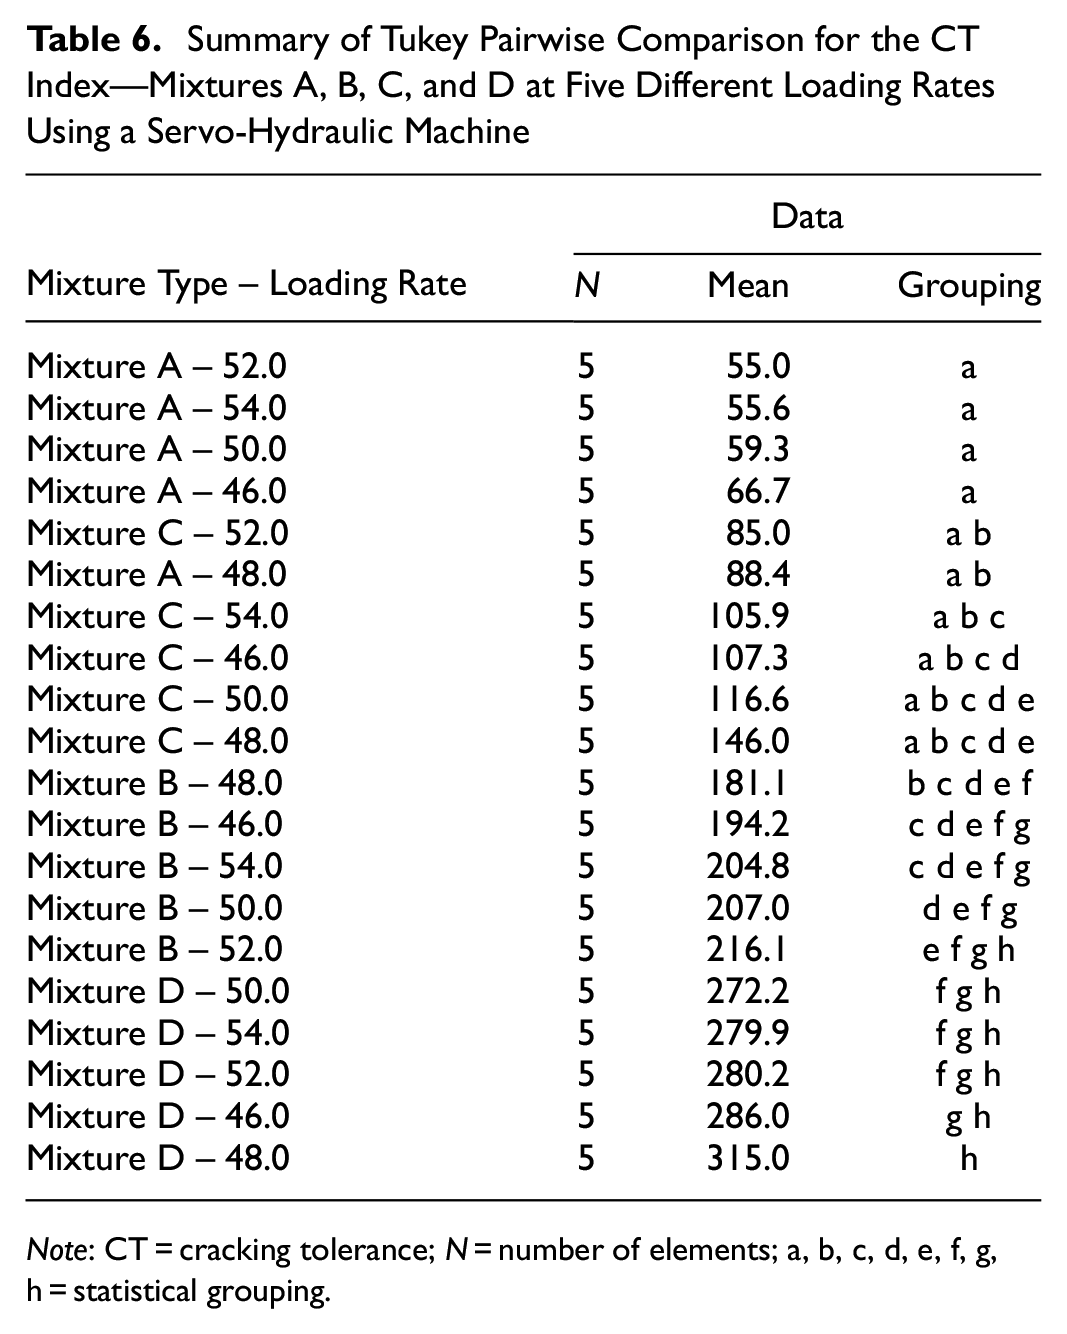
Note: CT = cracking tolerance; N = number of elements; a, b, c, d, e, f, g, h = statistical grouping.
Analysis of Data Collected Using a Screw-Drive Machine
Figure 5 presents the CT index values for each evaluated mixture collected using a screw-drive machine for each of the five loading rates. Table 7 presents the ANOVA results at a 95% confidence interval of the CT index with respect to mixture type and loading rate. In this case, the loading rate was nested under “Mixture type.”“Loading rate” was not a statistically significant factor (p < 0.05) regardless of the mixture type. A pairwise comparison using the Tukey method was performed using the measured loading rates. Regardless of the combination, for each evaluated mixture, the average CT index at the five loading rates belonged to the same group, indicating that “Loading rate” is not a statistically significant factor when a screw-drive machine is employed.
Average CT index values for Mixtures A, B, C, and D at five loading rates using a screw-drive machine. I-bars show ±1 standard deviation.
Summary of ANOVA Results for the CT Index—Mixtures A, B, C, and D at Five Different Loading Rates Using a Screw-Drive Machine
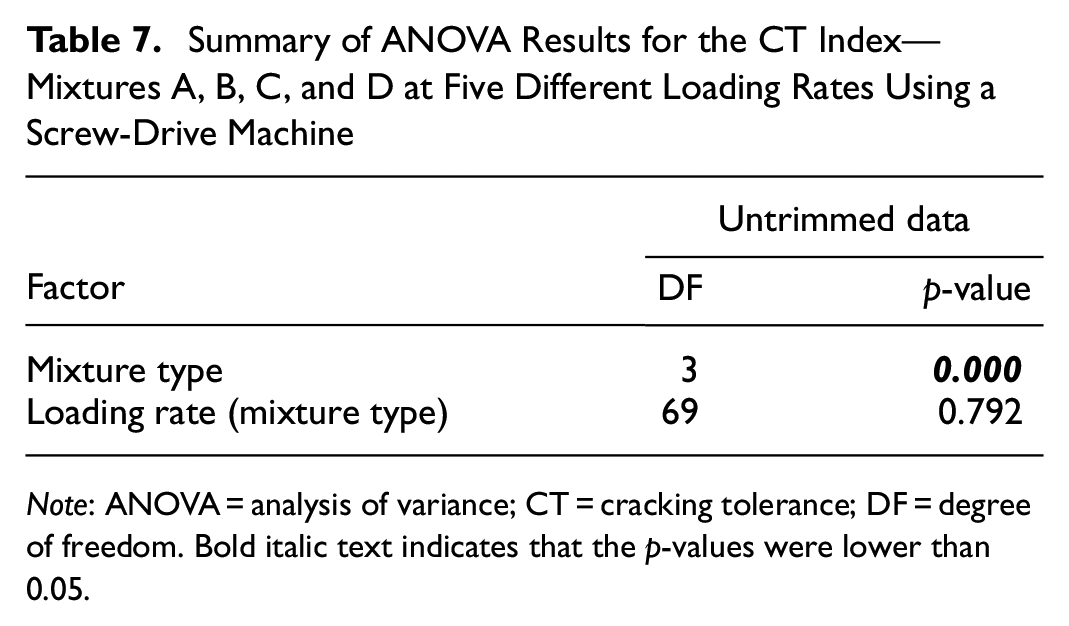
Note: ANOVA = analysis of variance; CT = cracking tolerance; DF = degree of freedom. Bold italic text indicates that the p-values were lower than 0.05.
Effect of Device on the IDT-CT: Additional Analyses Using an Independent Data Set
The data collected while the loading rate was evaluated presented an opportunity to assess the effect of the device employed on the IDT-CT indices considered. The data collected using a servo-hydraulic machine and a screw-drive machine at a loading rate of 50 mm/min were evaluated. Table 8 presents the ANOVA results at a 95% confidence interval for the CT index when the factors “Mixture type” and “Machine type” and the interaction factor “Mixture type*Machine type” were considered. In this case, “Machine type” was not a statistically significant factor.
Summary of ANOVA Results for the CT Index Collected Using Servo-Hydraulic and Screw-Drive Machines
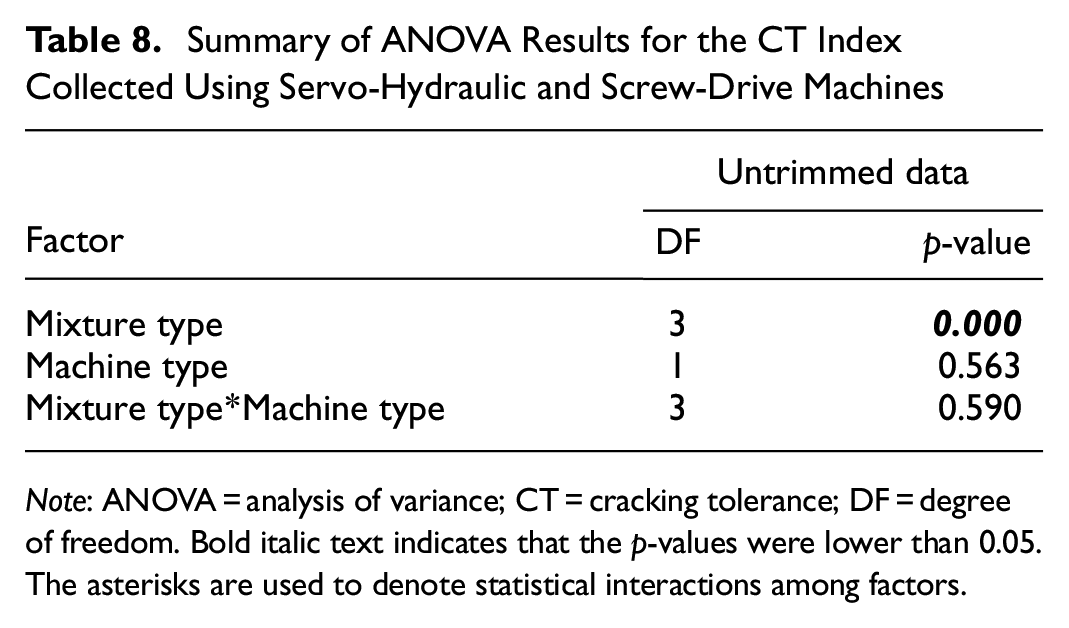
Note: ANOVA = analysis of variance; CT = cracking tolerance; DF = degree of freedom. Bold italic text indicates that the p-values were lower than 0.05.
The asterisks are used to denote statistical interactions among factors.
Data Collection Frequency
The effect of data collection frequency was evaluated. The analysis was performed using both a servo-hydraulic machine and a screw-drive machine. The analysis used the data collected when the IDT-CT was performed at a loading rate of 50 mm/min on Mixtures A, B, C, and D. Figure 6 shows the load-displacement data collected at a frequency of 50 Hz and the fitted model using Equation 1. Figures 7 and 8 show the CT index determined for the four mixtures at 12 evaluated frequencies for data collected using a servo-hydraulic machine and a screw-drive machine, respectively. Overall, the data were statistically similar over the data collection frequency range of 1 to 100 Hz.
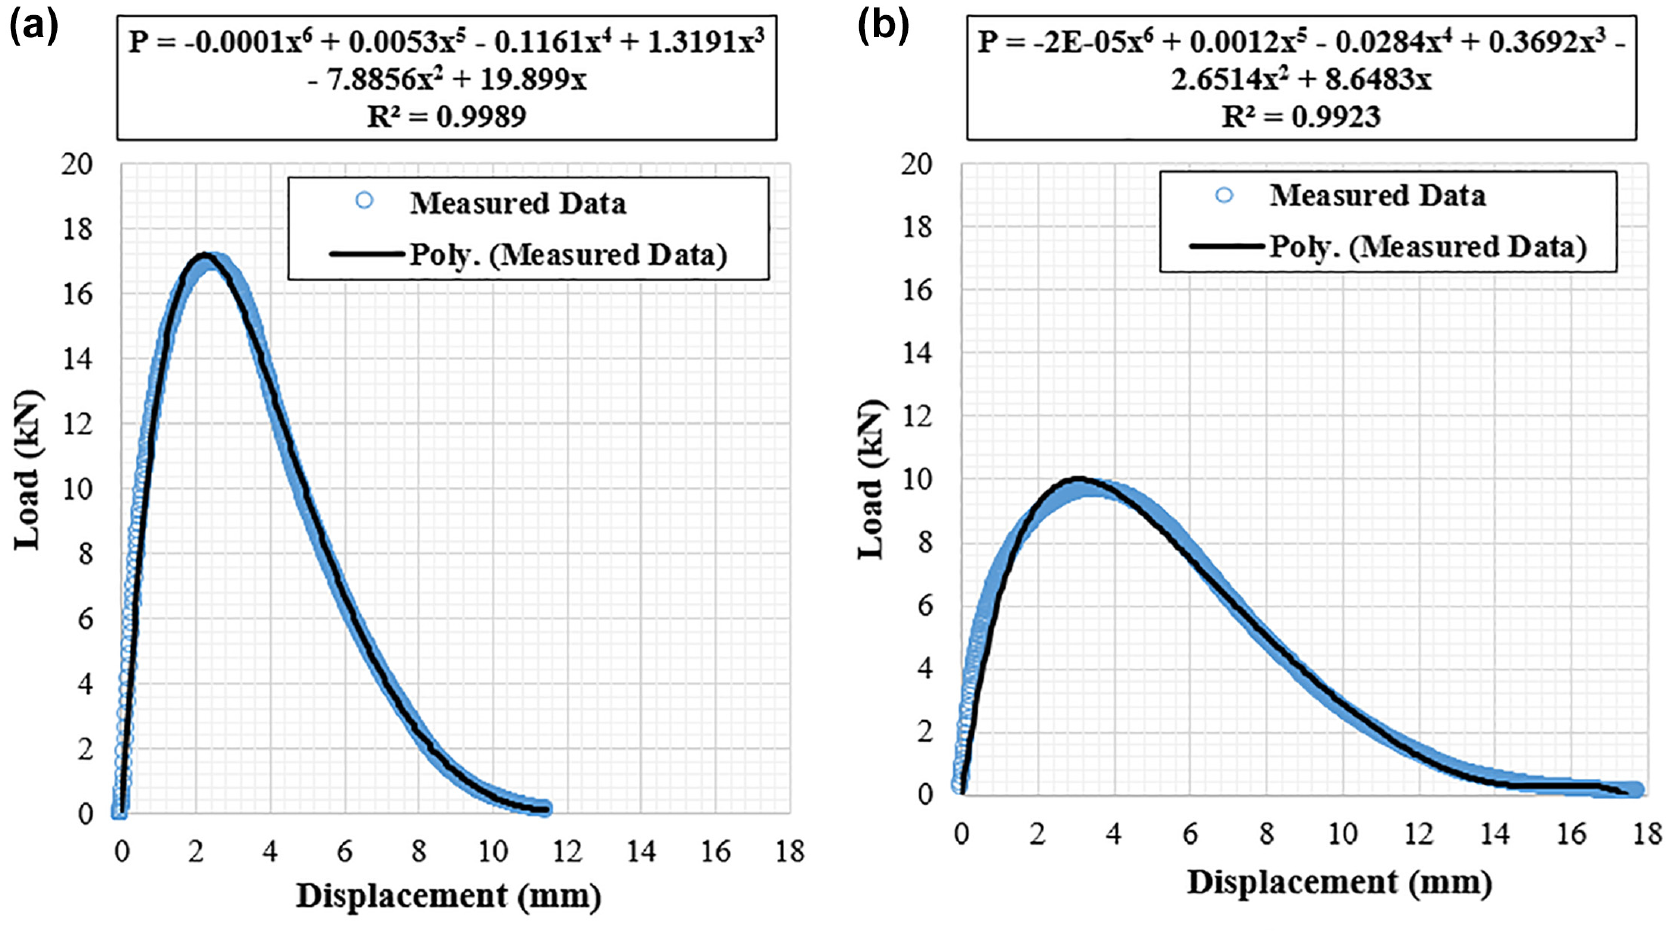
Examples of as-collected and fitted load-displacement curves for (a) Mixture A, and (b) Mixture D.
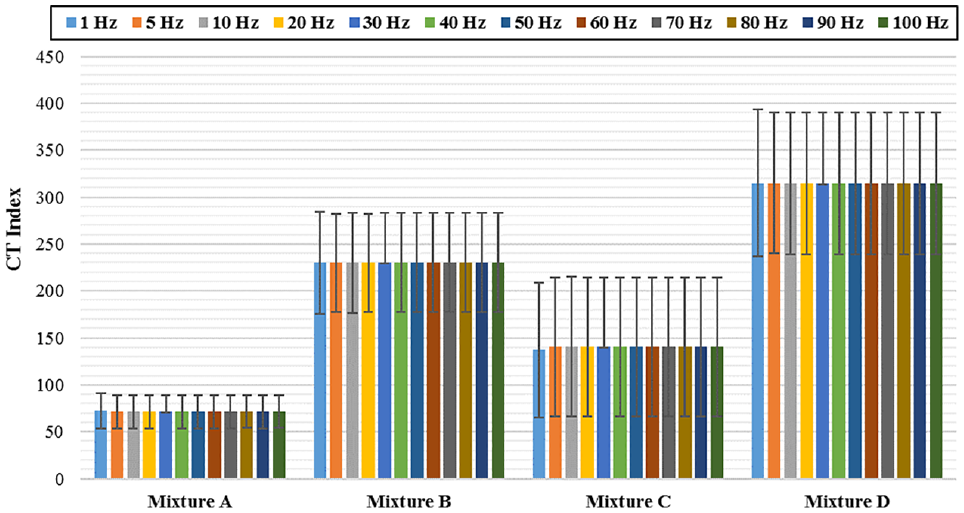
CT index of Mixtures A, B, C, and D over a range of 12 frequencies collected using a servo-hydraulic machine. I-bars show ±1 standard deviation.
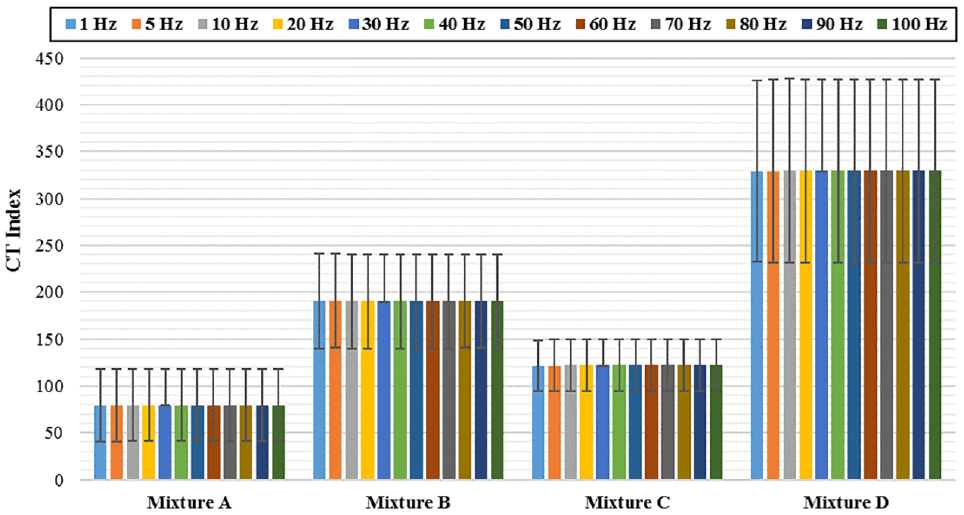
CT index of Mixtures A, B, C, and D determined over a range of 12 frequencies collected using a screw-drive machine. I-bars show ±1 standard deviation.
Implications for Design and Acceptance
The analyses performed as part of the interlaboratory studies ( 11 ) confirmed that greater variability is induced during specimen preparation for multi-laboratory conditions. Therefore, consistency in mixture processing and specimen fabrication is very important. It is important to recognize how to apply and use precision estimates during mix design and acceptance.
Mix Design
During mix design, according to the proposed 2023 VDOT BMD specification, contractors must meet the requirement of a minimum CT index of 70 with a variability lower than the single-operator variability, computed using the coefficient of variation (COV). Before the determination and evaluation of the CT index, the quality of test data should be evaluated by the contractor. In addition, contractors must store the raw data from all IDT-CT specimens tested for possible review by VDOT at any time.
The following constitutes a checklist for evaluating the average and variability of the data submitted for mix design approval:
The CT index threshold of 70 is met at the design binder content, and the COV is lower than the single-operator precision. In this case, the design meets the CT index requirements for approval.
The CT index threshold of 70 is met at the design binder content; however, the COV is greater than the single-operator precision. In this case, the design does not meet the criteria for approval. A new set of five IDT-CT specimens must be produced, compacted, and tested. This process must be repeated until the CT index criterion is met and the COV of the set of specimens evaluated is less than the single-operator precision. The mix design then meets the CT index requirements for approval. Mixing and matching specimens from various production batches is not allowed, because it negates the statistical validity of the test.
The CT index threshold of 70 and/or a COV lower than the single-operator precision is not met at the design binder content, so the mixture must be redesigned.
Production
During production, the requirement of a minimum CT index of 70 remains valid for reheated IDT-CT specimens. No threshold is currently available for non-reheated specimens. Similar to Section 211.08 of the VDOT specifications ( 14 ), acceptance of mixtures based on any performance testing could be added to VDOT’s quality assurance program, which includes the testing of production quality control and acceptance samples by the contractor and verification samples by VDOT.
The following presents a process for acceptance of a mixture during production based on the performance of reheated specimens.
If the CT index threshold of 70 is not met by the contractor or the agency, an investigation should be initiated to determine the cause of the failure.
Regardless of who performs the testing, each test data set must have a COV lower than the single-operator precision. In data sets for which the single-operator precision is not met, the reported results are invalid because of excess variability. The mixture must be immediately resampled and retested. If test results continue to fail the COV requirement, an investigation should be initiated to determine the cause of the failure.
If the CT index threshold of 70 is met by both the contractor and VDOT, the multi-laboratory variability should be determined. If the COV between the contractor data set and the VDOT data set is greater than the multi-laboratory precision, indicating a statistically significant difference, an investigation should be initiated to determine the cause of the variability.
Reduction of Specimen Replicates
With the progress toward the implementation of BMD and the continuous increase in the number of contracts awarded requiring the use of BMD mixtures, there is mutual interest from the industry and VDOT to consider requiring a smaller number of replicate specimens to be tested using the IDT-CT. Currently, VDOT’s BMD specifications require testing a set of five IDT-CT specimens compacted to an air void range of 7.0 ± 0.5% during design and production. During production, specifications require contractors to compact sets of five non-reheated IDT-CT specimens to be tested in their laboratories for quality control and sets of five non-reheated IDT-CT specimens to be tested by VDOT for verification purposes.
This requirement is feasible during the mix design stage when contractors have enough time to produce sets of five IDT-CT replicate specimens fulfilling the requirements of ASTM D8225-19. However, the requirement is challenging during production, because there is only one opportunity for success per sample. Excess sampled material cannot remain at compaction temperature indefinitely during continuing attempts to compact acceptable specimens, because aging from excessive heating of the loose material will occur. Neither can additional material be sampled for further specimens, because this material comprises a new sample.
This raises several concerns. What if some test specimens do not meet the air void requirements of 7 ± 0.5%? What if some test specimens are damaged at any point? What if there are machine- and/or operator-related issues during testing? Any of these situations could result in specimen sets consisting of fewer than five replicates for testing. Therefore, the effect on the precision estimates determined previously ( 9 – 11 ) using four or three replicates instead of five was evaluated. The minimum number of replicates was limited to three to maintain statistical soundness.
The five-replicate data sets were evaluated using two approaches. The first assessed combinations of four replicates randomly selected from each set of five replicates with no repetitions allowed. This resulted in five potential combinations per data set per mixture for each laboratory. The second approach considered combinations of three replicates randomly selected from each set of five replicates with no repetitions allowed. This resulted in 10 potential combinations per data set per mixture for each laboratory. R-package was used in the analysis ( 15 ). Table 9 summarizes the precision estimates determined for the CT index when four and three replicates were analyzed from a set of five replicates and compares these precision estimates with those already determined for the five-replicate data sets. Similar precision estimates were determined for sets of five, four, or three replicates. Therefore, the findings from this study remain applicable to the sets of four and three replicates.
Summary and Comparisons of Precision Estimates for the CT Index Considering Various Numbers of Replicates per Data Set
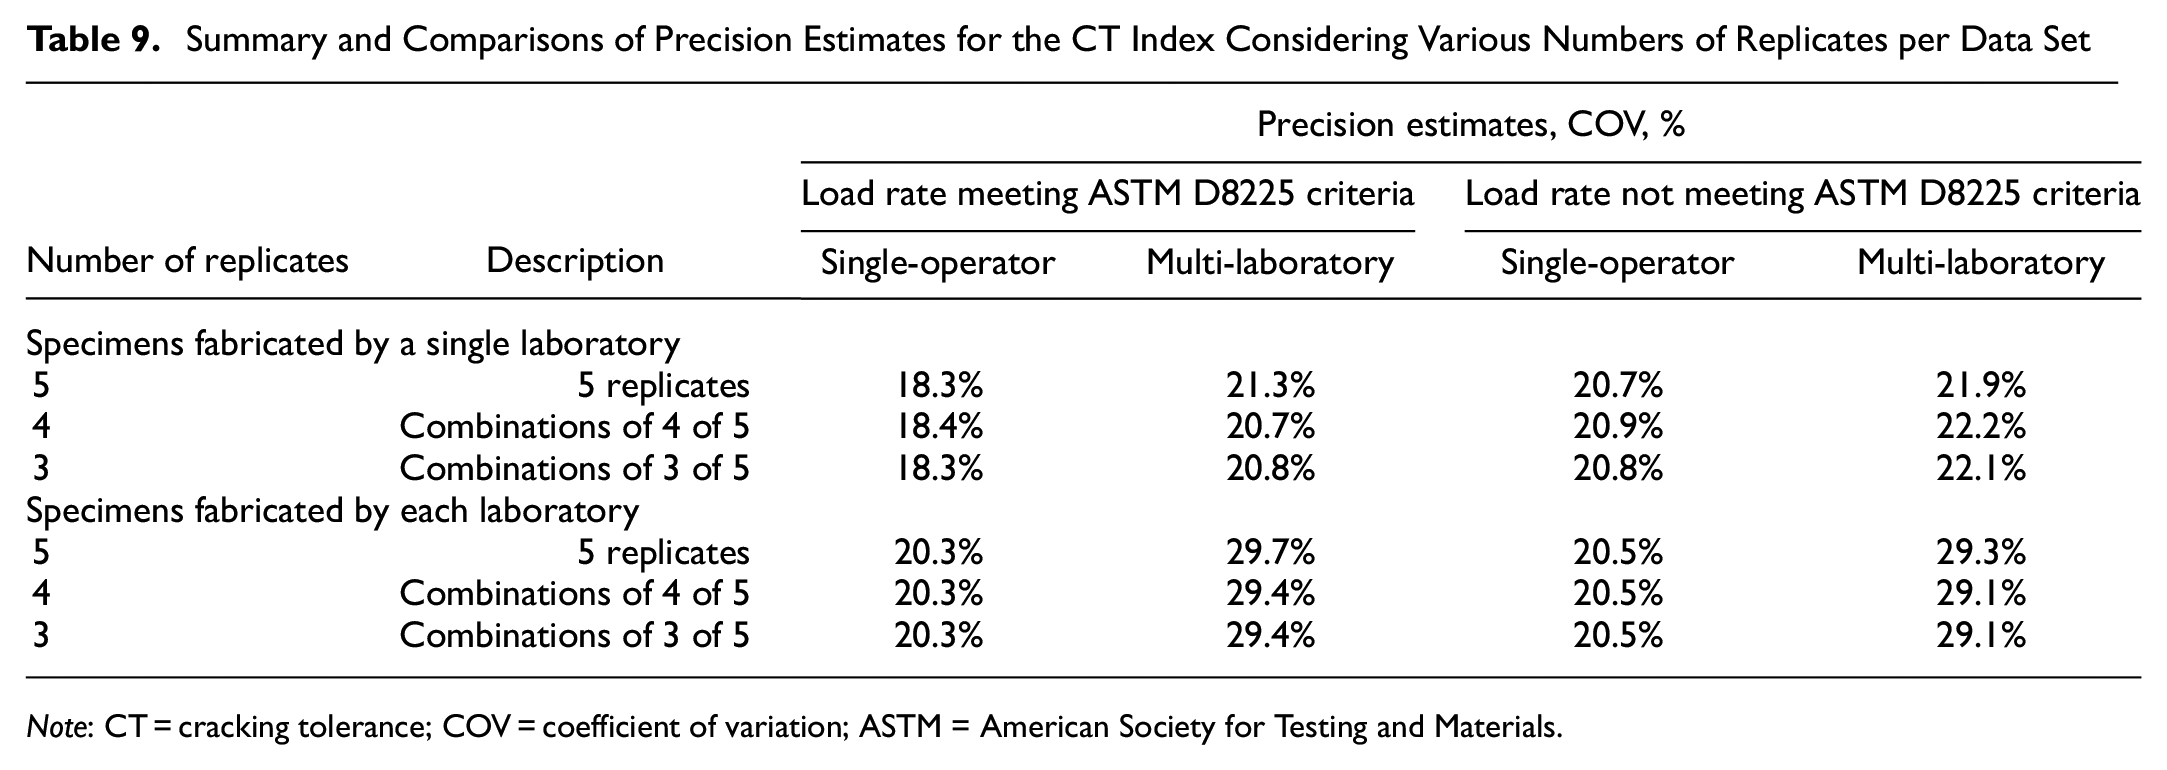
Note: CT = cracking tolerance; COV = coefficient of variation; ASTM = American Society for Testing and Materials.
A Numerical Example
An example of applying variability requirements to CT index data using data collected from a paving contract is provided here. The example shows how precision estimates can be applied using data generated by the contractor during mix design and data generated by the contractor and VDOT during production. Requirements are based on the proposed 2023 VDOT BMD specifications.
During mix design, the CT index must be determined and reported at the design binder content (short- and long-term aged) at 0.5% above the design binder content (short-term aged), and at 0.5% below the design binder content (short-term aged). The varying binder content testing is intended to provide an indication of mixture sensitivity to changes in binder content. The data collected during the mix design stage are shown in Table 10. The following observations were made:
At design binder content -0.5% the average CT index of short-term aged specimens was 69, failing the criterion of 70, and the COV was 37.2%, exceeding the acceptable single-operator COV of 18.3%.
At design binder content the average CT index of short-term aged specimens was 137, passing the criterion of 70, and the COV was 19.5%, exceeding the acceptable single-operator COV of 18.3%.
At design binder content +0.5% the average CT index of short-term aged specimens was 181, passing the criterion of 70, and the COV was 37.2%, exceeding the acceptable single-operator COV of 18.3%.
At design binder content the average CT index of long-term aged specimens was 36, 74% lower than the average CT index at the design binder content of short-term aged specimens, and the COV was 18.7%, slightly exceeding the acceptable single-operator COV of 18.3%.
Examples of Variability in Data Set CT Index Values during Mix Design
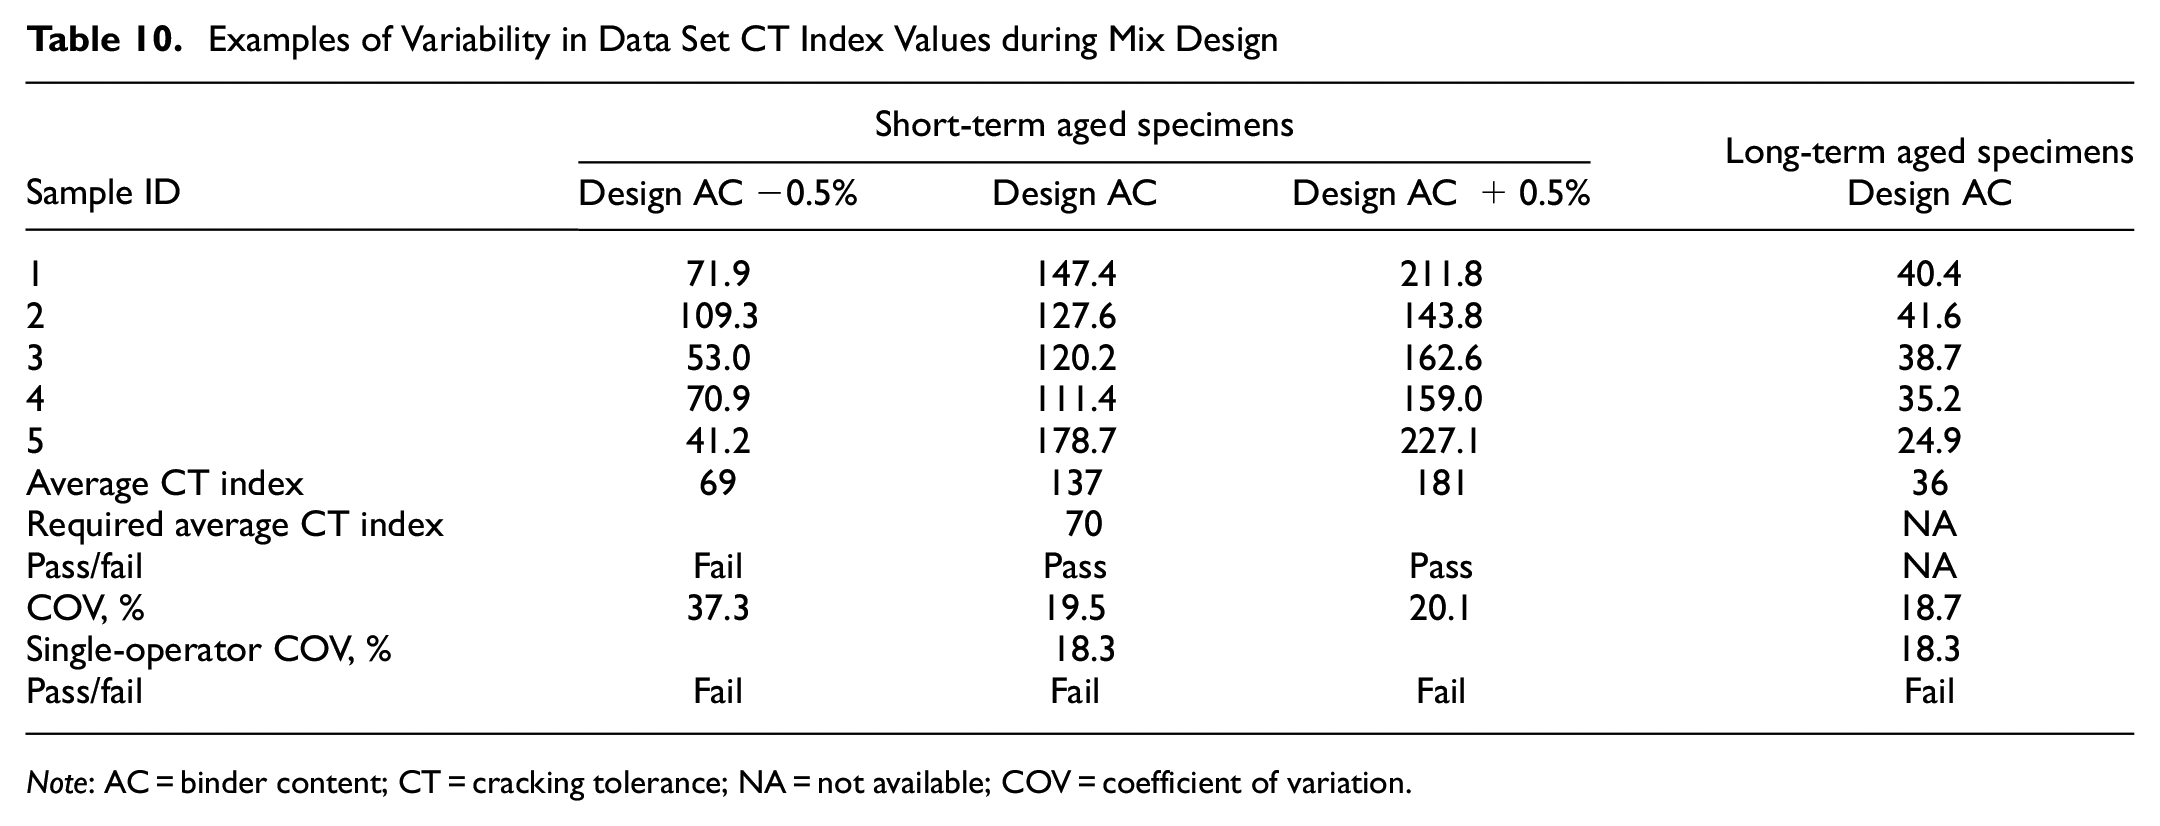
Note: AC = binder content; CT = cracking tolerance; NA = not available; COV = coefficient of variation.
During production, the IDT-CT was performed on non-reheated contractor-compacted specimens by the contractor and VDOT district laboratories. In addition, loose mixture samples were collected by VDOT and VTRC during production and were tested later after being reheated and compacted. The data collected from production are shown in Table 11. The following observations were made:
Examples of Variability in Data Set CT Index Values during Production
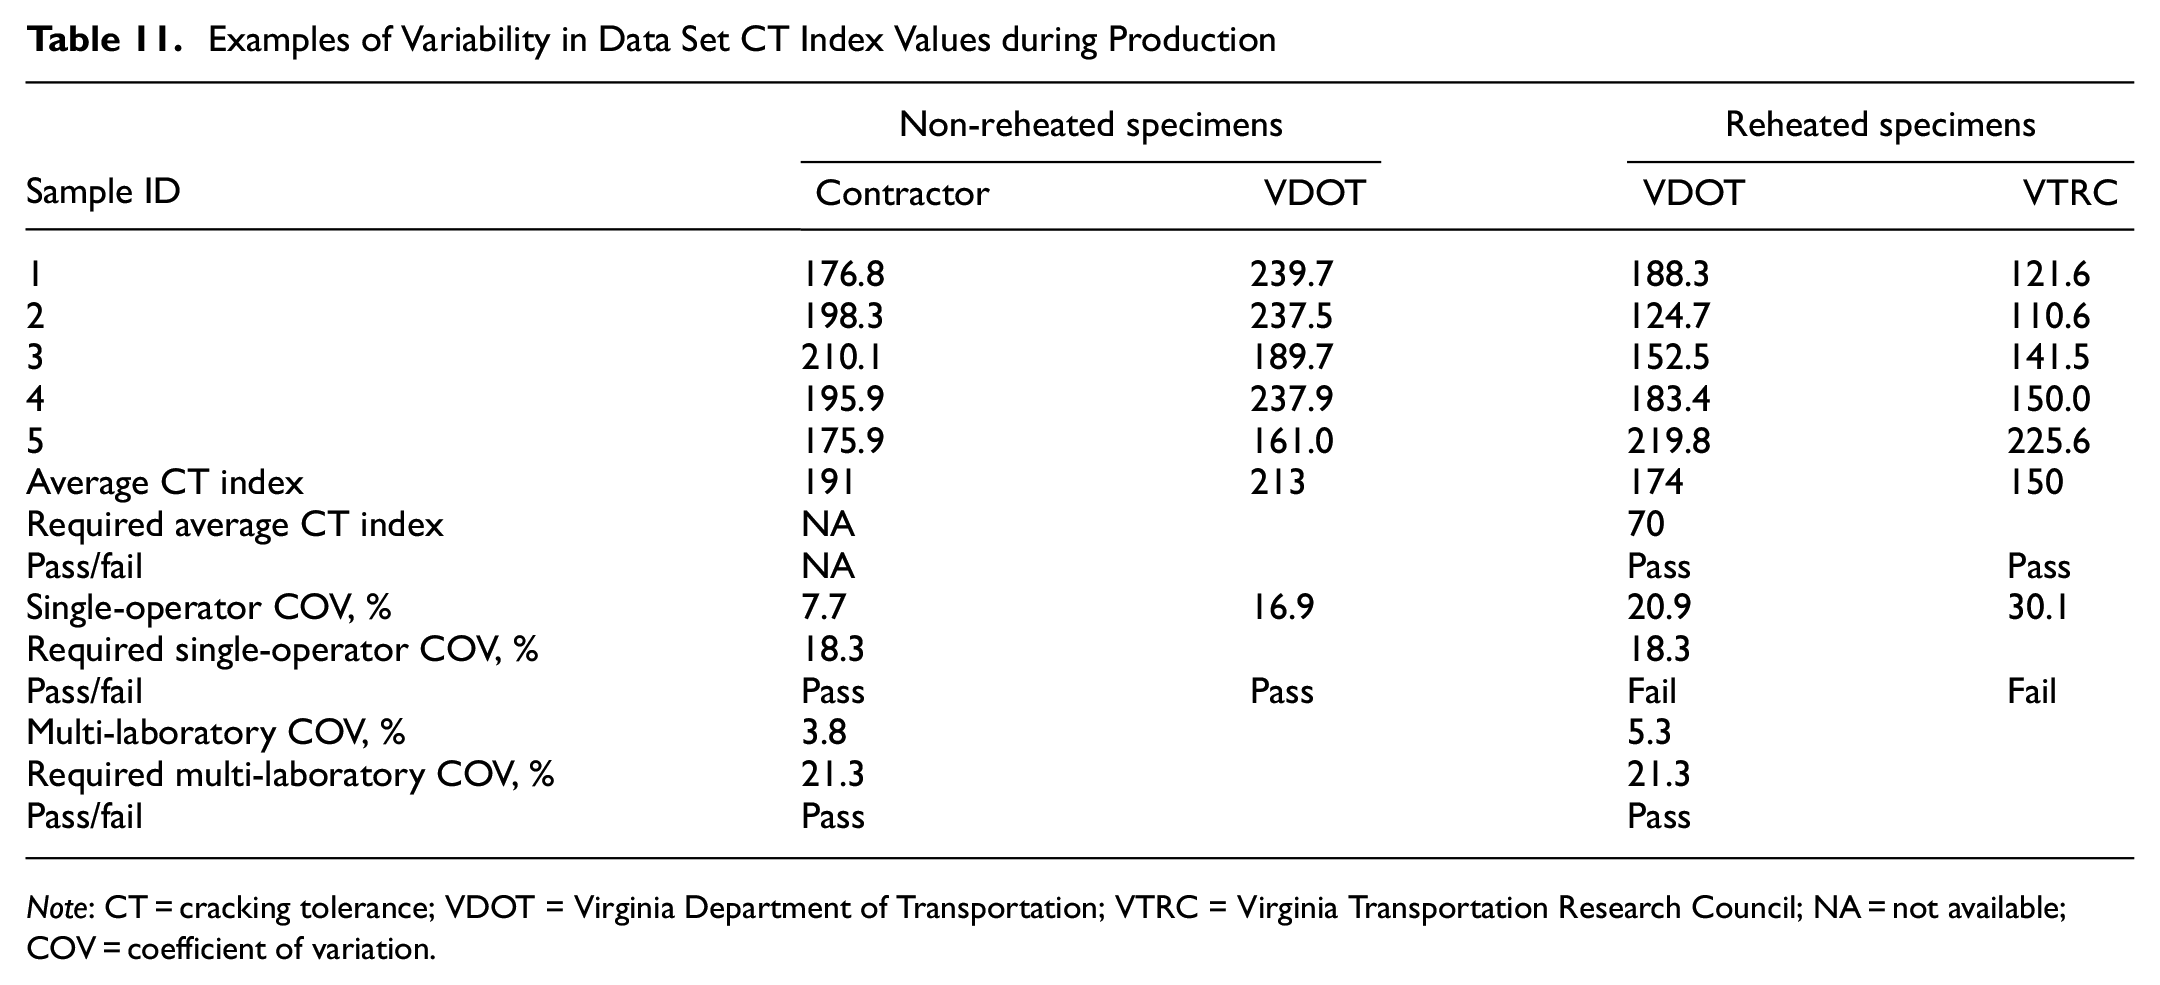
Note: CT = cracking tolerance; VDOT = Virginia Department of Transportation; VTRC = Virginia Transportation Research Council; NA = not available; COV = coefficient of variation.
Non-reheated specimens: the COVs of data sets from contractor and VDOT testing were 7.7% and 16.9%, respectively, both meeting the acceptable single-operator COV of 18.3%; the multi-laboratory COV between the contractor and VDOT data sets was 3.9%, meeting the acceptable multi-operator COV of 21.3% and indicating that these two data sets are statistically similar.
Reheated specimens: the COVs of data sets from VDOT and VTRC testing were 20.9% and 30.1%, respectively, both exceeding the acceptable single-operator COV of 18.3% (most likely, the oven time required for reheating and resultant aging of the loose mixture had an adverse effect on the material and quality of the resulting data, although other factors may have also contributed); the multi-laboratory COV between the VDOT and VTRC data sets was 5.3%, meeting the acceptable multi-operator COV of 21.3%, indicating that these two data sets are statistically similar.
Summary and Conclusions
As the implementation of BMD moves forward, those using the IDT-CT in accordance with ASTM D8225 to indicate cracking susceptibility should consider the following:
Specimen preparation induces additional variability in the precision estimates for multi-laboratory comparisons.
Device type might be a significant factor for mixtures with relatively low CT index values based on the IDT-CT. This may raise a concern when long-term aged asphalt mixtures are evaluated using the IDT-CT. In this case, the CT index value is expected to be low and the device type may have a significant effect on the test results.
The IDT-CT results are not dependent on the type of conditioning method (i.e., dry or wet) based on the definitions of the dry and wet conditioning methods in this study.
The load rate tolerance required in ASTM D8225 could be increased. The IDT-CT results are not dependent on the loading rate applied, regardless of the machine type (servo-hydraulic or screw-drive), for the loading rate range of 46 to 54 mm/min.
The IDT-CT results are not dependent on the data collection frequency used over a range of 1 to 100 Hz.
Sets of four and three test specimen replicates have single-operator and multi-laboratory precision estimates similar to those determined for five-replicate data sets.
Footnotes
Acknowledgements
The authors thank the technical review panel for this study: Robert Crandol, Candice Entwisle, Travis Higgs, Sungho Kim, Todd Rorrer, and Thomas Schinkel from VDOT and Bernard Kassner from VTRC. The authors also acknowledge the assistance provided by Mike Dudley from the Virginia Asphalt Association in developing and executing this study. The contributions of the staff from the Bluegrass Testing Laboratory in designing and producing loose mixtures and test specimens are greatly appreciated. In addition, thanks are extended to all laboratories involved in this study.
Author Contributions
The authors confirm contribution to the paper as follows: study conception and design: S. D. Diefenderfer, J. Habbouche, I. Boz; data collection: S. D. Diefenderfer, J. Habbouche, I. Boz; analysis and interpretation of results: S. D. Diefenderfer, J. Habbouche, and I. Boz; draft manuscript preparation: S. D. Diefenderfer, J. Habbouche, d I. Boz. All authors reviewed the results and approved the final version of the manuscript.
Declaration of Conflicting Interests
The author(s) declared no potential conflicts of interest with respect to the research, authorship, and/or publication of this article.
Funding
Data Accessibility Statement
The contents of this paper reflect the views of the authors, who are responsible for the facts and the accuracy of the data presented here. The contents of this paper do not necessarily reflect the official views or policies of the Virginia Department of Transportation, the Commonwealth Transportation Board, or the Federal Highway Administration at the time of publication. This paper does not constitute a standard, specification, or regulation. Any inclusion of manufacturer names, trade names, or trademarks is for identification purposes only and is not to be considered an endorsement.