
Abstract
The Americans with Disabilities Act (ADA) stipulates that paratransit mobility be comparable to public transit. However, with just under 5% of the population relying on public transportation, transit is not a representative benchmark. To highlight this inequality, we compare trip times by paratransit to counterfactual car-based travel. Using 2.5 years of demand data from the Denver Regional Transportation District’s Access-a-Ride service, we compare paratransit trip times to counterfactual car-based trips for the same origin–destination pairs, controlling for various trip characteristics. Compared to car travel, the findings indicate high variability and uncertainty associated with paratransit trip times. For the same origin–destination pairs, the mean paratransit trip time is almost twice that of the mean car travel time, with a standard deviation for paratransit trip time fourfold that of the standard deviation for car trip time. For perspective, traveling an average of 10 mi during the 7–8 a.m. morning peak can take about 16 min by car with almost no variability, while that same trip can take an average of 25 min by paratransit, with 5% of trips being outside the 95% confidence interval and thus unpredictable. Paratransit trip time inefficiency tends to be particularly worse for females; older adults; those making trips between 9 and 11 a.m.; cash-paying customers; those making shorter trips; and those traveling during inclement weather, including cold temperatures. These findings suggest a need to re-assess using public transit as a benchmark for paratransit supply as regulated by the ADA.
Keywords
Paratransit services provide access to opportunities for people with disabilities who may not be able to access fixed-route transit services or use other travel modes, such as driving, walking, or bicycling. Viable travel options for people with disabilities will grow in importance as the percentage of people experiencing (or aging into) disability continues to increase each year. In 2020, 40.8 million people, or 12.7% of the total population, were living with disabilities in the U.S.A. ( 1 ). In addition, projections suggest that those 65 years and older will increase from 56 million in 2020 to 81 million by 2040 ( 2 ). These two groups have more diverse, often unrecognized, mobility needs than the rest of the population.
Since 1990, the Americans with Disabilities Act (ADA) has aspired to address these diverse needs and create equitable and accessible transportation options. The ADA federally mandates that transit authorities provide complementary paratransit service to populations who are unable to use fixed-route public transportation, at a level comparable to public transportation. Here is an excerpt from the ADA of 1990 (section 12143):
Paratransit as a complement to fixed route service
(a) General rule: It shall be considered discrimination for… a public entity which operates a fixed route system… to fail to provide… paratransit and other special transportation services to individuals with disabilities, including individuals who use wheelchairs that are sufficient to provide to such individuals a level of service
(1) which is comparable to the level of designated public transportation services provided to individuals without disabilities using such system; or
(2) in the case of response time, which is comparable, to the extent practicable, to the level of designated public transportation services provided to individuals without disabilities using such system (3).
Paratransit eligibility is based on federal guidelines set up by the ADA, and service is only provided to origins and destinations within three-fourths of a mile of fixed-route public transportation if the fixed-route service is running. The ADA also stipulates that paratransit times and services be “comparable” to those experienced by individuals without disabilities using public transportation.
Overall, the perception that paratransit is a door-to-door, somewhat personal, and optimized service, is far from reality. Poor on-time performance is a key problem experienced by paratransit riders in the U.S.A. ( 4 ). A study done for the Bureau of Transportation Statistics ( 5 ) found that 53% of passengers reported experiencing significant problems with paratransit services, such as the vehicle not showing up during the permissible pick-up window or not showing up at all. Time inefficiency, in particular, results in significant challenges for paratransit passengers who use these services for time-sensitive trips such as commuting to work or getting to medical appointments ( 6 , 7 ). While demand and costs keep increasing for operators, passenger satisfaction often remains low ( 8 ) and people with disabilities report higher travel expenditures compared to others ( 9 ).
Importantly, 87% of workers use car-based private modes to travel to work, while just 5% use public transportation ( 10 ), indicating that the norm in travel within the U.S.A. is the automobile. Considering this travel mode split, how fair is the ADA rule requiring paratransit to be benchmarked against public transportation? Such a constrained comparison can be used to justify an uneven supply of mobility options between those with versus without disabilities. The outcomes of such a system could manifest in unequal travel experiences, asymmetrical access to infrastructure, opportunity, and economy, and uneven temporalities of mobility ( 11 ).
In this research, we specifically examine the trip time efficiency of paratransit by focusing on the following research question: How does the trip time efficiency of paratransit compare with that of a counterfactual trip taken by automobile? We do so by using 30 months of paratransit trip data from Denver’s regional transit provider. This includes more than 1.16 million trips that include pick-up and drop-off locations for each record/trip in addition to trip time, trip cost, fare type, gender, and age.
As older adults become a larger part of the overall population, and people with disabilities lead more active lifestyles ( 12 ), it becomes essential to provide mobility options that are comparable with the average daily travel habits of others in society. Furthermore, studying the efficacy of paratransit is important in enabling data-driven policy and planning decisions that benefit both agencies and passengers. Even though trip time efficiency is arguably the most important feature for paratransit passenger satisfaction ( 13 ), there seems to be a gap in understanding which trip characteristics are associated with paratransit trip times ( 14 ).
Literature Review
Groups who are not able to drive or take fixed-route public transit and depend on paratransit are much more likely to be denied equal opportunity, full participation in society, independent living, and economic self-sufficiency ( 11 ). Wong et al. ( 15 ) found that in New York, transport options are less accessible and slower for disabled workers than they are for non-disabled workers, and workers with disabilities request higher salaries in exchange for commute times. Brucker and Rollins ( 16 ) discovered that workers with disabilities who have similar commute times to workers without disabilities earn substantially less per hour. In addition, several studies highlighted the importance of efficient transportation systems for the social participation and community integration of people with disabilities and older adults ( 17 – 22 ). Generally, however, a review of the literature suggests that there is limited scholarship on how people with disabilities travel. Specific analyses of travel behavior or cohort-based investigations for people with disabilities are particularly nonexistent, to the best of our knowledge. The paratransit literature has mainly focused on operational perspectives to decrease costs for transit operators while improving efficiency rather than user experience. Several researchers have studied the time efficiency within the dial-a-ride problem (DARP) ( 23 ) and reported on operational algorithms germane to dynamically linking trips to increase time efficiency ( 24 – 27 ). The methods developed related to the DARP have predominantly focused on minimizing operational costs as a function of total distance traveled, while the service quality is ensured using hard constraints such as maximum ride time ( 28 ).
Lu et al. ( 14 ) looked at travel time reliability from a paratransit zoning strategy framework. They compare the centralized zoning strategy (operating the whole service area as a single zone) to the decentralized zoning strategy (dividing the whole service area into adjacent zones operated by independent providers). In the latter case, vehicles are allowed to traverse boundaries but only to pick up or drop off customers. This means that either the origin or the destination of the customer needs to be in the relative zone. Lu et al. ( 14 ) found that the decentralized zoning strategy compared to the centralized strategy substantially improves the reliability of paratransit. Kagho et al. ( 29 ) concluded that demand-responsive transit (DRT) is more efficient and reliable in areas that are smaller in size and denser in population. Rahimi et al. ( 30 ) also supported this conclusion by finding that expansion of the service into areas with low population density would increase costs. Deka ( 31 ) found that the trip booking method, trip distance, winter season, crash density, and pick-ups within three-fourth mile buffers of bus routes were positively associated with miles per minute, which was used to measure reliability; however, miles per minute biases the results toward free-flow conditions and freeway trips. Deka ( 32 ) concluded that higher densities of population, jobs, and street intersections are positively related to delays.
Other studies have explored trip-generators for paratransit customers to measure demand to increase the overall performance of paratransit. Deka and Gonzales ( 33 ) found that the total population, the proportion of older adults, and the Black population are positively associated with the number of paratransit trips at the census block group level. The same finding, with the addition of the number of people below the poverty line, is also supported by Kuo et al. ( 34 ). Deka and Gonzales ( 33 ) also found that a larger average household size, median home value, and median rent are negatively associated with the number of paratransit trips and that places with large apartment complexes are likely to generate more trips but places with long average commuting times are more likely to generate fewer trips.
Paratransit customers’ main reasons for not using fixed-route transit, even though they want to, include the lack of a pedestrian-friendly environment, greater distance from transit stops, and complex and non-frequent service ( 35 ). Sze and Christensen ( 36 ) highlighted the relationship between accessibility, particularly for the walking environment, and journey time. According to their findings, because of the lack of accessible facilities, the average overall journey time of mobility-impaired individuals can be 80% higher than that for individuals without mobility limitations. Kim et al. ( 37 ) found that improved bus stop amenities and enhanced access to bus stops with sidewalks and ramps result in reduced paratransit demand, since customers are better able to utilize the regular bus service.
Several researchers looked at how the COVID-19 pandemic affected the travel behavior and use of paratransit of people with disabilities. Wang et al. ( 38 ) concluded that older riders and those with severe mobility challenges tended to stop using the paratransit services. However, a substantial percentage of riders with medical needs and riders who lived in areas with low car ownership and low income rates continued to keep using the paratransit service. Park et al. ( 39 ) found that people with disabilities reduced travel across a wide array of trip purposes, and those with cognitive and sensory conditions were the most affected. Ashour et al. ( 40 ) suggested that partnering with transportation network companies would increase the resiliency of the service. Cochran ( 19 ) found that people with disabilities who are without car access faced especially limited transportation during the pandemic.
Some researchers have investigated dissimilarities in travel times between fixed-route public transportation and the car as a part of comparing travel time efficiencies. Liao et al. ( 41 ) compared the travel time by car and transit in four cities (São Paulo, Brazil; Stockholm, Sweden; Sydney, Australia; and Amsterdam, the Netherlands) and found that public transit on average takes 1.2–2.6 times longer than driving. Salonen and Toivonen ( 42 ) made the same comparison for the Greater Helsinki Region and showed that public transit has 1.19–3.50 times longer travel times compared to the private car. Rayle et al. ( 43 ) compared public transit to ride-hailing in San Francisco and found that the average total travel time was 22 min for ride-hailing trips, while the same trips would have taken on average 33 min by public transit. Yet, to the best of our knowledge, the question of how paratransit trip time efficiency compares to that of the car remains unexplored.
Study Overview
Denver’s Regional Transportation District
The Regional Transportation District (RTD) provides public transportation in eight counties in Colorado’s Front Range, namely Denver, Boulder, Broomfield, and Jefferson counties along with parts of Adams, Arapahoe, Douglas, and Weld counties. RTD serves over 2.9 million people within 2342 square mi ( 44 ). Based on American Community Survey 2019 5-year estimates ( 45 ), the total population of those eight counties was around 3.14 million, and 9.2% (or 289,000) of the population reported having one or more disabilities. Further, of those who reported a disability in the Denver Region, 25% (or 72,250) had an ambulatory difficulty. Within the counties served by RTD, 80.4% of the workers without disabilities used private or shared automobile-based travel modes for transportation to work (not including taxis), while only 3.8% (or 61,800) used public transportation. In comparison, 77.6% of the individuals with disabilities within RTD counties used private or shared automobile-based travel modes, while 5.6% (or 5275) took public transportation ( 46 ). Therefore, as a cohort, people with disabilities were more reliant on public transportation, yet a majority relied on car-based modes.
Access-a-Ride: RTD’s Paratransit Service
Access-a-Ride is RTD’s complementary door-to-door paratransit service, which started in 1993, and is designed to serve mobility-disadvantaged groups in the Denver Metro Area. Although RTD’s entire fleet is accessible and ADA compliant, demand-responsive services had 1,179,015 and 537,078 annual unlinked trips in 2019 and 2020, respectively ( 44 ), indicating that paratransit services have a strong customer base. RTD provides Access-a-Ride service through 310 RTD-owned dedicated cutaway vehicles that are operated by three contractors, namely MV Transportation, Via Mobility, and Transdev ( 47 ). According to the Access-a-Ride customer guide, RTD provides one-way local and regional trips, costing US$5 and US$9, respectively ( 48 ). A one-way trip to Denver International Airport costs US$20. All fares can be paid in cash, with tickets, or through social and medical programs. In addition, RTD has been providing the Access-a-Cab service since 2005, which is not meant to replace Access-a-Ride but is offered as a same-day alternative. RTD states that 38% of regular Access-a-Ride customers also used Access-a-Cab in 2019 ( 47 ).
Analytical Approach
Data Assembly
We used Access-a-Ride trip data for 30 months from January 2019 to June 2021. The full dataset, shared by RTD, contained 1.16 million trips that include identifiers for pick-up and drop-off and time stamps for trip start and trip end, as well as sex, birth year, cost of the trip, and collected fare type. We removed records that did not have all attributes as well as trips that had records that we considered to be recording mistakes, possibly because of technology or human error, such as a trip end date recorded a month later. Access-a-Ride does not require payment for children under six years, so entries for children under six, which represent 0.3% of the full sample, were removed because the form of payment was a variable of interest for this analysis. We calculated the trip duration for each trip based on the time stamp information. We then computed the 99.99th percentile (188.5 min) and 0.5th percentile (5.8 min) for paratransit trip durations. We removed records that had trip times longer than 200 min or shorter than 5 min, considering them to be outliers. These treatments reduced around 9.5% of the data.
Each trip was assigned a start time range from the 10 ranges (incorporating early, a.m. peak, p.m. peak, or late hours) as used by the Denver Regional Council of Governments (DRCOG), the regional Metropolitan Planning Organization (MPO), for transportation modeling purposes. We randomly selected 10% of the trips for analysis in this paper. This subset of the data would provide a large enough sample to statistically represent the entire dataset while allowing faster processing times.
We calculated several other key variables, including trip durations for travel by car for the same pick-up and drop-off locations for each trip using the R package gmapsdistance and utilizing the Google Distance Matrix application programming interface (API) ( 49 ). The Distance Matrix API is a paid service by Google that provides travel distance and time for an origin–destination matrix. The API returns information based on the recommended route between start and end points, as calculated by the Google Maps API, and consists of rows containing duration and distance values for each pair. The trip date for these calculations was chosen to be April 1, 2022, since the Google Distance Matrix API does not allow historic calculations. We do not expect the average trip time between an origin–destination pair for a representative day to be any different from that provided by Google, unless under extreme weather or event situations for which we did not find any evidence for the trips we considered. The trip times were the mid-hours of each of the 10 DRCOG ranges depending on the time of the trip. We also fused data on average daily weather conditions, based on the weather station at Denver International Airport, using the R package rnoaa ( 50 ). Table 1 provides the summary statistics for the variables used in the analysis ( 46 ).
Summary of Analysis Variables
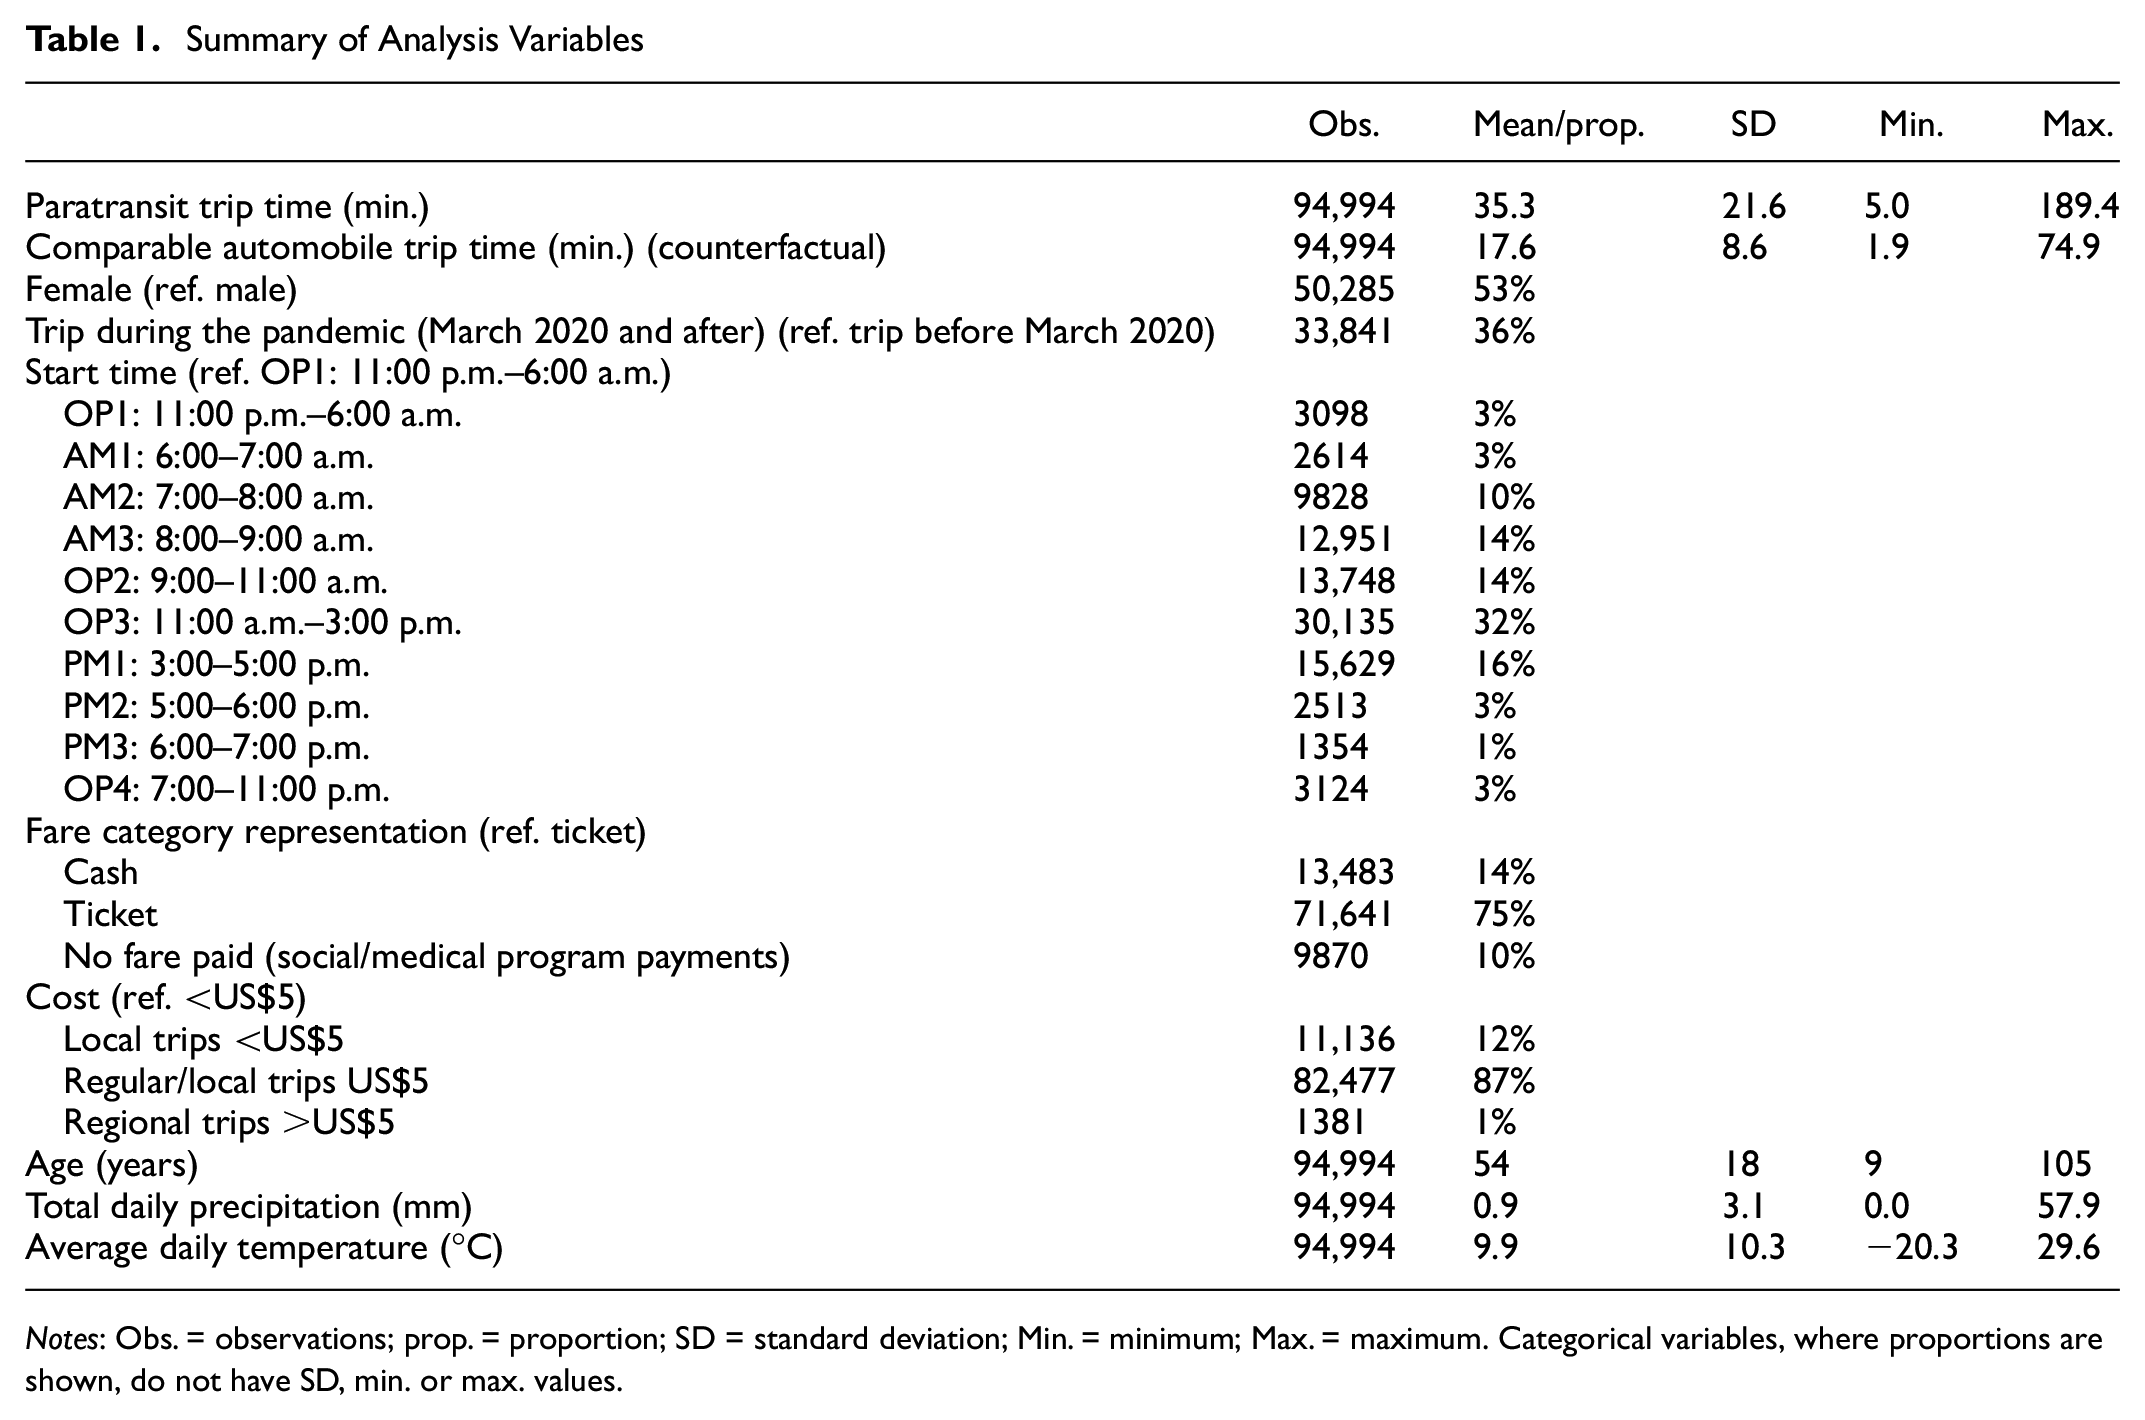
Notes: Obs. = observations; prop. = proportion; SD = standard deviation; Min. = minimum; Max. = maximum. Categorical variables, where proportions are shown, do not have SD, min. or max. values.
Data Analysis
User Profiling
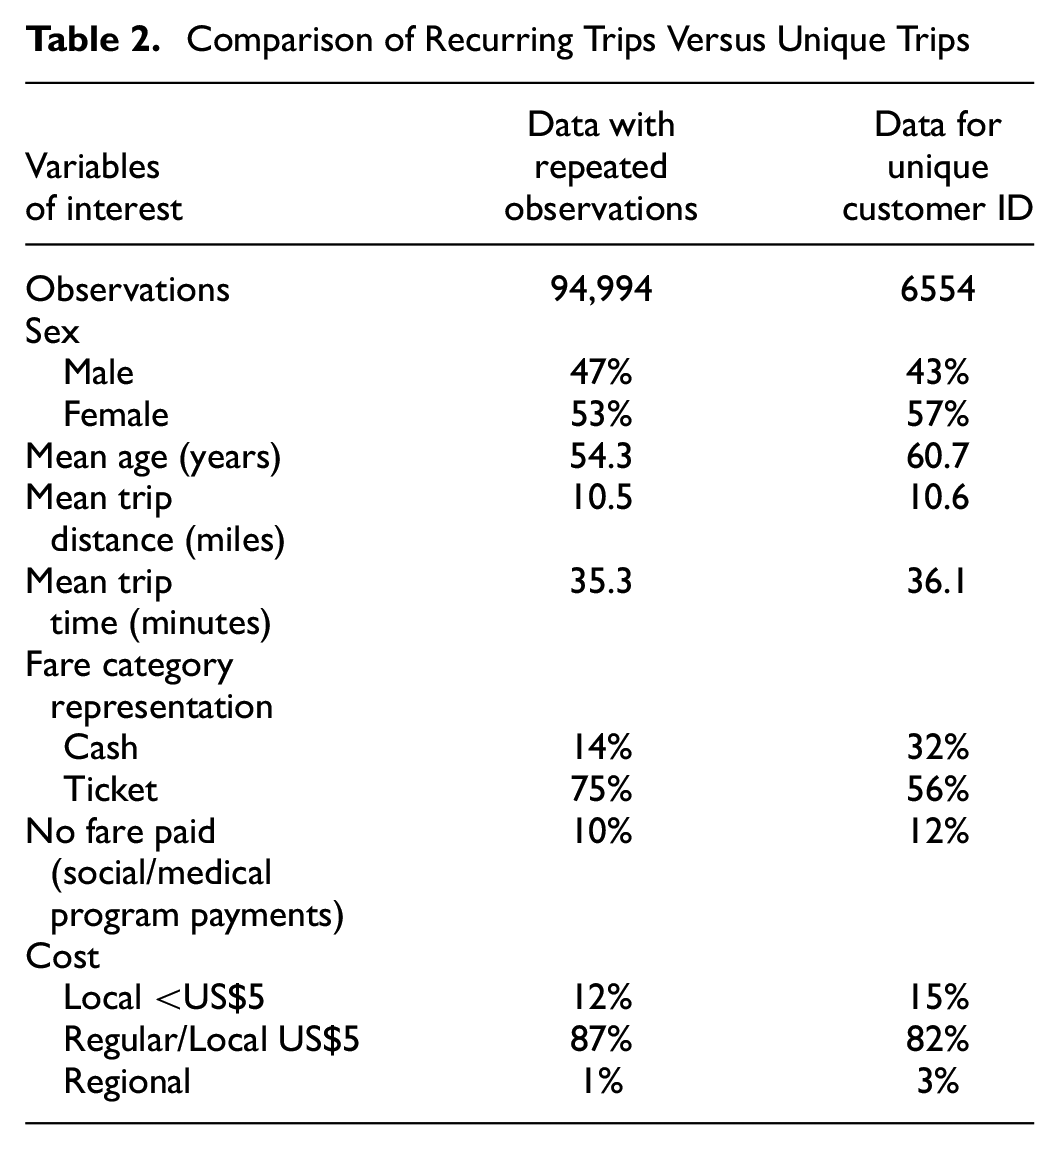
The primary focus of this paper was to understand the inefficiencies of paratransit trips and the resulting time loss for the users of the service. In the 10% random sample of the original dataset, we had multiple entries by customer ID, which prompted us to investigate the user population to check for patterns that characterized repeated users. We chose one trip per unique customer ID from the 10% randomly sampled dataset, which further reduced the dataset from ∼95,000 observations to ∼6500 observations (Table 2). This indicates that most Access-a-Ride patrons are captive and used the service despite well-documented issues with paratransit services. Table 2 shows the comparison of the representation of various user groups and trip characteristics in these two datasets, that is, repeat customers versus unique customer IDs. Fifty-seven percent of the trips in the unique customer ID dataset were made by women and 43% by men. However, when repeat customers were considered, 53% of the trips were made by women while 47% were made by men, indicating that men took more recurring trips than women. Recurring trips were also common among users paying for the trips by buying tickets rather than users who paid by cash or were covered by social/healthcare programs. Seventy-five percent of the observations in the repeat customers dataset were from ticketed users, while they made up only 56% of the unique customer ID dataset. In addition, 14% of the users paid by cash in the repeat customer data set compared to 32% in the unique customer ID dataset. Ten percent of the users in the repeat customer dataset were covered by social and healthcare programs, while 12% of the users in the unique customer ID dataset were covered by social and healthcare benefits. Users in the repeat customer dataset were also younger than those in the unique user dataset, but there was no significant difference in average trip length or average trip time across all observations between these two datasets. Overall, recurring users of the paratransit service were younger males who were also mostly ticketed customers of RTD’s paratransit service, and most paratransit service users were making trips that cost them less than or equal to US$5.
Comparison of Recurring Trips Versus Unique Trips
In addition to identifying repeat customers’ characteristics, we also investigated if the trip time experience differed by user group (sex, age, mode of payment, and fare paid). We found that men took trips that were of slightly longer average trip duration than women (37.2 min versus 35.3 min) and users paying less than US$5 had longer trip durations than users paying US$5 (38.6 min versus 35.6 min), thus making shorter trips more inefficient than longer ones. There was no significant difference in average trip time duration for users using different payment options (∼35 min for all groups).
Trip Time Analysis
As mentioned previously, our analysis focused on comparing trip time efficiencies between the same origin–destination pairs by car versus paratransit. Thus, our key analysis variables were trip times by car and Access-a-Ride between the same origin–destination pairs. We used the distance traveled by car for the same origin–destination pair for the trip distance, although paratransit trips are rarely so direct. Nevertheless, for a paratransit user, it would be true that they could have made the same trip in much less time had the route not been circuitous, so we were comparing the user-perceived inefficiencies and uncertainty of paratransit trip time. We segmented the car trip distances between origin–destination pairs into three groups: short trips ≤5 mi, medium trips >5 but ≤12 mi, and longer trips >12 mi. We also explored the effect of the COVID-19 pandemic on trip times. Of the 6554 unique trips considered in the trip time analysis, 5264 trips were made before the pandemic while 1290 trips were made during the pandemic. We used these two groups to compare average car and paratransit trip times before and during the COVID-19 pandemic.
Table 3 shows the mean, standard deviation, and respective Student’s t-test outcome for trip time by car versus paratransit for the three distance classes across the full data, pre-pandemic (January 2019–February 2020) data, and during pandemic (March 2020–June 2021) data. For the full and pre-pandemic observations, for short-distance trips, the paratransit trip times were on average about twice that of travel by car, with a standard deviation that was about 50% of the mean paratransit trip time and three times the standard deviation of that for the car trip time, indicating high variability in paratransit trip time. For medium and longer distance trips, the paratransit trips were on average 10 min longer, but like the short-distance trips, they were associated with a high degree of variability that was greater than twice the variability in car trip time. Student’s t-tests indicated that the mean trip times were significantly different between car and paratransit travel for all three distance categories for the full and pre-pandemic datasets. For observations during COVID-19, the average paratransit trip times became comparable to that of average car trip times with a difference of means of about 5–7 min across short- and medium-distance trips. The mean paratransit trip time was the same or marginally shorter (42.1 min versus 42.7 min) than the car trip time for longer distance trips during the pandemic. The standard deviation associated with the mean paratransit trip times performed better, being less than half the mean trip time and about 1.5 times that of the standard deviation associated with car trip time. Student’s t-tests for the statistical significance of difference in mean trip times between paratransit and car showed that the difference was significant for short- and medium-distance trips but not for longer distance trips.
Difference in Mean Trip Times by Car and Paratransit
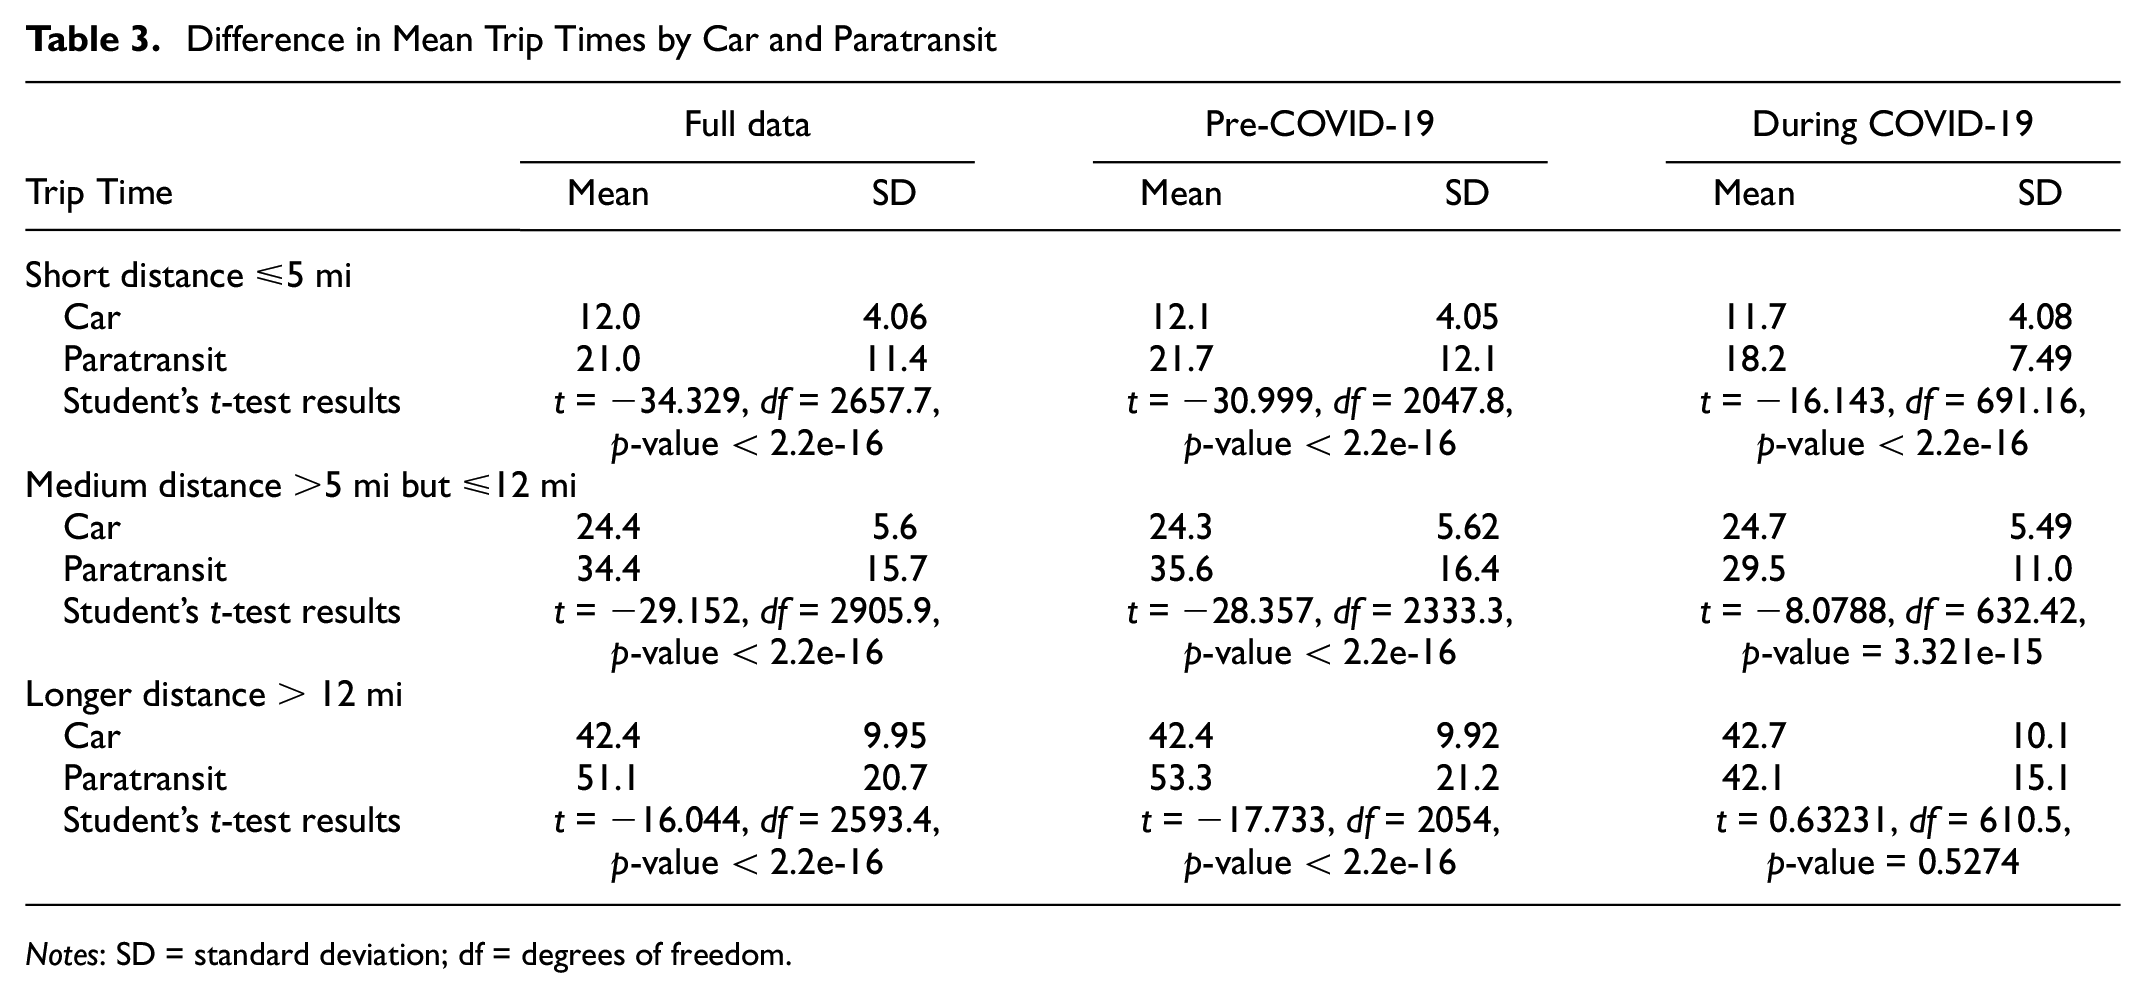
Notes: SD = standard deviation; df = degrees of freedom.
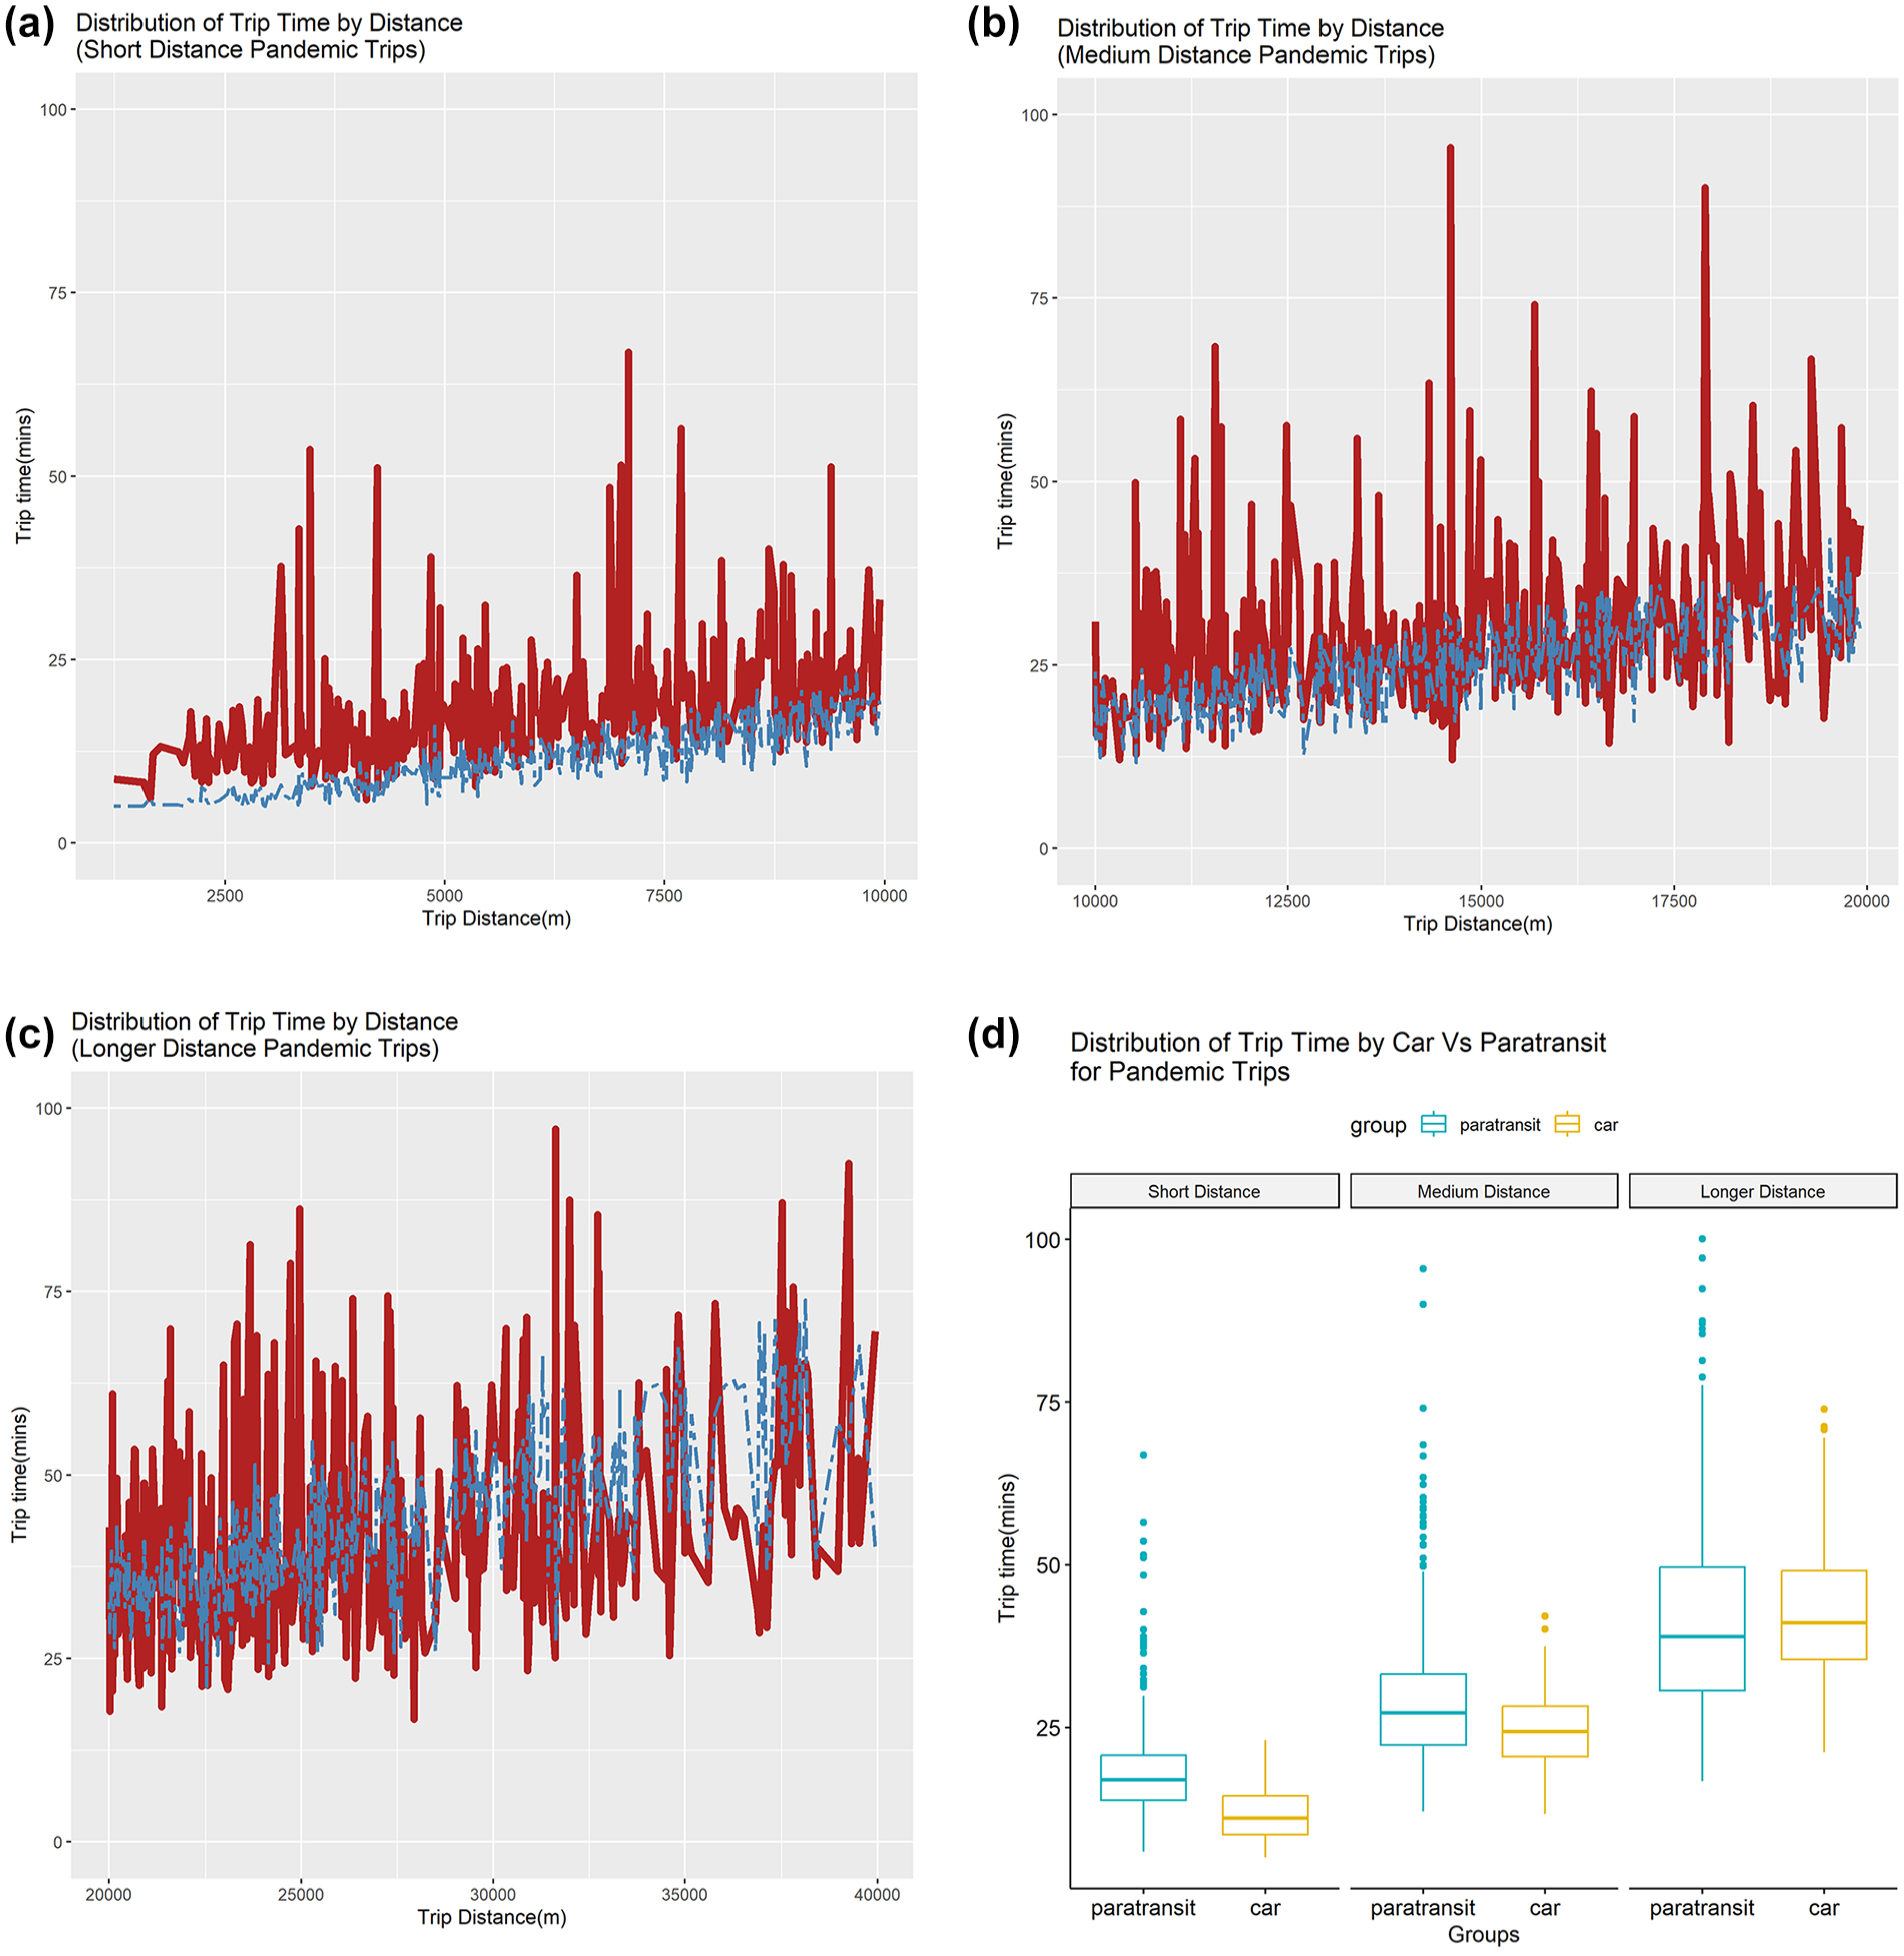
Nevertheless, longer trip time is only one of the multiple issues faced by paratransit users. The paratransit literature indicates that important factors that patrons struggle with include uncertainty and lack of reliability ( 4 , 5 ). The analysis presented in this paper indicated high variability in paratransit trip times through high standard deviation associated with mean trip time. However, those analyses (Table 3) were for aggregated distance, rather than for the individual trip level. So, we analyzed the trip time distributions to investigate the level of uncertainty or variability associated with paratransit trips and how that compared with car trips. Figure 1, a–c, shows the trip time distribution for car and paratransit trips across trip distance for the three distance categories for pre-pandemic trips, while Figure 1d shows the boxplots for those same trip time distributions for those same trips. Figure 2, a–c, shows the trip time distributions for car and paratransit trips recorded during the pandemic, while Figure 2d shows the boxplot for the trip time distributions for those same trips. These trip time distribution plots indicate a wide range of trip times for any trip distance for paratransit trips in comparison to the trip time ranges exhibited by car trips for the same travel distance, especially for pre-pandemic and for short- and medium-distance trips. The boxplots also show a high number of outliers for paratransit trips with an even wider distribution than car trip time distributions along with a higher mean trip time. Both these findings indicate and confirm the high variability and uncertainty associated with paratransit trip times, which can substantially affect user experience. Multiple studies have shown that people perceive their wait time or in-vehicle time to be less onerous if there is more reliability in the system ( 51 , 52 ).
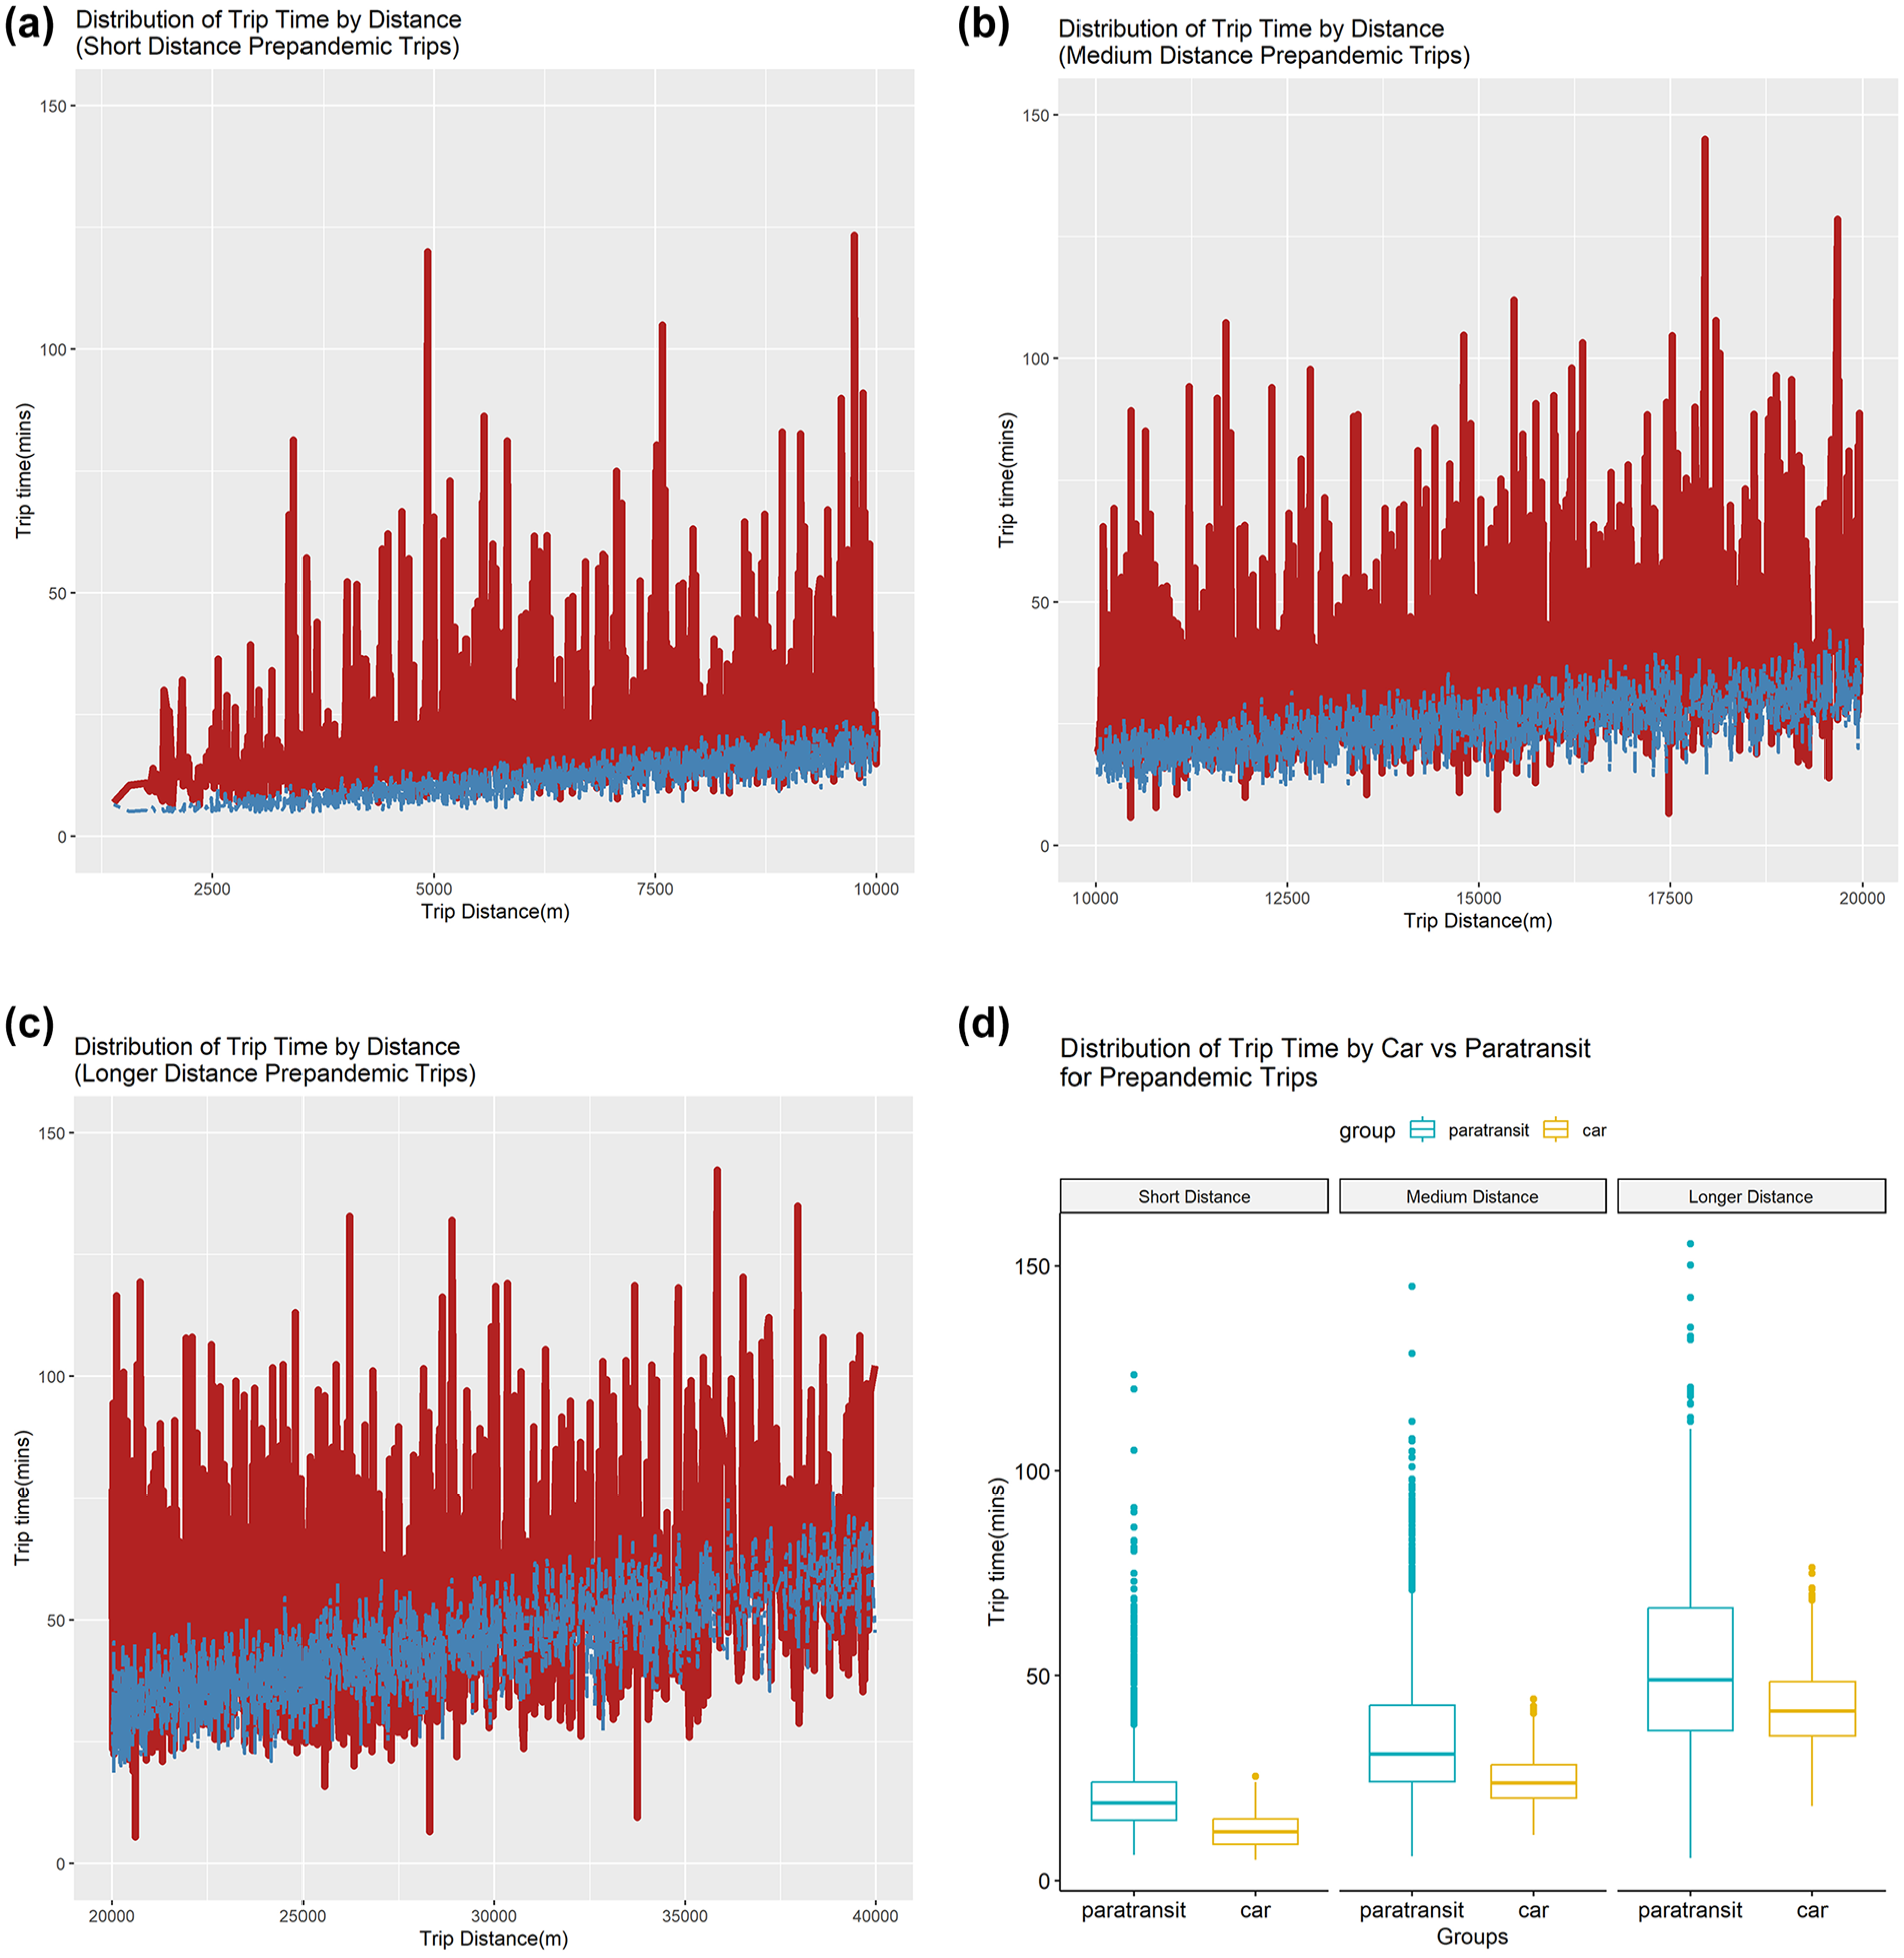
(a)–(c) Comparisons of trip time by car (in blue) versus paratransit (in red) for all pre-pandemic trips for short, medium, and longer distances respectively, and (d) boxplot distributions of paratransit and car trip times with outliers (color online only).
(a)–(c) Comparisons of trip time by car (in blue) versus paratransit (in red) for all pandemic trips for short, medium, and longer distances respectively, and (d) boxplot distributions of paratransit and car trip times with outliers (color online only).
Modeling Approach
Since our preliminary analysis suggested that short trips were penalized more than longer trips on trip time inefficiencies, we wanted to explore if trip time inefficiencies were systematically related to trip start times (e.g., if peak hour trips were penalized more than off-peak hour trips) or to trip distances. We also wanted to investigate if the trip times were different among subgroups of paratransit users and during COVID-19 versus pre-pandemic times, so we developed causal models relating trip time to the different variables mentioned in Table 1. The first model is a linear regression model where the outcome variable is the difference in trip time between paratransit and car travel, normalized by trip distance for that trip (i.e., difference in minutes spent in paratransit trip versus car trip, per mile of travel). Mathematically:

We regressed this difference against different trip start times, average temperature, and precipitation. That is:

The purpose of this analysis is to add to the findings in the previous section by identifying how the average difference in trip time is further influenced by when the trip happens, controlling for weather conditions for that day. Table 4 shows the results of this regression analysis.
Regression Model for Trip time Difference Between Paratransit and Car Travel
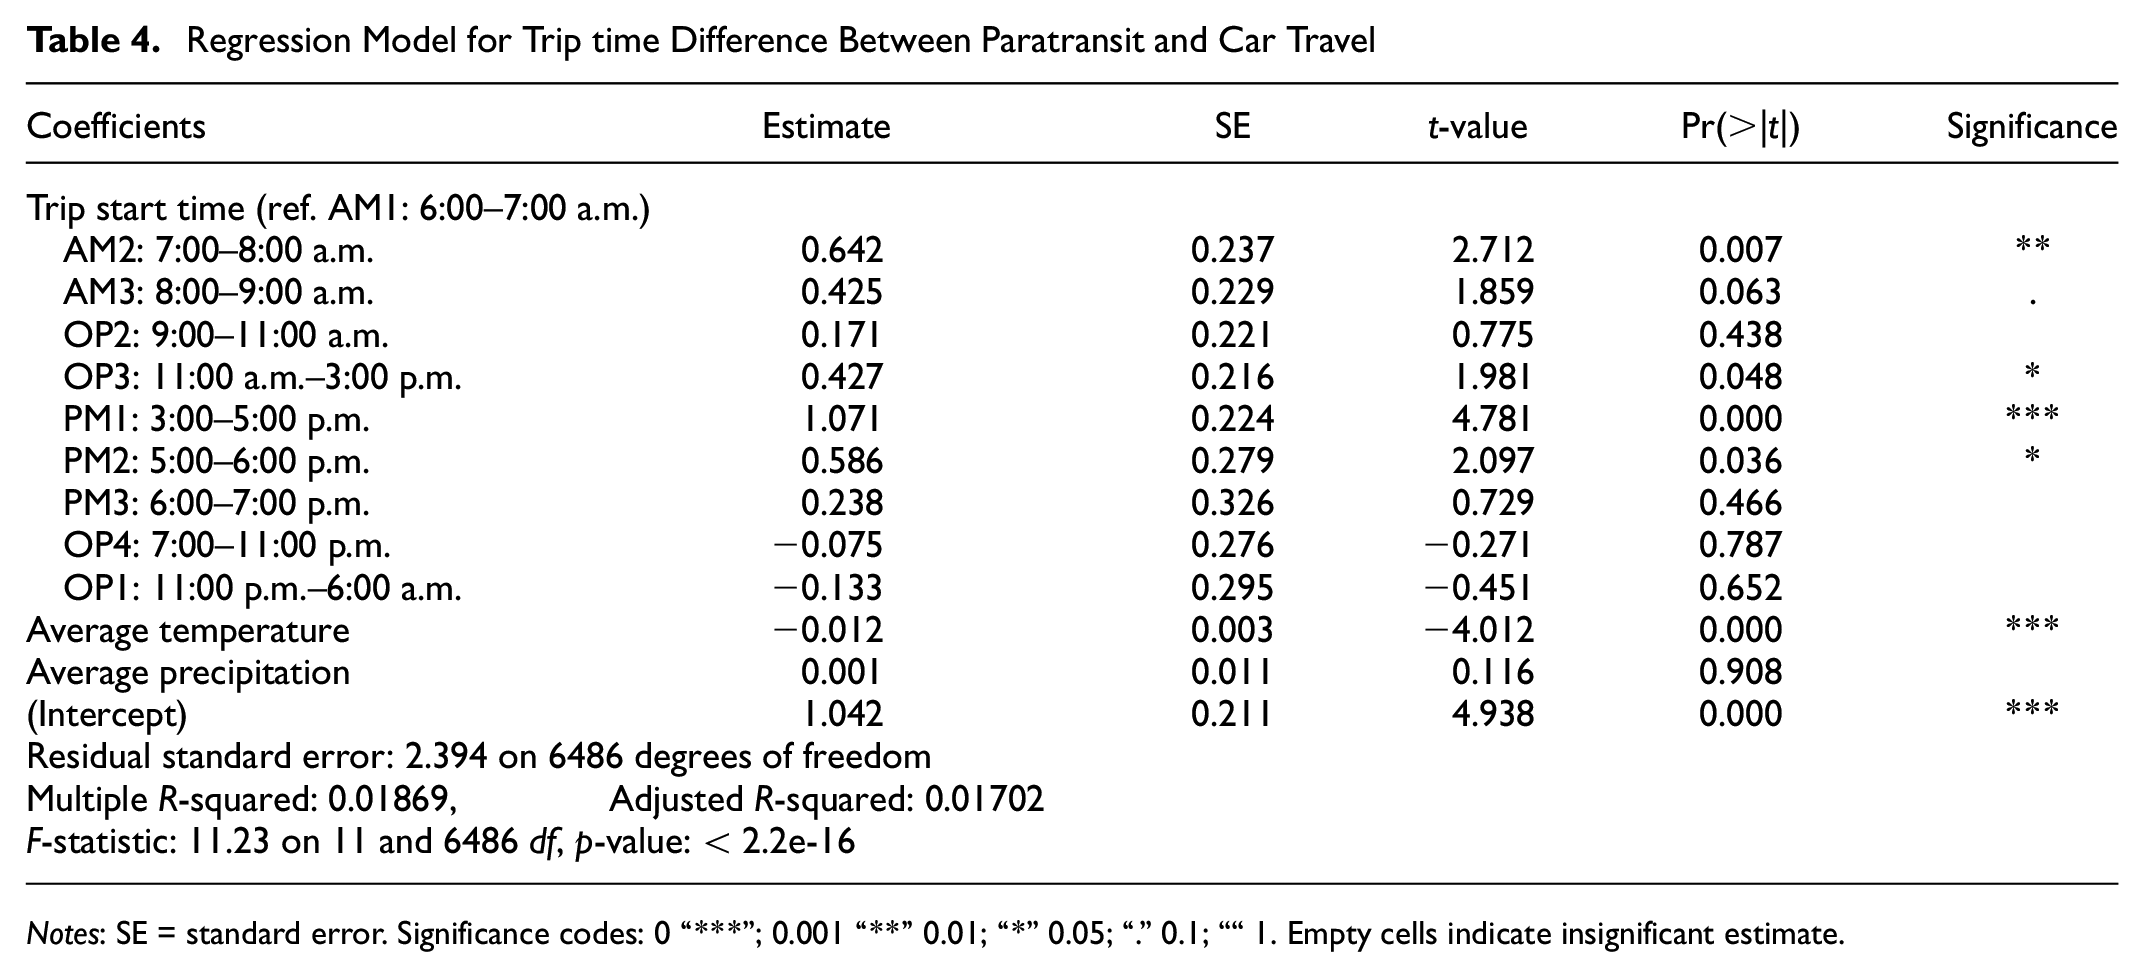
Notes: SE = standard error. Significance codes: 0 “***”; 0.001 “**” 0.01; “*” 0.05; “.” 0.1; ““ 1. Empty cells indicate insignificant estimate.
Table 5 shows the second model relating paratransit trip time to its user subgroups, using a Cox proportional hazards (Cox-PH) model. Cox-PH models are used to predict the risk of an event happening at any particular time point and are widely used in epidemiological and medical research to estimate the risk of contracting disease/death given patient characteristics. In our research, the Cox-PH model predicts the “proportional risk” of a trip ending at any given point, that is, a user exiting the system. Thus, it cumulatively measures at any time point how many trip makers are having a trip longer than that time point.
Proportional Hazards Model
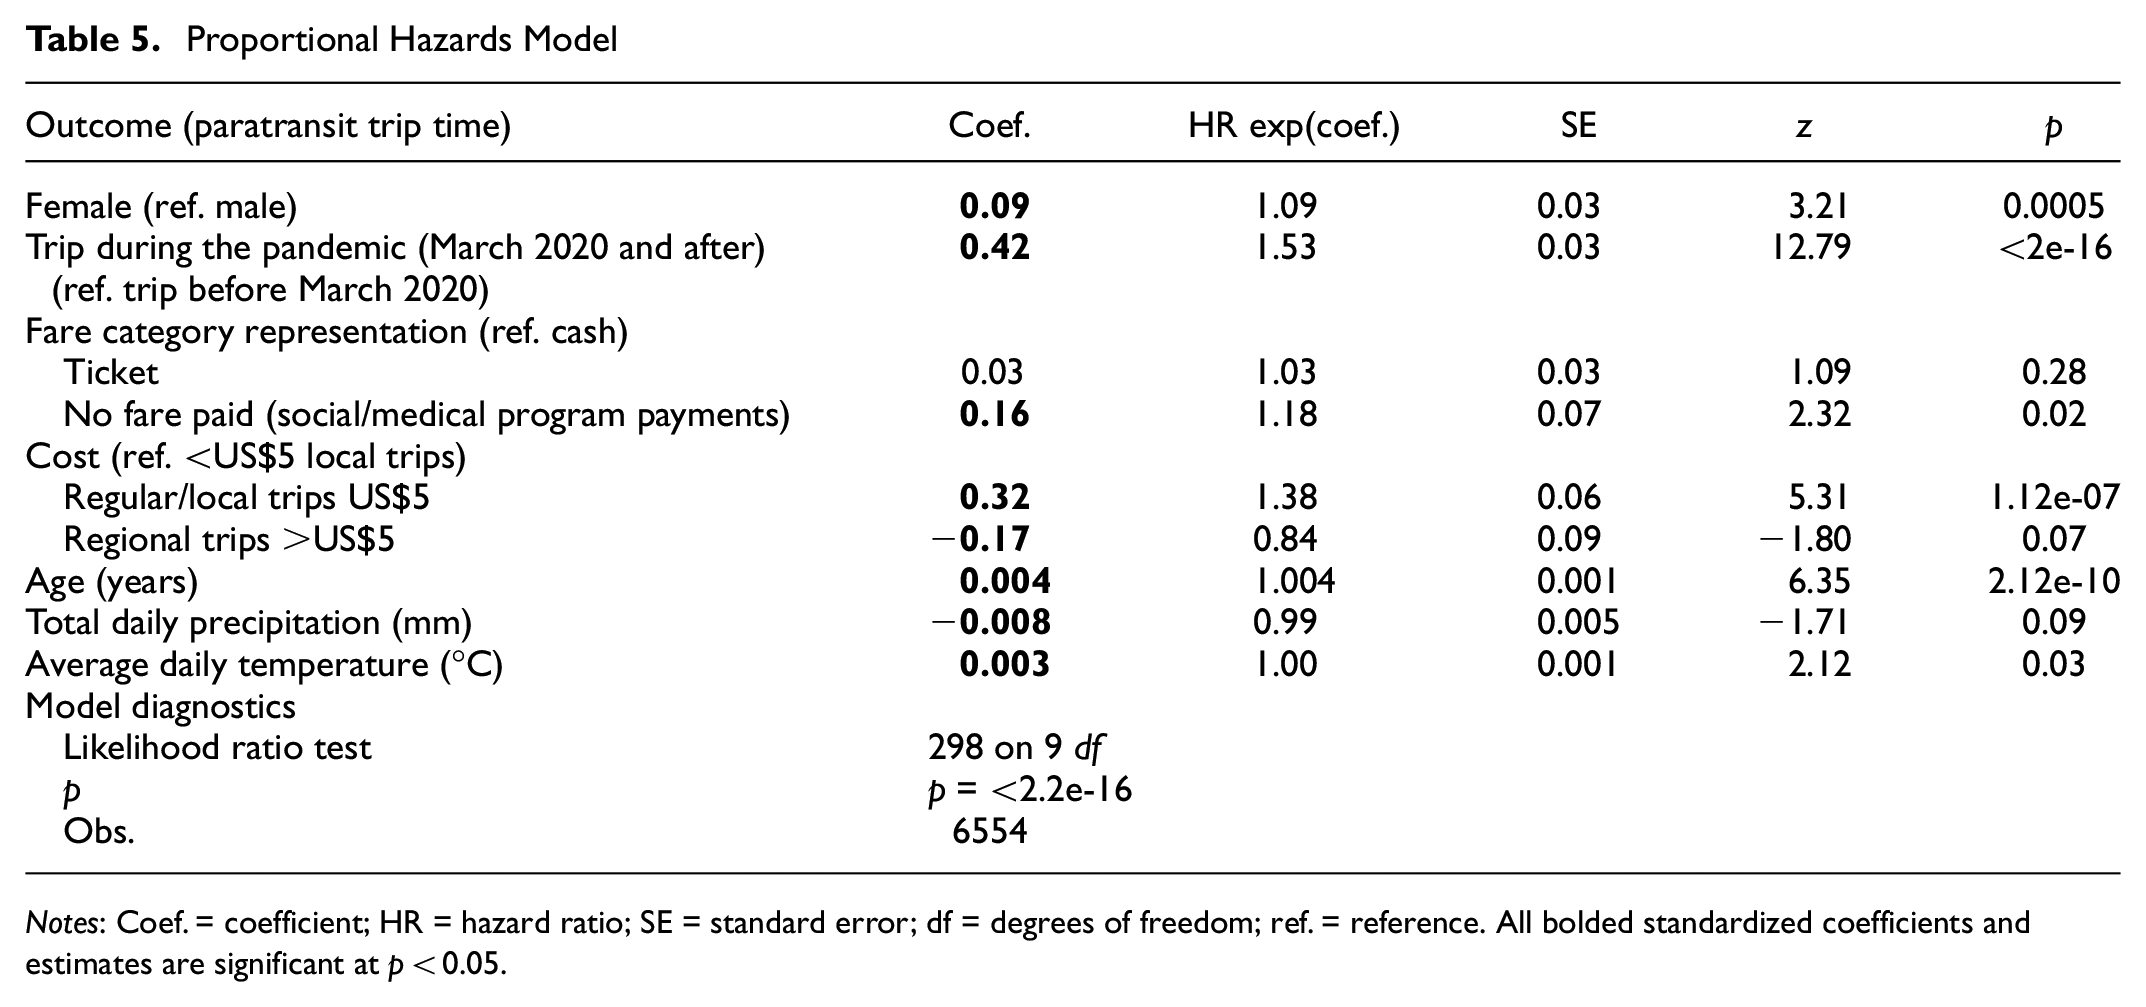
Notes: Coef. = coefficient; HR = hazard ratio; SE = standard error; df = degrees of freedom; ref. = reference. All bolded standardized coefficients and estimates are significant at p < 0.05.
Results
Normalized Trip Time Difference Model
The regression analysis shows that the average trip time difference was significantly influenced by the start time of the trip and the average temperature of the day (Table 4). A positive coefficient for any explanatory variable for the model indicated that (i) the variable influenced an increase in paratransit trip time, all else being equal, including car trip time, or (ii) the rate of increase of paratransit trip time was higher than that of car trip time under the influence of that explanatory variable, ceteris paribus. Thus, a.m. peak and p.m. peak start times contributed to an increased travel time for paratransit users compared to car users. The only time when paratransit use was more time efficient than car travel time was between 11 p.m. and 6 a.m., when few trips occur. People traveling during the a.m. peak (6–9 a.m.) needed to budget an additional 6.5 min on average for a 10-mi trip, or an additional 10.6 min if that trip was made in the p.m. peak in addition to being three times as uncertain as car trip time.
Figure 3 shows the predicted time difference for the different start time periods and the related confidence intervals based on the estimated model (Table 4), calculated for an average trip length of 10 mi (Table 2). Any such paratransit trip happening between 6 and 9 a.m. was predicted to be 10–17.5 min longer on average than car trip time, and the same trips happening between 3 and 7 p.m. were predicted to be 8–21 min longer than a car trip on average. To put the comparison into perspective, an average trip of 10 mi by car took about 25 min, so an additional 20 min made the trip time 45 min with an uncertainty three times that associated with the 25-min travel time. Therefore, for a 25-min trip to a destination during the morning, a paratransit user needed to start at least (25 + 17.5) ∼ 45 minbefore to reach the destination on time, with still a 5% chance of not reaching the destination on time. For evening trips, the paratransit user needed to start the trip about 50 min earlier with the same risk of not reaching the destination 5% of the time.
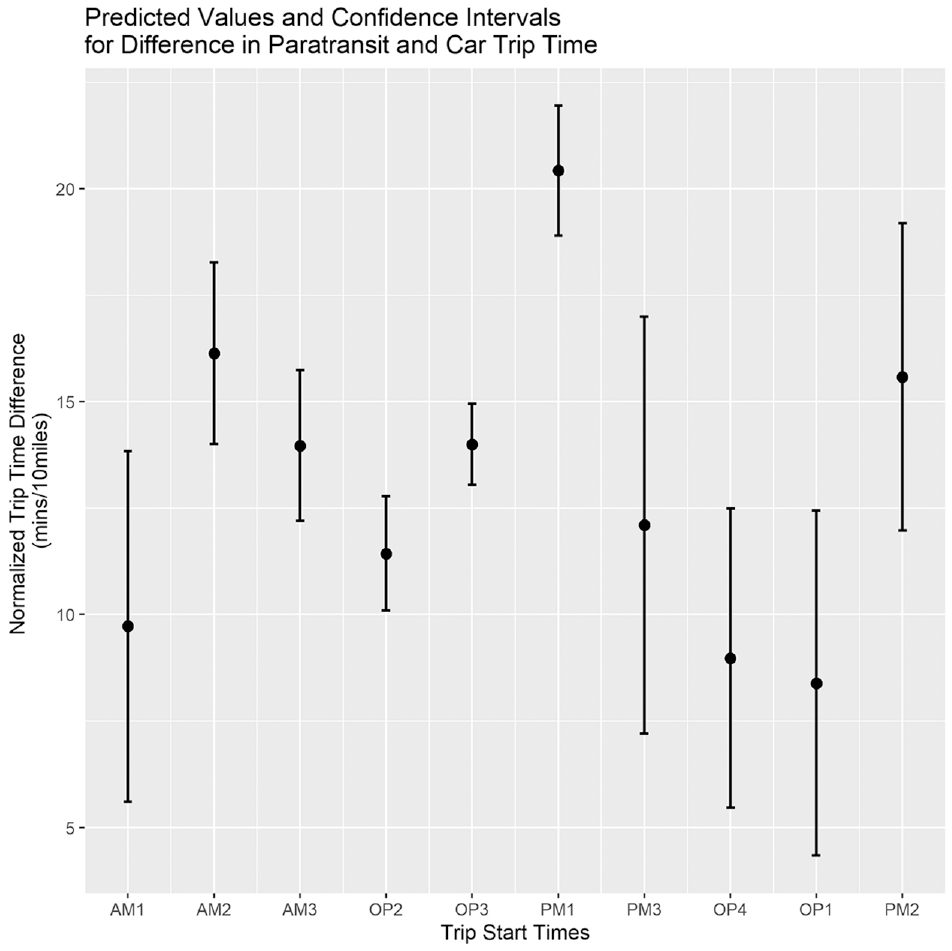
Predicted normalized trip time difference between paratransit and car travel for different start times, for an average trip distance of 10 mi.
Cox Proportional Hazards Model
For the Cox-PH model (Table 5), the hazard ratio (HR) shows that, all else being equal, female paratransit riders were more likely to reach their destinations faster than their male counterparts. The HR shows that paratransit was significantly more time efficient during the pandemic. The HR value implies that, during the pandemic, paratransit riders were 1.53 times more likely to arrive at their destination faster compared to pre-pandemic paratransit travel. On average, there was no systematic advantage for ticketed customers relative to cash-paying paratransit users. Interestingly, however, compared to cash-paying customers, paratransit riders who did not pay out of pocket, that is, were supported through social/medical programs, were 1.18 times more likely to arrive at their destinations faster. Compared to riders who paid less than US$5, paratransit users who paid US$5 (the cost of a one-way local trip) were 1.38 times more likely to arrive at their destination faster, on average, all else being equal. Customers who paid more than US$5, indicating regional trips, were less likely to arrive at their destination as fast as riders who paid less than US$5, likely internalizing time losses on long-distance, cross-regional trips. For the last three explanatory variables, age, total daily precipitation, and average daily temperature, the HR values are too close to one, which means that it is hard to interpret results as they relate to the likelihood of time-efficient arrival.
Discussion and Policy Implications
This research shows that paratransit travel is not monolithic. Broadly, paratransit trip time includes multiple time inefficiencies, such as picking up and dropping off other riders, completing paperwork before each ride, traffic congestion, and road closures. The comparable counterfactual automobile trip time includes congestion and road closures, which affect a planned trip when mapping a route on Google Maps. It is important for researchers and practitioners to understand the heterogeneity in time travel and seek solutions to improve time efficiency. Our models provide insights for improvements and indicate areas for future research.
Improving the time efficiency of paratransit will make a positive difference in the mobilities of women with disabilities more than those of men with disabilities. Women with disabilities, relative to men with disabilities, have better time efficiency, which indicates a need for further research. It is likely that women with disabilities take shorter trips or take trips during times that require fewer other pick-ups and drop-offs for the vehicle run.
Paratransit trips were more time efficient during the pandemic, as expected. This was likely a result of having to pick up fewer other passengers and therefore there being less paperwork and re-routing for each pick-up, the presence of fewer cars on the road, which decreased congestion, or the higher likelihood of patrons making only essential or medical trips, which has been observed in cohorts such as older adults ( 22 ). This indicates that there are many more inefficiencies attached to paratransit travel relative to car travel. Post-pandemic, providers need to understand that “normal” paratransit has never been fair for riders, compared to travel by car.
Compared to passengers who paid by cash, riders who had the trip cost covered by programs such as Medicaid experienced more time-efficient trips. This suggests that having travel booked and paid for by service providers at destinations (e.g., large grocery chains or medical centers) may create efficiencies for paratransit customers. From an operations perspective, the time of the day for paratransit trip time matters. Generally, during early morning peak (6–9 a.m.) and evening peak (3–6 p.m.), travel takes longer on paratransit.
Conclusions
In this paper, we investigated differences in trip time between paratransit and counterfactual car trips for the same origin–destination pairs. We found that paratransit trip times are on average twice that of car travel times between the same origin–destination pairs, with three times the uncertainty associated with that mean travel time as compared to that of car travel time. Paratransit trips are also particularly inefficient for shorter and medium-distance trips. We found that paratransit trip times are significantly influenced by trip start times, especially morning and afternoon peak hours, which added between 10 and 16 min to the already nearly twice trip time difference, along with its high level of uncertainty. Paratransit trip times were also higher in winter and in rain, making it a poor choice of travel in inclement weather.
Our work indicates that paratransit services could be improved for trip time efficiency by engaging in a series of policy measures. Time of trip during the day matters with high inefficiency on paratransit, compared to the automobile-based mode. This suggests that sedan-based services, particularly supplied during peak travel hours, can increase time-efficient travel for people with disabilities. While those arguing for fewer automobile trips may not favor policies for increasing car-based access, people with disabilities have long had lower vehicle ownership compared to the general population ( 17 , 53 ). An alternative, which many agencies including RTD are exploring, is to partner with ride-hailing services such as Lyft and Uber ( 54 ). Such partnership programs may be a solution for some of the inefficiency factors, such as paperwork before the trip, more direct routes, burdening trip planning for paratransit riders, and labor and maintenance costs for the agency. However, agencies also need to make sure that people without internet access or smartphones can book trips with private vendors, that the vehicles are appropriate for the special needs of the riders, such as people who roll, and that the drivers are trained to accommodate those riders ( 55 ).
For people with disabilities who do not (or cannot) own or drive an automobile, given the numerous accessibility challenges with fixed-route transit, comparable paratransit is essential for the equality of access to opportunity, full participation, independent living, and economic self-sufficiency goals as laid out in the ADA ( 3 ). Overall, this work shines light on trip time inefficiency on paratransit and shows that the ADA’s regulatory reach has yet to deliver comparable travel for persons with disability. Future research should look into extending this study with paratransit trip data from other agencies and different regions.
Footnotes
Acknowledgements
The paper is based on work initially developed by Cemal Akcicek at the University of Colorado Denver as a Master’s in Urban & Regional Planning thesis. We sincerely thank Dr. Debra Brucker (University of New Hampshire) who served on the thesis committee and provided expert guidance.
Author Contributions
The authors confirm contribution to the paper as follows: study conception and design: C. Akcicek, M. Shirgaokar, A. Misra, W. Marshall; data collection: C. Akcicek, M. Shirgaokar; analysis and interpretation of results: C. Akcicek, A. Misra, M. Shirgaokar; draft manuscript preparation: C. Akcicek, A. Misra, M. Shirgaokar, W. Marshall. All authors reviewed the results and approved the final version of the manuscript.
Declaration of Conflicting Interests
The author(s) declared no potential conflicts of interest with respect to the research, authorship, and/or publication of this article.
Funding
The author(s) disclosed receipt of the following financial support for the research, authorship, and/or publication of this article: The work presented in this paper was conducted with support from the University of Colorado Denver and the Mountain-Plains Consortium, a University Transportation Center funded by the U.S. Department of Transportation. See ![]() for more details.
for more details.
The contents of this paper reflect the views of the authors, who are responsible for the facts and accuracy of the information presented.