
Abstract
Surface energy is a key material property and can work as a crucial parameter in various mechanical models to predict the moisture sensitivity and fatigue damage of asphalt mixtures. The calculated surface energy values of the aggregate minerals strongly depend on their surface roughness. Therefore, it is very relevant for accurate calculation of surface energy to study the relationship between roughness and surface energy. This study aims to investigate the relationship between surface roughness and surface energy of aggregate minerals. Two minerals—quartz and calcite—were used for this study. The surfaces of the mineral specimens were treated to achieve four levels of roughness. Their surface roughness was described by three roughness parameters. Based on the sessile drop method, an optical tensiometer with a 3D topography module was employed to measure the contact angle and the surface energy of the minerals with different roughness. The influences of surface roughness on the contact angle and the surface energy were then analyzed. The results showed that the contact angle for both quartz and calcite decreases with the increasing surface roughness when it is less than 90° and increases when it is greater than 90°. The Wenzel equation can remove the effect of surface roughness on the contact angles of the minerals. The surface energy of quartz and calcite in the presence of roughness at the microscale would be underestimated when using the measured (apparent) contact angle. The corrected surface energy based on the Wenzel equation must be applied to represent the real surface energy of the minerals.
Aggregates (i.e., rock particles) with diverse mineral compositions are one of the most widely used construction materials. In asphalt pavements, the aggregates are applied to fabricate the asphalt concrete when mixed with bitumen. The weight of the aggregates can be up to around 95% of the whole asphalt concrete. The interfacial adhesion between the aggregates and bitumen plays a critical role in the durability of asphalt pavements. The adhesive deterioration of the aggregates with bitumen would cause severe pavement distresses such as strength degradation, moisture damage, and fatigue cracking ( 1 – 5 ).
The surface energy of aggregates is a key material property, which can be directly related to moisture sensitivity and fatigue resistance of asphalt concrete through the adhesive bonding between the aggregates and bitumen. It has been widely used as a crucial parameter in thermodynamic and mechanical models to investigate the fundamental failure mechanisms of asphalt concrete. Lytton et al. proposed a surface-energy-based approach to evaluate the moisture sensitivity of asphalt concrete ( 6 ). In their study, the surface energy of aggregates was measured to calculate the adhesive bond strength between the aggregate and bitumen and then predict moisture damage of asphalt concrete. Little and Bhasin measured the surface energy of various aggregates and pure minerals to select materials for the optimum moisture performance of asphalt concrete ( 7 ). Recently, many studies have been conducted to further evaluate the adhesive bond strength and moisture sensitivity of aggregate-bitumen systems based on the surface energy of aggregates ( 8 – 10 ). In addition to moisture damage, the surface energy of aggregates can be used to evaluate the fatigue damage of asphalt concrete. The surface energy of aggregates is an important input of material property in fatigue models according to principles of fracture mechanics. Cheng et al. applied the surface energy of aggregates to predict the fatigue cracking characteristics of asphalt concrete ( 11 ). In the study, the fatigue model was a function of the surface energy of the aggregates, which was developed based on Schapery’s viscoelastic fracture mechanics law. The fatigue performance predicted by the surface energy of aggregates agreed well with experimental results. Zhang et al. employed viscoelastic Griffith’s criterion to develop a fatigue crack initiation model for asphalt concrete under external compressive loads ( 12 ). In their fatigue model, the surface energy of aggregates was an important parameter that influenced the crack initiation in asphalt concrete. Similarly, Luo et al. investigated the fatigue crack initiation of asphalt concrete under tensile loads and found that the surface energy of aggregates was directly related to fatigue crack initiation ( 13 ).
Surface energy measurements of aggregates can be performed by using different methods including a universal sorption device (USD) and a sessile drop (SD) device. The USD-based testing method computers the surface energy of aggregates by measuring the spreading pressure of various liquids on the aggregate surface, which is inherently complex and time-consuming. Compared with the USD, the SD device is cheaper and simpler and requires minimal training. It has been extensively used in various fields (e.g., chemical, geology, mining, petroleum, coating) to investigate wetting and surface energy through direct measurement of contact angles. The SD device directly measures the contact angle of probe liquids on the solid surface to calculate the surface energy and its results are relatively accurate and reliable. The SD method has been applied to the surface energy measurements of aggregates. Little and Bhasin used the SD method to measure the surface energy of four aggregates (limestone, gravel, basalt, and granite) ( 7 ). It was reported that the surface energy of the aggregates depended on the exact mineralogical composition of the aggregate. Koc and Bulut further assessed the SD device employed for the surface energy measurements of five Oklahoma aggregates ( 14 ). It was recommended that the roughness of aggregate sample surfaces must be minimized and the roughness level should be below 1 µm. Moraes et al. tested the surface energy of two aggregates (granite and limestone) with the SD device to evaluate the moisture resistance of aggregate-bitumen systems ( 9 ). This study indicated that the different mineral groups present on the aggregate surface significantly affected on the measured surface energy of the aggregate. Based on these studies, it was found that the surface energy values for the aggregates exhibited a very broad variation, which could be caused by the mineral composition and surface roughness of the aggregates. Chau et al. have reported that surface roughness had a significant impact on the contact angle on solid surfaces when they investigated the contact angle and the wetting behavior of solid particles in flotation ( 15 ). Therefore, a study is urgently needed to understand the role of surface roughness in the surface energy calculation of aggregate minerals in asphalt concrete.
The objective of this study is to investigate the influence of surface roughness on the surface energy calculation of the aggregate minerals to develop a quantitative relationship between surface roughness and surface energy. Two minerals—quartz and calcite—were prepared and their surfaces were treated to obtain four levels of roughness. A novel laboratory test that can combine surface roughness and contact angle measurements was designed by using an optical tensiometer with a 3D topography module. The contact angle measurement was conducted on exactly the same sample areas as tested by the topography measurement. The surface energy of the minerals with different surface roughness was then determined based on an SD method. Furthermore, the relationship between the surface roughness and surface energy of the minerals was developed by analyzing the effect of surface roughness on the surface energy calculation.
Materials and Methods
Materials
Two types of pure mineral (quartz and calcite) obtained from Ward’s Natural Science were tested in this study to evaluate their contact angles and surface energy by SD method. Quartz and calcite are the two most common mineralogical compositions of the aggregates that are widely used in asphalt concrete. For example, quartz exists in granite with a high percentage, while limestone consists mainly of calcite. The mineral specimens ranged in size from 2 × 2 cm to 4 × 4 cm for the cross-section and from 1 cm to 4 cm for the thickness. Contact angle measurements can be conducted for the specimen sizes.
Preparation of Mineral Specimens with Different Surface Roughness
A protocol was developed for the specimen preparation to directly measure contact angles on mineral specimens using the SD method. The specimen surfaces must be relatively flat and clean for the accurate measurement of contact angles. The specimens were firstly polished by hand using the fine (1,000 grit) sandpapers with the abrasive material of silicon carbide to obtain a smooth surface. After that, the smooth surfaces were treated using different sandpapers with number 320, 150, 120, and 80 grits. Through controlling the polishing time (2 min), four types of specimen surfaces (No. 1, 2, 3, and 4) with a certain roughness can be created for contact angle measurements. Surface roughness measurements in the next section indicate that different levels of roughness can be successfully created by following the polishing method. All the specimens were then cleaned in boiling distilled water and put inside an oven at a temperature of 105 °C for 24 h. The specimens were finally allowed to cool to room temperature. Figure 1 presents the specimen surfaces with a certain surface roughness for quartz and calcite.
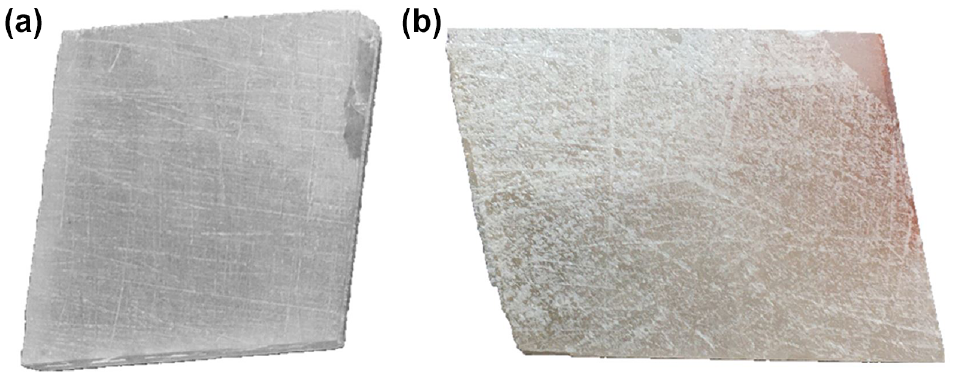
Specimen surfaces with a certain surface roughness for (a) quartz and (b) calcite.
Surface Roughness Measurement
The surface roughness of mineral specimens was measured using a 3D topography module of an optical tensiometer from Biolin Scientific. Some topography-specific parameters were firstly set in the recipe when the topography module was connected. The autofocus and autobrightness functions were selected to find the focus and brightness level for each sample automatically. The value of repetitions was set as five to perform the measurements in a single run. The results were the averages of all the measurements. The thickness of the sample was written in the recipe. After that, the sample was placed on the sample stage and the test area of the sample was chosen. The sample stage was then automatically moved below the topography camera to start the measurements. Once the measurements have been performed, the results of surface roughness can be obtained including the optical image and topography parameters.
Contact Angle Measurement
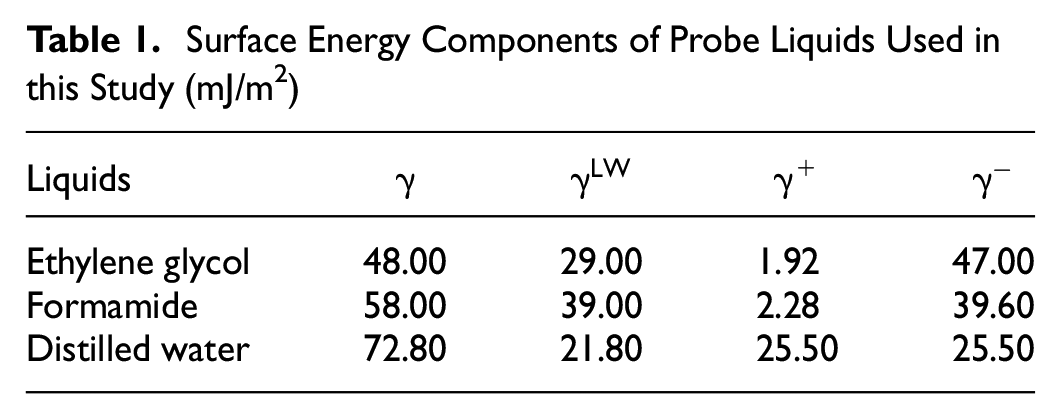
Contact angle measurements were conducted using the SD method in which the contact angle was directly measured by capturing an image of the probe liquid on the solid sample surface. The SD method has been widely used in different disciplines for contact angle measurements of a variety of materials ( 14 , 16 , 17 ). According to the Good-van Oss-Chaudhury theory, determining surface energy using the SD method requires that appropriate probe liquids are selected: 1) the surface energy components of probe liquids must be known and 2) their surface energy components are significantly different with regard to their polarities ( 18 ). Therefore, glycol, formamide, and distilled water, that have been frequently used in the literature, were selected as the probe liquids in this study for contact angle measurements. Their surface energy components are summarized in Table 1.
Surface Energy Components of Probe Liquids Used in this Study (mJ/m2)
The optical tensiometer from Biolin Scientific was employed to perform the contact angle measurements at room temperature (20°C). The SD device was first calibrated before measurements. The mineral samples were then put on the sample stage between the light source and the camera of the device. A small drop of the probe liquid (2 µl of volume) was dispensed from the dispenser on the sample surface. Finally, an image of the drop was captured by the camera. The captured image can be automatically analyzed by the device to obtain the left and right angles between the baseline and the edge of the drop. Three measurements were carried out for each probe liquid to analyze the variability of the results. The average value of all the measurements was reported as the contact angle between the sample surface and the probe liquid.
The optical tensiometer used in this study is able to combine contact angle and surface roughness measurements in the SD experiment. The topography measurement was conducted for surface roughness evaluation first, followed by the contact angle measurement. The contact angle measurement was performed on exactly the same sample areas (1.1 × 1.4 mm) as tested by the topography measurement. Thus, the contact angle on the mineral sample with a certain surface roughness can be obtained using the optical tensiometer.
Results and Discussion
Surface Roughness Evaluation
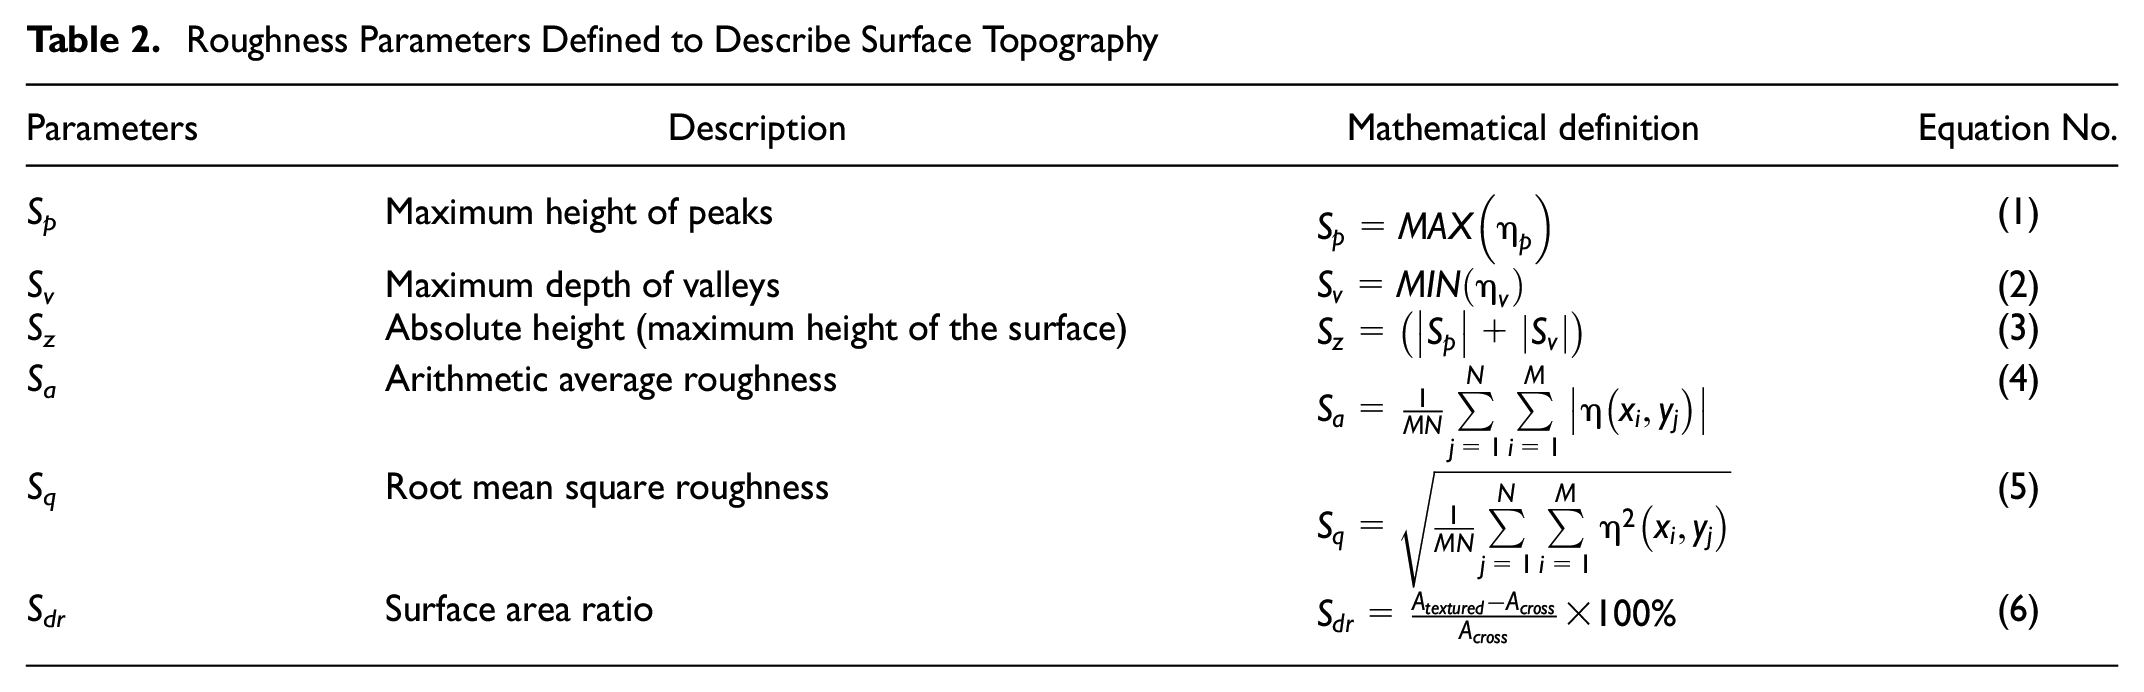
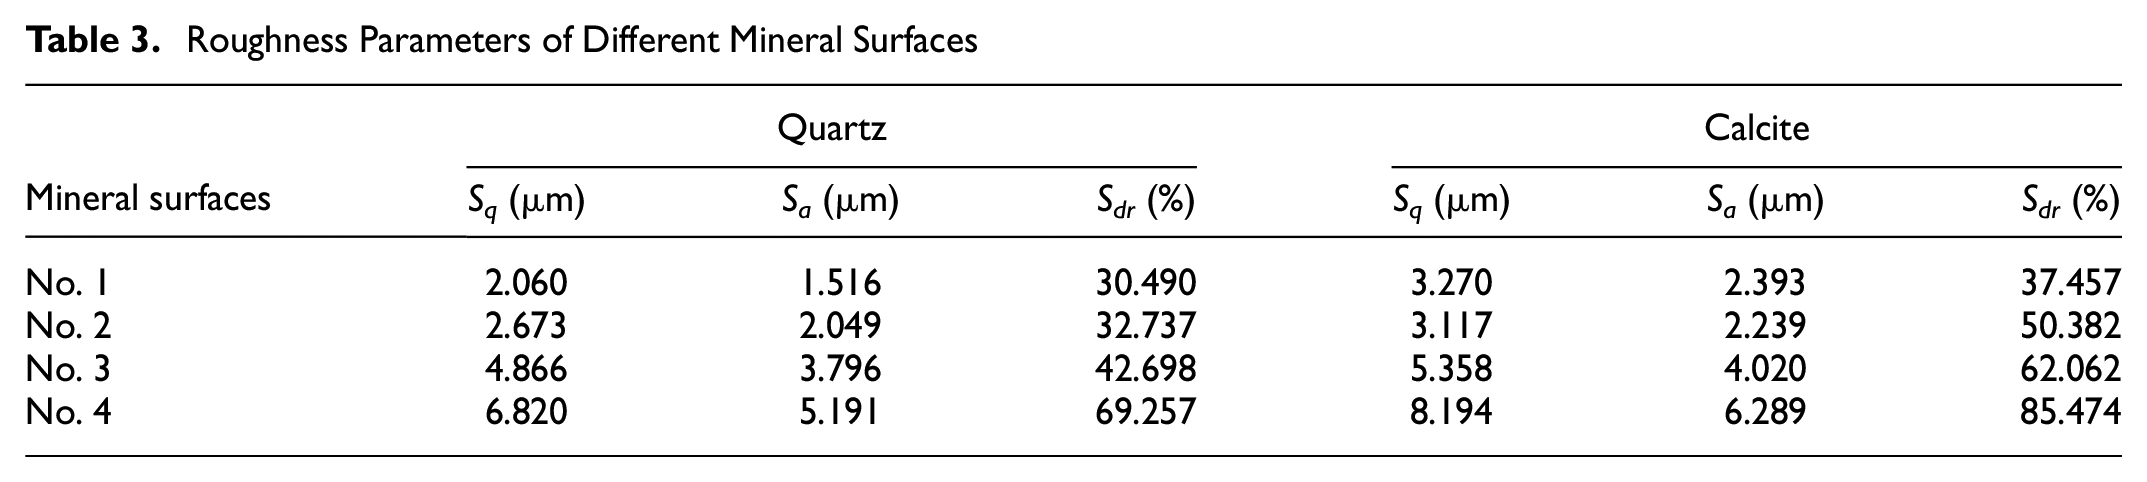
Surface roughness can be characterized by a set of roughness parameters. Table 2 presents some common roughness parameters that have been defined to describe surface topography ( 19 – 22 ). Sp and Sv are the maximum height of the peaks and the maximum depth of the valleys, respectively. Rz gives the absolute height (the peak to valley value). Sa defines an arithmetic average height of the surface. These amplitude parameters characterize the amplitude of the topography features but cannot reveal their spatial distribution. Instead, the root mean square roughness (Sq) is a statistical moment of the spatial distribution of height that gives the standard deviation of height. Sq has been the most widely used roughness parameter because it provides a better roughness description. Sdr is a ratio between the interfacial and projected areas, which quantifies the additional surface area contributed by the roughness. The surface area ratio is particularly useful in wettability characterization as it can be utilized to calculate the roughness ratio (r) that will be discussed in the next section.
Roughness Parameters Defined to Describe Surface Topography
The surface roughness of mineral specimens was examined using the topography module of the optical tensiometer. The digital 2D and 3D surface representations of a sample are illustrated in Figure 2. The optical image of each surface with a certain roughness can be obtained by the measurements. Figure 3 shows the digital surface representations with four different roughness levels of quartz and calcite, respectively. These optical images can clearly describe the surface topography. It should be noted that the size of mineral surface morphology ranges from −30 µm to +30 µm. Based on the topography data, the roughness parameters were estimated using the instrument’s own software. Three roughness parameters—Sq, Sa, and Sdr—of all eight mineral surfaces were summarized in Table 3. It is seen that the created four mineral surfaces for quartz and calcite exhibit significant differences in the roughness with the ranking of No. 1 < No. 2 < No. 3 < No. 4. Therefore, the surface roughness of quartz and calcite at the microscale can be well measured and characterized using the optical tensiometer.
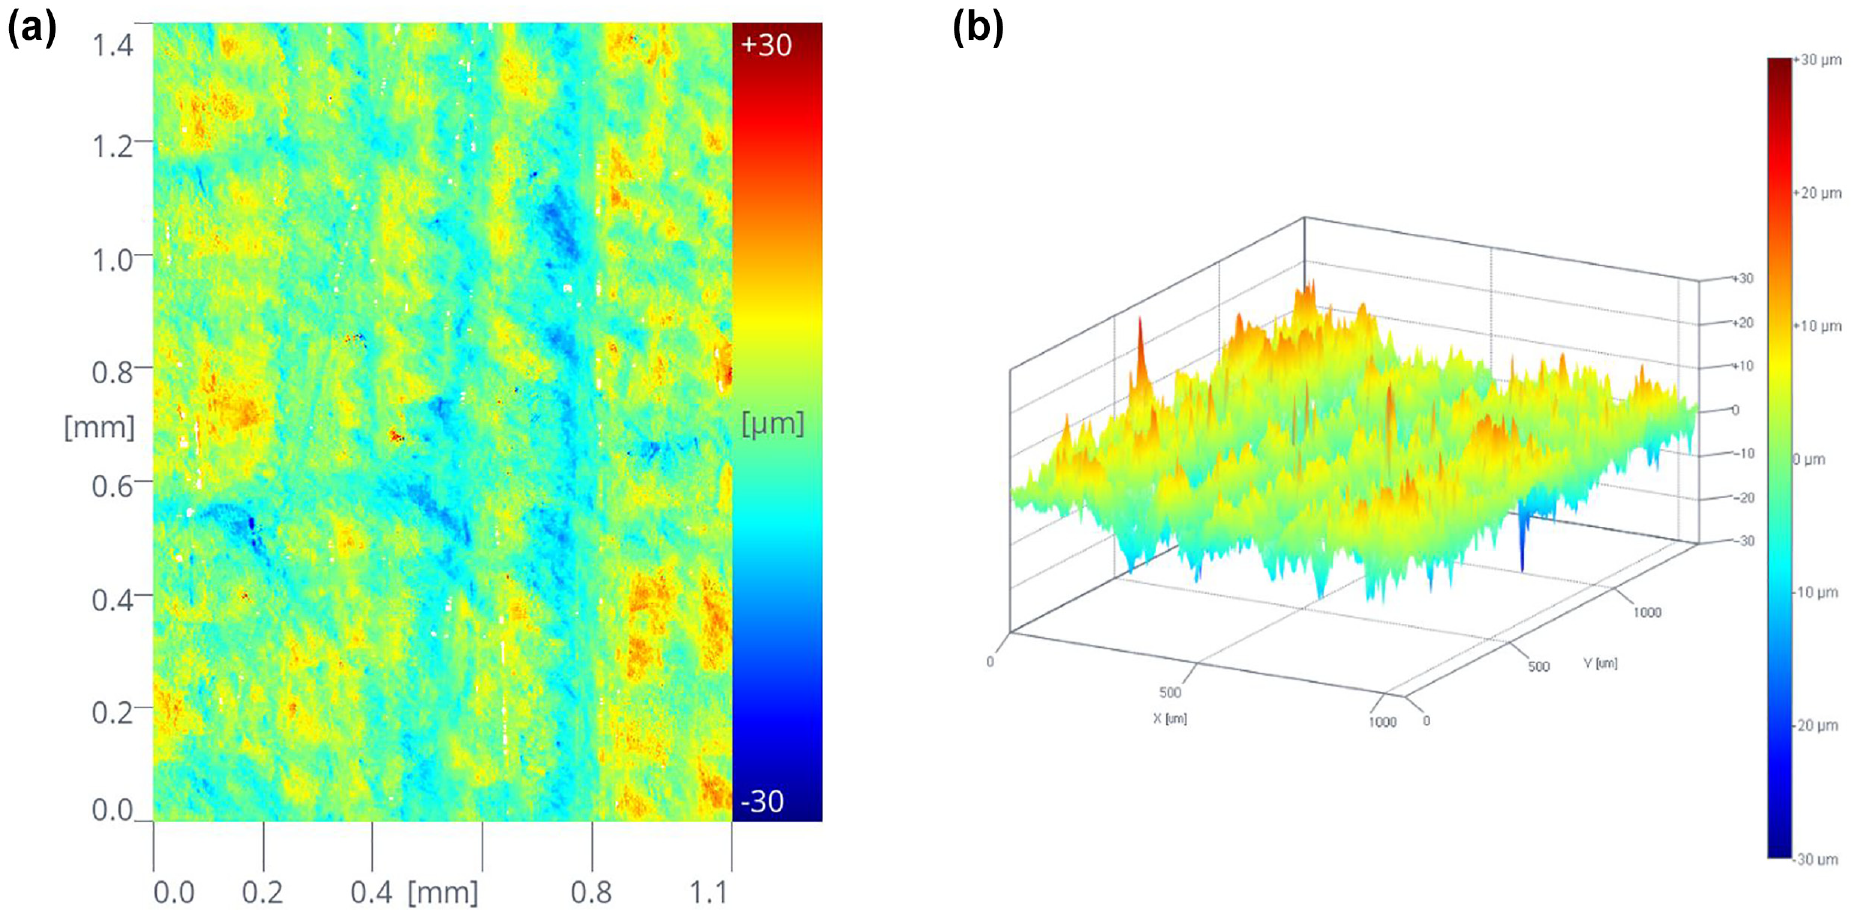
Typical optical images for surface roughness measurement of a mineral specimen: (a) topography 2D and (b) topography 3D.
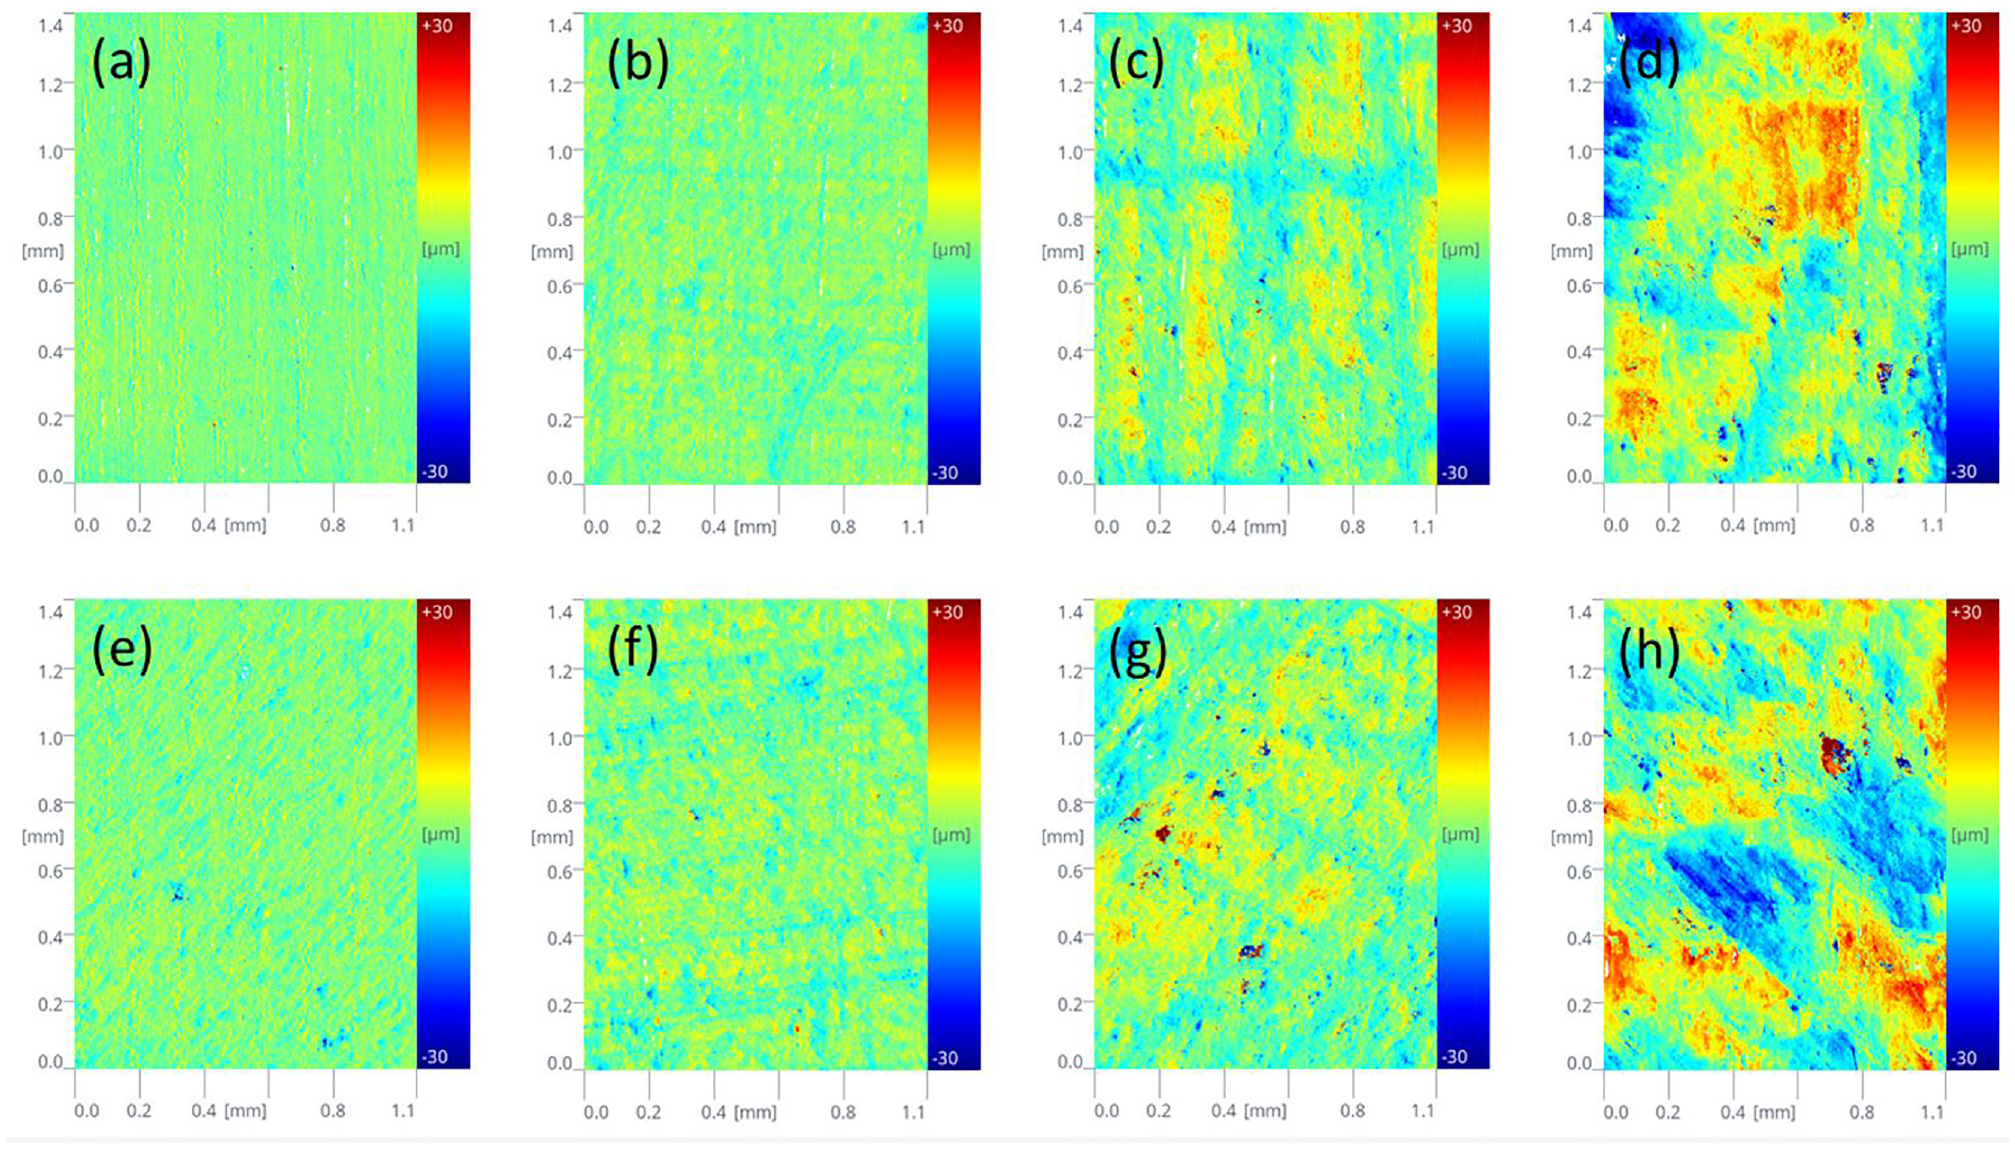
Topography 2D images of mineral surfaces with different roughness: (a) quartz No. 1, (b) quartz No. 2, (c) quartz No. 3, (d) quartz No. 4, (e) calcite No. 1, (f) calcite No. 2, (g) calcite No. 3, and (h) calcite No. 4.
Roughness Parameters of Different Mineral Surfaces
Effect of Surface Roughness on Contact Angle
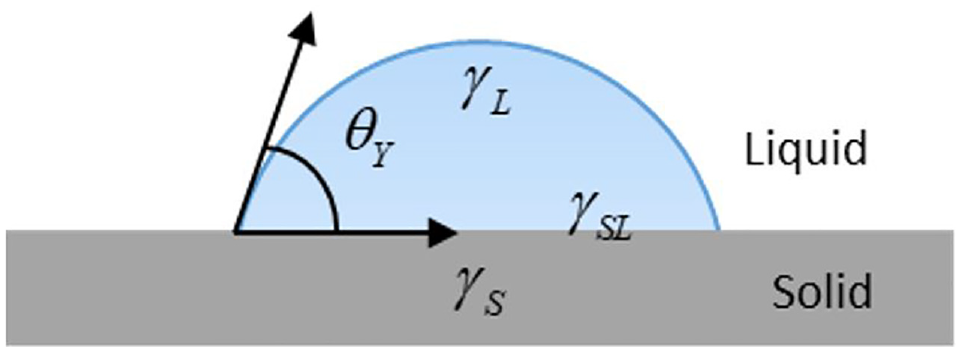
A liquid drop can spread on a solid surface to cover up to a certain area because of the intermolecular interactions between the solid and the liquid. The wetting interfacial behavior is usually improved by optimizing the wettability that is defined as the affinity of a solid surface with respect to a given liquid. To characterize the wettability of a solid surface, the contact angle constructed between three phases—that is, liquid, solid, and gas—is usually used as an important parameter in wetting processing, as shown in Figure 4.
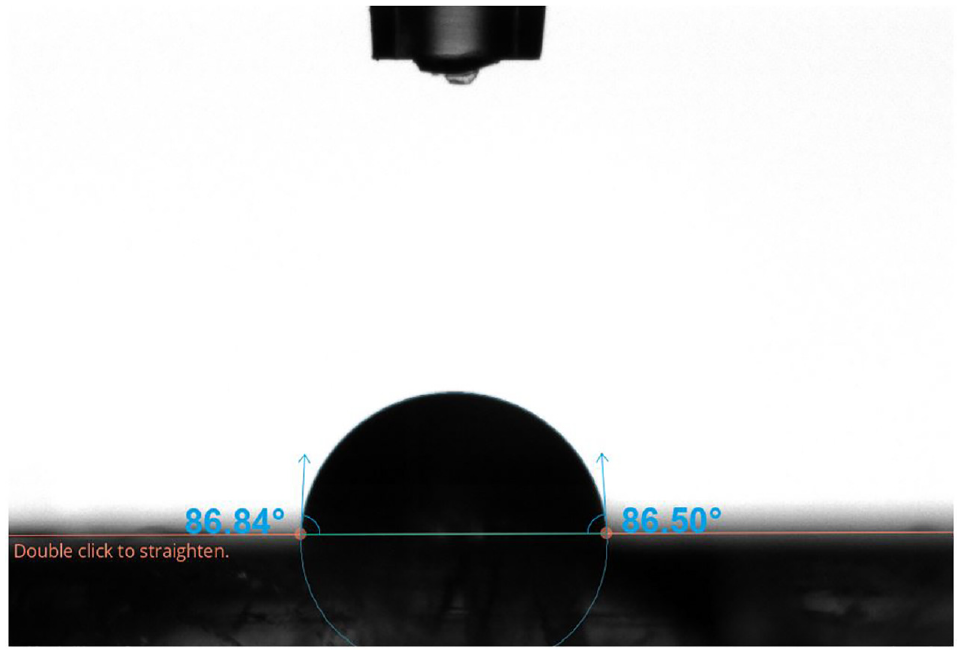
A typical contact angle between probe liquid and mineral surface.
Figure 5 shows the contact angles of three probe liquids—ethylene glycol, formamide, and distilled water—on the quartz and calcite surfaces with different roughness. It can be seen that the standard deviation (shown by a red error bar) for contact angle measurements of each probe liquid is very low, which indicates that the variability between each measurement is within an acceptable limit and the results are repeatable.
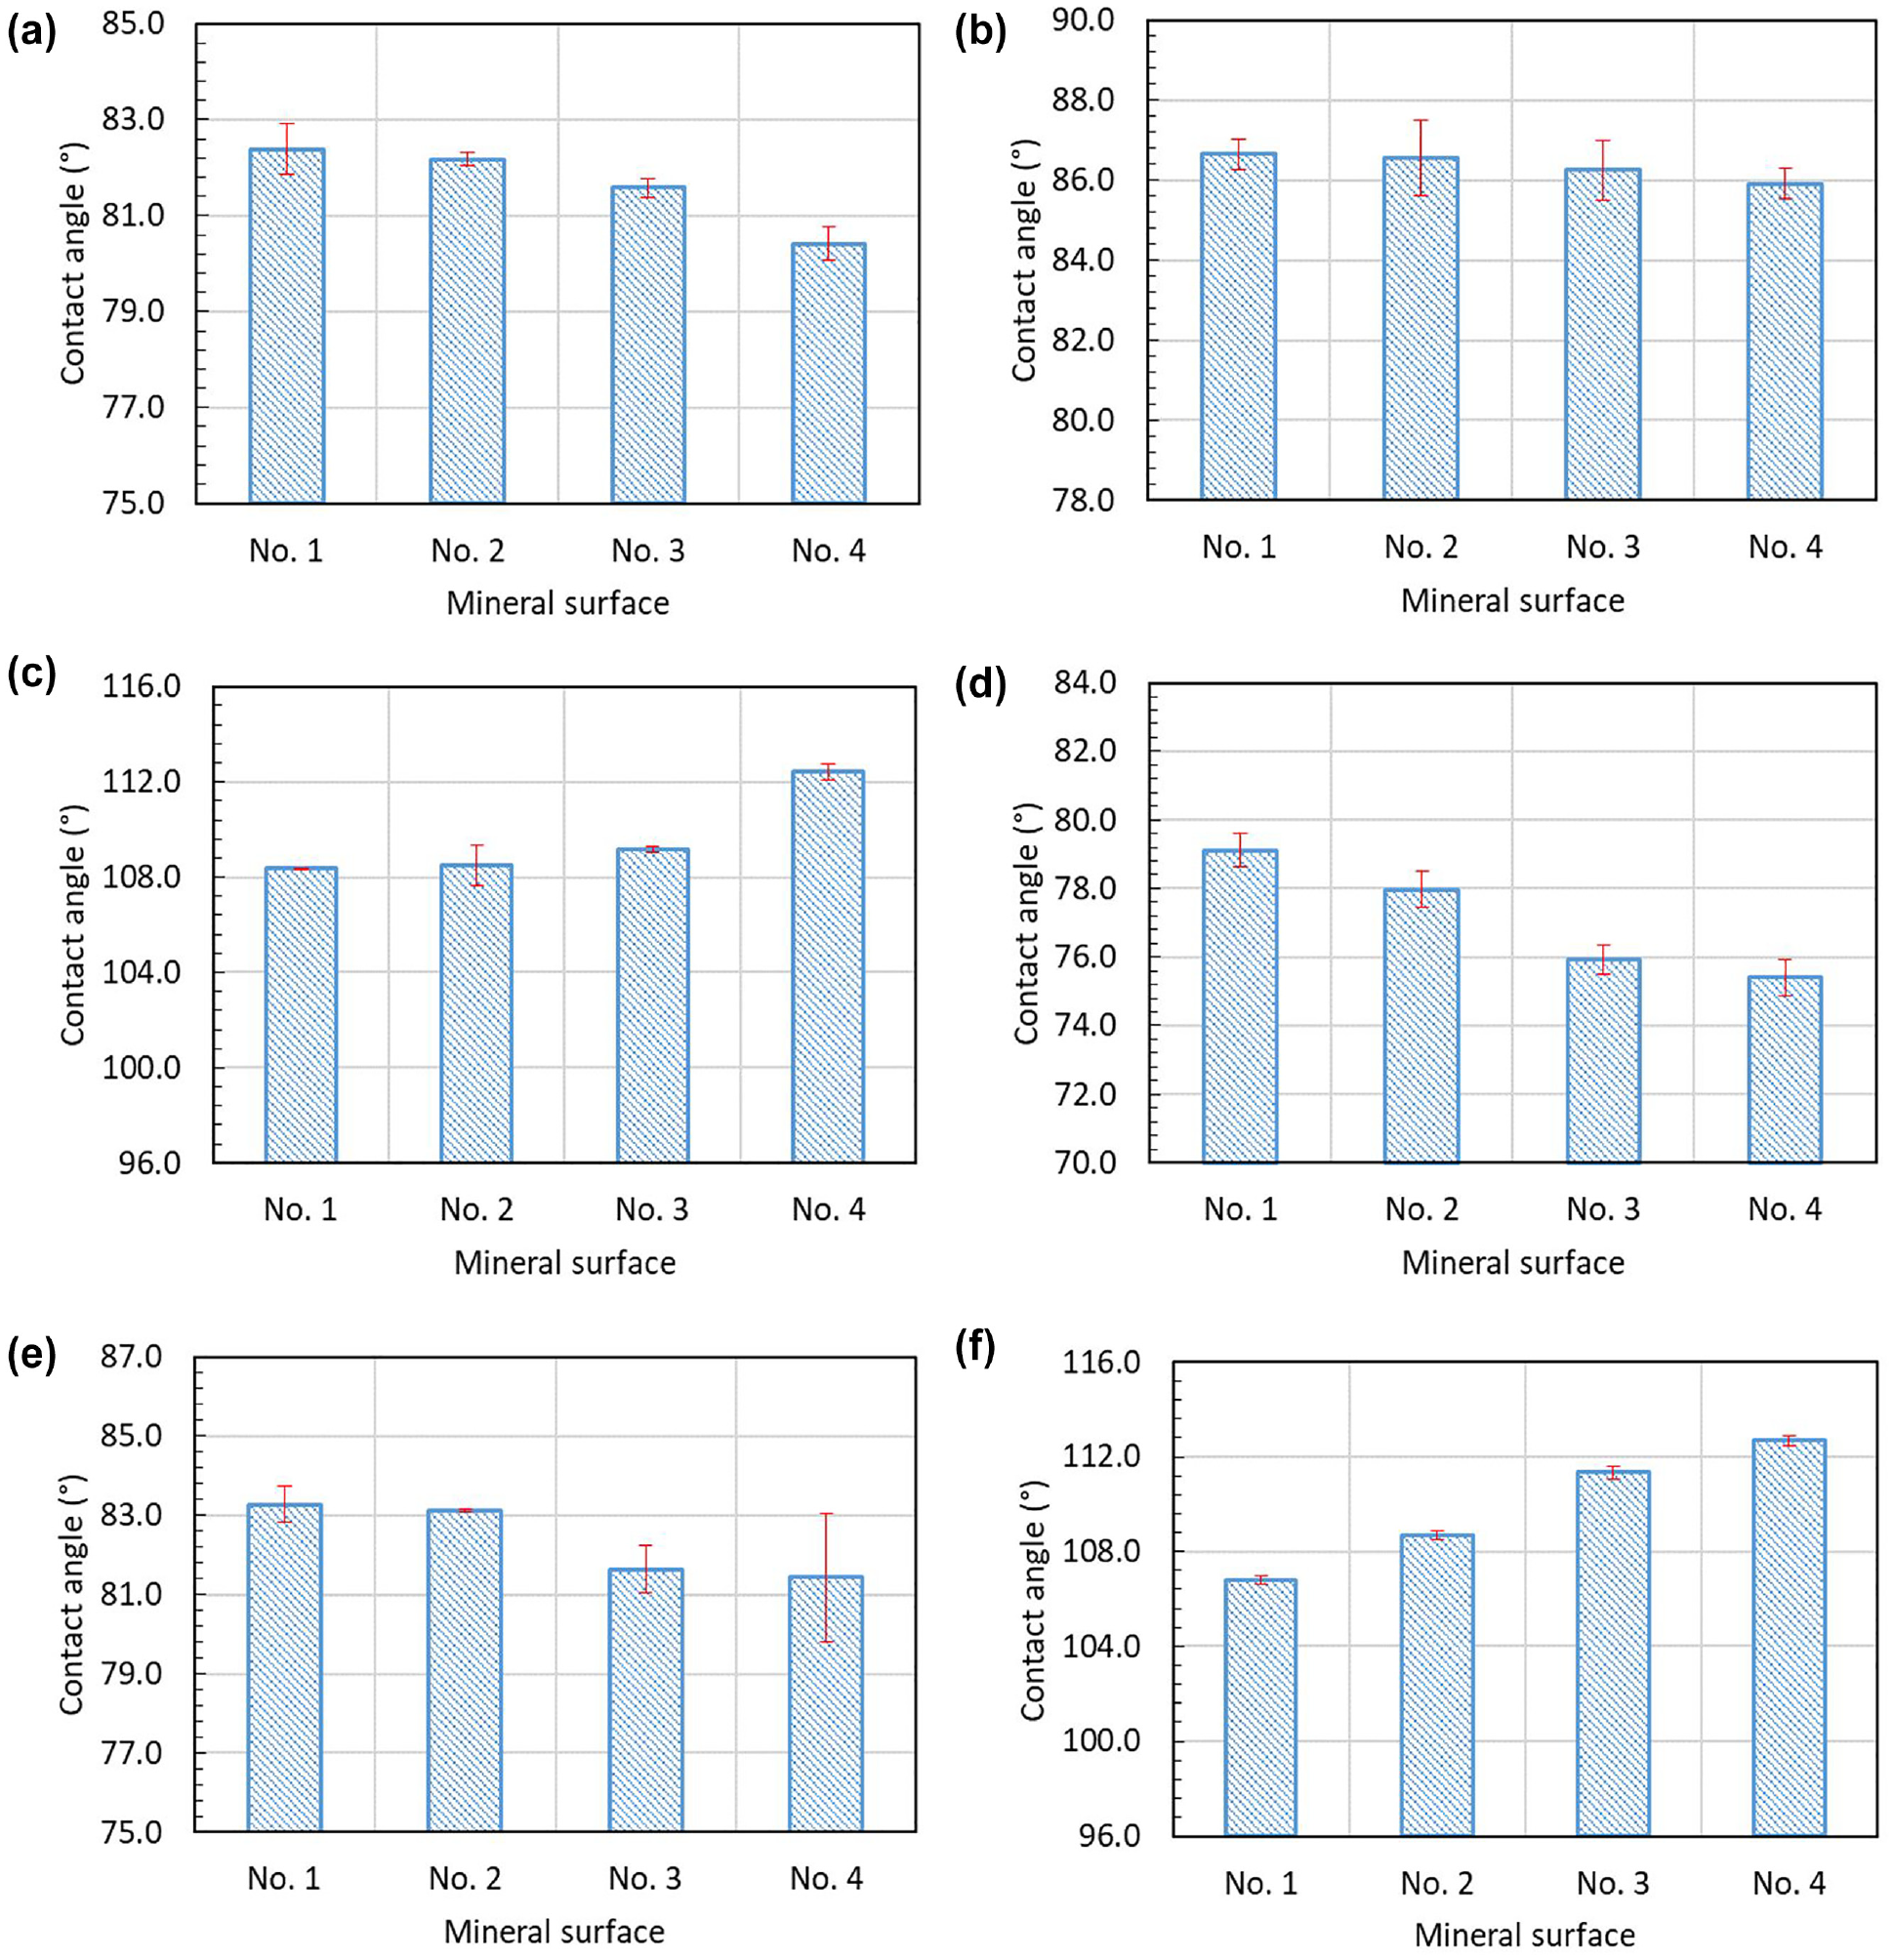
Contact angles of three probe liquids on mineral surfaces with different roughness: (a) quartz-ethylene glycol, (b) quartz-formamide, (c) quartz-distilled water, (d) calcite-ethylene glycol, (e) calcite-formamide, and (f) calcite-distilled water.
It is found from Figure 5 that, for all three probe liquids, the contact angles are different on four surfaces with different roughness. The contact angles for ethylene glycol and formamide on both the quartz and calcite surfaces are smaller than 90°, as shown in Figure 5, a to e . The contact angles decrease with the increase of the roughness described by Sdr, which means that the surface roughness reduces the contact angles of ethylene glycol and formamide. However, for distilled water, the contact angles are larger than 90° (see Figure 5, c and f ). Surface No. 4 with the largest roughness has the largest contact angles. The surface roughness causes an increase of the contact angles of distilled water. Thus, it is concluded for both quartz and calcite that the contact angle decreases with growing surface roughness when it is less than 90° and increases when it is greater than 90°. This finding is consistent with the previous studies that reported the effect of surface roughness on the contact angles for polymer and dental implant surfaces ( 23 , 24 ).
Figure 6 presents the contact angles of the liquid on the solid surfaces. The contact angle shown in Figure 6a on a smooth surface is defined as Young contact angle. The Young equation requires that the surface is unattainable smooth (ideal). However, most real surfaces are non-ideal and do not meet the condition. On a real (rough) surface, the contact angle shown in Figure 6b is the measured (apparent) contact angle. The Young and measured contact angles can deviate substantially from each other because of the surface roughness. To calculate the surface energy of the solid, the Young contact angle must be used. The relationship between the contact angles and the surface roughness has been already defined by Wenzel, as expressed in Equation 7 ( 25 ). It is assumed in Equation 7 that the liquid completely penetrates into the roughness grooves of the solid surface, as shown in Figure 6b.


where
θY = the Young contact angle,
θm = the measured (apparent) contact angle, and
r = the roughness ratio that can be calculated from the surface area ratio
It can be seen from Equation 8 that the roughness ratio r = 1 is for a smooth surface and r > 1 for a rough one.
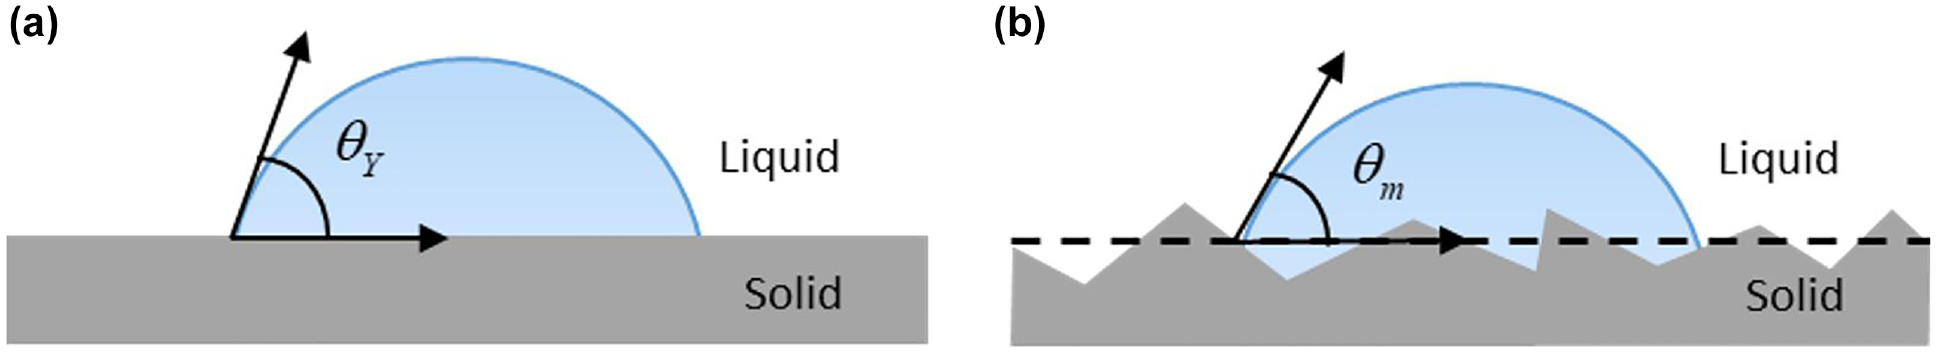
Definition of contact angles: (a) contact angle on ideal surface (Young contact angle) and (b) apparent or measured contact angle on rough (Wenzel) surface.
The Wenzel equation (Equation 7) is used in this study to correct the measured contact angle based on the roughness ratio, which is valid as the drop size of the liquid is sufficiently large compared with the roughness scale. Figure 7 shows the corrected contact angles of three probe liquids on the quartz and calcite surfaces with different roughness. To compare the contact angle values before and after correction, the uncorrected contact angles are also presented in Figure 7. It can be found from Figure 7 that, for all three probe liquids, the corrected contact angle values are nearly the same on four surfaces with different roughness, which represent the real contact angle without the effect of surface roughness. The corrected contact angles of ethylene glycol and formamide are larger than their uncorrected contact angles (see Figure 7, a to e ). However, the corrected contact angles of distilled water are smaller than their uncorrected contact angles, as shown in Figure 7, e and f . The difference between the uncorrected and corrected contact angles increases with the increase of the roughness. Their difference is largest on surface No. 4 because of the largest roughness. In conclusion, the contact angles corrected by the Wenzel equation can remove the effect of surface roughness and thus represent the real contact angles on the quartz and calcite surfaces. The Wenzel-corrected contact angles have been used to investigate cell adhesion to biomaterial surfaces and the wettability of paper sheets ( 22 , 26 ).
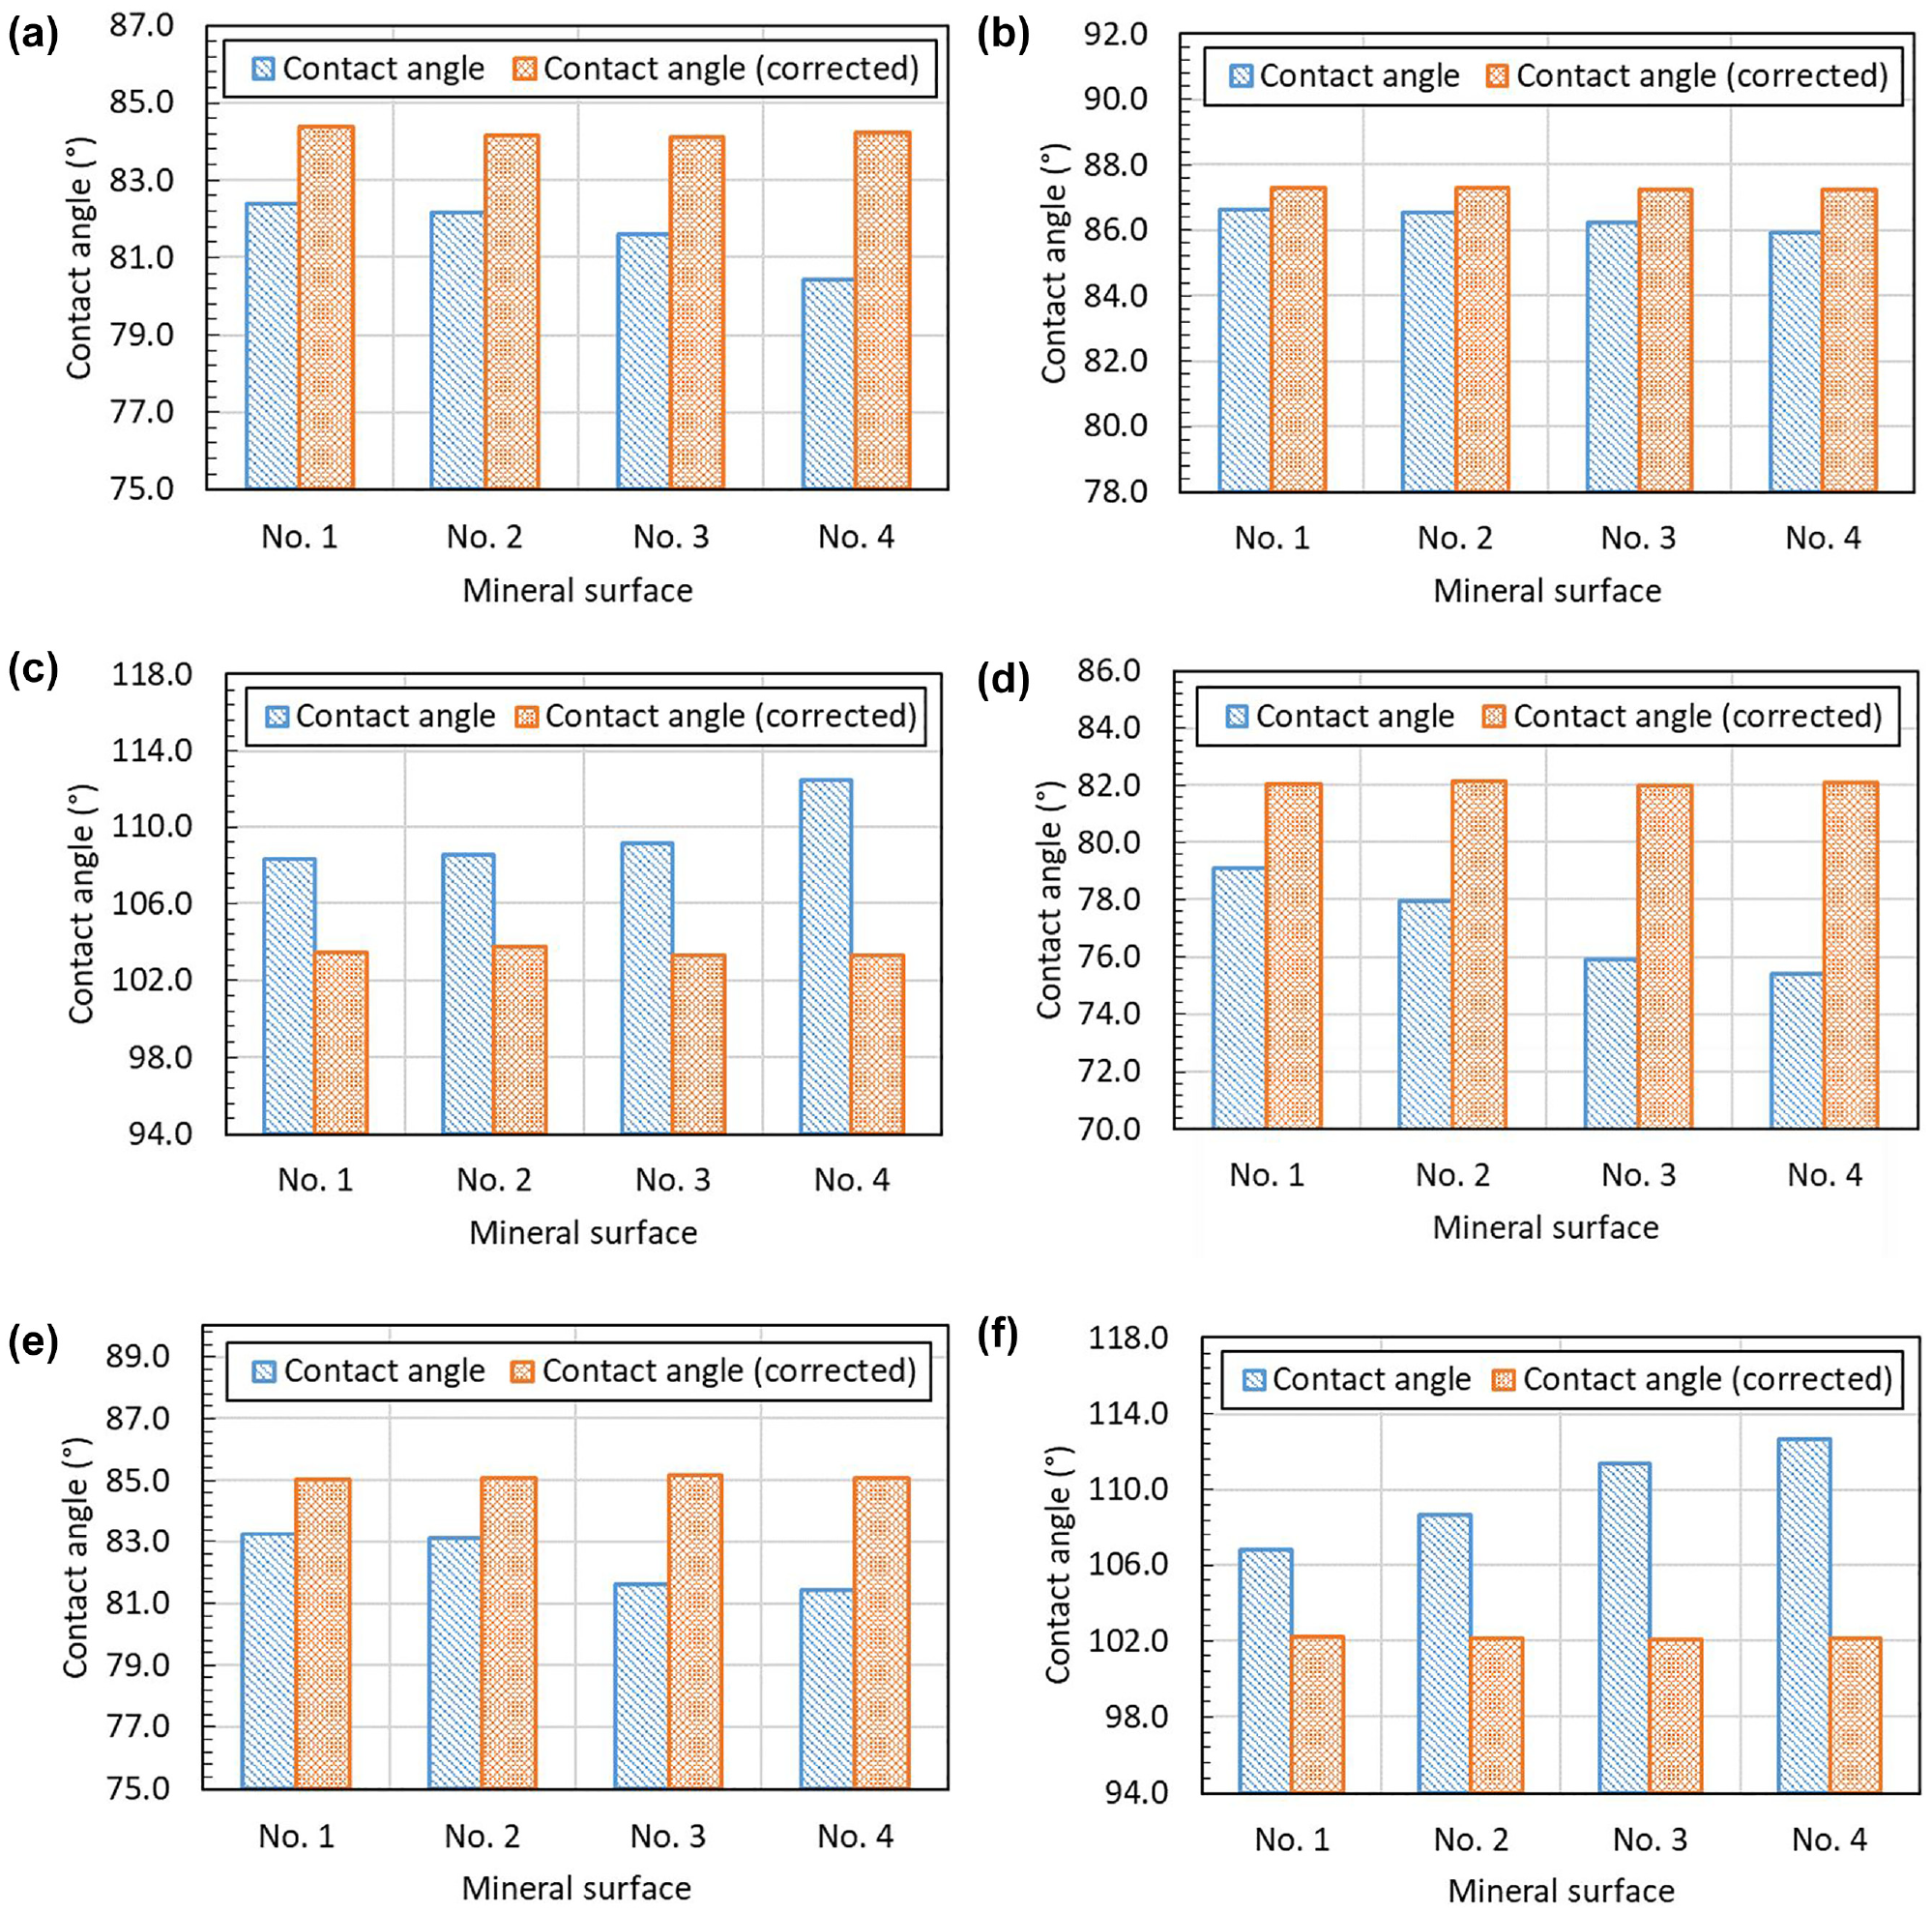
Uncorrected and corrected contact angles on mineral surfaces with different roughness: (a) quartz-ethylene glycol, (b) quartz-formamide, (c) quartz-distilled water, (d) calcite-ethylene glycol, (e) calcite-formamide, and (f) calcite-distilled water.
Surface Energy Calculation
The contact angle between the liquid and solid is intimately related to their surface energy. Young defined the relationship between surface energy and contact angle, as shown in Equation 9 ( 27 ). Figure 8 presents the contact angle between a liquid drop and a solid surface with three variables of Young’s equation. It is important to notice that the contact angle is the Young contact angle. The Young equation assumes that the solid surface is homogenous and topographically smooth ( 28 ). A surface that meets the assumption is referred to as an “ideal surface,” as shown in Figure 6a. However, most real (practical) surfaces do not meet the requirement. The contact angle on such non-ideal surfaces is referred to as the “apparent contact angle,” as shown in Figure 6b. To accurately calculate surface energy based on the measured contact angles on a rough surface, the Young contact angles must be firstly estimated through Equation 7, as pointed out by Morra, Della Volpe and Siboni ( 29 ).

where
Contact angle between a liquid drop and a solid surface.
Based on the Young equation (Equation 9), the contact angle is widely used to determine the surface energy of the solid, which is a preferred method since it allows the analysis of the material surface properties at its exact surface (
18
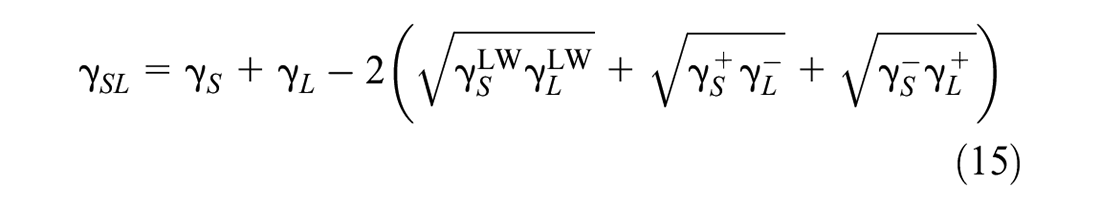
). Surface energy is defined as the work required to form a unit area of new surface in the bulk of a material. According to the Good-van Oss-Chaudhury (GvOC) theory (i.e., the acid-base theory), the surface energy (


Similarly, the interfacial energy (


where
Based on Equations 10, 11, 13, and 14, Equation 12 is rewritten as
By combining Equations 9 and 15, the Young-Dupre equation is obtained, as given in Equation 16:
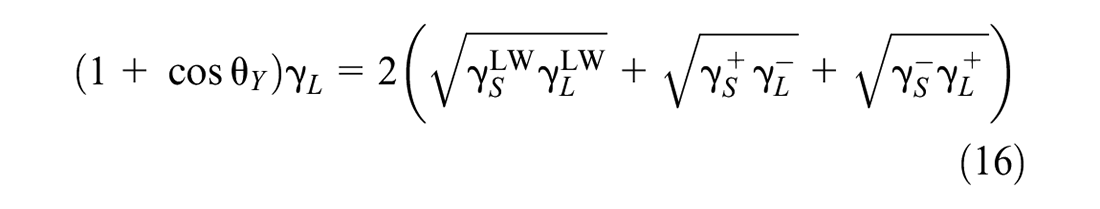
The Young-Dupre equation (Equation 16) is employed to determine the surface energy components (i.e.,
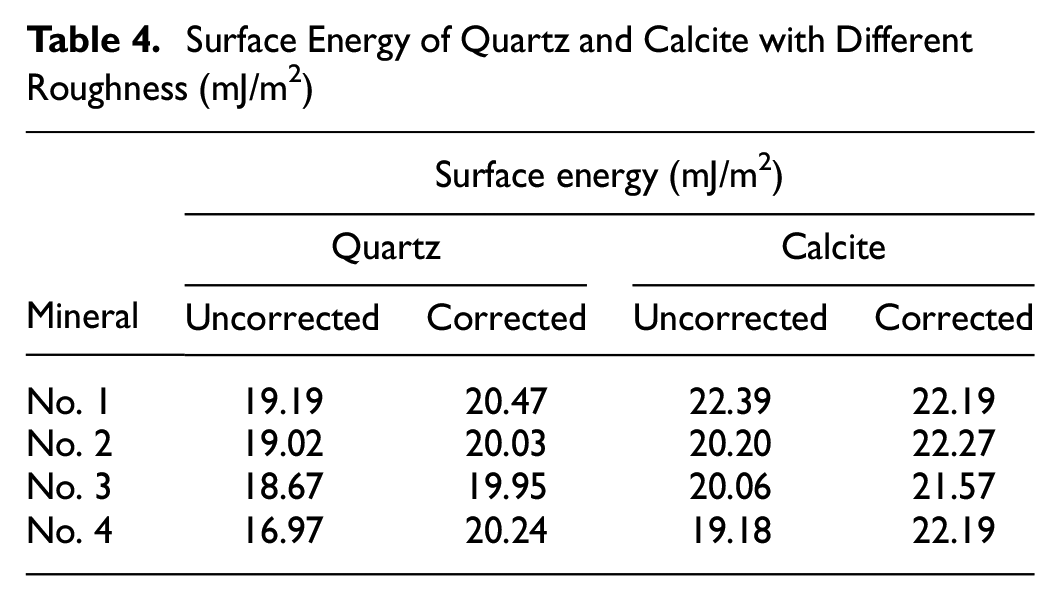
Surface Energy of Quartz and Calcite with Different Roughness (mJ/m2)
Effect of Surface Roughness on Surface Energy Calculation
The uncorrected and corrected surface energy of quartz and calcite with different roughness are illustrated in Figure 9. The effect of surface roughness on the surface energy calculation of the minerals is analyzed to reveal the relationship between surface roughness and surface energy calculation. The results of Figure 9 show that the surface roughness has a significant influence on the uncorrected surface energy for both quartz and calcite. It can be observed that the calculated values of the uncorrected surface energy decrease with an increase in the surface roughness. This finding agrees well with a previous study showing the surface energy of the hydrophobic material decreased as the surface roughness increased ( 33 ). Thus, it can be concluded that the surface energy is underestimated by the measured (apparent) contact angle in the presence of roughness on the mineral surfaces at the microscale.
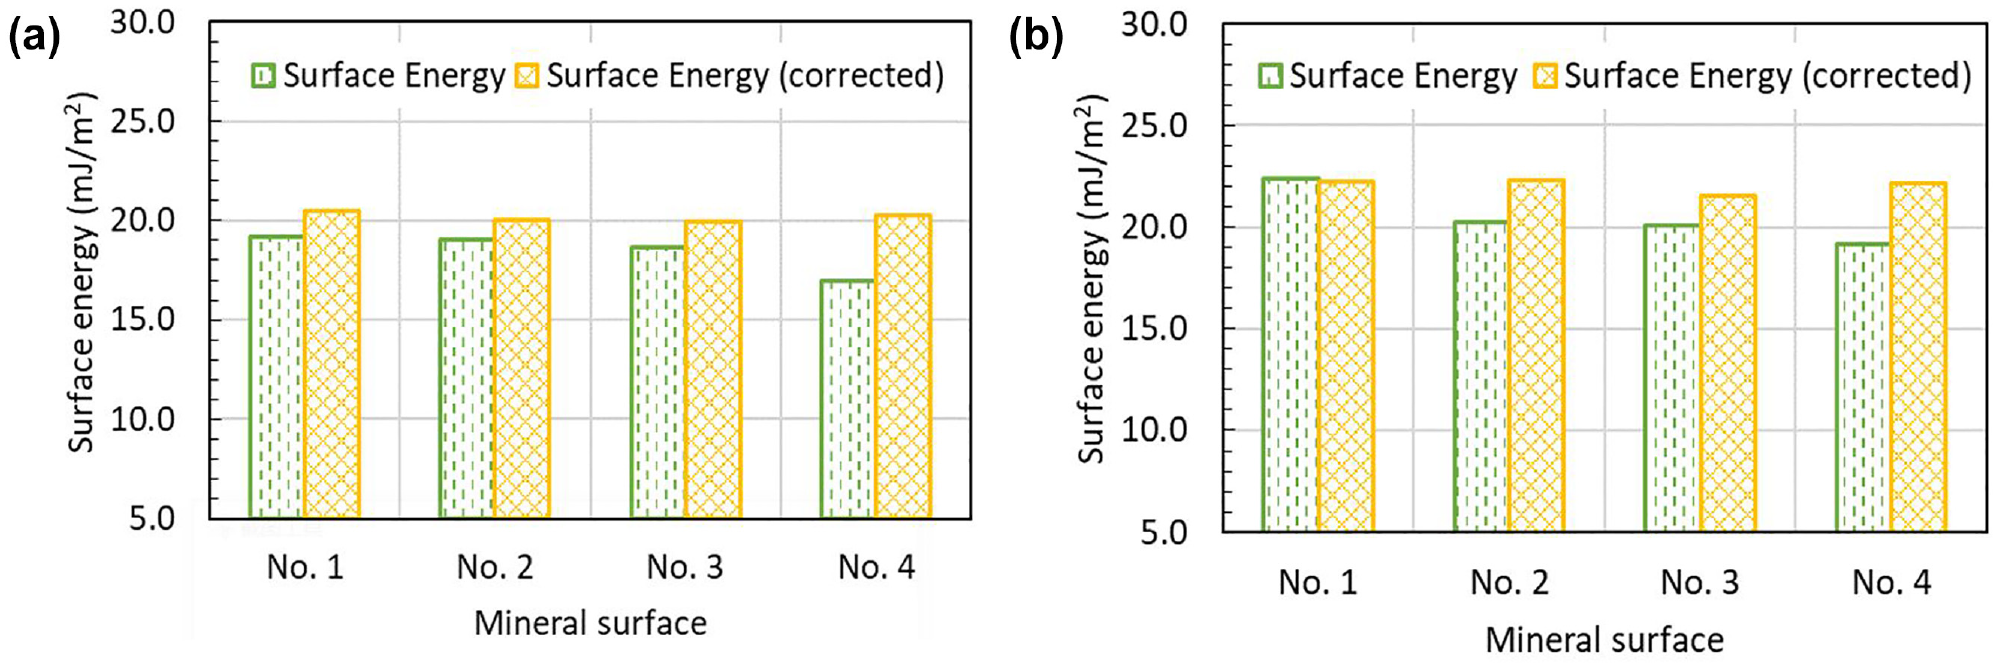
Uncorrected and corrected surface energy of minerals with different surface roughness: (a) quartz and (b) calcite.
However, it is also seen from Figure 9 that the values of the corrected surface energy are nearly the same for different surface roughness, which implies that the corrected surface energy has successfully removed the effect of the surface roughness. It is realized that surface energy is a fundamental material property that does not change with an increase/decrease in surface roughness. Therefore, the corrected surface energy based on the Wenzel equation must be applied to represent the real surface energy of materials.
As shown in Figure 9, calcite has a larger value of the corrected surface energy than quartz, which indicates that calcite can lead to better interfacial adhesion with bitumen. This finding can be supported by the surface energy data of aggregates in the literature that reported that the surface energy (31.3 mJ/m2) of limestone with calcite as its main component was larger than that (19.3 mJ/m2) of granite (in which quartz is the major component) ( 9 ). It is noted that there is a slight discrepancy between the measured values and the literature data. This is because granite and limestone also contain a small amount of other minerals such as albite, feldspar, and dolomite.
It is also noted from Figure 9 that the corrected surface energy values of quartz and calcite are close to each other. Surface energy values for mineral materials reported in the literature show a very broad variation ( 34 ). The variation can be caused by many factors such as chemical composition, crystal structure, and surface morphology. Therefore, it is possible (acceptable) that similar surface energy values are obtained for both quartz and calcite.
Conclusions and Recommendation
In this study, the relationship between surface roughness and surface energy of the aggregate minerals was investigated using an optical tensiometer with a 3D topography module. The quartz and calcite specimens with four levels of roughness were prepared and their surface roughness was evaluated using three roughness parameters. An SD method was used to measure the contact angle and the surface energy of the minerals with different roughness. The effect of surface roughness on the contact angle and the surface energy were then analyzed. The main conclusions can be drawn from this study are:
The contact angle for both quartz and calcite decreases with growing surface roughness when it is less than 90° and increases when it is greater than 90°.
The contact angle corrected by the Wenzel equation can remove the effect of surface roughness and thus represent the Young contact angle on the quartz and calcite surfaces.
The surface energy of quartz and calcite would be underestimated if using the measured (apparent) contact angle in the presence of roughness on the mineral surfaces at the microscale.
The corrected surface energy based on the Wenzel equation must be applied to represent the real surface energy of quartz and calcite.
In this study, the traditional SD method was improved through the developed quantitative relationship between surface roughness and surface energy and the novel laboratory test method that can combine topography and contact angle measurements. In future studies, more minerals will be tested to determine the real surface energy of aggregates composed of various minerals. Furthermore, the corrected surface energy will be used to evaluate the adhesion and debonding behaviors of the aggregates with bitumen and to screen appropriate aggregates that can improve the durability of asphalt mixtures.
Footnotes
Author Contributions
The authors confirm contribution to the paper as follows: study conception and design: Y. Zhang; data collection: Y. Gao; analysis and interpretation of results: Y. Gao, X. Liu, S. Ren, Y. Zhang, Y. Li; draft manuscript preparation: Y. Gao. All authors reviewed the results and approved the final version of the manuscript.
Declaration of Conflicting Interests
The author(s) declared no potential conflicts of interest with respect to the research, authorship, and/or publication of this article.
Funding
The author(s) disclosed receipt of the following financial support for the research, authorship, and/or publication of this article: This work is part of a project that has received funding from the European Union’s Horizon 2020 research and innovation program under the Marie Skłodowska-Curie grant agreement No. 101030767 and the Fundamental Research Funds for the Central Universities under Grant No. 4021002203.