
Abstract
Agent-based simulations are powerful tools for simulating emergent mobility modes, but they often require significant memory and computing power. To address this issue, researchers have previously used sampling techniques, where only a fraction of agents are explicitly simulated while others are simulated through teleportation. However, recent studies have highlighted the challenges of scaling ride-pooling simulations because of their reliance on demand density, which does not scale linearly. In this study, we introduce a new methodology for simulating dynamic ride-pooling services called flow-inflated selective sampling (FISS). Unlike previous approaches, FISS considers all agents but—for selected modes—only explicitly simulates a fraction of their trips while simulating the remaining trips through teleportation. Here, we explicitly simulate all public transport and ride-pooling trips and sample private car trips. The capacity consumption of explicitly simulated cars is scaled up to obtain realistic traffic flows, rather than adjusting the network capacity as in previous approaches. We implement FISS in the MATSim simulation environment for a large scenario in Munich, Germany, and show that it preserves traffic flows while keeping key performance indicators of ride-pooling services stable and unbiased. Mode choice decisions based on FISS also remain stable, and runtimes of the assignment can be almost halved. Overall, FISS is a simple yet effective approach that can significantly reduce the computational burden of agent-based simulations while maintaining the accuracy of the results. It can be particularly useful for simulating ride-pooling services, which can be challenging to scale because of their dependence on demand density.
Keywords
Agent-based transport models and simulations have become a common tool for researchers and practitioners to evaluate policies and obtain insights into fundamental relationships within transportation systems ( 1 , 2 ). The core idea is that traveling individuals are represented as agents that may (re-)act, plan and adapt to the environment and which are defined in a synthetic population. These agents can be modeled in great detail, including sociodemographic traits such as age and gender, among others, leading to agents showing different behaviors depending on their traits. This microscopic, individualized modeling differs from traditional macroscopic modeling approaches that deal with aggregated flows or trips between zones. While such aggregated models are usually less demanding in demand input, they have difficulty representing new forms of mobility, especially those with complex interactions between actors and those that require dynamic vehicle routing such as on-demand ride-pooling services, often called ride-sharing or ride-splitting services ( 3 ).
Vast computational resource requirements have been one of the core problems since the advent of agent-based transport simulations ( 4 ). The inclusion of many agents leads to large amounts of memory needed to retain extensive transport networks, synthetic populations, their daily plans and travel information in memory. Furthermore, excessive computing resources might be required to obtain feasible runtimes. It is not uncommon to experience runtimes that exceed many days if not weeks for large-scale simulations of populations with millions of agents. For example, Mtoi et al. ( 5 ) report a runtime of 147 h for a model application with 1.2 million agents in southeastern Florida. In another example, Llorca and Moeckel ( 6 ) report runtimes of almost 200 h for 2.9 million trips in the greater Munich metropolitan region. To combat this, methodologies and heuristics to reduce the computational burden or to increase computational efficiency have been investigated. For example, surrogate models such as PSim ( 7 ) aim to simplify parts of the simulation. In contrast, other approaches include accelerated computing on the Graphics processing unit (GPU) ( 8 ). Another commonly used solution is to model only a sample of the population while reducing the capacity of the transportation system in space and flow capacity accordingly.
However, downscaling the population may cause biases in the simulation results and increased uncertainty in the results ( 9 ). Previous studies showed that at least 10% to 25% of the entire population must be simulated to obtain valid car traffic results ( 10 ). For ride-pooling systems, where agents request a ride in a vehicle which also picks up and drops off other agents along the route, downscaling is even more problematic because the probability of pooling multiple trips in a single vehicle decreases with lower demand density ( 11 ). Any downscaling of the population results in a lower probability of pooling and distorts the results of the system. Given the inappropriateness of ordinary scaling, ride-pooling simulations, which have become of increasing interest in recent years, become very time-consuming, especially in large-scale systems.
We present an approach to address this issue by introducing a trip sampling approach instead of population sampling that simulates 100% of all ride-pooling trips, but scales down the explicit simulation of car trips. In this way, valid simulation results for all travel modes may be reached while computation time is reduced. The approach is exemplified through a simulation of a 100% population of the city of Munich, Germany. We verify whether the simulation runtime can be reduced and how well the new approach can emulate a classical 100% example simulation. We validate whether the entire traffic system and in particular the ride-pooling system is accurately simulated.
The paper is structured as follows. The next section continues with a literature review of studies that address the issue of population scaling in agent-based models and introduces the contributions of our approach. The methodology section provides an overview of the simulation framework, introduces our flow-inflated selective sampling approach and outlines the evaluation metrics. The data preparation and scenario setup section introduces the study area, the simulation model and its configuration. The results section shows the key performance indicators of the overall transport system and the ride-pooling system in a scenario with and without the new approach. Finally, the discussion section wraps up the paper, discusses limitations and future applications of the new approach.
Literature Review
Population sampling is a common approach to reduce runtimes of large-scale transport simulations. We present multiple simulation studies that previously investigated the downsampling of populations and identify research gaps that we aim to fill with our contribution.
Ben-Dor et al. ( 12 ) present a study for the Sioux Falls scenario in the multi-agent transport simulation MATSim ( 13 ) and how scaling down the car demand (and network capacities, accordingly) affects results. Specifically, they analyzed impacts on the agents’ average executed scores, trip duration, number of car departures, traffic volumes and the volume to capacity ratios. Their results suggest that some of these statistics, such as the number of car departures, are quite robust, allowing scaling down to about 5%. However, average hourly trip duration appeared to be more susceptible to bias when using scaled populations with the authors recommending not to use scale factors below 30%.
These findings have been reiterated in Ben-Dor et al. ( 10 ), including an overview of studies that utilize MATSim and the chosen scaling factors. The authors made the observation that there is a lack of studies using other agent-based transport models. In addition, they claim that the need for computationally expensive dispatching algorithms for shared autonomous vehicles (SAVs) will lead to further pressure toward downscaling simulations: “Out-of-the-box downscaling with SAV traffic may not work as the number of SAV vehicles must be reduced proportionally” ( 10 , p. 27).
Llorca and Moeckel ( 6 ) investigated the effects of population scaling on runtimes, link travel times and convergence of results for car traffic. The scenario consisted of 2.9 million car legs in the Munich region. They find that scaling car traffic not only reduces run time per iteration but—in contrast to the study of Ben-Dor et al. ( 10 )—also identify that the number of iterations required to reach convergence (i.e., user equilibrium) is reduced drastically. They conclude that a sample size of 5% may be enough to achieve realistic link travel times 50 times faster than with a 100% sample. Saprykin et al. ( 14 ) report that sample sizes of roughly 30% can capture traffic dynamics and even public transport occupancy dynamics similar to the full population. For more aggregate measures sample sizes of 5% to 10% seem acceptable.
While the aforementioned studies suggest that scaling can lead to valid results for car traffic, this assumption reportedly has been wrong for public transport or demand responsive shared modes such as on-demand ride-pooling. For public transport, one cannot easily sample the number of vehicles, as these heavily define service level and frequencies. However, having the same number of vehicles running on a downscaled network may lead to problems with unwanted congestion. A solution described by Bösch et al. ( 15 ) is to deflate the public transport vehicles to consume less road capacity and carry fewer passengers. Ben-Dor et al. ( 16 ) report that issues remain with unrealistic delays even with this solution. Bösch et al. ( 17 ) also report problems with scaling population for car sharing evaluations, as the number of required vehicles per user does not scale linearly with the population sample, biasing any operator focused analysis.
Recent on-demand shared modes usually scale well with spatio-temporal trip density ( 11 , 18 ), that is, the performance depends on many people aiming to travel in a similar direction, at a similar time. Scaling down the population reduces the density of trips and thereby reduces the likelihood of finding shareable rides, decreasing the efficiency of the system. In addition, ride-pooling vehicles are typically of small capacity, usually carrying around four to six people. In this case, a 10% population sample is already hard to analyze and interpret, as one agent represents 10 others, which would not even fit in one vehicle. In general, Saprykin et al. ( 14 ) point out that with the rising complexity of the transportation system and emerging technologies one should always consider the size of the sample. In case of electric mobility, the authors claim that only the simulation of the full population may lead to accurate predictions for the transport system and the charging infrastructure.
Kaddoura and Schlenther ( 11 ) presented a simulation experiment for two regions in Germany, in each of which the initial agent population was subsequently sampled down. They find strong non-linearities in the system and conclude that, “A linear upscaling of simulation results for a small population sample may yield an overestimation of the fleet size, operating hours and vehicle kilometers” ( 11 , p. 674). They also report factors for sampling up/down the fleet size to achieve similar rejection rates and wait times for passengers. However, the transferability of these findings to other regions and system parameters remains an open question and will also be investigated in the results section of this paper.
Saprykin et al. ( 19 ) investigated the impact of population scaling on (non-shared) on-demand taxi fleets in an agent-based simulation for Munich. Based on their results, the authors recommend simulating the full-scale population to obtain accurate spatio-temporal estimations of fleet performance. While aggregated characteristics such as customer waiting times may be reliable with sampled simulations, fleet-related indicators such as vehicle utilization and empty kilometers may be distorted. In a similar study, Kagho et al. ( 20 ) “strongly recommended to use a 100% population” (p. 305) after analyzing the impacts of scaling on a shared demand responsive transport service (i.e., ride-pooling). In particular, shared rides are difficult to analyze and are considerably biased by scaling, as the resulting lower trip density reduces the probability of pooling. Even at 75% rates, the authors find a relative bias of 35% when comparing vehicle occupancy with the results of a full population simulation.
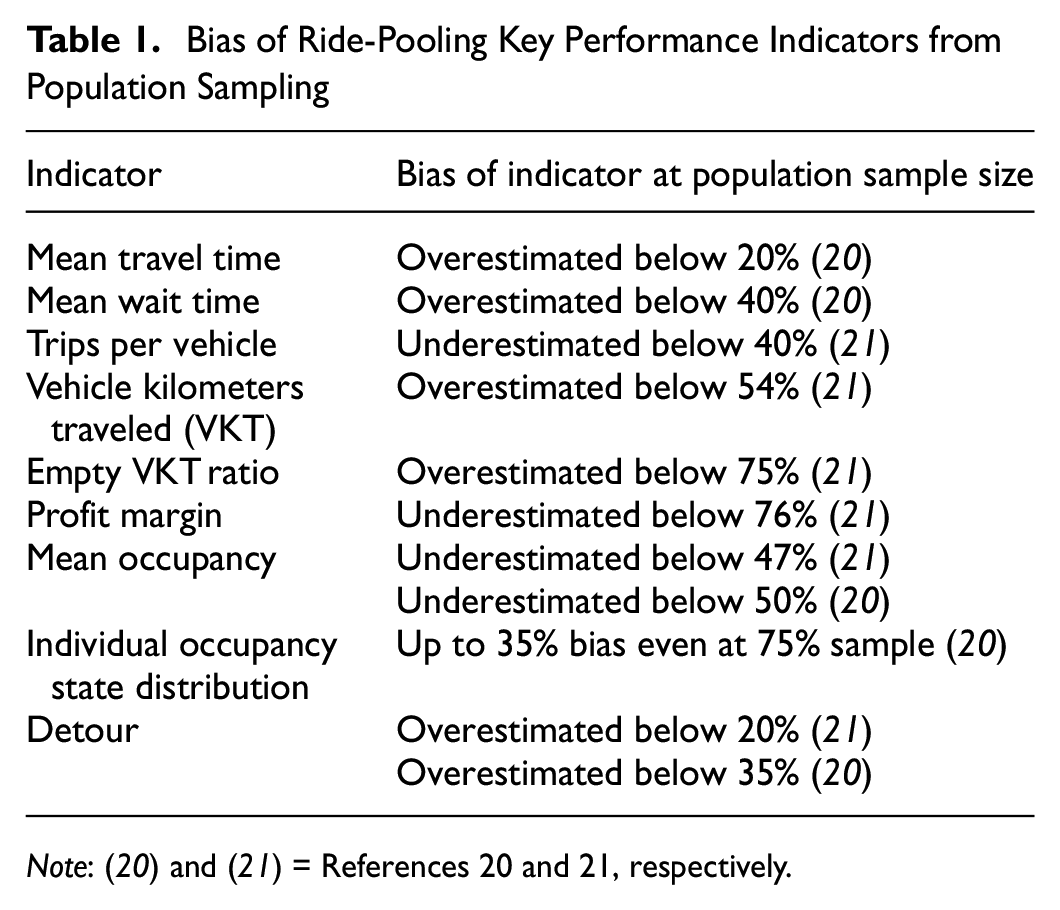
Similar results have been discussed by Kamijo et al. ( 21 ) who systematically compared different population sample sizes for the case of shared and non-shared rides. For shared rides the authors conclude that population size should be close to reality, especially for indicators such as profit margin, empty kilometers traveled and average occupancy which are biased even at larger sample rates of up to 80%. Table 1 provides an overview of over- and underestimations of key performance indicators (KPIs) for ride-pooling when populations are sampled ( 20 , 21 ). It is clearly identified that population sampling introduces a strong bias to the main ride-pooling KPIs and does not allow realistic evaluations of the system.
Bias of Ride-Pooling Key Performance Indicators from Population Sampling
Identifying such limitations of downscaling populations in previous simulation studies, our approach contributes to the literature as follows.
We introduce a novel trip sampling approach that both allows the reduction of simulation time and ensures the realistic evaluation of ride-pooling and other on-demand services.
The scenarios are validated with a large-scale simulation scenario using an extensive set of KPIs for the mobility and the ride-pooling system.
The approach is open-sourced and allows transport modelers to apply and adapt it to their specific needs ( 22 ).
Methodology
In this paper, we assess an alternative approach in which we do not scale the initial demand but keep the full agent population in the simulation. However, while every agent is allowed to adapt and make choices, we only simulate a fraction of the car trips explicitly in the actual traffic assignment to reduce computation effort. Modes of special interest, like ride-pooling, are still simulated explicitly for all trips. This proposed sampling approach is applicable to any agent-based simulation (e.g., Horni et al. [ 13 ], Bae et al. [ 23 ], Auld et al. [ 24 ]), that employs capacity constrained networks. Before presenting the new approach, we introduce the simulation framework.
Simulation Framework
To analyze this relationship and demonstrate the efficacy of our approach, we implemented it in the open source multi-agent transport simulation MATSim ( 13 ). MATSim utilizes an iterative, co-evolutionary learning approach (Figure 1) in which each agent performs a given daily plan of activities and aims to maximize their utility, expressed as their score. In general, travel time causes a negative score while activity time causes a positive score. Based on the initial demand, the actual assignment takes place during the mobility simulation (mobsim), in which explicitly simulated agents and vehicles are moved along the physical network (or not, as for teleported agents).
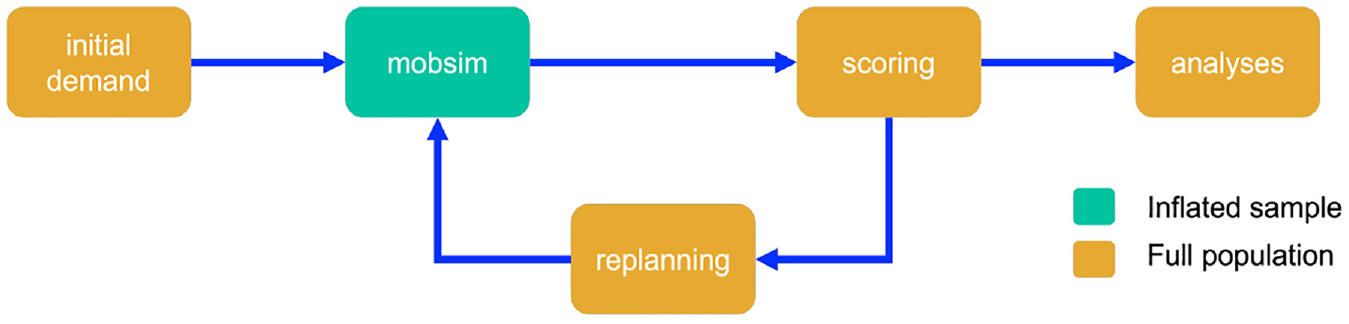
MATSim iteration cycle.
After each iteration, agents evaluate the score of their executed day (scoring) and a proportion of agents modifies their plan (replanning). Modifications can be, for instance, rerouting, mode choice, or activity location choice. With this procedure, a stochastic equilibrium is reached in which each agent optimizes its utility unilaterally.
Leveraging MATSim’s DRT (demand responsive transport) extension to simulate ride-pooling, we simulate six different modes of transportation: walk, bike, car, car passenger (ride), public transport (pt), and ride-pooling (DRT).
DRT Extension
MATSim’s DRT extension is based on Maciejewski ( 25 ) and was introduced by Bischoff et al. ( 26 ). It has been used extensively to study the impact of on-demand mobility services ( 27 – 30 ).
Incoming ride requests are handled dynamically during the simulation and assigned to available vehicles based on an insertion heuristic. Multiple travel parties may be transported (pooled) in the same vehicle as long as a maximum wait time and maximum detour is not exceeded for any of the customers. The availability of vehicles (and thus the potential vehicle assignment) is checked by the insertion heuristic every time a request is submitted. If no vehicle may transport an incoming request without violating the maximum wait time and maximum detour for any passenger, the request is rejected. If multiple vehicles may serve a request, the vehicle that imposes the least travel delay for all customers is assigned. The maximum detour contains an absolute and a relative component and is defined by

where
Next, we introduce our alternative trip sampling technique that is explicitly designed to allow a more efficient simulation of shared modes such as DRT.
Flow-Inflated Selective Sampling
We refer to the presented approach as flow-inflated selective sampling (FISS) as it only performs explicit simulation of a fraction of certain trips (i.e., car trips) while inflating these vehicles’ space/volume consumption on the network links accordingly (see Figure 2). The other trips of that mode are teleported, which is computationally more efficient than explicit simulation.
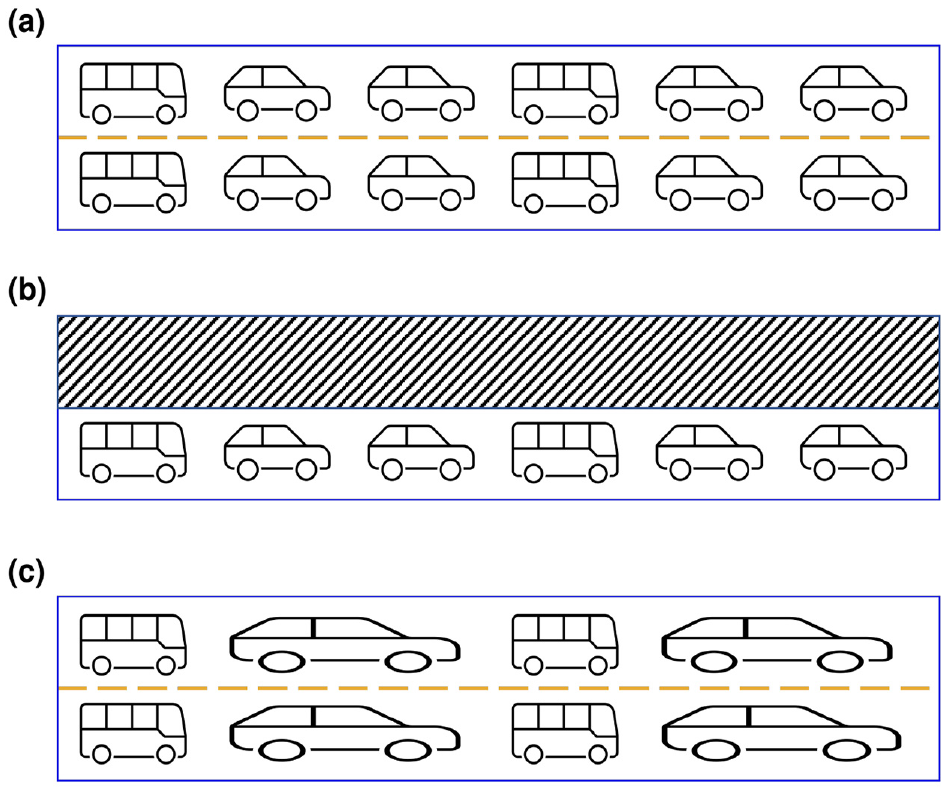
Simplistic representation of traffic flows of cars and demand responsive transport (DRT) vehicles (shown as buses). Scenario (a) shows the base case simulating 100% of the population. In scenario (b) the complete population is sampled down to 50% (including DRT vehicles). The network capacity (flow and storage) is scaled down accordingly. This corresponds to the regular downsampling used in previous studies (e.g., Llorca and Moeckel [ 6 ], Bischoff and Maciejewski [ 33 ]). Scenario (c) shows the presented approach. While DRT vehicles are simulated regularly, private cars are sampled down (50%). At the same time, their capacity consumption is inflated.
In explicitly simulated trips, vehicles are moved over all links of their route and consume a portion of the link’s flow and storage capacity on each traversal. This incremental capacity consumption affects the travel time of subsequent vehicles traversing that link if the link’s accumulated consumed capacity is approaching its limit in a given period. In contrast, agents’ trips can also be teleported and their vehicles are not moved explicitly over links, but just appear after an approximated travel time at their destination. Thus, teleported trips cannot affect a link’s congestion level and thus do not contribute to travel time delays of subsequent vehicles.
Explicitly simulating all trips requires large computing capacity but teleporting all car trips is also not a viable solution as car agents do not interfere with each other anymore and thus no network impedance through congestion is experienced. Analyzing the sweet-spot between the share of explicitly simulated and teleported trips to accelerate the simulation while preserving realistic congestion behavior is another contribution of this work.
Evaluation Metrics
To evaluate the FISS approach we are interested in
runtime reduction,
link-wise traffic volume reproduction, which corresponds to a similar overall congestion situation,
model share reproduction (when allowing agents to innovate), which is a result of 2., and
reproduction of DRT KPIs (when allowing agents to innovate), which is also a result of 2.
As KPIs for DRT we choose passengers’ mean travel time, average and 95th percentile wait time, and ride request rejection rate as proxies for customer service quality. From an operator’s perspective, we examine the overall traveled distance of DRT vehicles, mean vehicle occupancy and an efficiency metric
Vehicle occupancy describes the average number of passengers in a ride-pooling vehicle for all driving vehicles over time. It also takes empty rides into account. As we do not consider group bookings, occupancy values are lower than in real-world ride-pooling systems. The efficiency metric
(i) Mean detouring: Less detouring leads to higher efficiency. It is represented by the ratio of PKB,
(ii) Mean occupancy: Higher occupancy leads to greater efficiency. It is represented by the ratio of PKT,
(iii) Occupied kilometers: More occupied kilometers leads to greater efficiency. It is represented by the ratio of VKO to VKT,
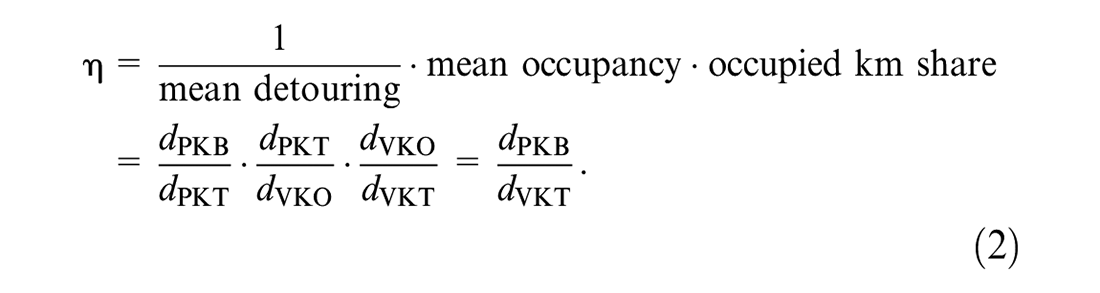
The
We also assess how our way of scaling (i.e., inflating vehicle size instead of decreasing road capacity) affects car traffic volumes. Therefore, we make use of the

where
Implementation of FISS in MATSim
We implemented the FISS approach in MATSim by making use of its teleportation feature, which is implemented by removing agents from the physical simulation on departure and re-inserting them at their destination on arrival. Figure 3 compares the complexity of an agent’s leg by (a) explicit simulation and assignment of a car along the network and by (b) teleporting the agent in MATSim’s event-based design. It becomes clear that teleporting an agent is considerably less complex as the program has to deal with fewer events that are usually further processed in other places (such as the update of average link travel times). Note that the complexity of an explicit simulation increases with the length of the routes (i.e., more links traversed) while teleportation does not.
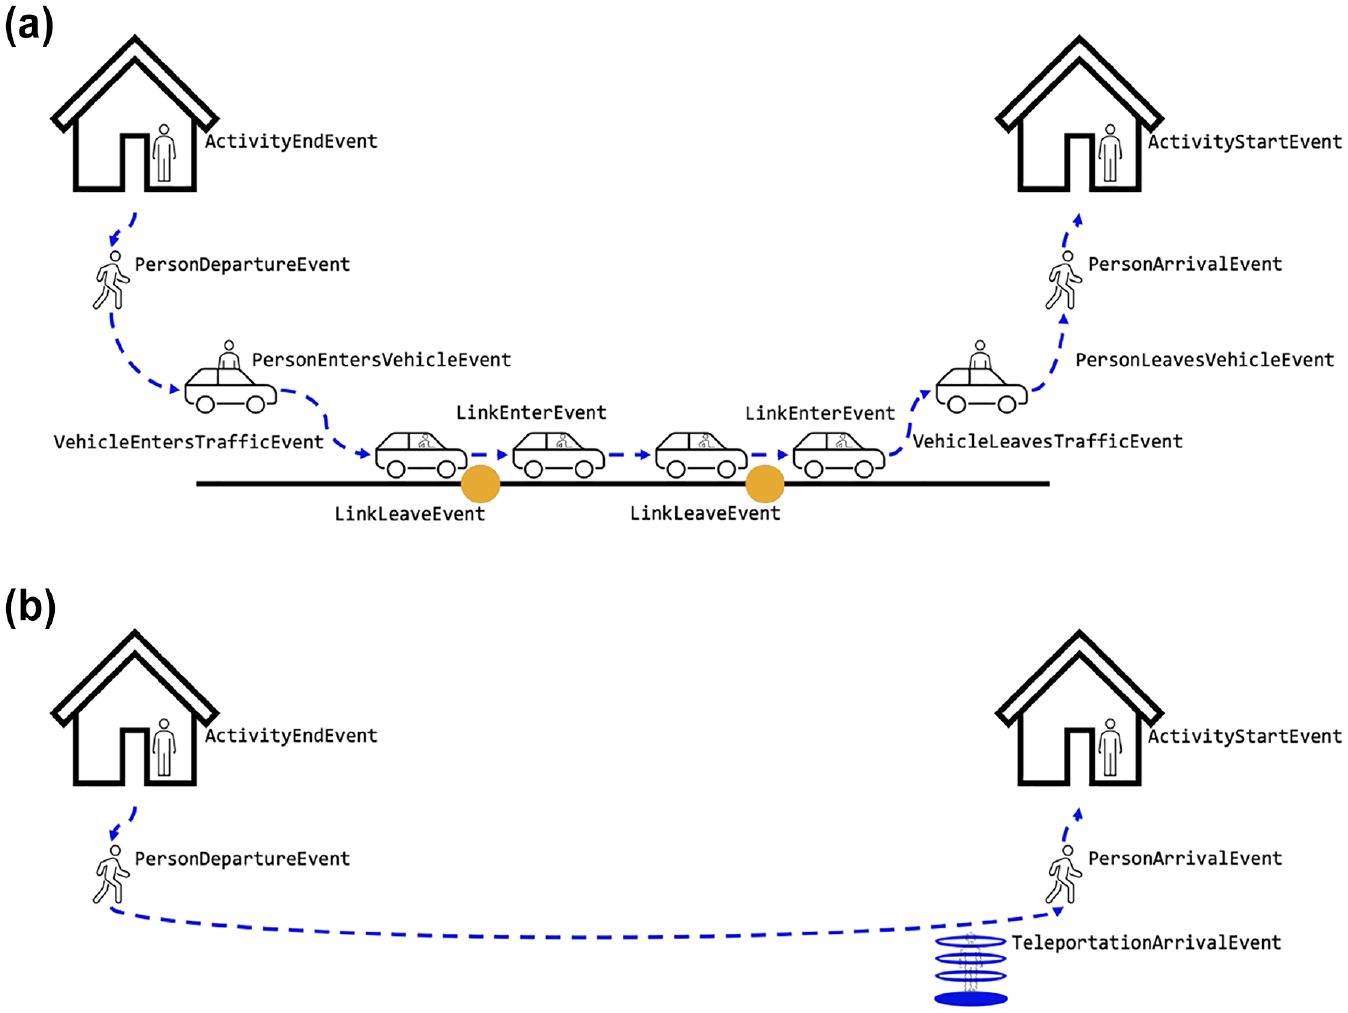
Series of events thrown for (a) an explicitly simulated car leg and (b) a teleported leg.
In the case that a car agent is selected for teleportation, we make sure not only to teleport the actual agent but also its vehicle to comply with the concept of mass conservation. This is important for the mode choice model and the generation of the agent’s choice set (i.e., an agent who drives a car to work should also be allowed to drive it back home). The arrival time of the teleported agent is based on estimated link travel times of the network route the agent selected during the previous replanning phase. By doing this, the travel time experienced by the agent is as close as possible to an explicit assignment but lags behind at most one iteration.
To correct for the reduced number of vehicles on the road, we linearly inflate private car vehicles’ capacity consumption by setting their passenger car equivalent units to
The main parameter is the FISS sample factor in the range
Figure 4 summarizes the implementation of FISS within MATSim. It becomes clear that it “wraps” around the default behavior by sampling individual agent trips on their departure. Note here that agents teleported by FISS will experience an estimated travel time based on the planned route’s observed travel time in the previous MATSim iteration. Also, since the agent might take another explicitly simulated trip at a later time during the simulation, our implementation makes sure also to teleport the agent’s vehicle to its destination. This allows mode choice behavior to respect mass conservation, that is, agents may only use vehicles for trips when it is actually available to them.
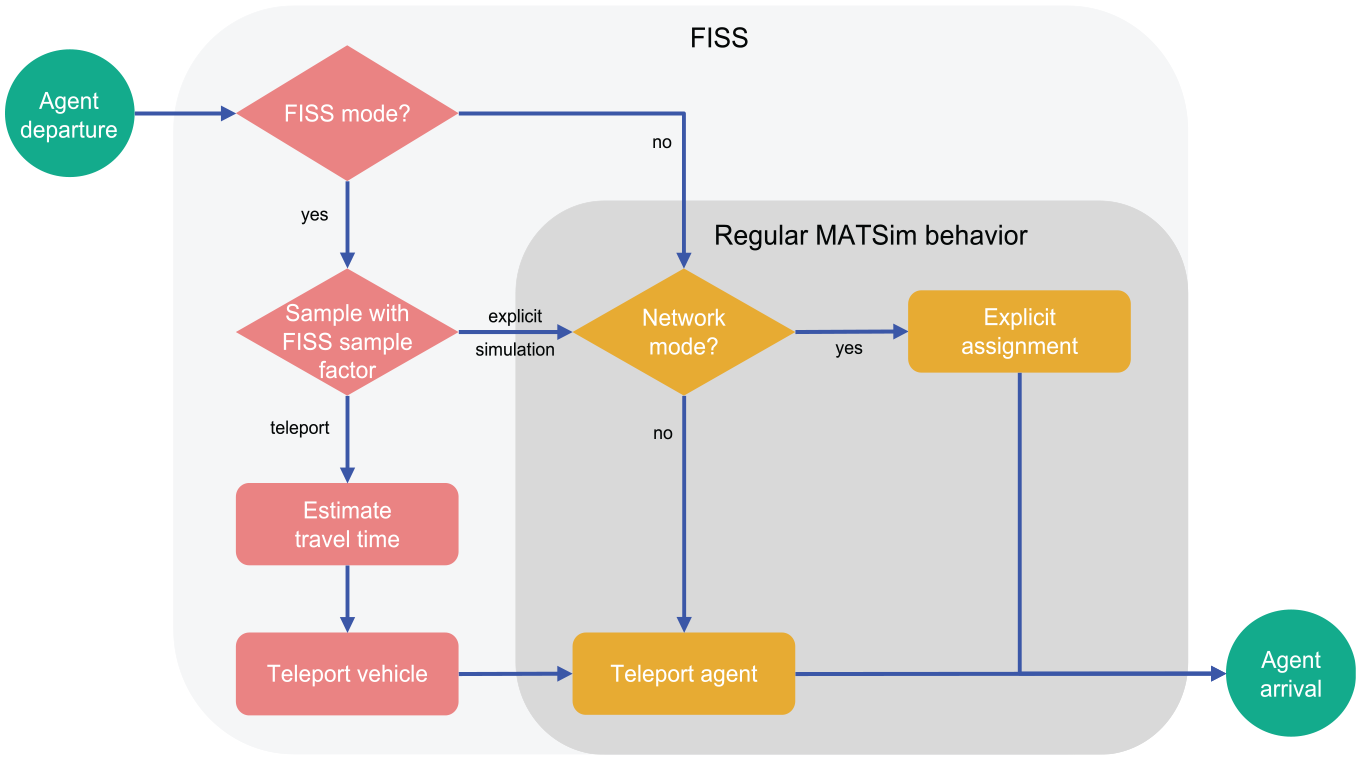
Flow chart of flow-inflated selective sampling (FISS) within MATSim’s mobility simulation. In principle, FISS wraps around the regular MATSim behavior.
Data Preparation and Scenario Setup
Munich Scenario
We synthesized a MATSim scenario of the city of Munich to demonstrate our approach. The scenario contains all inhabitants of the city of Munich and all inbound commuters from the surrounding counties intersecting with a 50 km buffer around the city boundary resulting in 1.6 million agents in total.
Sociodemographic properties such as age, employment status and commuting relationships, as well as daily mobility patterns are sampled according to their regional settlement structure classification from Infas and DLR (
36
), Bundesagentur für Arbeit (
37
) and the Federal Ministry of Transport and Digital Infrastructure (BMVI) (
38
). Possible locations for agents’ activities and the road and public transport network are derived from OpenStreetMap (OSM) (
39
) resulting in 1.9 million directed links in a region of 48,000 km
2
. Long-distance, regional and local public transport is modeled with schedules of a regular work day from Brosi (
40
) and with real-world vehicle capacities. Road-based public transport vehicles like buses or trams have their own “pseudo network” such that their vehicles are not influenced by congestion caused by private cars and no public transport delays can occur. The base model with the modes walk, bike, car, ride and public transport was calibrated in 300 iterations to the modal share of the city of Munich (
41
) with a target tolerance of
Mode Choice Model
The mode choice model assigns scores to the trips of every agent depending on the agent’s sociodemographic background and the properties of the trip, like travel, waiting and access and egress times. For example, persons aged over 60 years receive a worse score for an identical bike trip than a 25-year-old agent.
In contrast to the default mode choice mechanism in MATSim, which uses a random exploration of mode alternatives, an incremental multinomial logit (MNL) based approach is used for this research ( 42 ). For a randomly selected share of the population, a MNL trip mode selection is applied for a randomly selected trip of an agent’s plan. The available choice set for this selected trip needs to comply with mass conservation constraints (i.e., because of chained modes) and person-specific mode availability options. To allow an impedance responsive mode selection, impedance estimators have been added for mode choice relevant factors. Those factors are public transport and ride-pooling waiting times and in-vehicle travel times for car, ride (i.e., passenger in a car), public transport and ride-pooling trips. Because request rejection plays an important role in many ride-pooling services, this mode choice approach estimates the spatio-temporal rejection rates to sample the availability of ride-pooling offers. Similar to real-world operational services, supply and demand will thus form an equilibrium because of increasing waiting times, rejection rates, or both.
Simulation Setup
The transport modes walk and bike are modeled as teleported modes with a beeline distance factor of 1.3 for both and average speeds of 3.8 km/h and 11.3 km/h. Riding as a passenger in another car is teleported as well and thus also does not affect road network congestion. However, teleported travel time is derived from routing through the congested car network.
Table 2 shows the configuration of DRT service parameters in this study. We selected the parameters based on previous studies ( 26 , 43 ) to obtain a reasonable balance between service efficiency and service quality.
Demand Responsive Transport Input Parameters
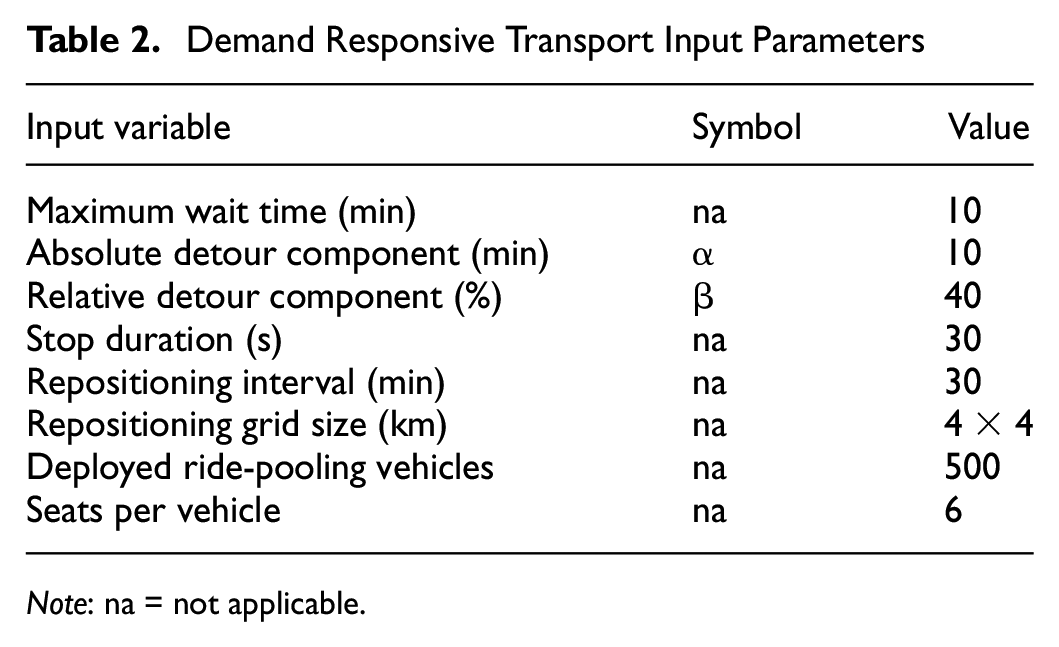
Note: na = not applicable.
For the scenarios with a FISS sampling factor
To assess the impact of FISS, both on simulation runtime and results, a set of simulations with and without innovation have been performed on an AWS EC2 instance of type r6gd.12xlarge (48 CPU cores, 384 GiB memory).
Scenario Without Innovation
Four simulations with 10 iterations each with FISS sample rates of 2.5%, 10% and 50% and a non-FISS simulation have been performed based on the final demand from a previous simulation that included DRT. However, these 10-iteration simulations did not allow agents to switch or innovate their plans (i.e., neither route nor mode choice). The idea is to extract the raw gains in computation time per iteration given a fixed demand.
Scenario with Innovation
Starting from the calibrated mobility plans from Mode Choice Model, where agents have not yet been exposed to a DRT transport mode, two simulations with a newly introduced DRT mode have been run for 250 iterations each. Such a simulation is regularly used to assess the potential DRT trip demand and traffic impact in a city with a given number of vehicles within a service area. The DRT mode has been modeled (according to Table 2) for a service area approximately covering the whole area of the city of Munich (see Figure 5). Agents’ plans contained the mode from the calibration process for each trip but without routes on the network, so that we could observe the route choice process during the first few iterations of the simulations. The scenario setup with innovation allows us to identify the impact of FISS on the decision making of agents and the resulting emergence of the stochastic equilibrium. Here, we also compare the results with:
plain sampling of population and supply (“ordinary sampling,” i.e., the whole population and supply are sampled down by a fixed factor as in earlier studies) and
plain sampling of population but an adjusted scaling of the fleet (“fleet-adjusted sampling”) as proposed by Kaddoura and Schlenther (
11
), who propose a non-linear formula to scale down the original ride-pooling vehicle fleet
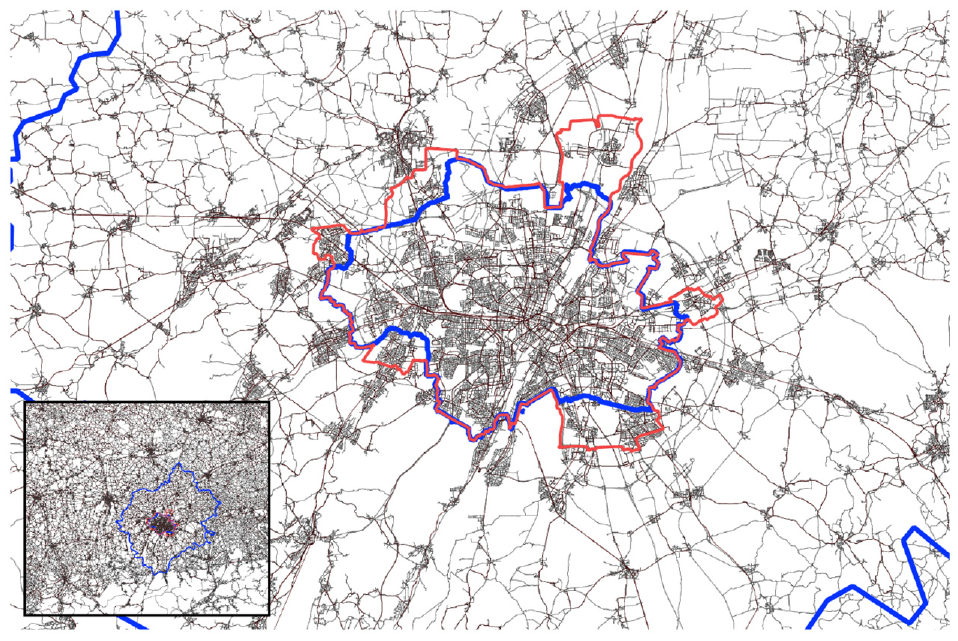
Road network from OpenStreetMap ( 39 ) with Munich city boundary and Munich region boundary (both blue) and demand responsive transport (DRT) service area (red).
Results
Scenario Without Innovation
Runtime
Figure 6a shows the runtime of the mobsim by the FISS sample factor. Reducing the number of non-teleported car trips scales almost linearily with the reduction in runtime. In the case where only 2.5% of car trips are not teleported by FISS the runtime is reduced by almost half and all the public transport and DRT trips—which are not teleported (Figure 6b)—dominate the runtime of the mobsim.
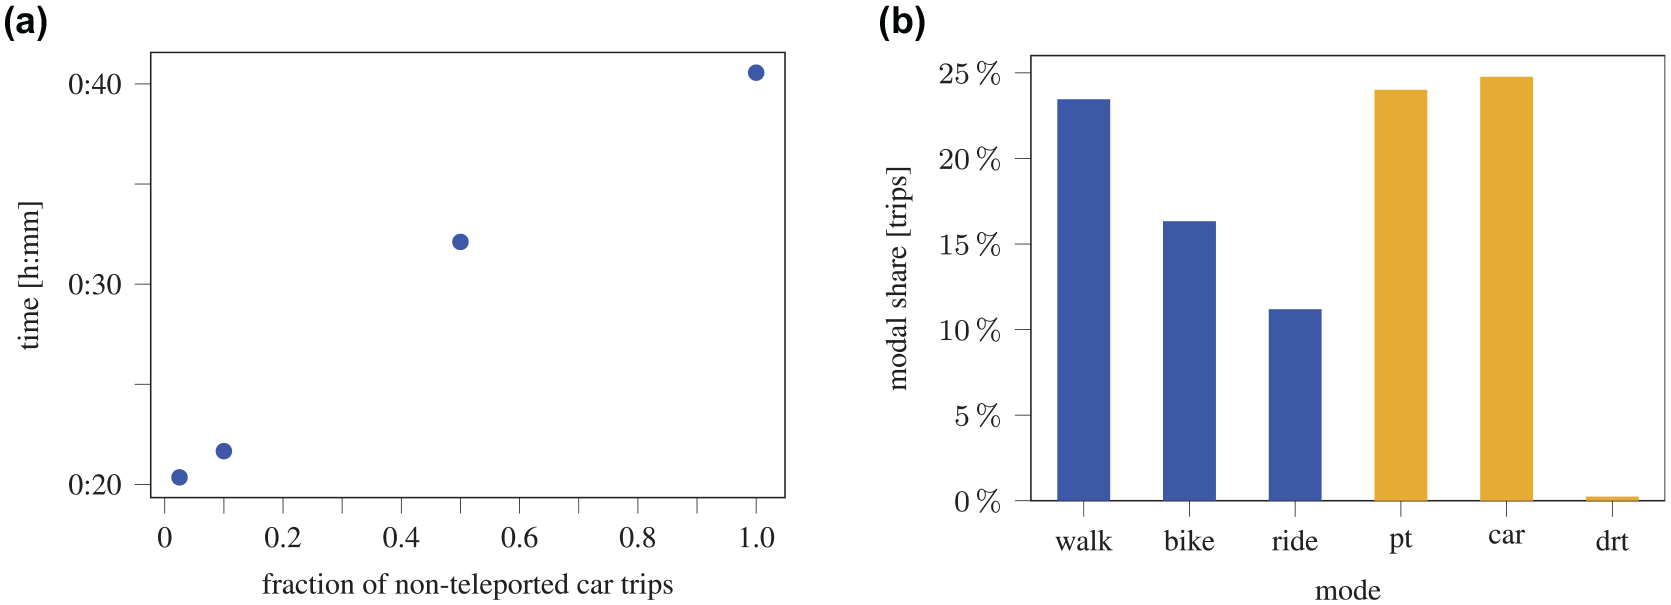
(a) Runtime of one mobility simulation (mobsim) iteration and (b) modal share (blue are teleported modes). Here, 49% of all trips are executed in the mobsim. Executing just 2.5% of all car trips in the mobsim reduces its runtime by 49.8%.
Link-wise Traffic Volumes
Figure 7 shows the distribution of the link-wise GEH statistic of each link’s hourly traffic volume per OSM highway type ( 44 ) in the city of Munich in a grouped box plot for the FISS sample factors 0.025 (blue), 0.1 (yellow) and 0.5 (green). Almost all 85th percentiles of the link-wise GEH of the FISS 0.1 case stay well below the recommended upper threshold of 5 (dashed line) and thus indicate a good fit between link-wise hourly traffic volumes of the base and FISS 0.1 case. With decreasing FISS sample factor, the link-wise hourly traffic volume errors increase vastly but do not provide a significant runtime improvement anymore. A FISS sample factor of 0.1 presents as a suitable trade-off between simulation duration and accurate traffic flow reproduction. This is in line with Kickhöfer et al. ( 45 ) who found that very small sample factors do not accurately capture traffic dynamics and they propose using factors starting from 10%.
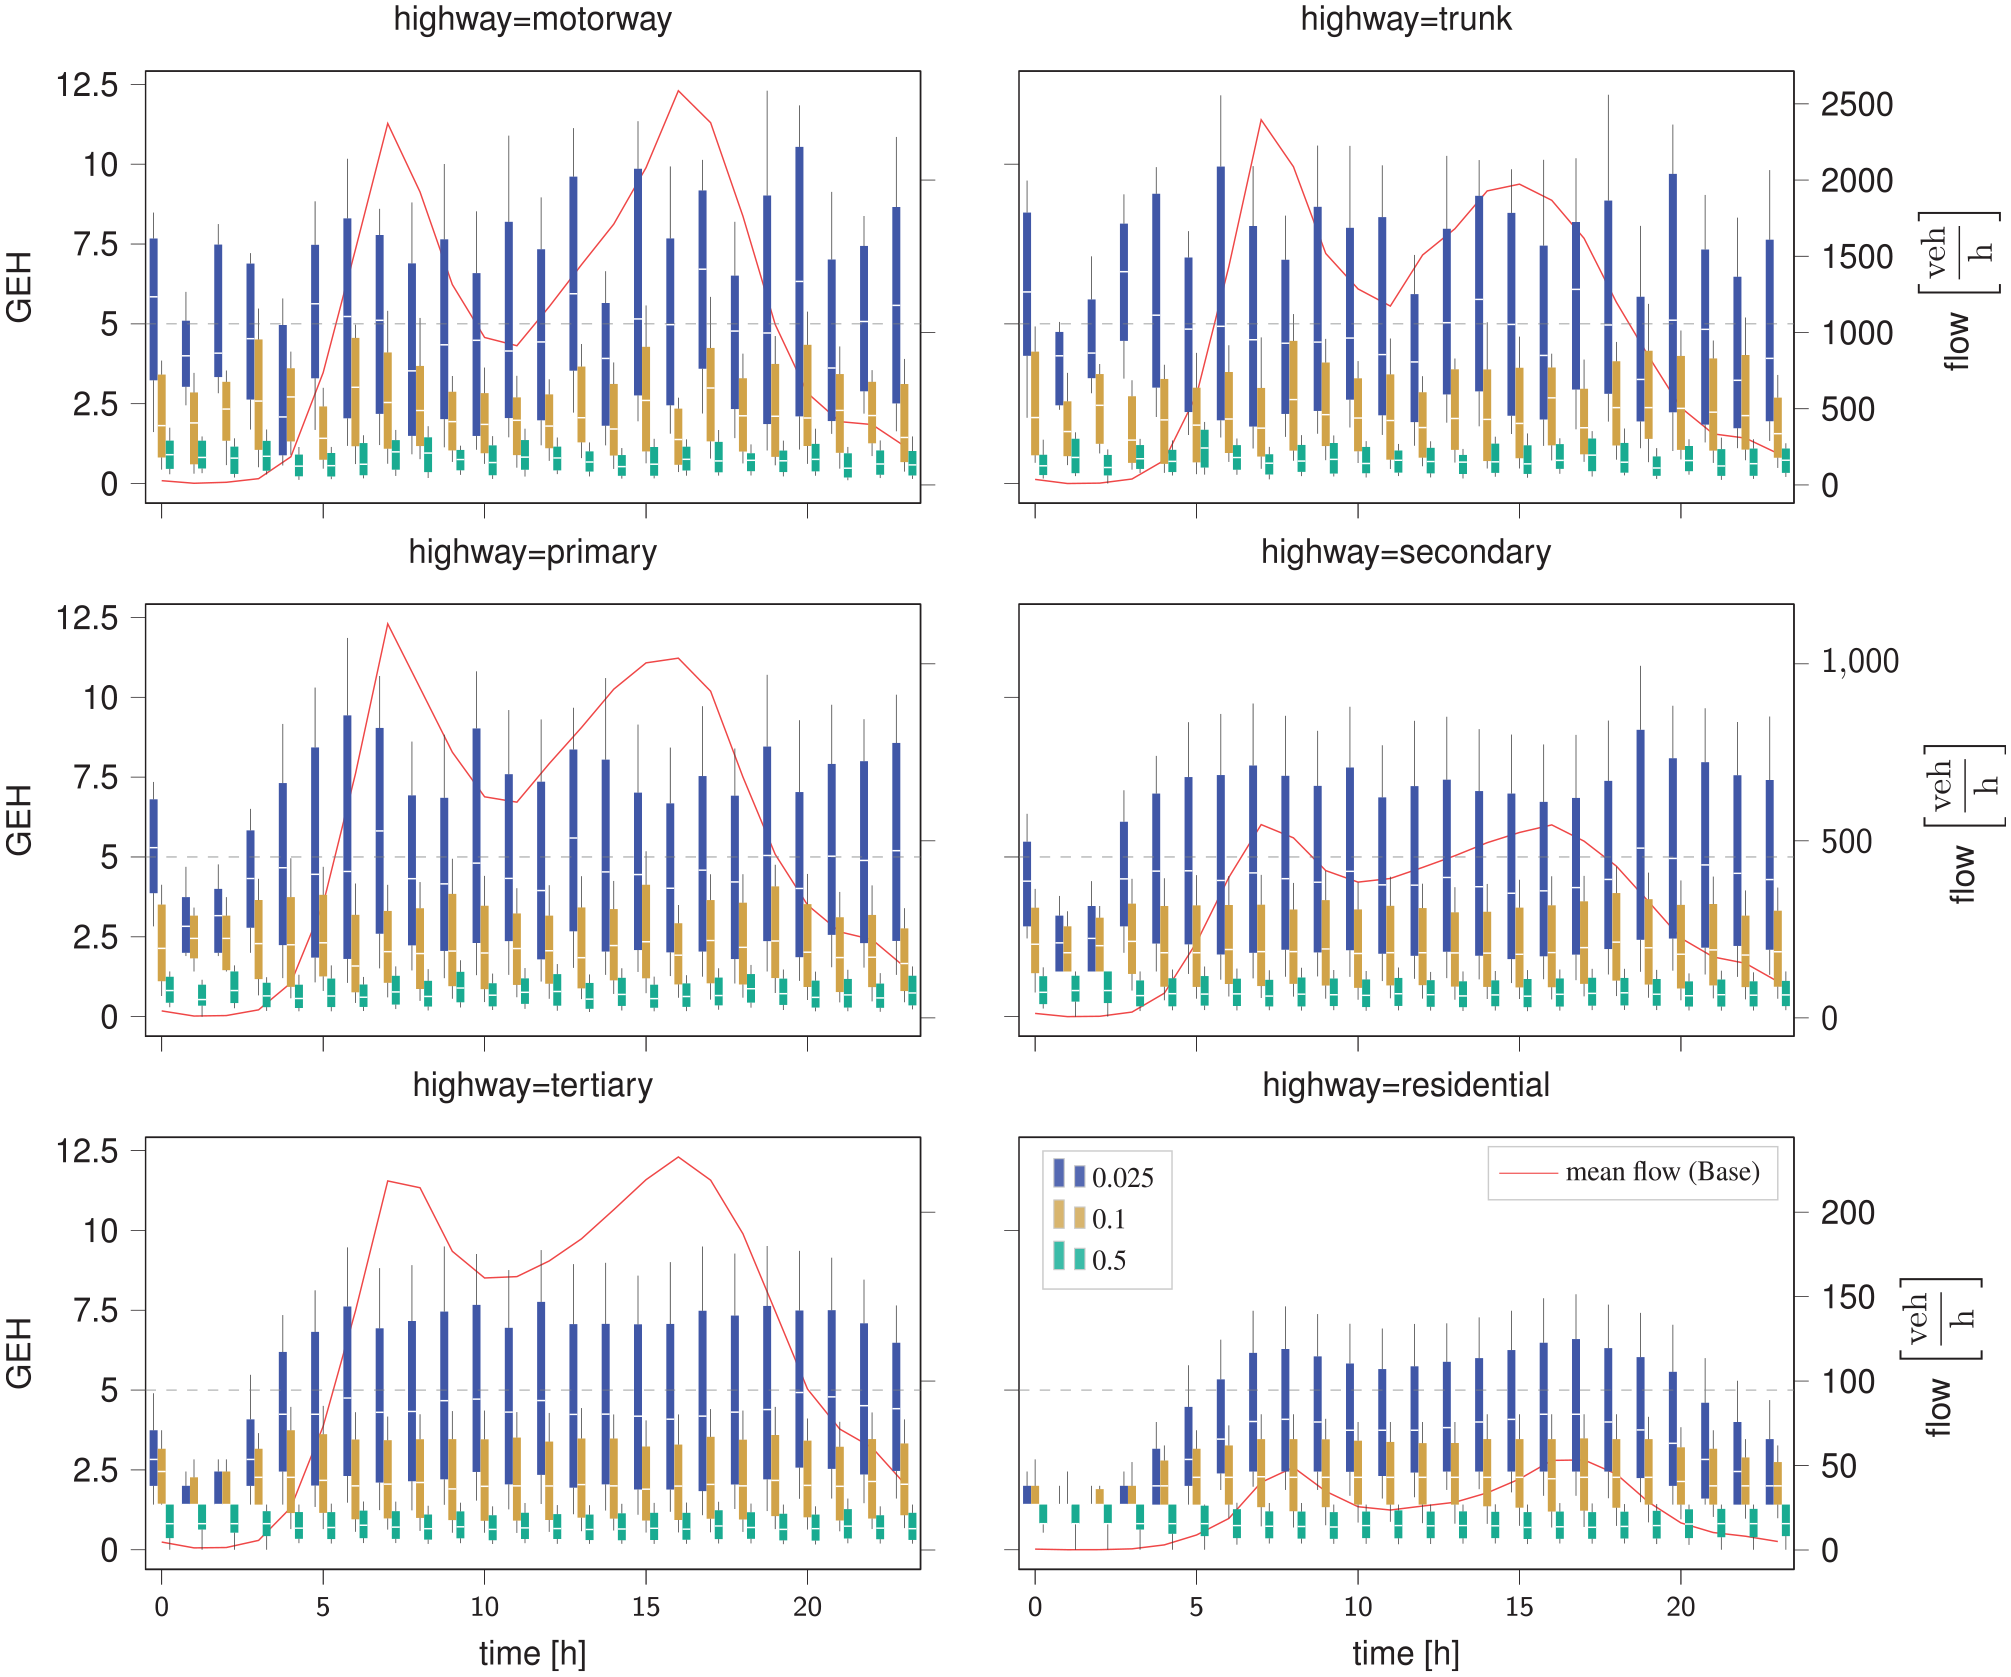
Distribution of link-wise GEH statistic by OSM highway type for flow-inflated selective sampling (FISS) sampling factors (fraction of non-teleported cars) 0.025, 0.1 and 0.5 in the city of Munich. Whiskers show the 15th and 85th percentiles. The red line shows mean hourly flows of the base case (right axis).
DRT KPIs
As Table 3 shows, DRT KPIs are almost identical throughout the selected FISS sample rates. Only the 0.025 case has a slightly higher rejection rate which is likely an artefact of DRT requests being rejected by the dispatching algorithm because service constraints like maximum waiting time cannot be met. The higher traffic volume variations (c.f. Figure 7) in the 0.025 case might lead to some links becoming congested by just a single (inflated) vehicle more easily which will increase travel times of some routes being calculated by the dispatcher.
Demand Responsive Transport Key Performance Indicators (DRT KPIs) After 10 Iterations Without Innovation
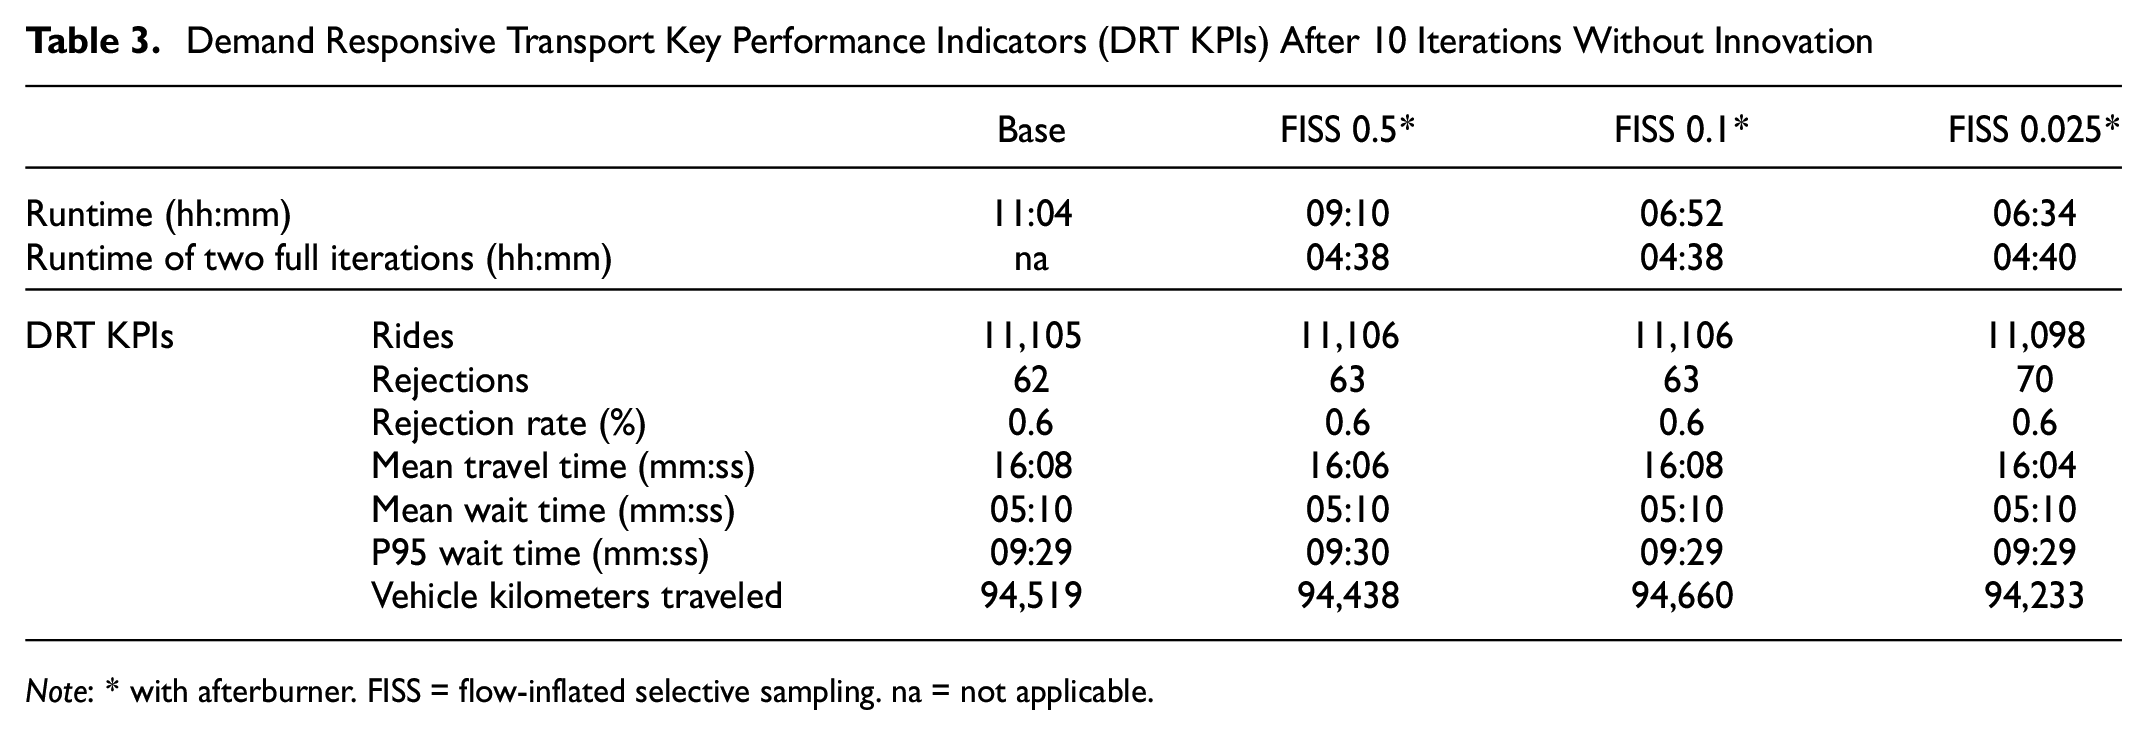
Note: * with afterburner. FISS = flow-inflated selective sampling. na = not applicable.
Scenario with Innovation
Runtime
In the base case, the complete simulation took 290 h to complete. In the FISS 0.1 scenario, this runtime was reduced to 190 h, a reduction of roughly 35% of the total simulation time. When looking at the mobsim time only, the mean per iteration reduced from 57 min to 35 min, which corresponds to a reduction of 39%. A detailed breakdown of the time required per iteration is shown in Figure 8. It can be seen that the mobsim time reduced considerably. The time spent for replanning has already been much reduced by making use of parallelization, as each agent is able to replan individually between iterations.
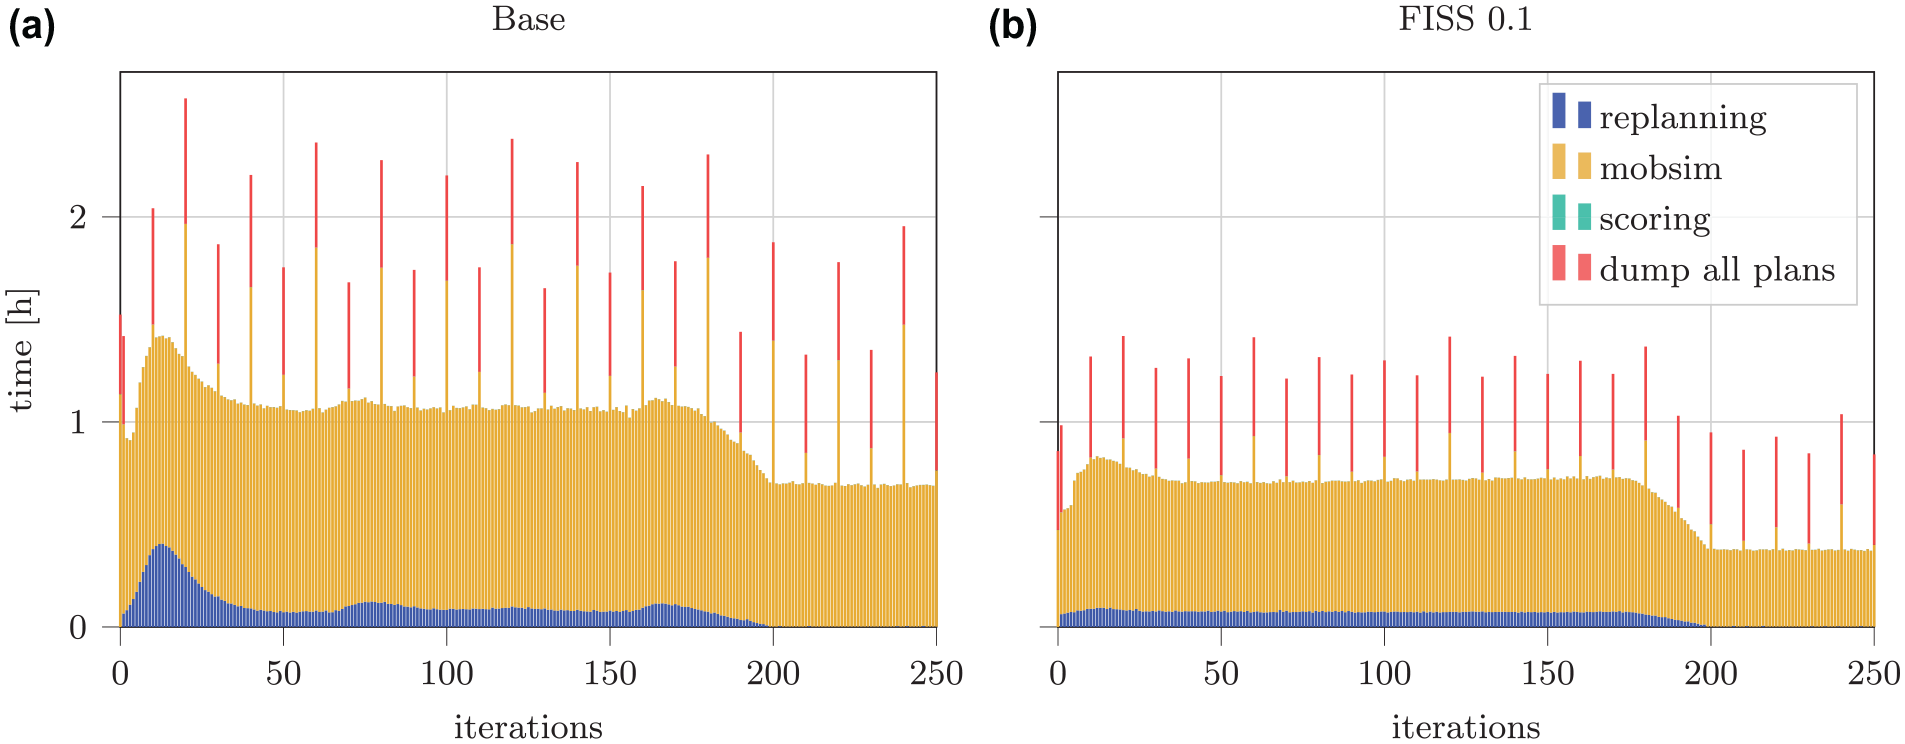
Detailed breakdown of time required for each iteration in (a) base and (b) flow-inflated selective sampling (FISS) scenario.
DRT KPIs
Table 4 shows the DRT KPIs after 250 iterations of the base scenario, the FISS case with and without two additional full iterations, and a 10% fully sampled scenario with 50 (“ordinary sampling”) and 115 instead of 500 ride-pooling vehicles (“fleet-adjusted sampling” based on the scaling equation by Kaddoura and Schlenther [
11
]). Comparing the last iteration of the FISS 0.1 case with the base scenario, it is noticeable that the number of rides, travel and wait time as well as vehicle distance traveled are all slightly increased. The fewer rejections in the FISS 0.1 case indicate that the routing of DRT vehicles on the FISS 0.1 network by the dispatcher yields slightly more optimistic routes than in the base case. This is a result of the random selection of car vehicles which are actually sent through the mobsim and which do not distribute evenly among all links. This is also reflected in a slightly higher
Demand Responsive Transport Key Performance Indicators (DRT KPIs) and Modal Shares After 250 Iterations Including Mode and Route Innovation
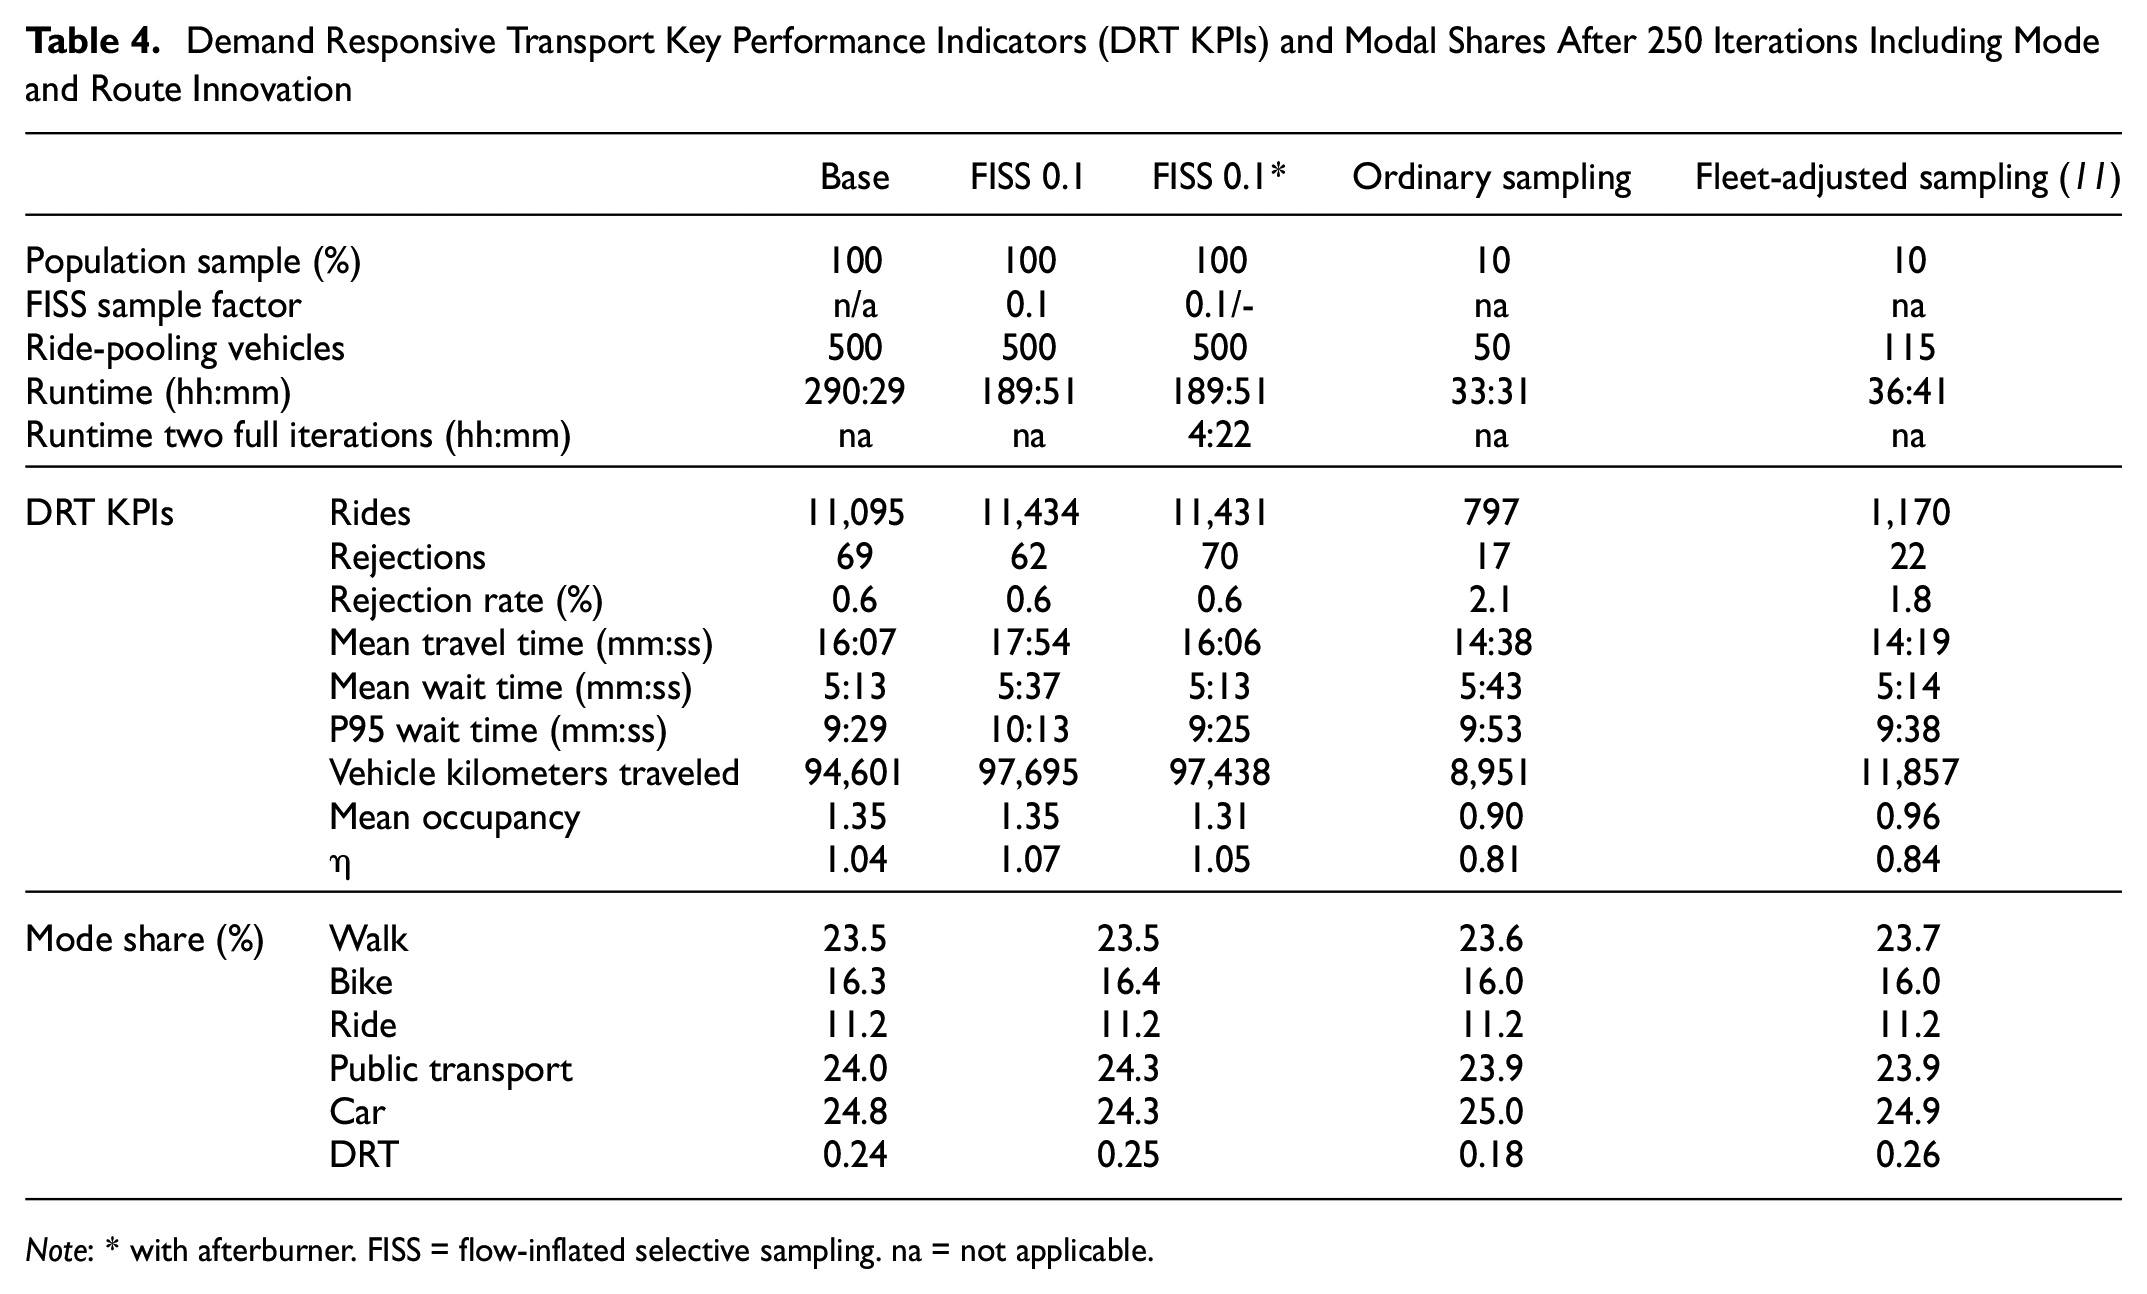
Note: * with afterburner. FISS = flow-inflated selective sampling. na = not applicable.
Simulating a 10% fully sampled scenario with one-tenth of the base case’s ride-pooling vehicles (“ordinary sampling”) resulted in just 7.2% of the rides and 9.5% of the total vehicle travel distance compared with the base case. This is a result of the significantly lower ride-pooling request density which overall lowers vehicle productivity and customer satisfaction with more than doubled rejections. This is also reflected in the reduced efficiency
Modal Share
Figure 9 demonstrates the evolution of the person kilometers traveled by mode over the iterations. It can be seen that the shares are very similar at the end of the iteration. This is also true for absolute mode shares, as shown in Table 4. Both Figures 8 and 9 also show that the adaptation of agents seems to be smoother in the FISS scenario, as the runtimes and person kilometers traveled oscillate less. One reason could be that the teleported agents do not experience the congestion immediately but only after the next travel time update. This could smooth out heavy reactions in the first iterations in which most agents are still concentrated on fewer routes and experience bad plans. The general finding of more stable convergence is also supported by Llorca and Moeckel ( 6 ) who reported that sampled scenarios may require fewer iterations. While we did not test this hypothesis here, the results shown in Figures 8 and 9 may also suggest that fewer iterations could be required in the FISS case, which would further reduce total runtime.
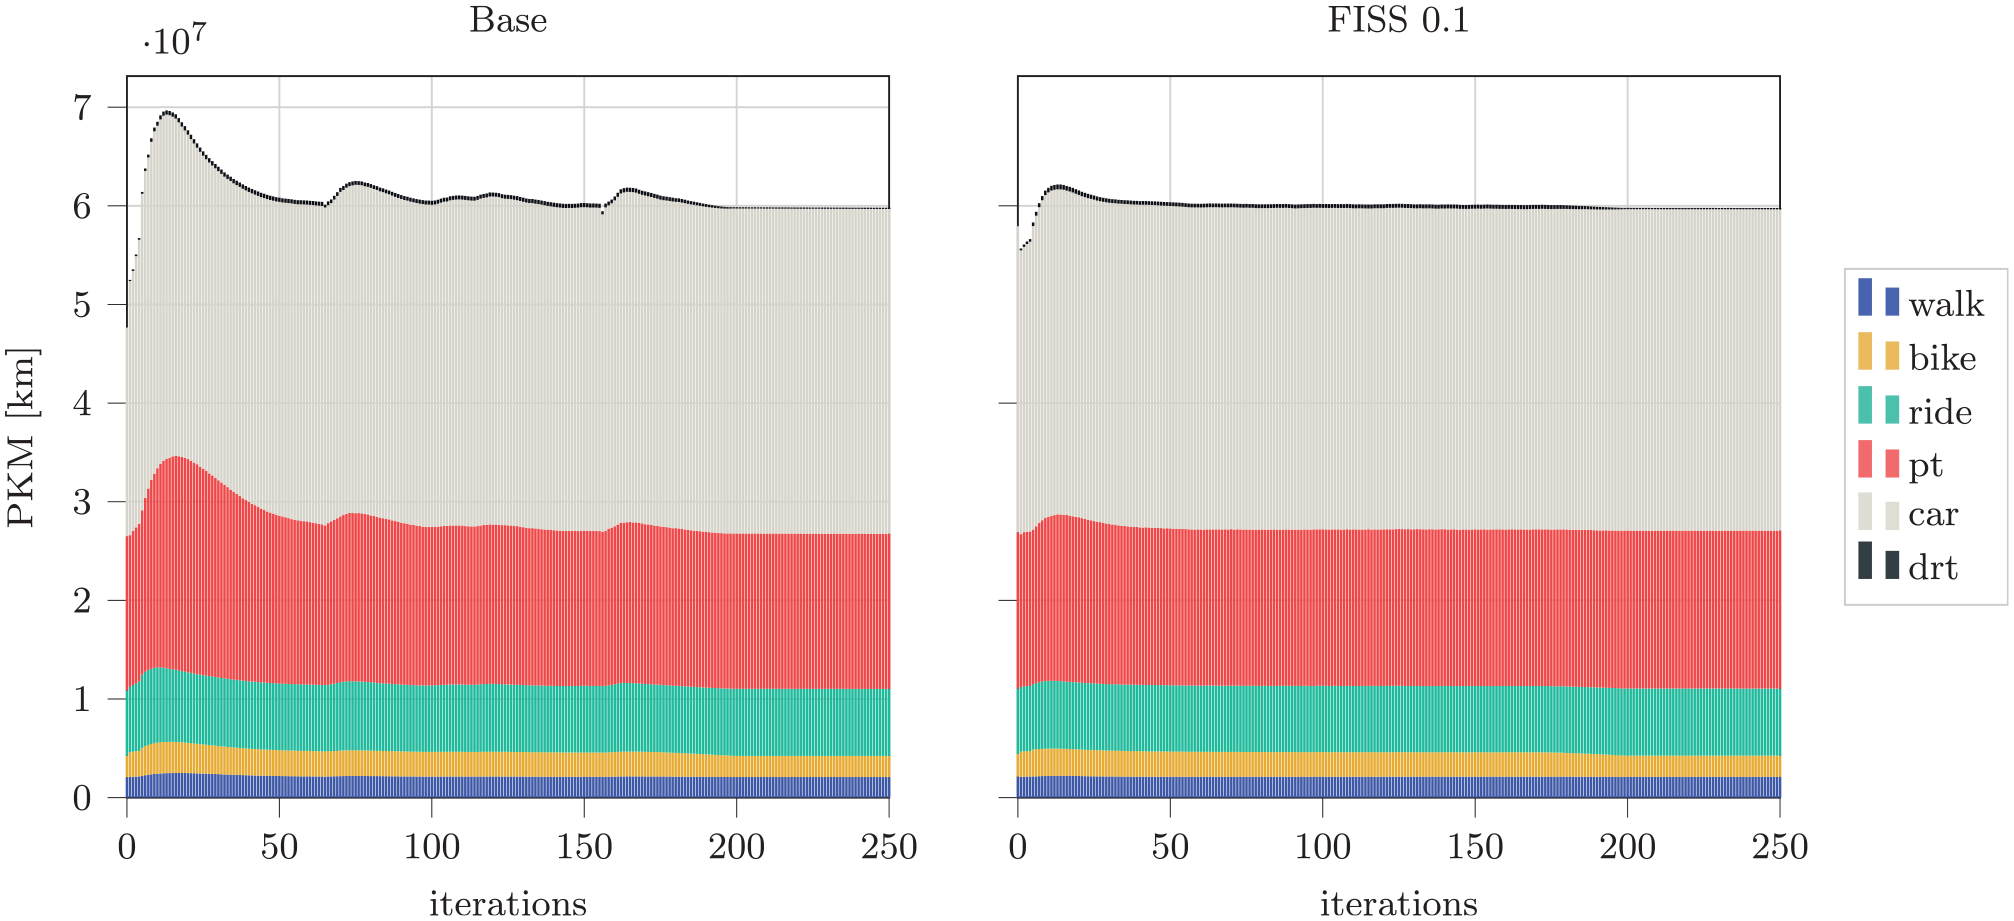
Person kilometers traveled by mode for each iteration in the base and flow-inflated selective sampling (FISS) scenario.
Discussion
FISS is an alternative way of dealing with the issue of sampling in agent-based ride-pooling simulations which could otherwise only be overcome by correctly accounting for the sampling bias ( 46 ). FISS ensures a realistic simulation of ride-pooling and at the same time leads to reduced runtimes, which may therefore reduce the costs of large-scale simulations. In contrast to actually scaling the input, however, the complete simulation needs to be kept in memory and, thus, the memory requirements of the host machine remain high and for large-scale simulations it may still be necessary to pay for high performance infrastructure. However, in the presented FISS scenario with innovation, the runtime saving was roughly 100 h in total. At the time of writing, the employed r6gd.12xlarge instance on AWS is priced at USD2.76 per hour (https://aws.amazon.com/ec2/pricing/on-demand/). Besides considerably reducing runtime, FISS also implied cost savings of roughly USD276 per simulation in the given scenario. If FISS also leads to quicker convergence and less iterations needed, the savings would increase further.
In addition, significant runtime improvements make agent-based mobility simulations more feasible for the use with optimization methods which rely on the outcome of one whole simulation for each parameter perturbation, for example, to perform optimizations on the supply side, such as DRT service area definitions, pricing schemes, driver shifts, hub locations or fleet sizes.
An important bottleneck in simulating on-demand traffic remains routing, which is the reason why the presented simulations still require long runtimes. For each request, multiple dynamic routing queries have to be computed to obtain the best matches between riders and vehicles. Buchhold et al. ( 47 ) present a routing algorithm and implementation which is up to 30 times faster than the standard MATSim routing algorithm. While the present paper primarily deals with reducing the computation time caused by the background traffic, reducing the time required for on-demand routing would further reduce total simulation time considerably. This also shows a drawback of the FISS approach which may not be as effective in scenarios with high shares in the explicitly simulated mode (e.g., in fully autonomous future ride-pooling services that might be able to scale to considerably higher mode shares).
A limitation of our scenario is that transit vehicles are not affected by road congestion as they travel along a separate network. However, this should not invalidate our findings, as we focus on the analysis of the DRT service and all compared scenarios are simulated with the same limitation. One could argue that travel times for transit vehicles may be affected by the sampling and could in turn have an impact on the DRT service. However, DRT travel times as well as mode choice distributions remained stable, which does not support this assumption.
The results shown here suggest efficiency values of
The approach presented has limited or no applicability to populations that have already been sampled. Moreover, it is limited to single-passenger modes, such as private cars in this case. This also means that the approach is not practical for dedicated fleet simulations of ride-pooling or other multi-passenger modes. Finally, it is only suitable for spatially explicit simulations such as MATSim with network capacity constraints and inflatable numbers of vehicles.
To achieve additional reductions in runtime, the FISS approach may be combined with the DRT speed up presented by Kaddoura et al. ( 50 ). Here, the idea is only to simulate ride-pooling services explicitly every k-th iteration. In between these iterations a surrogate model which builds on various indicators (i.e., waiting time and ride time) that are averaged across previous iterations replaces the actual assignment. Future studies should investigate the combination of FISS with these additional improvements. In addition, modeling other shared modes such as urban air mobility or car sharing could be investigated with FISS.
Footnotes
Author Contributions
The authors confirm contribution to the paper as follows: study conception and design: N. Kuehnel, H. Rewald, S. Axer, F. Zwick; data collection: N. Kuehnel, H. Rewald; analysis and interpretation of results: N. Kuehnel, H. Rewald; draft manuscript preparation: N. Kuehnel, H. Rewald, S. Axer, F. Zwick, R. Findeisen. All authors reviewed the results and approved the final version of the manuscript.
Declaration of Conflicting Interests
The author(s) declared the following potential conflicts of interest with respect to the research, authorship, and/or publication of this article: It is acknowledged that Nico Kuehnel and Felix Zwick are employed at the ride-pooling provider MOIA. Hannes Rewald and Steffen Axer are employed at Volkswagen AG.
Funding
The author(s) received no financial support for the research, authorship, and/or publication of this article.