
Abstract
Transportation equity is a vital but vague issue for planners and engineers in the United States, where mobility-based transportation planning has triggered the disproportionate distribution of benefits and burdens in the transportation system. Previously, transportation equity studies have evaluated equity using different transportation service metrics and socio-demographic factors. Job accessibility is one principal metric for transportation quality as it directly relates to a community’s economic prosperity. While most equity studies analyze aggregate accessibility for a single mode, our study measures blue-collar and white-collar job accessibilities for automobile and transit by incorporating job proximity, competition, and matching, using the Dallas-Fort Worth area as a case study. Using Lorenz curve, Gini coefficient, and Atkinson measure, we performed horizontal and vertical equity (within and between groups) studies and compared various population groups by disaggregating the population based on the two most cited environmental justice indicators, namely, income and race. Our findings suggest that (a) job accessibility by transit mode has higher inequalities compared with automobile, (b) white-collar and blue-collar jobs have similar inequality levels, (c) low- and high-income populations experience somewhat the same inequality levels, and (d) inequality is highest among African American communities, (e) blue-collar job accessibility has higher inequality for Hispanic and Asian communities for both transportation modes and (f) the disparities in job accessibility are greater between racial groups than income groups in the Dallas-Fort Worth area. To address such disparities, planners must enhance transit availability through subsidizing transit costs and transit feeder services like on-demand shared services.
Keywords
Cities and regions offer opportunities and services to urban residents. However, ever-increasing urban growth, especially in the form of urban sprawl, has inflated the demand for land and jobs and imperiled the distribution of such benefits for different population groups. An acceptable quality of life, sustainability, economic flourishing, and social engagement remain unachieved without suitable mobility and accessibility to opportunities ( 1 ). Thus, transportation improvement projects are defined and implemented in North American cities because they influence a community’s economic, environmental, and health benefits ( 2 , 3 ). Nonetheless, benefits are unfairly distributed among different population segments, and certain groups are more exposed to negative externalities of transportation so they have reduced access to benefits ( 4 – 8 ).
The unjust distribution of transportation benefits and burdens can escalate transportation equity issues, especially in cities supporting mobility-based and car-oriented commutes and having low-density and low-quality multimodal systems. Such orientation of transportation infrastructure and urban form prevents underserved societies or populations lacking environmental justice (EJ) like minorities and low-income communities ( 9 ) from having convenient access to opportunities. Under Title VI of the Civil Rights Act of 1964 and the Intermodal Surface Transportation Equity Act (ISTEA) of 1991, metropolitan planning organizations (MPOs) are required to address such equity issues to ensure that investments and projects are non-discriminatory based on identified socio-economic factors ( 10 – 13 ). Despite these equity considerations for regional transportation plans and improvement projects, transportation inequalities still exist among different neighborhoods, racial, and income groups ( 7 , 10 , 14 ).
Transportation equity usually refers to the fair distribution of costs and benefits of transportation services. It can be classified into three types:
Horizontal equity, referring to equal distribution of impacts between all groups regardless of ability or need. In this equity type, everyone is treated the same.
Vertical equity, referring to the equal distribution of impacts with regard to race and income.
Vertical equity, referring to the fair distribution of impacts with regard to mobility needs (universal design), such as people with physical or visual impairment ( 5 ).
Studies show a direct relationship between low income and low automobile ownership ( 15 ), meaning substantially lower accessibility when using alternative modes. Furthermore, people of color (racial minorities) are segregated or displaced by mobility-based transportation planning, highway expansion, and urban renewal programs ( 13 ). In U.S. cities, blue-collar workers who reside in central business districts and participate in suburban low-paying jobs have limited transit accessibility. In such conditions, measuring job accessibility for different job types and modes can unveil important transportation equity issues ( 15 , 16 ).
Job accessibility studies frequently measure aggregate accessibility, disregarding demand factors, such as job matching and competition, and supply factors. However, the demand-side factors are crucial as job seekers compete for job opportunities and the likelihood of being employed depends on their background, education, skills, experience, and so forth ( 17 ).
Accordingly, incorporating supply- and demand-side factors into accessibility-inequality measures for different modes can offer better insights into transportation discrimination among different populations, especially for those with limited job opportunities and fewer commuting alternatives. Our study attempts to uncover the inequities among different population groups in job accessibility by adopting a three-step transportation equity framework. While our framework is easy to implement and understand, it enjoys a high disaggregation of accessibility using readily available data. To this end, Dallas-Fort Worth (DFW) Metropolitan Area is chosen as a case study.
Based on the introduced topic and framework, we developed the subsequent research questions for our study:
How does job accessibility in the DFW region vary based on available job types and transportation modes; how is their equity performance from a comparative approach?
How equal is the distribution of these accessibilities considering EJ factors?
What are the planning and policy implications of these results for future improvements?
The remainder of this paper is structured as follows The next section reviews the relevant literature and concludes by proposing a methodological framework for answering the framed research questions. The third and fourth sections explore the input data and the methods used for this analysis. The fifth and sixth sections present the empirical results of the case study, separated by distinct levels of analysis. The final section presents the conclusions, policy implications, and further research recommendations.
Literature Review
A key concept connecting land use patterns and transportation is locational accessibility. Since the distribution of population and opportunities (such as employment) determines the level of accessibility, it is also a key for forecasting the interactions between zones and subsequently travel flows. Another application of this measure of transportation performance is to scrutinize planning issues such as disparities, inequalities, or segregation for different locations ( 4 , 17 , 18 ). While accessibility can be defined for different opportunity types, research into spatial mismatch greatly emphasizes the disparities in job accessibility. Job accessibility is a fundamental spatial mismatch measure ( 19 ). Shen ( 20 ) devised an accurate method for measuring job accessibility and found that job accessibility for transit users is much lower than that for drivers in the Boston metropolitan region. Likewise, job accessibility as a supply-side factor can be assessed against different socio-economic factors within an equity analysis scope ( 21 ). Disaggregating accessibility measurements by transport mode, job seekers’ skills, and background can offer insights into demand and supply mechanisms of accessibility. This approach allows for identifying priorities for intervention to improve coverage and access and redistribute current accessibility levels ( 22 ). In short, transportation planning can benefit significantly from adopting more detailed and disaggregated accessibility metrics ( 23 ).
Considering accessibility measures with competition effects is crucial since accessibility depends on how many users might have access to opportunities they can compete for ( 24 ). El-Geneidy et al. ( 25 ) derived a cumulative job accessibility measure based on travel time, travel fare, and the two combined. They revealed that socially disadvantaged areas have more equitable job access using transit. Cervero et al. ( 26 ) noted that the addition of occupational matching significantly affects the outcomes of job accessibility indicators. Nevertheless, studies have not assessed the comprehensive effects of socio-economic status, educational attainment, and transportation mode on job accessibility ( 27 ). Addressing this gap, Pan et al. ( 17 ) created a measure of employment accessibility attuned to both competition and matching, considering a multimodal transportation system with transit riders having the choice of walking or driving as their first-mile or last-mile mode. Pan et al. ( 17 ) claimed that household car ownership is a significant factor in determining both automobile drivers and transit users who are seeking jobs. These job accessibility indicators are valuable and undoubtedly aid in comprehending how some people are consistently deprived of transportation infrastructure. Mapping these measures is a common strategy to reveal how close minority and low-income populations can be to accessing opportunities ( 28 ). Compared with the general population historically, underserved areas consistently experience lower potential mobility across transportation modes ( 29 ). Regional equity studies must consider how racial conflicts intensify the unfair distribution of costs and benefits amongst communities of concern ( 10 ). Accordingly, they should suggest solutions for tackling such disparities. Through examining mobility patterns and accessibility in different modes, transportation equity can be measured and analyzed by applying EJ factors for identifying underserved populations. Therefore, EJ areas help us to recognize groups with limited access to services, like households without automobiles, people with disabilities, and seniors ( 30 ). Equity assessment studies typically follow Karner and Niemeier’s ( 10 ) three-step method. First, several factors are selected, and population subgroups are defined accordingly. Secondly, transportation service quality metrics (e.g., accessibility) are measured. Lastly, the distributions of those metrics are compared among different identified disadvantaged groups ( 31 ). According to Guo et al. ( 2 ), such an assessment is a vertical equity analysis. Contrastingly, in horizontal analysis, the inequality measure is indifferent to socio-economic factors and treats all observations similarly. For a horizontal equity analysis, the Lorenz curve helps report the cumulative distribution of resources among people ( 39 ). The plot expresses the percentiles of the residents versus wealth (accessibility in this study) on its two axes; where a straight diagonal line represents perfect equality and the distance between the curve and equality line shows the level of inequality. That said, measuring both horizontal and vertical inequality enables comparisons of outcomes for general populations (horizontal equity) and within and between certain population subgroups (vertical equity) ( 2 ).
In a similar fashion, many scholars have pointed out various issues of socio-economic based discrimination on mobility, accessibility, journey time, transport investments, and transport expenditures ( 32 ). The Gini coefficient ( 33 ) helps assess the overall inequality level across the whole population. Furthermore, the Gini coefficient has already been used in transportation equity studies to quantify inequities in automobile and transit availability or accessibility ( 34 ). Thus, Feng and Zhang ( 35 ) used the Gini coefficient along with relative mean deviations, and the Atkinson index ( 36 ) to define equity based on accessibility at the zonal level for highlighting various degrees of inequalities in the spatial distribution of accessibility. Moreover, researchers use the physical characteristics of transportation services, like transit line frequency, bus station count, and average commute time, to determine the level of transportation disadvantage. However, geographical accessibility metrics may better describe those disadvantages since real travel time and transportation network level of service is incorporated in such measurements ( 37 ).
Incorporating inequality metrics (Gini coefficients and Lorenz curves) into accessibility studies can help researchers visualize and identify differences in access to opportunities. Such measures help communicate the social consequences of urban transport to decision-makers ( 22 ). To evaluate horizontal equity, Chen et al. ( 38 ) used the Lorenz curve ( 39 ) to derive the Gini index and reported that automobile accessibility was consistently higher in space and time, even with some areas having higher transit supplies. Also, the area’s transit lines offered a corridor of high accessibility for medium-length trips ( 38 ). Delbosc and Currie ( 40 ) assessed the overall transit supply to the population and found that 70% of the population shared only 19% of the supply (G = .68). After adding employment into the same analysis, the Gini coefficient dropped by 0.06 while the supply share increased by 4%.
Likewise, vertical equity results revealed that low-income groups occupied areas of higher transit supply ( 40 ). Kaplan et al. ( 41 ) applied geographic mapping to offer insights into the inequity in bike-sharing accessibility and reported unevenly distributed accessibility results amongst different socio-demographic groups of southern Tampa. Aman et al. ( 42 ) performed an equity analysis applying the Lorenz curve to capture inequities in micro-mobility allocation and found extreme inequity in accessing micro-mobility services for transit-dependent residents.
In summary, many studies have tried to conduct equity analysis using various types of transportation costs and benefits. However, to the best of our knowledge, no study has tried to perform an equity analysis on accessibility measures that incorporate job matching and competition. Such a gap in the literature seems significant since equity studies mostly aim to reduce the inequality disparities between underserved and general populations. This study attempts to fill this gap by (a) accounting for job matching and competition and (b) performing a detailed vertical equity analysis by race and income that includes both within- and between-group inequality measurements.
Methods
This section provides a brief overview of our methodology for calculating accessibility and its associated inequalities. We adopt a three-step framework; first, we explore and identify transportation demand using transportation equity indicators. Next, we measure transportation benefits (accessibility by job type and mode). Finally, Lorenz curve, Gini coefficient, and Atkinson measure helped assess these benefits’ equalities.
As per the literature, despite using various methods for assessing transportation benefits/burdens and equity, no equity analysis attempted to analyze job accessibility disaggregated by job type and travel mode with a comparative approach for both horizontal and vertical equity. Consequently, we try to fill this gap using a revised three-step equity analysis framework (Figure 1).
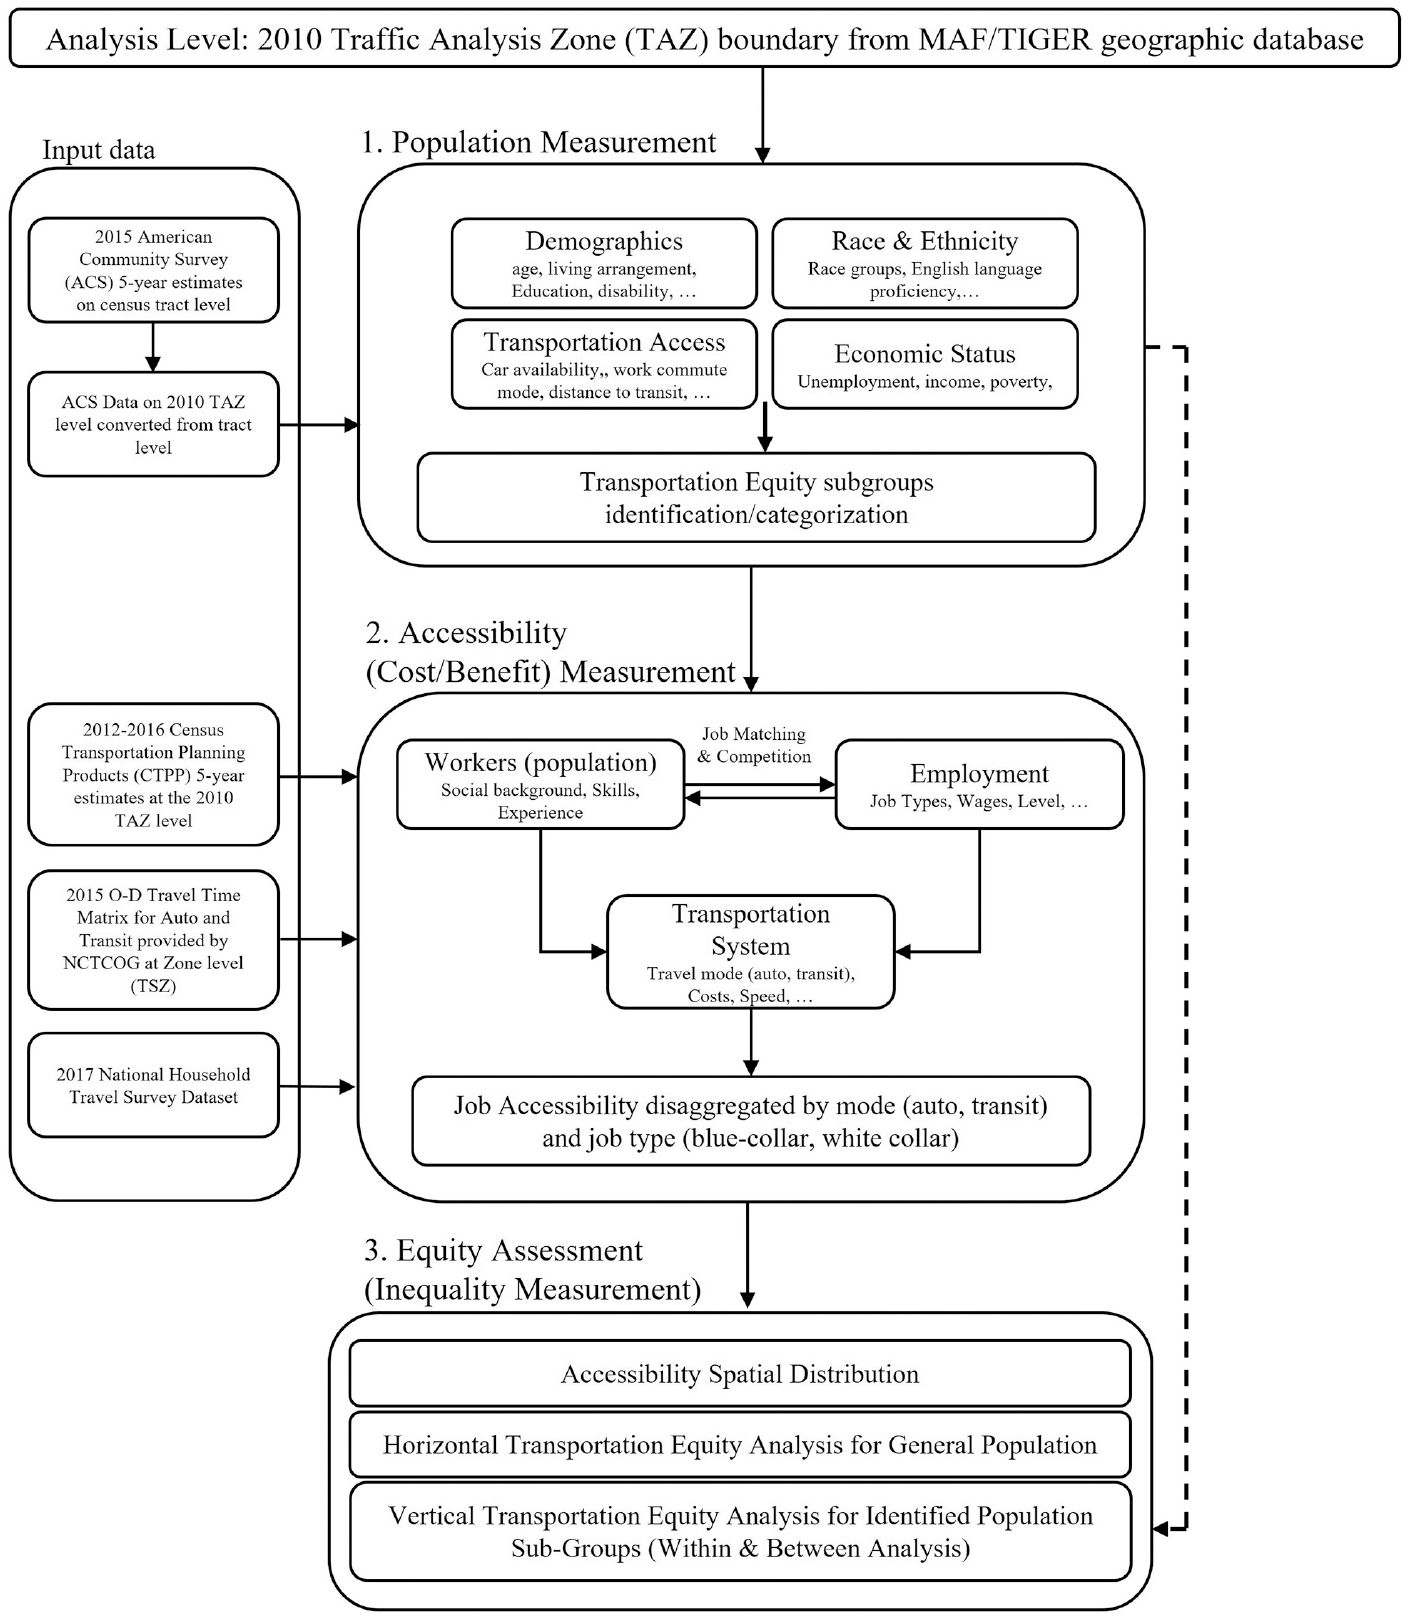
Conceptual framework for equity analysis on job accessibility with job competition and matching.
As Figure 1 demonstrates, our equity analysis framework includes three steps: population measurement, accessibility measurement, and inequality measurement, explained in detail below.
Population Measurement
According to transportation equity studies, several socio-economic factors, like race/ethnicity, explain or cause unequal regional access to opportunities ( 43 , 44 ). Underserved communities lack easy automobile access as a result of many factors (poverty, unemployment, age, etc.). Therefore, they require transport improvements on commuting mode alternatives ( 45 , 46 ). Thus, identifying underserved communities and their transportation service demands is crucial in transportation equity analysis. Precisely this step helps us define and distinguish population subgroups for vertical equity analysis.
E.O. 12898 - Federal Actions to Address Environmental Justice in Minority Populations and Low-Income Populations - was issued by President William J. Clinton in 1994. Its purpose is to focus federal attention on the environmental and human health effects of federal actions on minority and low-income populations with the goal of achieving environmental protection for all communities. It identifies several population groups of concern in considering the potential EJ implications of a regulatory action ( 47 ). Based on this order, we classify our population groups based on (a) income and (b) race as:
When the ratio of the minority population to the general population in a Traffic Analysis Zone (TAZ) exceeds 0.537 (the regional average proportion), we identify that TAZ as minority dominant. All other TAZs are called general dominant (i.e., the reference population). After identifying minority-dominant TAZs, we further categorize them into racial minority groups. To do so, we identify TAZ as having proportions of a particular racial minority population above the regional average percentage. We use the North Central Texas Council of Governments (NCTCOG) regional percentages for this study: 15.7% for African Americans, 28.8% for Hispanics, and 6.8% for Asians. The remaining TAZs amongst the minority-dominant TAZs not falling into any of these racial groups were classified as mixed TAZs, representing TAZs that might have higher proportions of two or more minority races mentioned above, that is, African Americans, Hispanics, or Asians.
The Annual Statistical Poverty threshold is 125% of the U.S. Census Bureau’s American Community Survey (ACS) Poverty Level in relation to the total number of persons for whom poverty status is determined. If the Annual Statistical Poverty threshold exceeds 0.1611 for any TAZ ( 48 ), we say that low-income communities dominate that TAZ ( 9 ).
Accessibility Measurement
Accessibility helps measure land use and transportation system efficiency. According to Pan et al. (2020),accessibility helps measure the potential for social prospects ( 49 ), the benefit from a particular situation ( 50 ), or the convenience of reaching places ( 51 ). Hansen ( 49 ) developed a spatial interaction model for accessibility measurements (Equation 1)

where
Accessibility is inversely proportional to travel cost, that is, the higher the accessibility, the less the travel cost. Considering this assumption, impedance functions are calculated as, that is, an inverse power function Cij–α, α > 0 (
49
), a negative exponential function
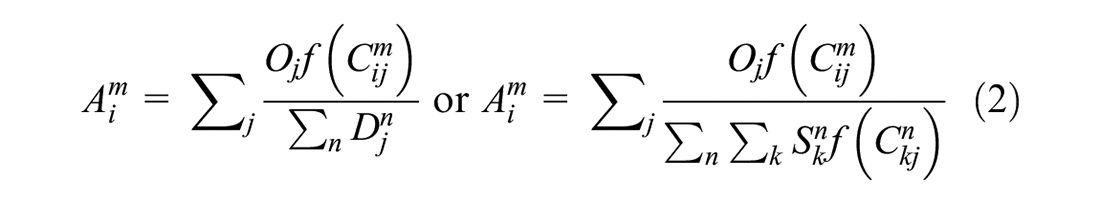
where Ai m is the accessibility from zone i to specific kinds of opportunities by utilizing mode m, Sk n is the count of opportunity seekers residing in zone k and utilizing mode n, Dj n is the demand of opportunity seekers residing in zone j and utilizing mode n, f(Cij m ) and f(Ckj n ) are the impedance function measuring spatial interactions between zones i and j using mode m and traveling from zone k to j utilizing mode n respectively. Pan et al. ( 17 ) further refined Shen’s ( 20 ) equation by including job matching and competition considering the socio-economic background of opportunity seekers for specific opportunity types (Equation 3).
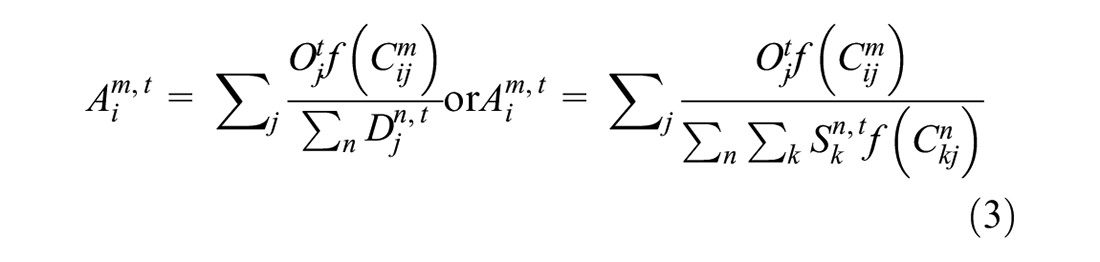
where Ai m,t is the accessibility from zone i to specific kinds of opportunities by utilizing mode m, Oj t is the amount of a specific kind of opportunity in zone j, of type t opportunity, Sk n,t is the count of opportunity seekers residing in zone k and utilizing mode n, Dj n,t is the demand of opportunity seekers residing in zone j and utilizing mode n, f(Cij m ) and f(Ckj n ) are impedance functions measuring spatial interactions between zones i and j using mode m and traveling from zone k to j utilizing mode n respectively.
We adopt Pan et al.’s (
17
) formula because it incorporates both job competition and matching. Our study utilizes Wilson’s (
52
) negative exponential formula, that is,
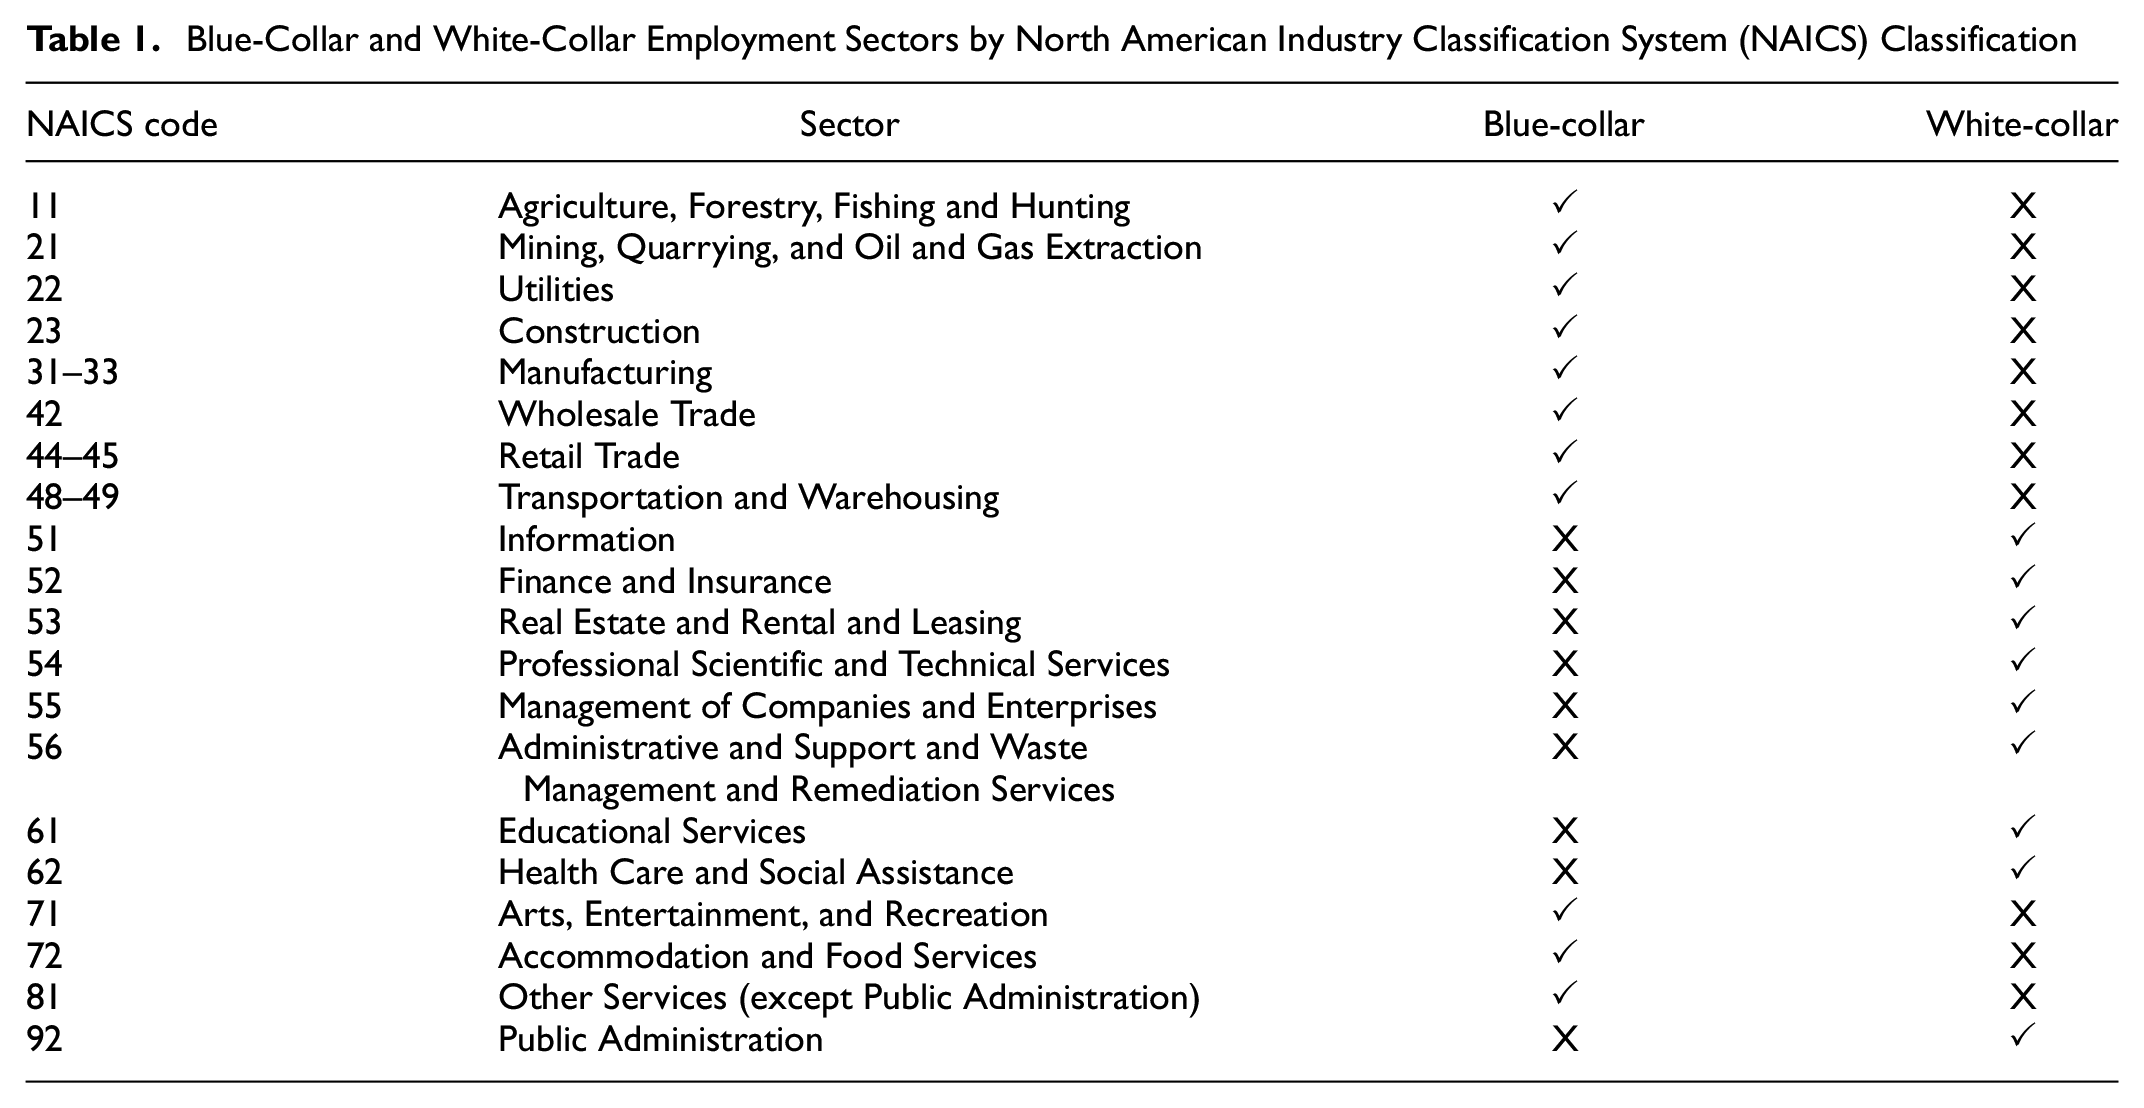
To arrive at blue- and white-collar job opportunities, we disaggregated the job opportunities into blue- and white-collar jobs following Guthrie and Fan’s ( 54 ) classifications based on North American Industry Classification System (NAICS) codes. They consider low-skilled laborers as blue-collar employees and high-skilled laborers as white-collar employees. Table 1 shows employment sector classifications by NAICS codes separated by blue- and white-collar jobs.
Blue-Collar and White-Collar Employment Sectors by North American Industry Classification System (NAICS) Classification
To incorporate competition on the demand side, we use ACS educational attainment data to classify workers into high-skilled laborers (with an associate degree or above) and low-skilled laborers (with a high school degree or lower). In addition, we employed the National Household Travel Survey (NHTS) data set ( 55 ), which provides person-level data on the educational attainment and commuting modes of sampled workers in an MPA. Using this data, we generated ratios out of the sample population for disaggregating the study area’s population into four categories. These categories are: (a) low-skilled laborers using cars, (b) low-skilled laborers using transit, (c) high-skilled laborers using cars, and (d) high-skilled laborers using transit.
Incorporating competition and matching in this manner enabled us to disaggregate our job accessibility measurements in blue- and white-collar accessibilities by automobile and transit modes, assuming that blue-collar and white-collar jobs match low- and high-skilled laborers, respectively.
Inequality Measurement
We apply Lorenz curve, Gini coefficient, and Atkinson indices for horizontal and vertical inequality assessments. The Lorenz curve is a graphical measure of cumulative income against a cumulative population that highlights inequalities based on the distance of the cumulative income from the perfect equality line ( 39 ). According to the literature, the Lorenz curve can be applied to any quantity that accumulates across a population. Transportation (accessibility) is one measure for which the Lorenz curve has been extensively used ( 40 ).
While the Lorenz curve offers a visual representation of inequity among the population, the Gini coefficient is a single mathematical measure of the overall degree of inequality for a population or its sub-group. The Gini coefficient (Equation 4) is the ratio of the area between the perfect equality line and the Lorenz curve, divided by the total area under the line of perfect equality ( 33 ).

where
Further, we apply the Atkinson index (Equation 5) for determining which end of the distribution contributes the most to observed inequality ( 56 ).

where xi is the observed benefit (accessibility) for each observation (TAZ), N represents several observations and ε is a parameter that determines the level of aversion toward inequality ( 36 ). An ε value of zero indicates no concern about inequality and as this value intensifies, sensitivity about inequality increases. This index’s advantage is that it is more sensitive to low values, especially for higher values of ε ( 57 ). Thus, we use the Atkinson index for our vertical equity analysis because areas with low accessibility are more important for us from an equity perspective.
Empirical Study
Study Area and Data Collection
Our study focuses on DFW’s 12-county MPA region, comprising Collin County, Dallas County, Denton County, Ellis County, Hood County, Hunt County, Johnson County, Kaufman County, Parker County, Rockwall County, Tarrant County, and Wise County. The regional highway and tollway system, the regional arterial system, and the regional transit system make up the DFW Metropolitan Transportation System. Frontage roads, High-occupancy vehicle (HOV) lanes, managed lanes, and controlled-access general purpose lanes are typical features of the regional highway and tollway system. The regional arterial system offers access and mobility assistance for DFW’s local population. This system enables access to other regional facilities from and to local land uses, acting as reliever services to parallel restricted access amenities. DCTA, DART, and Trinity Metro provide transit services in the DFW area.
DART provides several facilities in its approximately 700 square mile service area, including 145 bus routes, 93 miles of light rail transit (LRT), the Americans with Disabilities Act (ADA) paratransit, on-call zones, streetcars, and vanpools. Trinity Metro offers local and express bus lines, vanpools, ADA paratransit, shuttle service, and local bus service in Blue Mound and Fort Worth. Also, it operates the 27-mile TEXRail commuter rail line connecting downtown Fort Worth with Terminal B of DFW International Airport. The 34-mile Trinity Railway Express commuter service running between the DFW International Airport, downtown Dallas, and downtown Fort Worth is run jointly by DART and Trinity Metro.
Data collected for the study area were derived from four primary sources. The cartographic boundary for the 2010 TAZ boundary was gathered from the Census Bureau’s MAF/TIGER geographic database. We gathered the socio-economic data needed for accessibility calculations from the CTPP ( 58 ) database. Further, additional socio-demographic information required for equity analysis was gathered from the ACS database ( 59 ).
NCTCOG, which is DFW’s local MPO, represents the 16-county region with 4,573 traffic simulation zones (TSZs). However, NCTCOG offers transportation planning data only for the 12-county MPA region. In addition to the TSZ files, NCTCOG provided an origin–destination (O-D) peak-hour travel time matrix for transit and automobile HBW trip purposes. Our study’s employment data set relies on the 2012–2016 five-year estimates from the CTPP, and the data on Race, Hispanic Origins, Industries, and Mean Travel Time by means of Transportation to work were available at the TAZ levels. Furthermore, 2015 ACS estimates data helped in accomplishing equity analysis. This data includes educational attainment, automobile availability, income, unemployment, English proficiency, population distribution by race, disability ratio, single-parent households, and age groups below 18 and over 65. While these data components were available at the census tract level, they were converted into TAZ level data in the GIS environment since TAZ is the geographic unit of analysis.
The next sections discuss the empirical findings from our equity analysis framework. First, we explore our preliminary accessibility measurement results. Next, we discuss the horizontal equity analysis results of our accessibility measures, followed by a vertical equity analysis with respect to income and race.
Preliminary Results
We apply Equation 3 to calculate job accessibility for employment seekers traveling by automobile and transit. Figure 2, a and b , highlights the employment accessibility of white-collar/blue-collar job seekers using automobiles and transit as the primary commuting mode.
We find that job accessibility varies amongst blue-collar automobile accessibility (BCA), blue-collar transit accessibility (BCT), white-collar automobile accessibility (WCA), and white-collar transit accessibility (WCT). The job accessibility values (whether separated by job type or commuting mode) remained high in Dallas and Tarrant Counties and some areas of Denton and Collin Counties compared with other counties. The reason for this is that these counties accommodate DFW’s main employment centers and have a well-established transportation infrastructure compared with others.
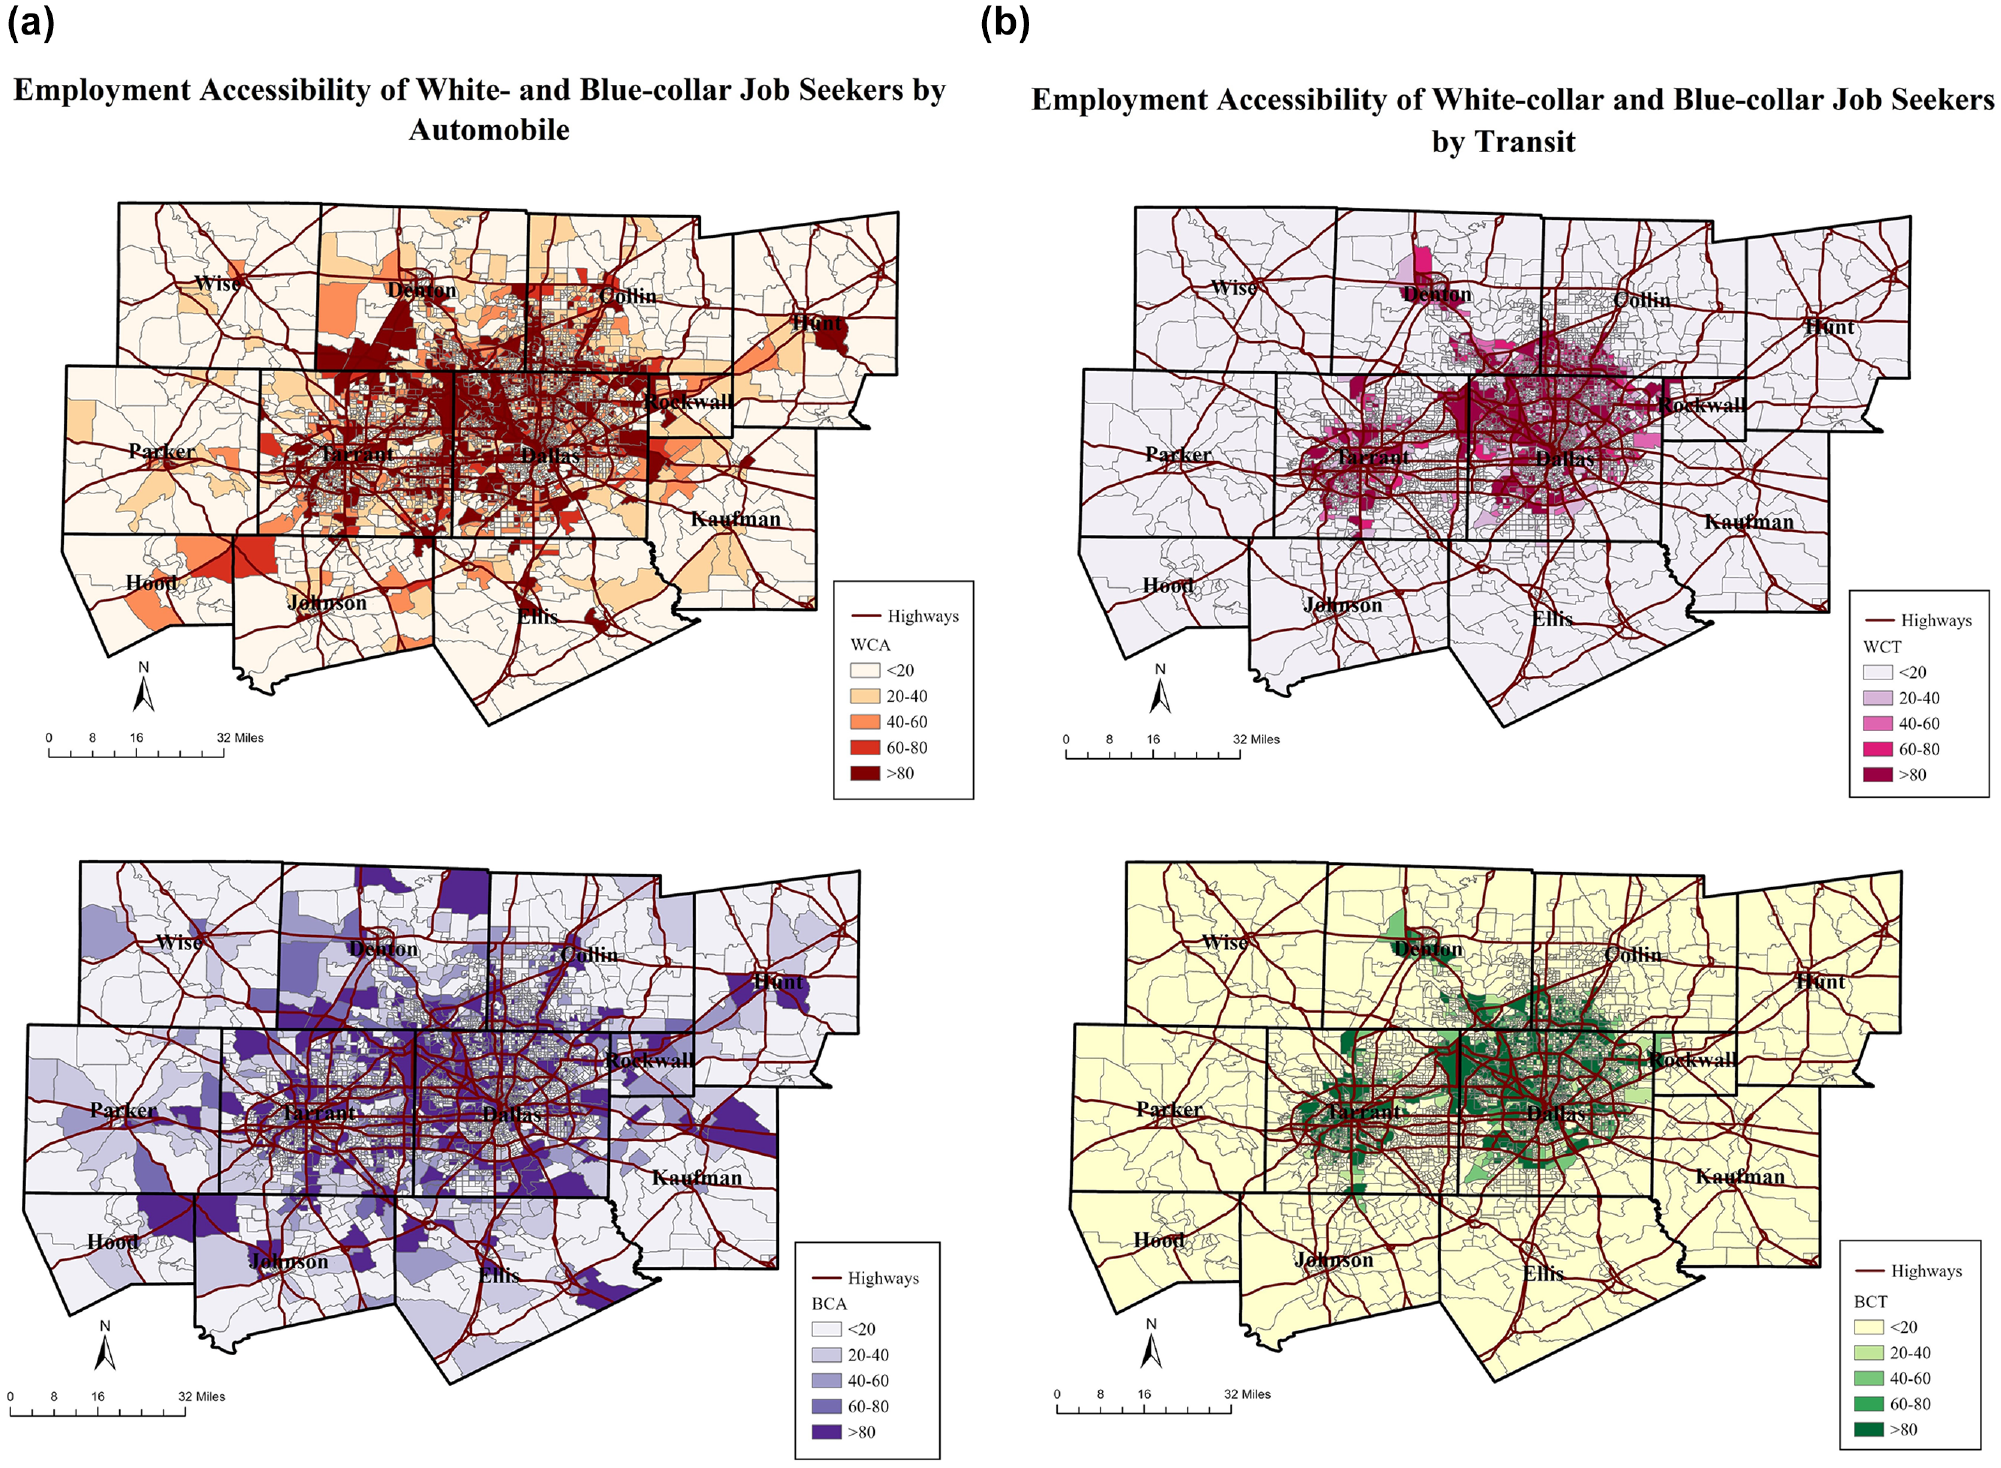
Employment accessibility of white-collar and blue-collar job seekers (a) by automobile and (b) by transit.
Further, we find that job accessibility values for two kinds of job seekers in transit as a commuting mode diminish outside the boundaries of these four counties. This is because significant transit services are limited to Dallas, Tarrant, Collin, and Denton Counties. Further, we separated the job accessibility types according to the specifications of EJ areas by race and income (Table 2).
Descriptive Statistics for Automobile and Transit Accessibility (Disaggregated by Race and Income)
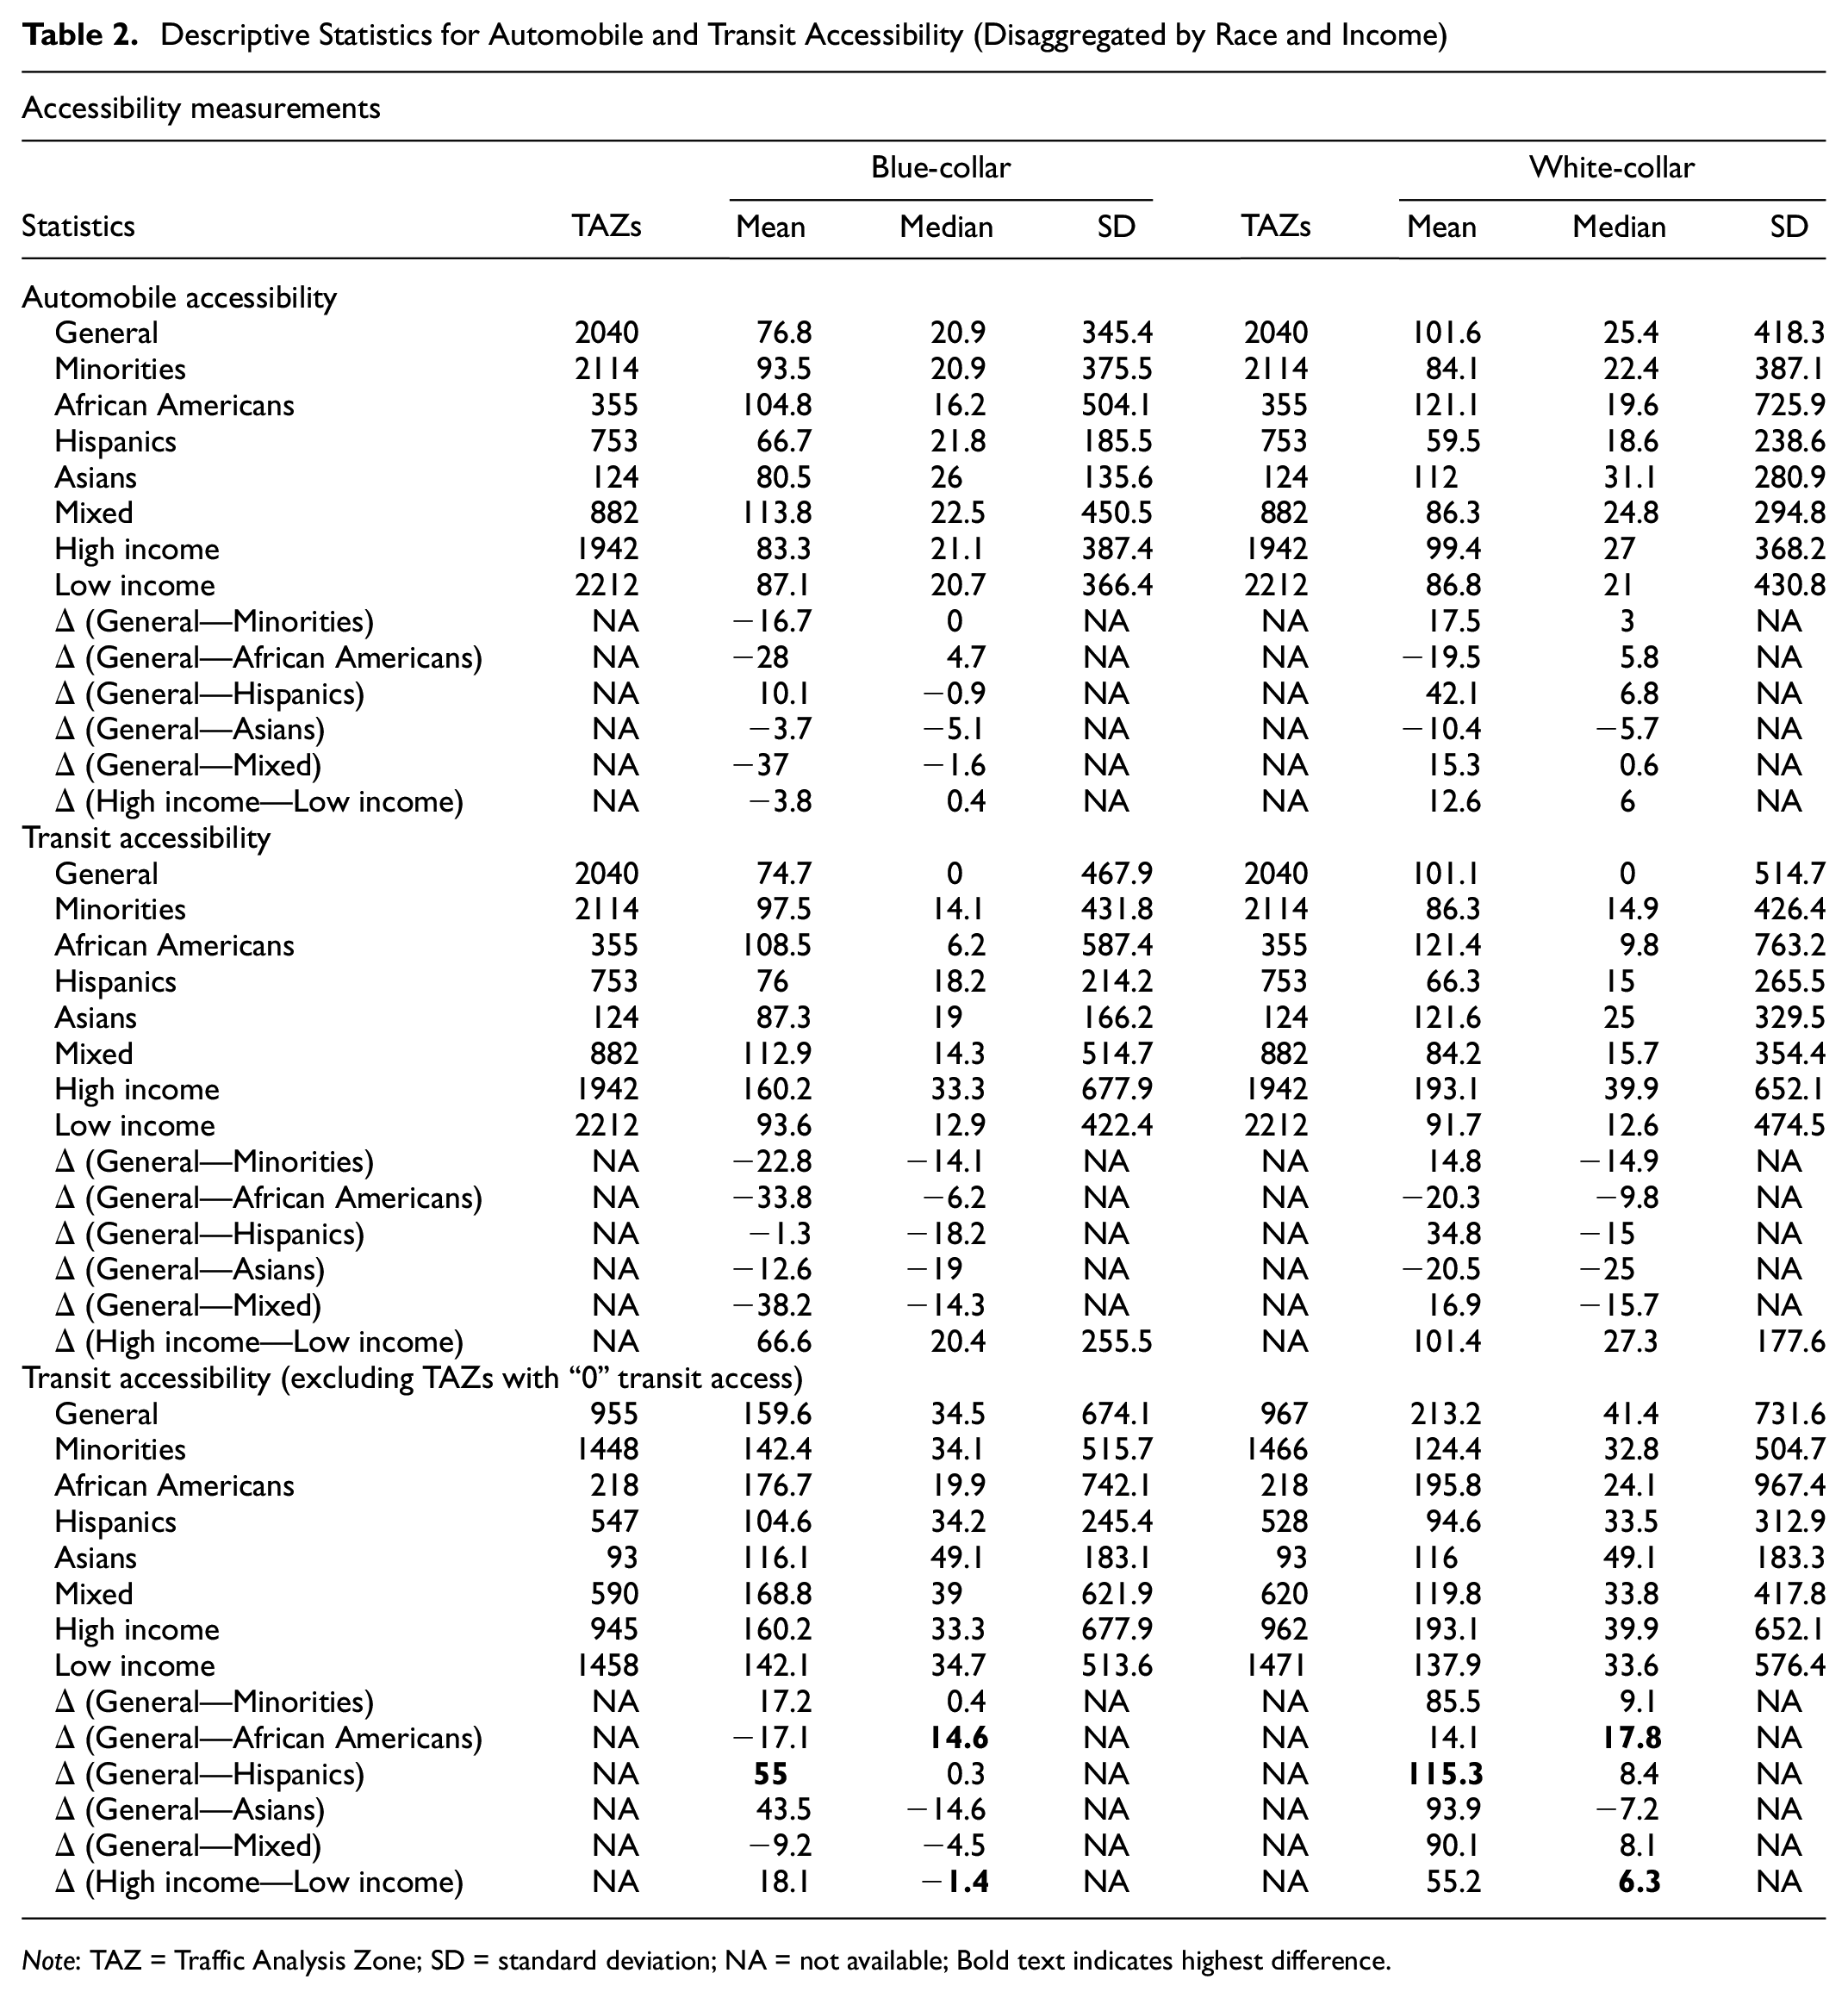
Note: TAZ = Traffic Analysis Zone; SD = standard deviation; NA = not available; Bold text indicates highest difference.
To highlight the disadvantages minority and low-income TAZs face, we compared the values of BCA difference, BCT difference, WCA difference, and WCT difference between the general-population dominant TAZs and the TAZs dominated by different racial categories, namely, African Americans, Hispanics, Asians, and Mixed.
When comparing BCA and WCA, we found that Δ (General—African Americans) sample had the highest positive median values. Similarly, when we calculated the variations in the BCT and WCT difference, we found that the mean was high and positive for all comparison samples. In contrast, the median was negative for all comparison samples. This was because most general-population dominant TAZs lacked transit access. We found comparable results when we compared the difference in transit accessibilities between high-income dominant TAZs and low-income dominant TAZs. Our accessibility analysis highlights that most general-population dominant TAZs and high-income dominant TAZs had limited transit access, except for a few.
Thus, we removed the TAZs with zero transit accessibility values from the general-population dominant TAZs. We recalculated the BCT and WCT accessibility difference using the remaining general-population dominant TAZs and the TAZs dominated by different racial minorities. Again we found that the Δ (General—African Americans) sample had the highest positive median values. We applied a similar framework when comparing the differences in transit and automobile accessibility measures between high-income and low-income groups and found that the difference was positive. These comparisons reveal that African American and low-income communities had higher automobile and transit accessibility disadvantages than other communities.
Horizontal Equity Analysis
All observations are treated as equal and with no special consideration for any population group in horizontal equity analyses. To achieve this, we compare accessibilities calculated utilizing then Lorenz curve and Gini coefficient. Our horizontal equity analysis results show that BCT and WCT are distributed unequally in DFW compared with BCA and WCA. This mismatch is because most TAZs have limited/no transit facilities. The Gini coefficient for BCT and WCT is around 0.88, while the BCA and WCA have a Gini coefficient of around 78%. Comparing the Gini coefficient for each travel mode highlights the disproportionate distributions of accessibilities, especially for transit and the serious barriers that the population face when using transit. For instance, around 80% of BCT and WCT is distributed between only 10% of total population. Moreover, BCT has a slightly more equal distribution as DFW’s blue-collar jobs are more spatially dispersed than white-collar jobs. Also, around 80% of BCA and WCA is shared by almost 20% of total population. Probably, mobility-based transportation planning, low density, and horizontal dispersion of job opportunities may cause such unequal accessibility distributions. Figure 3 plots the Gini coefficient for comparison purposes. BCA and WCA show similar Gini coefficients as well as BCT and WCT.
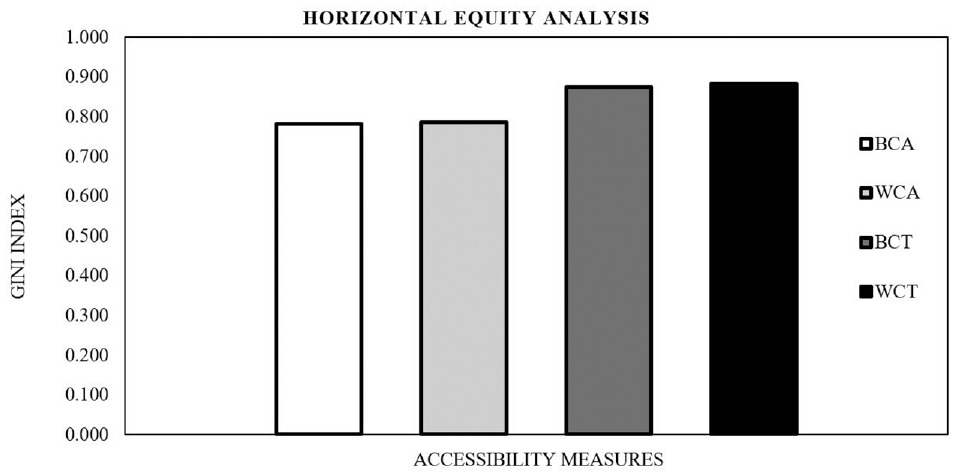
Bar chart of Gini coefficient against accessibility types.
Vertical Equity Analysis
So far we have explored job accessibility appending a horizontal equity framework treating all TAZs equal, without assigning any demand-based considerations or relative weights. To address this issue, we perform an indicator-based vertical equity analysis. Our socio-economic indicator choices relied on data availability, the indicator’s significance, literature, and our intuition.
Vertical Equity Analysis With Respect to Income
The vertical equity notion suggests that certain population groups have limited access to transportation benefits and more exposed to burdens. Thus, a special consideration should be placed on them in policies and programs. Income and poverty are crucial equity indicators for which benefit/cost disparities are analyzed frequently. Here, we first categorize the census income data into high-income and low-income TAZs and assess vertical equity. Figure 4 shows the Atkinson inequality measurement results.
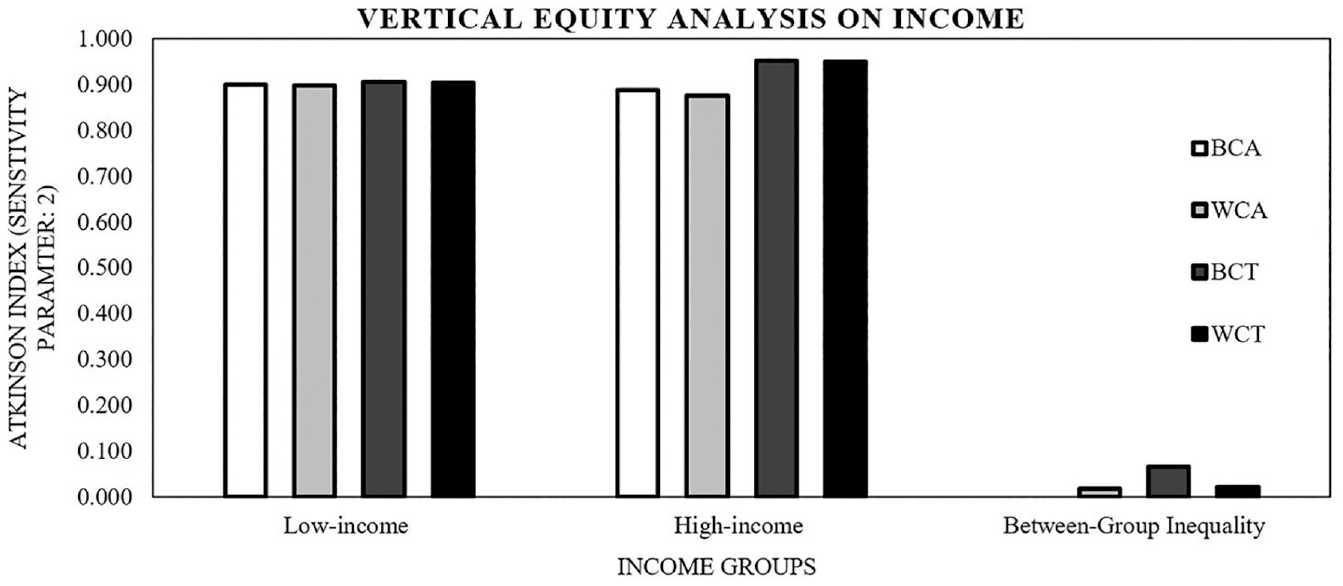
Plot of vertical equity analysis with respect to income (Atkinson within and between group measure).
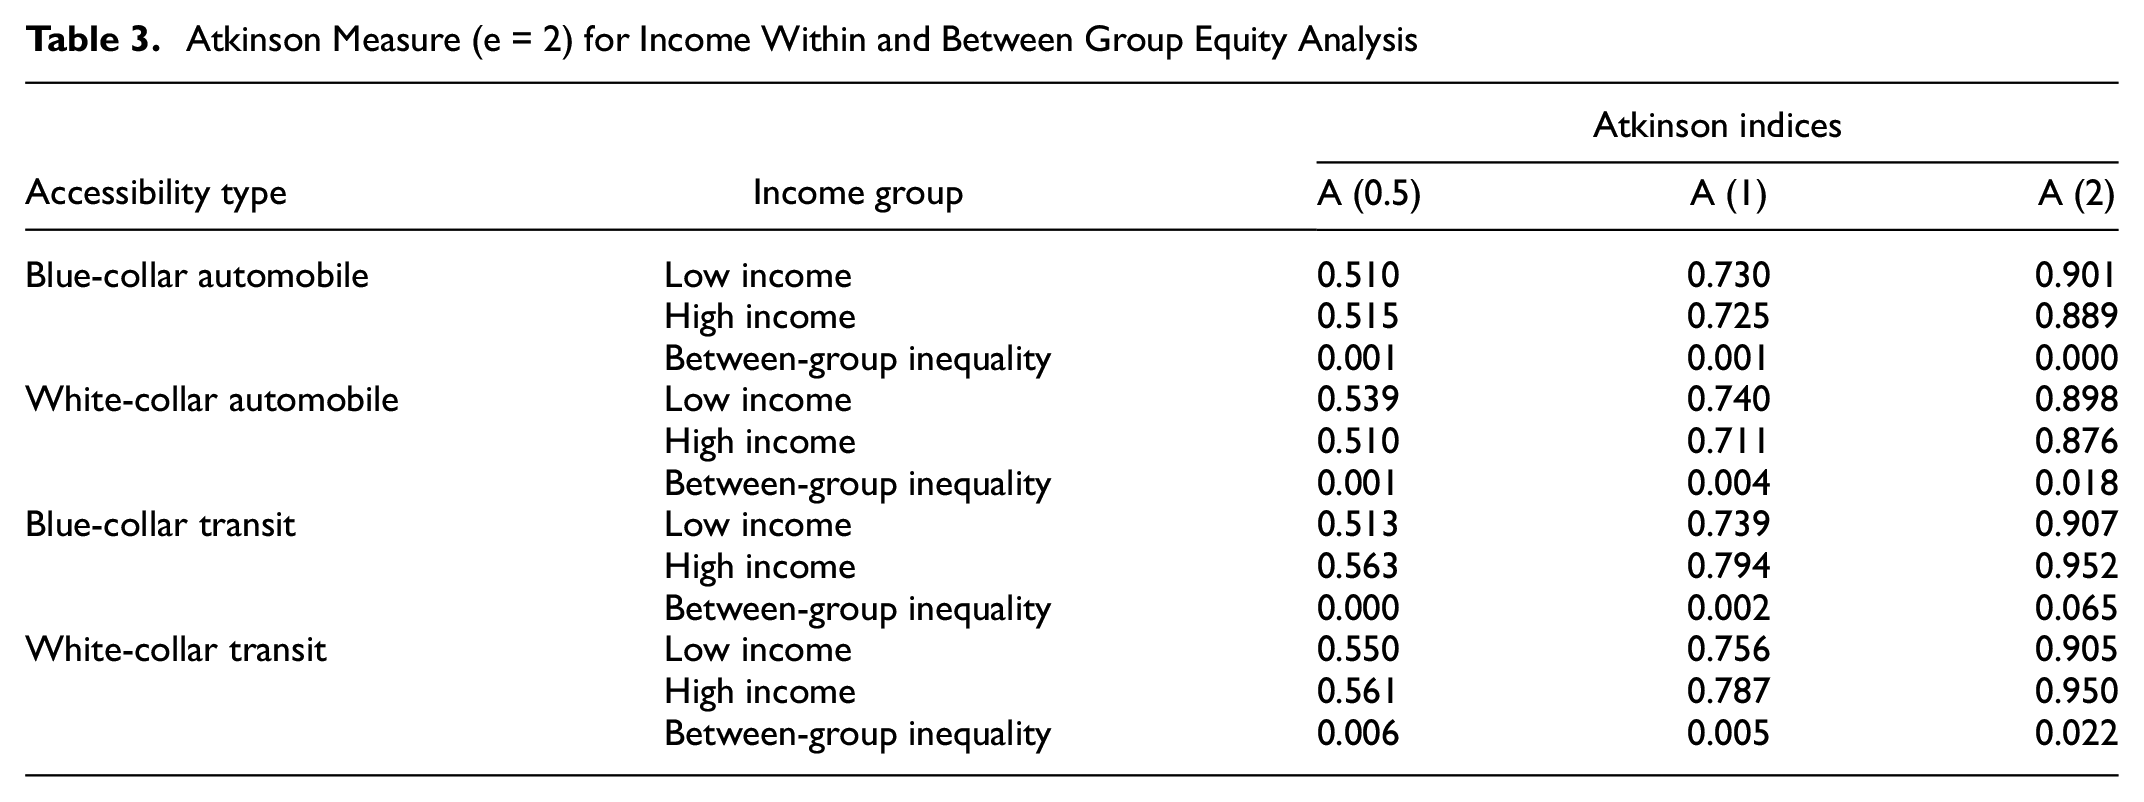
Table 3 reports three Atkinson measures with three income difference sensitivity parameters. However, only measures with ε value of 2 are visualized. This is because several spatial forces influence accessibility, leading to a higher accessibility concentration in some small TAZs. Thus, higher ε values better illuminate disproportionate accessibility distributions. Our vertical equity analysis results incorporating income highlight interesting results. We find that the Atkinson index value for both income categories is the same for car accessibility. Low-income groups have lower transit accessibility inequality which is a desired outcome. Transitioning from 0.5 to 2 for ε, Atkinson index increases significantly for accessibility types, confirming that extremely high accessibility deprivation exists among bottom percentile groups. Moreover, between-group equity analysis results show an even distribution across the two groups.
Atkinson Measure (e = 2) for Income Within and Between Group Equity Analysis
Vertical Equity Analysis for Race
Race is a highly cited indicator in transportation equity. To perform vertical equity analysis for race, all TAZs were categorized using criteria (a) of our population measurement subsection. The results are summarized in Figure 5 and Table 4.
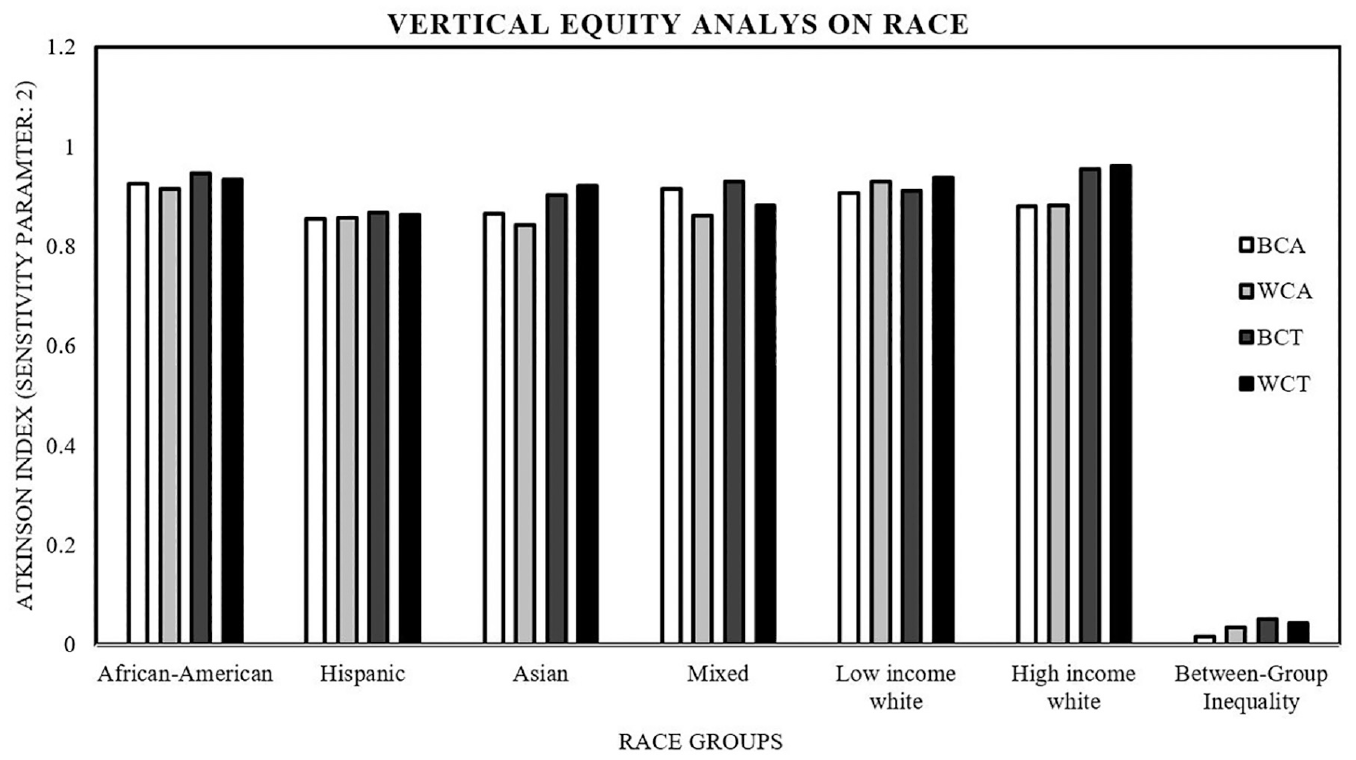
Plot of vertical equity analysis for race (Atkinson within and between group measure).
Atkinson Measure (e = 2) for Race Within and Between Group Equity Analysis
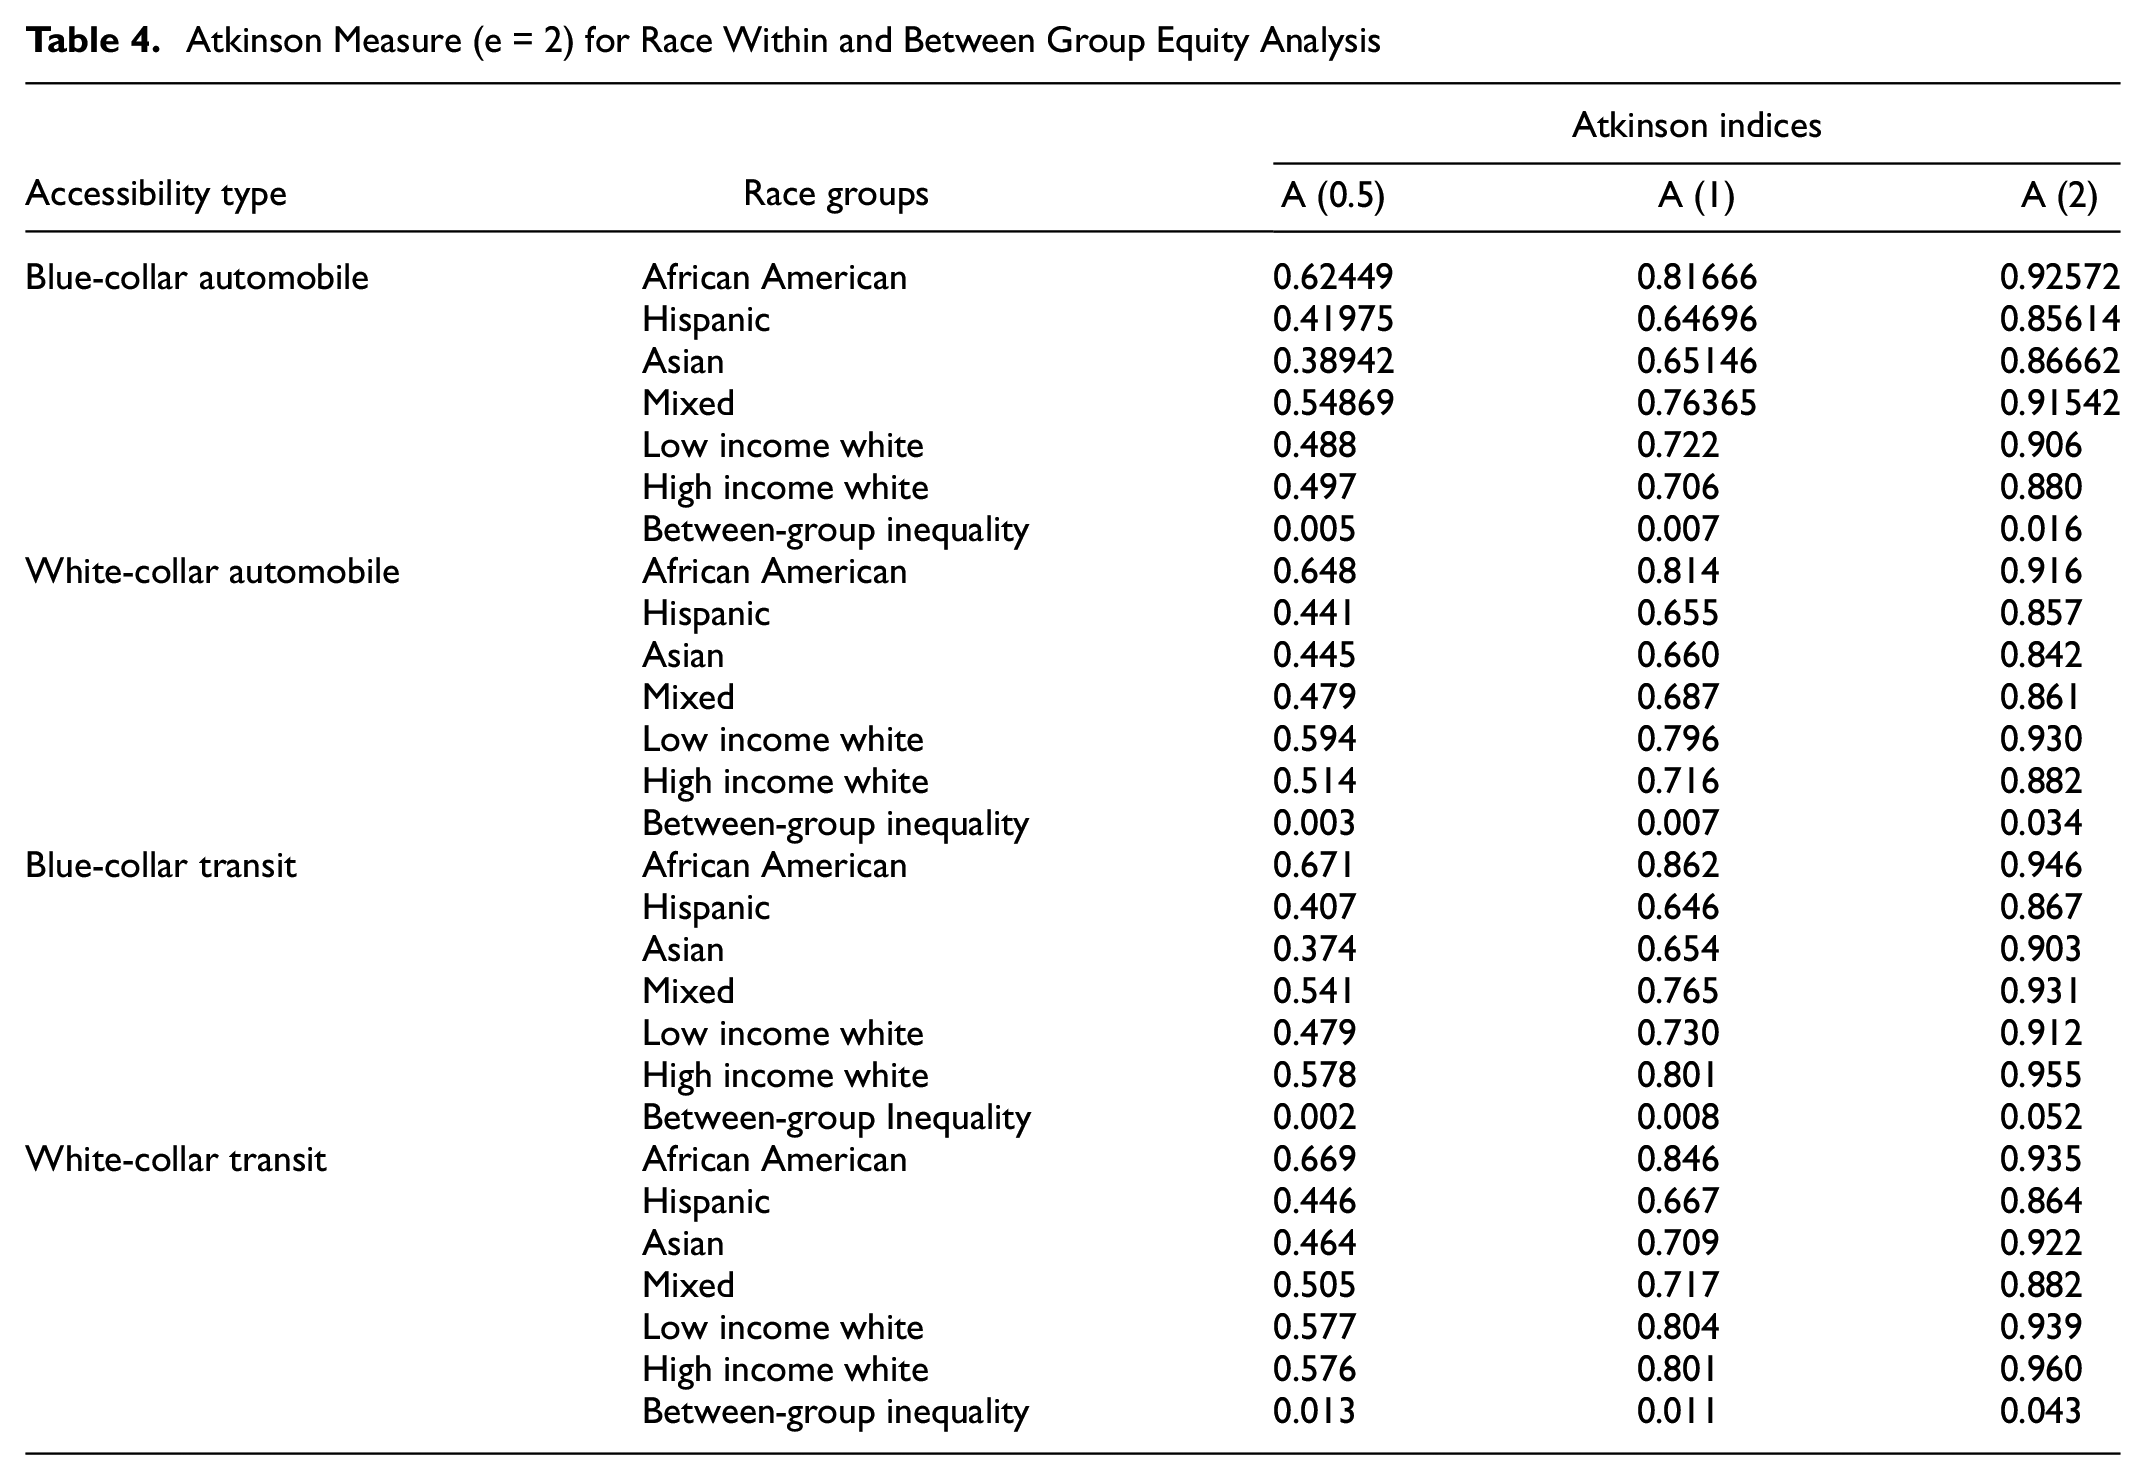
Our race equity analysis results yielded some insightful findings. First, as Figure 5 shows, the highest within-group inequality exists among the TAZs dominated by African American population. Thus, equity issues for African American groups are more serious than for other racial groups. The next highest inequality is found amongst mixed-races-dominant and low-income white TAZs. We also find that BCA and BCT have higher inequalities in Hispanic and Asian communities, which indicates that most Hispanic and Asian job seekers with fewer skills and job experience have trouble accessing job opportunities. Also, high-income white communities have the highest transit inequality as they reside in suburbs having limited transit amenities. With regard to between-group analysis, transit is unequally distributed for WCT and BCT, respectively. Moreover, based on the between-group analysis for race and income, we find more critical equity issues on race than income.
Conclusion and Policy Implications
Our horizontal and vertical equity analysis outcomes indicate that inequity in job accessibility remains an important issue in DFW. Conventionally, disadvantaged populations in American cities face more barriers in accessing different activities than the general population. In equity analysis, identifying communities within and across different population groups is crucial. Likewise, our equity analysis used the two most cited equity indicators, that is, race and income, to classify the population. Next, appropriate equity measurement techniques such as Lorenz curve, Gini coefficient, and Atkinson indices help quantify and visualize transportation benefits/cost disparities. Accessibility as a transportation service quality metric is measured and analyzed in this study to accomplish our target.
Our horizontal equity analysis shows that for both blue-collar and white-collar jobs transit accessibilities are less equally distributed than private cars. These results have interesting policy implications. In DFW, most transit services are limited to a small area; our maps show that most areas have zero transit accessibility. To improve transit accessibility, extending transit lines in low-density areas may not be economically feasible. Instead, improving access to transit services through programs like subsidizing shared on-demand services to public transit services may reduce the impedance for transit services, road congestion, and pollution. We do not find significant disparities for white- and blue-collar accessibilities. However, both job types are less accessible if the commuting mode is transit.
Further, we perform within and between vertical equity analysis for income and race. The vertical analysis results for income showed no significant difference in job accessibility for the two income categories. Nevertheless, low-income communities experience higher inequality automobile job accessibility. Such inequalities can be reduced by encouraging more employment center concentrations in low-income neighborhoods. This would increase job accessibility in low-income communities and reduce automobile dependence.
Vertical equity analysis incorporating race also revealed useful information. African Americans have the highest inequality, followed by racially mixed communities because many African American communities have reduced automobile access. Thus, most prefer to reside near the central business district to be closer to job centers. Comparatively, Asian communities are clustered along transportation lines, whereas Hispanic communities are dispersed out. Amongst minorities, comparing job inequality measures in both transportation modes, we found unequal blue-collar job accessibility distributions. This finding is crucial as studies have shown that minorities have limited employment options. Thus, provision of fair distribution of job types should be a priority for transportation planning. The between-group equity analysis highlighted higher disparities amongst between racial groups than income groups. Thus, if inclusion and justice are transportation planning goals, racial groups should be prioritized more in regional transportation plans than income groups.
Our study contributes to transportation equity literature in two directions. First, no study has analyzed job accessibilities separated by job type and commuting mode simultaneously. Our study showed that such disaggregation could provide helpful insight into transportation equity. Secondly, while several studies have employed conventional inequality measurements for equity analysis, we introduce between-group inequality assessment using the same methods. Such a measure helps detect disparities among populations using different indicators.
Our study has some limitations. First, we have only considered two travel modes for measuring accessibility, but other modes such as walking, biking, and so forth also influence job accessibilities. Secondly, we have performed a vertical equity analysis by incorporating race and income as EJ factors. However, other factors like car availability, educational attainment, and disability can be analyzed using our framework. Finally, we categorized socio-economic factors into a few classes while performing vertical equity analysis; however, scholars may also try using a continuous form of these variables to represent relative weight (transportation demand) for each observation.
Footnotes
Acknowledgements
The authors would like to thank and acknowledge their partners and data sources in this effort, North Central Texas Council of Governments (NCTCOG) for providing required data and their support. The authors would like to also thank Dr. Taylor Li and Dr. David Abraham for their valuable feedback throughout the research.
Author Contributions
The authors confirm contribution to the paper as follows: study conception and design: S. Sharifiasl, S. Kharel; data collection: S. Sharifiasl, S. Kharel; analysis and interpretation of results: S. Sharifiasl, S. Kharel; draft manuscript preparation: S. Sharifiasl, S. Kharel, Q. Pan. All authors reviewed the results and approved the final version of the manuscript.
Declaration of Conflicting Interests
The author(s) declared no potential conflicts of interest with respect to the research, authorship, and/or publication of this article.
Funding
The author(s) disclosed receipt of the following financial support for the research, authorship, and/or publication of this article: This research was funded by the Center for Transportation, Equity, Decisions, & Dollars (CTEDD) for the completion of "Embracing Emerging Internet-Based Traffic Big Data in Smart City Applications to Improve Transportation Systems Efficiency, Safety, and Equity" (Project ID: CTEDD 021-07), Entech Civil Engineers, Inc./Harris County Toll Road Authority (HCTRA) for developing a Transportation Equity Framework for transportation project evaluation, resilience, transportation mobility, and accessibility analysis, and the Cooperative Mobility for Competitive Megaregions (CM2) Center for the development of megaregion transportation planning model.