
Abstract
When making trips in urban environments, cyclists lose time as they stop and idle at signalized intersections. The main objective of this study was to show how augmenting the situational awareness of traffic signal controllers, using observations from moving sensor platforms, can enable prioritization of cyclists and reduce lost time within the control cycle in an effective way. We investigated the potential of using observations from connected autonomous vehicles (CAVs) as a source of new information, using a revised vehicle-actuated controller. This controller exploits CAV-generated observations of cyclists to optimize the control for cyclists. The results from a simulation study indicated that with a low CAV penetration rate, prioritizing cyclists by tracking reduced cyclist delays and stops, even with a small field of view. As the delay of car directions were not taken into account in this study, the average car delay increased considerably with an increasing number of cyclists. Future work is needed to optimize the control that balances the delays and stops of cyclists and cars.
Keywords
To make mobility systems greener, safer, fairer, more efficient, and ultimately cheaper, traffic and transportation systems must continue to be geared toward multimodal strategies. When making trips in urban environments, motorized vehicles, cyclists and pedestrians lose time when they stop and idle at signalized intersections. This increases the level of discomfort for cyclists, especially during complete stops, where at least one foot has to touch the road ( 1 ). This is relevant because we know that the number of cyclists in cities increases with lower levels of discomfort along the bike network ( 2 ). The impetus to reduce delays for cyclists at signalized intersections has recently been drawing increasing attention from the traffic community ( 3 , 4 ). The objective of this study was therefore to investigate the potential of early cyclist detection for responsive signal control that prioritizes cyclists, so this mode of transport will experience fewer stops and long delays.
In the Netherlands (NL), signalized intersections are managed by vehicle-actuated (VA) control. VA control uses information about the current traffic state to control the use of conflict areas, that is, the areas where two conflicting movements meet. The order in which opposing directions receive green is based on a fixed control structure, with stages of nonconflicting movements constructed with the aid of pairwise conflicts ( 5 ). The order of the phases is red–green–yellow, and yellow time is based on the speed of the traffic and the distance within which traffic can choose whether to proceed or stop, the so-called dilemma zone. Actuation is mostly done by means of loop detector information ( 6 ). VA control is phase controlled, in which the green duration of an individual movement is determined by the occupation of its detectors. Although multiple detectors are recommended for all traffic modes ( 7 ), two to three inductive loops are typically used upstream of the intersections for cars, whereas for cyclists, only one inductive loop is used, placed near the stop line.
More recently, VA control has been extended to enable certain movements to be prioritized, that is, VA control with priority (VAP). These extended, “intelligent” traffic light controllers (iTLCs), are enhanced by communication with the traffic ( 8 ). The aim of iTLCs is to inform the approaching traffic, to optimize control, and to prioritize target groups. For example, a public transport vehicle, a truck, or an emergency vehicle can initiate the end of green time of conflicting movements to pass as soon as possible. Similarly, VAP can be used to prioritize cyclists based on conditional priority, for example, with rain sensors that are used to prioritize cyclists during rainfall only ( 9 , 10 ). Eventually iTLCs will improve estimation of traffic states ( 11 ). Communication with cars is done via onboard computers or mobile apps, whereas cyclists rely on communication enabled by radar at a fixed location (12), or from smartphone apps ( 13 ). The number of cyclists using mobile apps, however, is still low as not all cyclists are willing to use an app or remember to initiate them ( 13 ). This mismatch results in a higher proportion of cars than cyclists communicating with the iTLCs.
Because cycling is encouraged in the NL ( 6 , 14 ), more solutions are needed to balance out the lack of information about cyclists approaching intersections. Eventually, this will make it possible to prioritize this environmentally friendly traffic mode more effectively than is currently the case. Other solutions to increase traffic controllers’ situational awareness of cyclists include installing additional sensing infrastructure, for example, extra detector loops, fixed cameras, or radars ( 4 ). This approach, however, comes at a considerable cost from deployment and maintenance ( 15 ).
Recent studies have utilized connected automated vehicles (CAVs) as a means for learned ecodriving control policies to reduce idling time at signalized intersections ( 16 ). The broad sensing, processing, and communication capabilities of CAVs make them well-suited to advanced traffic monitoring and control applications. As they must continuously sense the environment in which they operate, CAVs may also provide relevant traffic information about cyclists, and could thus be utilized as mobile sensing platforms ( 17 ). Observations generated from their field of view can be shared using wireless communication with nearby vehicles (e.g., for cooperative vision) or infrastructure such as traffic signal controllers (e.g., with iTLCs). The benefits of using observations from CAVs is that the position and speed of cyclists could be observed by multiple CAVs at different locations (e.g., to confirm their presence at a location), and cyclists would not need to use traffic-related apps. However, since prioritization of cyclists may increase the delay of other traffic modes, robust observations are necessary to avoid giving them priority too early or for too long.
The main aim of this study was to show how augmenting the situational awareness of traffic signal controllers using observations from CAVs could enable prioritization of cyclists and reduce lost time in the control cycle in an effective way. The current study makes the following contributions:
Proposes a control method that uses available cyclist observations from moving sensor platforms (here exemplified by CAVs) to prioritize and optimize traffic conditions for cyclists;
Quantifies the effect on cyclist and car delays, on the number of stops and on effective green use for cyclists, for different levels of car and bicycle demand;
Highlights the extent to which different traffic and environmental conditions might influence these results (i.e., CAV settings, penetration rate, occlusion); and
Shows how observing the absence of cyclists appears to be valuable controller information (e.g., reducing lost time by phase truncation).
We showcase this with a VA control application that prioritizes cyclists, and uses a microscopic traffic simulator to simulate cyclists and car traffic approaching a signalized intersection. Note that in this work we considered cyclists to be indistinguishable from each other, that is, no additional information from sensors (e.g., clothing color) that could help strengthen discrimination between different cyclists was given. Available observations from CAVs were used to estimate the dynamic states (i.e., positions and speeds) of an unknown and varying number of cyclists using a multiple-target tracking (MTT) approach. Detector information was then augmented with estimated cyclist states as input for the cyclist priority request logic of the proposed cyclist prioritizing vehicle-actuated controller with tracking (VAT). The cyclist and car delays from the implemented VAT were empirically evaluated against state-of-the-art VA and VAP controllers. This work promotes optimized designs that will better balance delays in more involved traffic situations.
The remainder of this paper is organized as follows. The next section gives an overview of the proposed VAT approach. We then describe the MTT approach used to track cyclists from individual observations and present the related models that were used in this study. Models used for priority requests and lost time reduction in the control cycle are introduced in the fourth and fifth sections. The experimental design and simulation setup are presented in the sixth section, followed by the results from the empirical evaluation. Conclusions and suggestions for future work are presented at the end of the paper.
Approach
The objective of the proposed method was to use additional information from moving sensor platforms to inform, prioritize and optimize intelligent traffic signal controllers. The term moving sensor platform here refers to a general description of technological subsystems that generate data about their surroundings for their safe functioning (e.g., CAVs, drones, or other types of robots). Later in the paper, we will describe the proposed approach based on CAVs in a simulation. The general idea and main elements of our approach are outlined in this section and depicted in Figure 1.
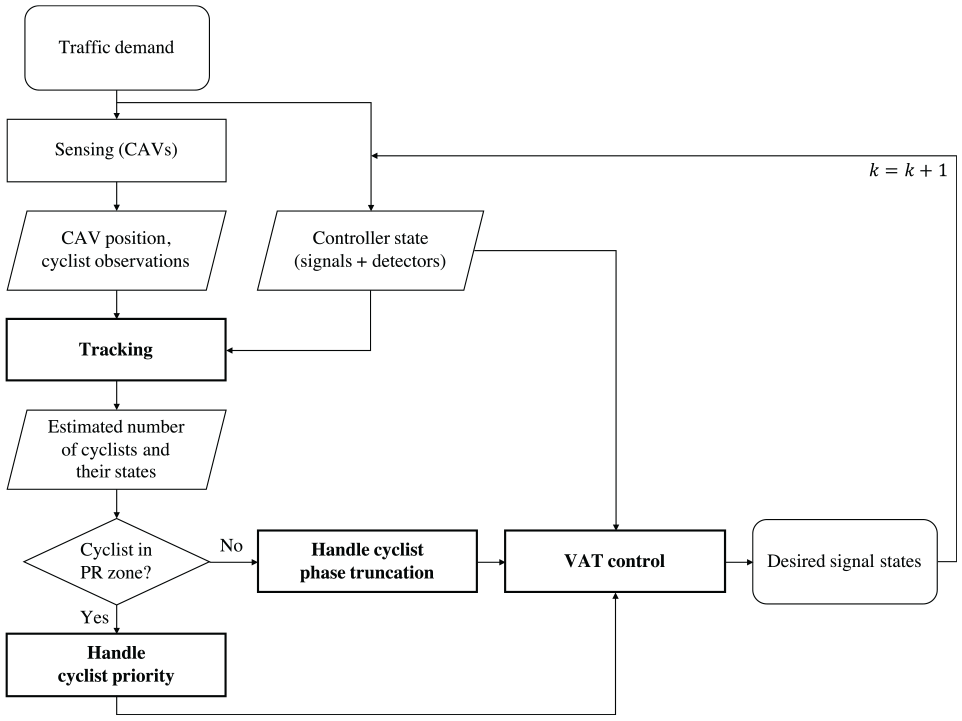
Bicycle priority vehicle-actuated control with tracking (VAT) using observations from moving sensor platforms (e.g., connected autonomous vehicles [CAVs]).
When a cyclist enters the field of view (FoV) of a sensor platform, an observation may be generated. Based on the architecture of iTLCs, in which road users share their position, speed, and intended route by wireless communication with the traffic controller ( 18 ), this work assumed sensor platforms to similarly share available observations of cyclists with the traffic controller. For the traffic controller to make use of available observations over time, the dynamic state of observed cyclists (e.g., position and speed) must be estimated along the cycle path so that, at a suitable moment, the priority request of the signal controller can be activated. The way iTLCs process the input from sensor platforms to grant priority to individual cyclists, or a platoon of cyclists, is comparable to the way data from static cameras or radar are handled. An example where bicycle priority is applied using smart cameras detecting bicycle platoons of three or more cyclists can be found in the municipality of Hengelo (NL) ( 19 ), whereas bicycle priority using cyclist observations from static radar was applied in the municipality of Delft (NL) ( 12 ).
The unknown and varying number of cyclists complicates the task of associating available observations with the cyclists present on the cycle path. In addition, sensor platform observations are not perfect. They may be “noisy,” include clutter, or miss a cyclist because of occlusion. And with no a priori information about which observation originated from which existing or newly detected cyclist, the many possibilities of assigning a measurement to an individual complicate the task. We therefore used an MTT approach to infer the number of cyclists present on the cycle path and estimated their dynamic state at each time instant.
For the case in which cyclists were estimated to be located in the priority request zone (i.e., the area upstream of the traffic signal where the decision about cyclist priority is made) a priority request logic was initiated. The VAT controller then ended green time for conflicting traffic at the next possible moment, and the desired signal state (i.e., green) was set for the cyclists. In this way, cyclists could be prioritized earlier; unlike VAP, where cyclists had to continue up to the stop line and come to a complete stop before priority was granted. For the case in which cyclists were estimated not to be in the defined priority request zone, a phase truncation logic was initiated that reduced the lost time in the control cycle.
Inferring the Number and States of Indistinguishable Cyclists
For the traffic signal controller to act according to information provided from the sensor platforms’ FoV, we used an MTT approach to infer the number of cyclists and estimate their dynamic states (e.g., position, speed) from a sequence of available observations. MTT is an extension of the state estimation problem that includes a data association component, because which observation originated from which cyclist is not known, not to mention which observations were clutter or missed detections. In this section, we introduce the MTT approach used, relevant state–space models, and discuss the applicability and assumptions made using this approach in a traffic signal control setting.
Road Network-Constrained Multiple Hypothesis Tracking
We used the network-constrained multiple hypothesis tracking (NC-MHT) approach proposed in research by Vial et al. ( 19 ) to update the information about a target’s position along a defined road network from a temporal sequence of observations.
At each time step, an association event represented a set of valid assignments of observations to existing tracks (of already observed targets), new targets, or false observations, in which a track corresponds to a data association sequence,
A complete solution to the MTT problem is given by a global tracking hypothesis, which represents the inferred number of targets and their respective states along the road network. We refer the interested reader to the original work ( 19 ) for more details on, for example, data association logic, track likelihood computations, or handling of the road constraints, as we focus on the target state description and estimation models for the rest of this section.
State–Space Models
Let us assume that cyclists evolve independently of each other and that the state of each cyclist at time

where the actual position of the cyclist is a combination of the general position determined from the map,
Cyclist Motion Model
A nonlinear dynamic model describes the motion of each cyclist, such that

where
The kinematic state motion model of cyclists approaching the intersection follows linear constant velocity if not within a human-vision distance to the traffic light.
Conversely, within human-vision distance to the traffic light, we assumed signal status to have an effect on cycling behavior. We used a simple model that describes cycling movements in response to the color of the traffic light, as proposed in Dabiri et al.’s study ( 20 ). The acceleration/deceleration of a cyclist is represented as follows:
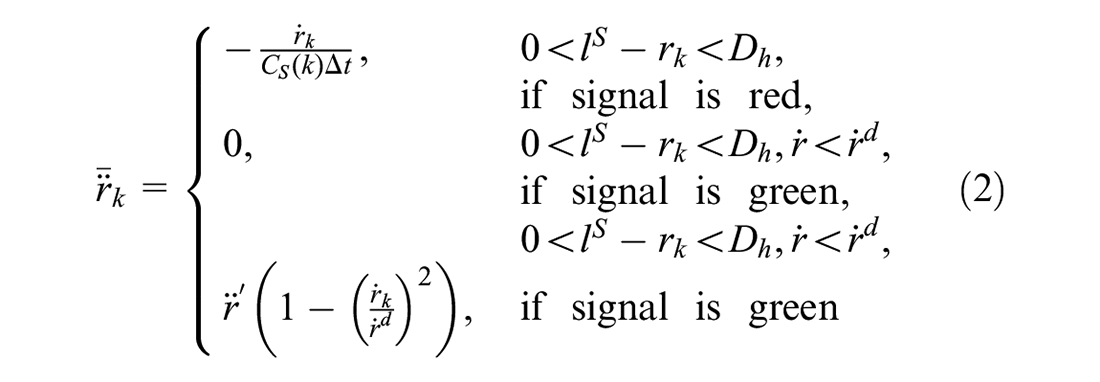
where
And

where
For the case in which the cyclist had passed the intersection, the kinematic state motion model followed a constant velocity if cycling at comfortable speed, otherwise acceleration was represented according to the last case of Equation 2.
Observation Model
Let us assume the moving sensor platforms have a limited FoV, a known position along the road network, and that observations can be generated at any time. Each observation originates from a single cyclist, or is a false detection. When a cyclist is visible to a sensor platform at time
Note that the absence of observations represents a valuable source of information, because the track hypotheses score is lowered when the target is not observed as expected. This helps to reduce the number of track hypotheses that require consideration.
State Prediction and Update
As stated, tracks were estimated using Bayesian filtering following prediction steps or updates in case they were associated with an observation. We used an extended Kalman filter ( 21 ) in cases of nonlinear motion, and the standard Kalman filter ( 22 ) for linear cases. When an observation is obtained, the continuous part of the cyclist state can be updated, provided the discrete state is accessible from the observation. If no observation is available, the update step is simply skipped, and if several are available, the step is repeated. We refer the interested reader to Vial et al.’s study ( 19 ) for more details on network-constrained effects and assumptions in the context of the NC-MHT framework.
Applicability and Assumptions in a Traffic Signal Control Setting
The flexibility of the NC-MHT framework, particularly the formulation of the network-constrained target state, made it generally suitable to associate available measurements with cyclists present on the cycle path. Compared with more standard MTT approaches in free space, the inclusion of network constraints allowed for more efficient target predictions over extended periods of time and simplified the measurement association process. As this work considered moving sensor platforms as a new source of cyclist information, it was reasonable to assume that the knowledge about the network structure and the sensor platform position would always be known.
Cyclists overtaking other cyclists or approaching a signalized intersection can influence one another. Their motion can, for instance, be affected by the behavior of others, the surrounding environment, or their destination choice. More advanced motion models that include the interactions of targets have the potential to be utilized to improve tracking, thereby improving predictions, in particular, over extended periods of times without observations. However, interactions between targets, strictly speaking, violate a key assumption of the framework used, and more generally of all classic tracking frameworks, as they treat targets independently to minimize complexity. Extending the method to take these interactions into consideration is nontrivial and, more importantly, has a very negative impact on computational complexity. To prove the concept of our application, we therefore considered cyclists to move independently, because bypassing the violation of this basic assumption and using more involved behavioral models was outside the scope of this study.
At the same time, cyclists respond to the colors of the traffic lights, for example, by adapting their speed. In contrast to the interactions between cyclists, the traffic signal color was a fixed input at every time step and was thus be considered in this study to be additional control input for the cyclist motion in the approach used.
The NC-MHT framework modeled transitions in the road network as a discrete Markov chain, in which a target transitions from one road segment (e.g., cycle lane) to another once it has reached the end of that segment (i.e., the intersection), according to a computed transition probability. When applied to a traffic signal control setting, for example, where cyclists approach an intersection, the provided network representation allowed the specification of different cycle lanes. Each sensor platform observation could thus include the probability that the cyclist was observed on that cycle lane. To limit computational complexity, this study used a simplification in which the cycle lane was assumed to be accurately provided by the sensor platform (i.e., only one cycle path had nonzero probability).
Note that for some traffic signal control applications (as exemplified later in this paper) the complete intersection area (e.g., conflict area) must be included in the continuous description of the cyclist motion state, so the network representation used in the NC-MHT had to ensure a cyclist could be tracked not only before and after an intersection, but also at the intersection. Ignoring the presence of a cyclist in such crucial zones would have considerable negative effects for overall safety and for the efficiency of the controller.
Arrival Time and Priority Request
To give priority to cyclists at the right moment, the arrival time of the cyclist must be calculated. Giving cyclists priority will have an effect on the delay of other traffic, therefore, to avoid causing excessive delays to conflicting vehicle movements, the priority of the bicycle movement is conditional.
Arrival Time Calculation
To find the optimum moment to give cyclists priority, the position,

where
Conditional Priority Request
The priority start of the bicycle movement depends on the arrival time,
When the conditions favor priority, the start of the priority request depends on the controller state:
1. During green, yellow, or clearance times of parallel movements: priority is requested the moment the cyclist is about to brake, this is

2. During green, yellow, or the clearance time of conflicting movements: the signal also needs to turn green here, the moment the cyclist starts to brake. However, if a conflicting signal,

The remaining time depends on the yellow time,

The conditions for starting the priority depend on the green duration of the conflicting movements, and on the number of times priority was realized for the bicycle movement, as follows:
Do not truncate conflicting movements too soon, at least
Limit the number of priority realizations: after the bicycle priority ends, it should not start again before the lost time has expired. This ensures that one of the conflicting movements that have a green request, will receive green.
Priority extension should also be limited: green time for cyclists should not be extended for too long:
The green may extend to a maximum
Extend the priority only if a cyclist arrives at the stop line within
Since VAT priority is granted when a cyclist is observed and there is a conditional extension of the green time, a single cyclist that arrives will be prioritized over a platoon of cyclists that arrive after
Reducing Lost Time by Phase Truncation
Moving sensor platform observations can be used to prioritize approaching cyclists, yet they can also be used to optimize control by reducing unused green and lost time in the control cycle by truncation of the minimum green-, yellow-, or the clearance time, referred to here as “phase truncation.” Since two separate areas need to be observed, the area from the priority request location to the stop line (i.e., the PR zone), and the intersection (the clearance zone), phase truncation is undertaken in two steps. First the minimum green and yellow truncation is considered in relation to the PR zone, secondly, if the conflict zone is clear, the clearance time is ended.
If no cyclists are observed within the PR zone, and the bicycle signal is showing green because the minimum green time has not yet expired, the minimum green time can be ended. The gap-out time of the detectors is not needed, since it is certain the queue has been cleared. If there are no cyclists in the PR zone (which is upstream of the dilemma zone), no cyclists can decide to go when yellow is visible, so the yellow time has no function and can be ended. This truncation should take into account the speed of the fastest cyclists,

If there are no cyclists in the priority request location or in the conflict area, clearance time can be ended, leaving the conflict area clear for conflicting movements. The safety risks of phase truncation are reduced by the demand that multiple sensor platforms should observe these areas, the priority request location and the conflict area, and these sensor platforms should provide redundant observations that there are no cyclists present.
Experimental Design and Simulation Setup
The aim of this case study was to quantify the potential of using cyclist observations from moving sensor platforms (here exemplified in a CAV use case) with the implemented VAT approach by answering the following questions:
Q1: How do VAT, VA (no priority), and VAP control (priority on detection) compare in relation to car and bicycle delays and stops for different levels of car and bicycle demand?
Q2: What effect does VAT have on the efficient use of green for cyclists?
Q3: How does the penetration rate and the FoV of CAVs affect cyclist delay?
Q4: What is the value of observing the absence of cyclists?
This section first provides more details about the scenarios simulated in this study. We then describe the designed case study, and eventually elaborate on the assumptions and design choices made for the implementation of the numerical experiments.
Simulation Scenarios
To answer the aforementioned questions, we evaluated the benefits of the proposed VAT approach with five simulated scenarios using PTV Vissim 11 microscopic traffic simulator ( 23 ). The road network was synthetic, that is, not based on an existing intersection and thus the microsimulation network was not calibrated with existing data. The network was made sufficiently complex to show the proof of concept, yet simple enough to make the setup feasible. The demand levels were realistic ( 24 ).
To answer Q1, we evaluated the benefits of the proposed VAT approach against VA and VAP implementations in relation to the effect of the bicycle demand (100 to 800 cyclists/h), for various levels of car demand (50% to 150% of the baseline car demand, given in Figure 2a).
For Q2 we assessed how VA, VAP, and VAT handled green actuation and duration for the varying bicycle demand.
For Q3, different tracker variables were changed to compare VAT scenarios. The VAT base scenario was chosen as having 300 cyclists/h, 50% CAV, and 30 m FoV, as well as no occlusion or phase truncation. The baseline car demand is given in Figure 2a. The probability of detection for each CAV was set to
Question Q4 was split into two situations. First, if a CAV did not observe any cyclists, this may have been the consequence of occlusion, thus, occlusion events were added and compared with the VAT base scenario described above. Second, if observations from multiple CAVs provided redundant information about the absence of cyclists and no occlusion took place, we evaluated the benefits of the proposed VAT approach against VA- and VAP implementation in relation to phase truncation. In particular, we were interested in minimum green, gap time, yellow time, and clearance time truncation.
Given stochastic effects and priority, we used seven different seeds to simulate, with a simulation duration of 900 s (10 to 15 cycles), with sampling time
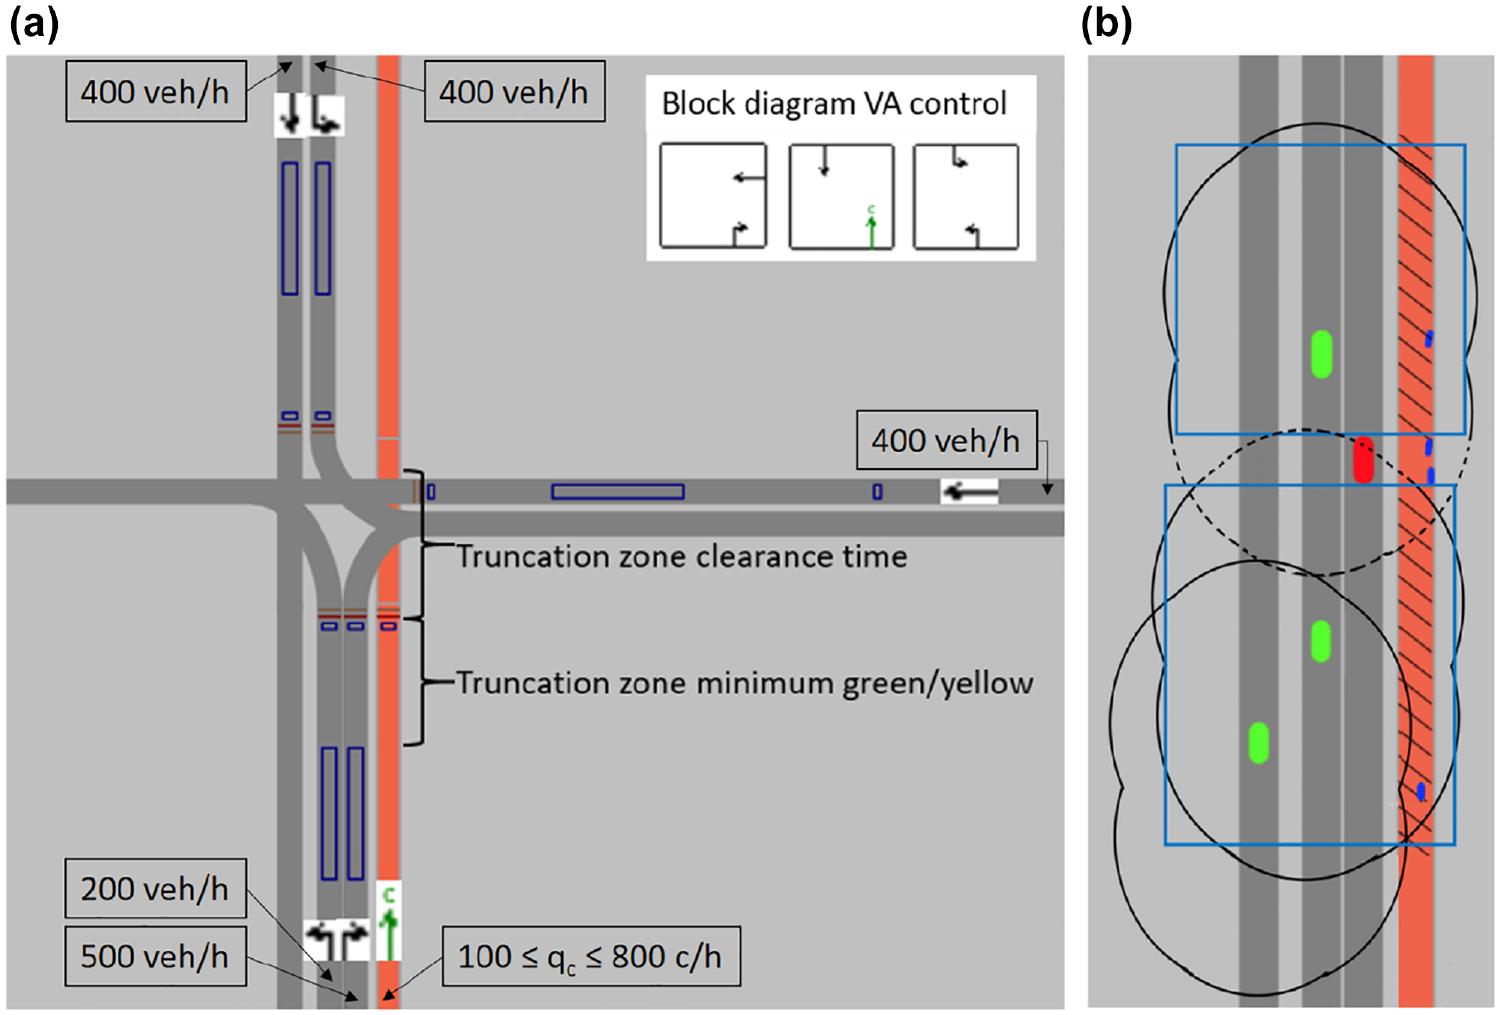
Microsimulation in Vissim, the network and field of view: (a) intersection used in microsimulation, with the control block diagram and (b) illustration of the simplified occlusion model.
Case Study
We simulated cyclists and vehicles moving along the road network (depicted in Figure 2a). This intersection is close to a realistic situation and sufficiently complex in the effect of prioritization. For simplicity, only CAVs parallel to the cycle lane could observe cyclists. To mimic realistic control, a three-block-control was implemented, but in only one direction, which was not parallel to the cycle lane. Cyclists traveled from south to north on the (red) cycle path. A loop detector for cyclists was placed at the stop line, as this is most commonly used in the NL ( 6 ) (a benchmark country for bicycle infrastructure). As mentioned in the introduction of this paper, the detector was used as actuator for the VA-, VAP-, and VAT approach. Vehicles present on the network were either conventional nonsensing (“car”) or equipped with sensing capabilities allowing them to generate observations about objects in their FoV (“CAV”). CAVs that had the cycle path within their defined FoV could generate cyclist observations at any time. The cyclists moving along the cycle path were either “common” cyclists with an average speed of 15 km/h, or fast cyclists (e.g., e-bikes) with a speed of 25 km/h. These speed differences were introduced to challenge the arrival time estimation.
Network Representation
According to the tracking framework introduced earlier, all observations received from CAVs were network-constrained, which can theoretically be represented as a Markov model in the form of a directed graph. As indicated earlier, the complete intersection must be included in the continuous description of the cyclist motion state. We thus represented the entire cycle path as a single line segment. This design choice allowed us to have cyclist observations and propagation at the complete intersection area, without issues of cyclists transitioning from one segment to the next.
Field of View and Occlusion
As stated, the size of the FoV determines whether a CAV can observe the cycle path, and if so, which part. Only cyclists within the FoV can be observed by a CAV. The shape of a two-dimensional FoV can be approximated best by an ellipse (
25
), but for simplicity, we approximated the FoV with a square. Figure 2b shows that this approximation was reasonable with respect to the actual size of the FoV. For the baseline VAT the size of the FoV was set to
For occlusion events, we implemented a simple model in which only lines of sight between the CAV and the cycle path, perpendicular to the cycle path, were considered. If another vehicle was partly within the perpendicular line of sight, this part of the cycle path could not be observed by the CAV. Figure 2b illustrates the simplified occlusion model. Close to the stop line, waiting vehicles can obstruct this view, so the occlusion is worst near the stop line. The consequence of this event is that if the tracker receives conflicting information, that is, from CAVs that observe the cyclists without occlusion in their FoV and from CAVs that cannot observe a cyclists but should be able to, given their position with respect to the cycle path, the tracker may (depending on track likelihood computations) end the trajectory.
Implementation Details
The Vissim network is controlled by a VA controller (TRAFCOD [ 26 ]), which reacts to the occupancy of detectors. The COM interface gives information to the controller adjustment in Matlab, Matlab passes (a part of) the information through to the tracking algorithm in Python and C++, then information from the tracking algorithm is input for the controller adjustment. The controller adjustment decides when a direction will start or end green or end yellow, and based on this, certain detectors will be cleared or occupied, to make sure the signal timing is as intended.
Results
In this section, the results from the empirical evaluation for the proposed VAT controller and two state-of-the-art controllers, VA and VAP, are presented:
The base scenario was with 50% CAV and 30-m FoV, without occlusion or phase truncation and the baseline car demand from Figure 2a.
Figure 3 shows how the tracker dealt with cyclist observations and estimated cyclist trajectories by comparing to the actual trajectories of the cyclist in the simulation. This figure also highlights how a track initiated by a false observation results in an unjustified priority start of green.
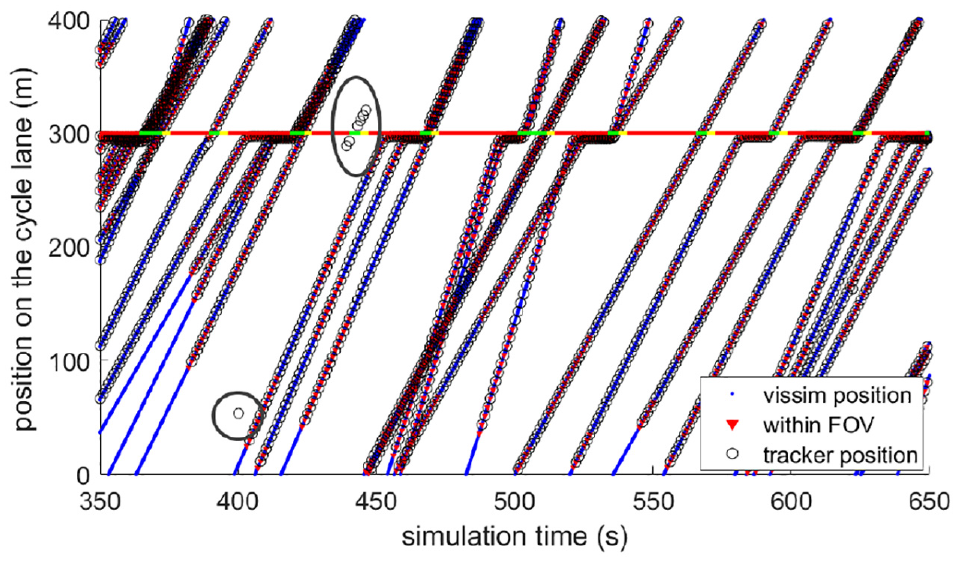
Trajectories of cyclists: the blue line denotes the actual trajectory (true positions), the red denotes those observed by connected autonomous vehicles (CAVs) within the field of view (FoV), and the position of the cyclists according to the tracker algorithm (estimated positions). At 300 m the stop line is indicated by the signal phases (green, yellow, red). False observations are indicated by gray circles.
Q1: VAT Versus Baseline Control Scenarios
In answering Q1, Figure 4 presents an indication of the performance of the proposed VAT approach against the baseline cases used in this study. It presents the percentage of cyclist stops, and bicycle and car delay as a function of the demand. As can be seen from Figure 4a, VAT showed a reduced number of required stops for cyclists as compared to both VAP and VA. In particular, observing cyclists ahead of the stop line in a priority scenario with tracking (VAT) considerably improved the number of stops when compared to a priority without tracking scenario (VAP), where there is a high probability that a cyclist will stop on the detector because the detector is located close to the stop line.
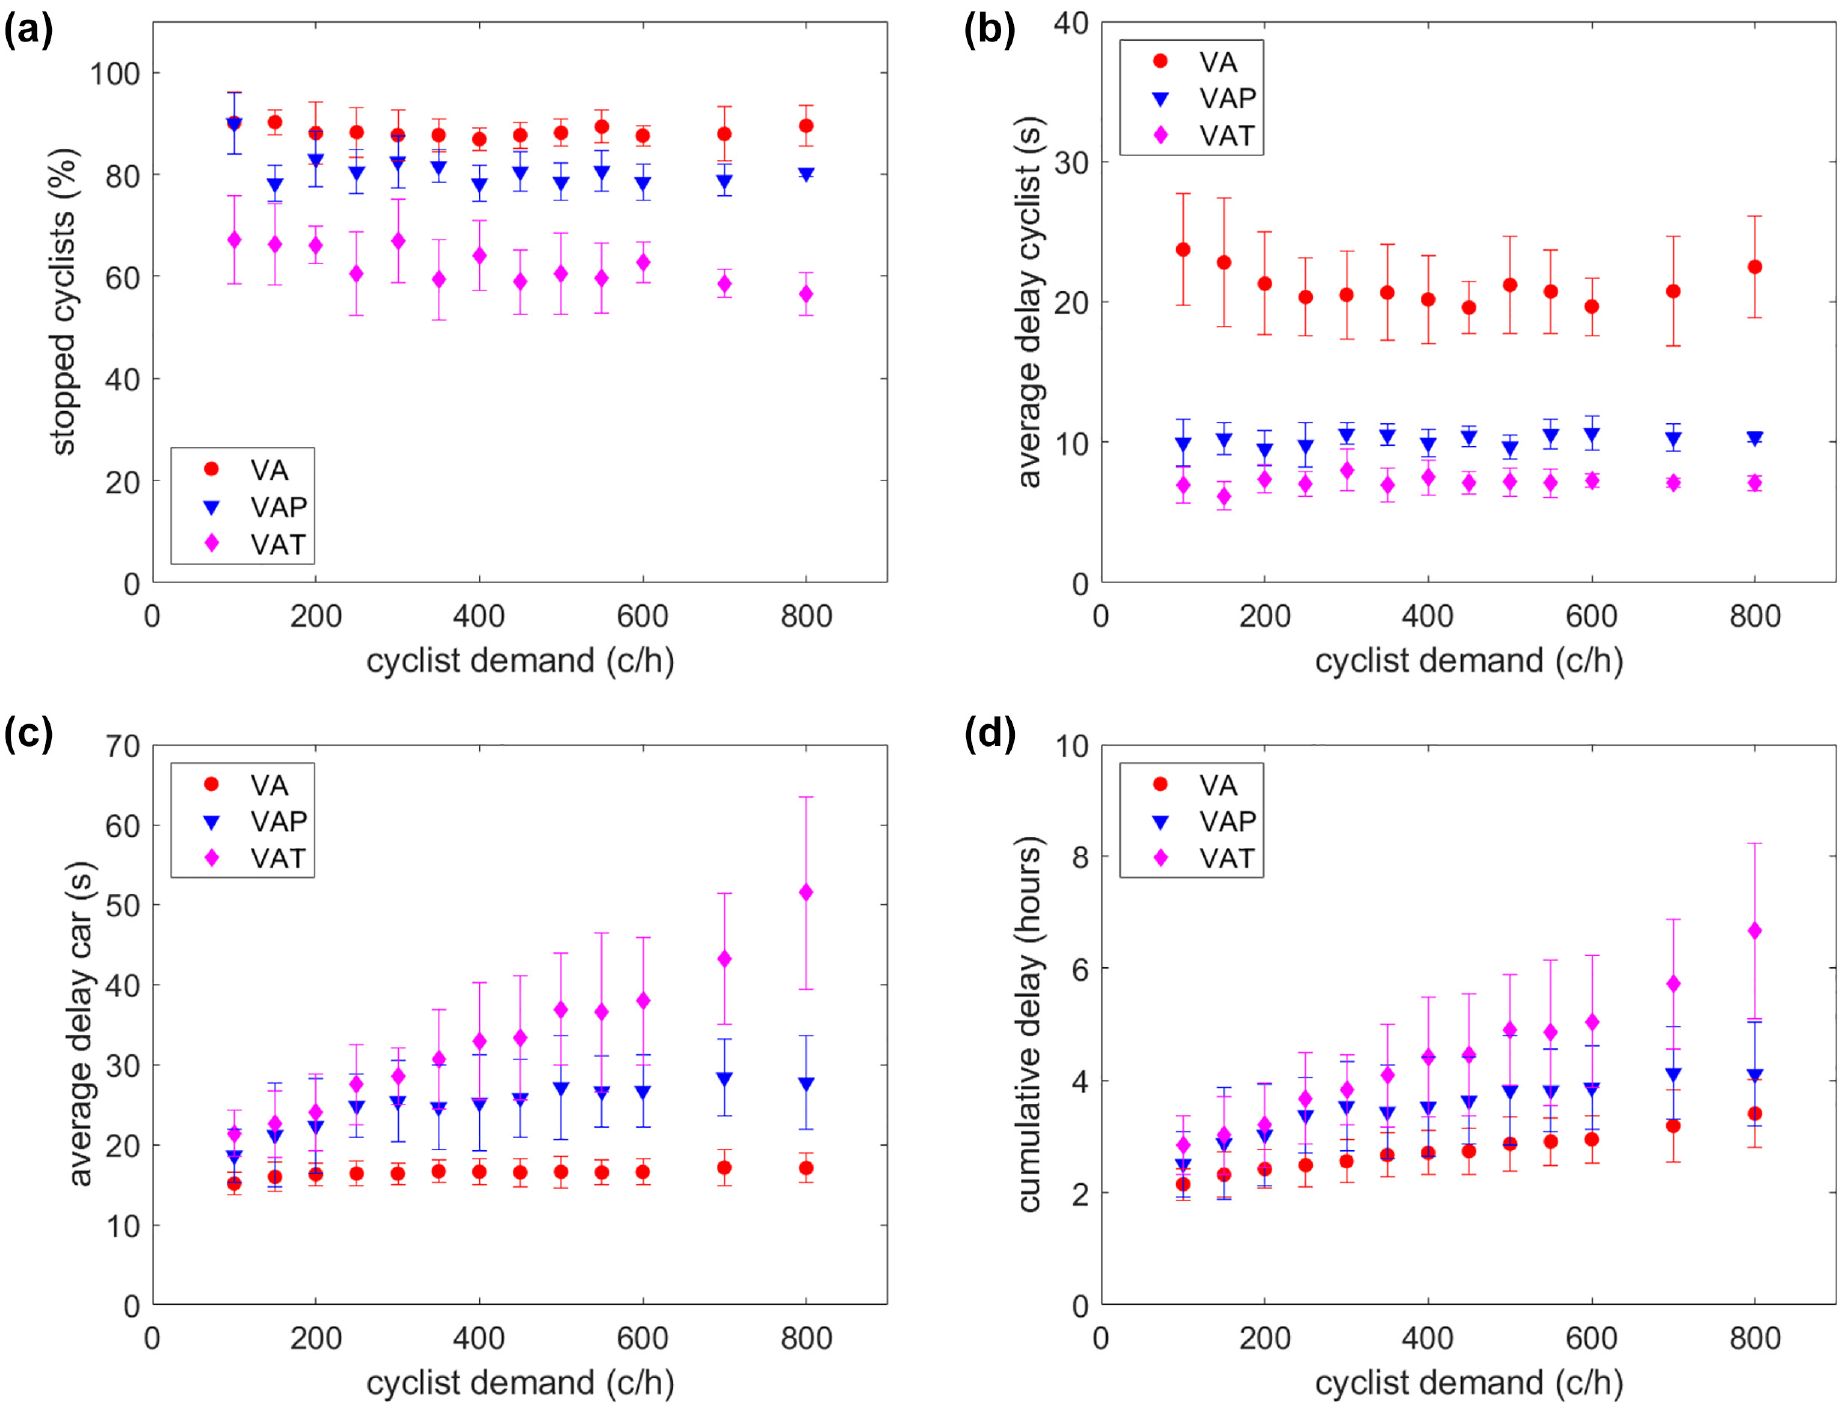
As a function of cyclist demand: (a) stopped cyclists, (b) average delay of cyclists, (c) average delay of cars, and (d) cumulative delay.
Delay as a function of cyclist demand (Figure 4b) was smallest for VAT with a low demand and highest for VA. This result was logical, given that VA requests can only be honored when the block of the cyclist movement can be activated. When the VAT results were compared with those of VAP, the difference between cyclist delay was smaller than for stops, the effect of prioritization on delay reduction was larger than the effect of being observed further ahead of the stop line.
When the average delay for cyclists was compared to that of cars (Figure 4c), the effect was smallest when demand was low, and the difference increased in line with greater demand. From 400 cyclists/h, it can be observed that the average car delay started to increase significantly, whereas the average delay for cyclists hardly changed in relation to higher demand (Figure 4a). With increasing demand, cyclist priority is given more often and for longer durations, thus leading to greater delays for cars.
Car demand for the results in Figure 4 was fixed. The effect of car demand (therefore the number of CAVs) was also tested in the VAT scenario. The ratio between the demand of car movements remained the same as for the original simulations, but demand was set to a percentage of this baseline demand (i.e., 100% equaled the baseline demand). As can be seen from Figure 5a the delay of the cars is strongly related to the car demand, with increasing demand the delay increases much, especially if there is also a high bicycle demand (from 60 to 100 s). For the cyclists this effect is less, because the cyclists receive priority, even when there are fewer CAVs around to observe them. Once a cyclists is observed it will, in most cases, be “remembered” by the tracking algorithm and will receive priority. Furthermore, if there are fewer cars, the green time of the car movements will be less, cyclist will receive green earlier and the delay will be lower. Only for a demand of 200 c/h the effect of a higher car demand (cq more CAVs) is visible: with 150% the delay is lower than for 125%.
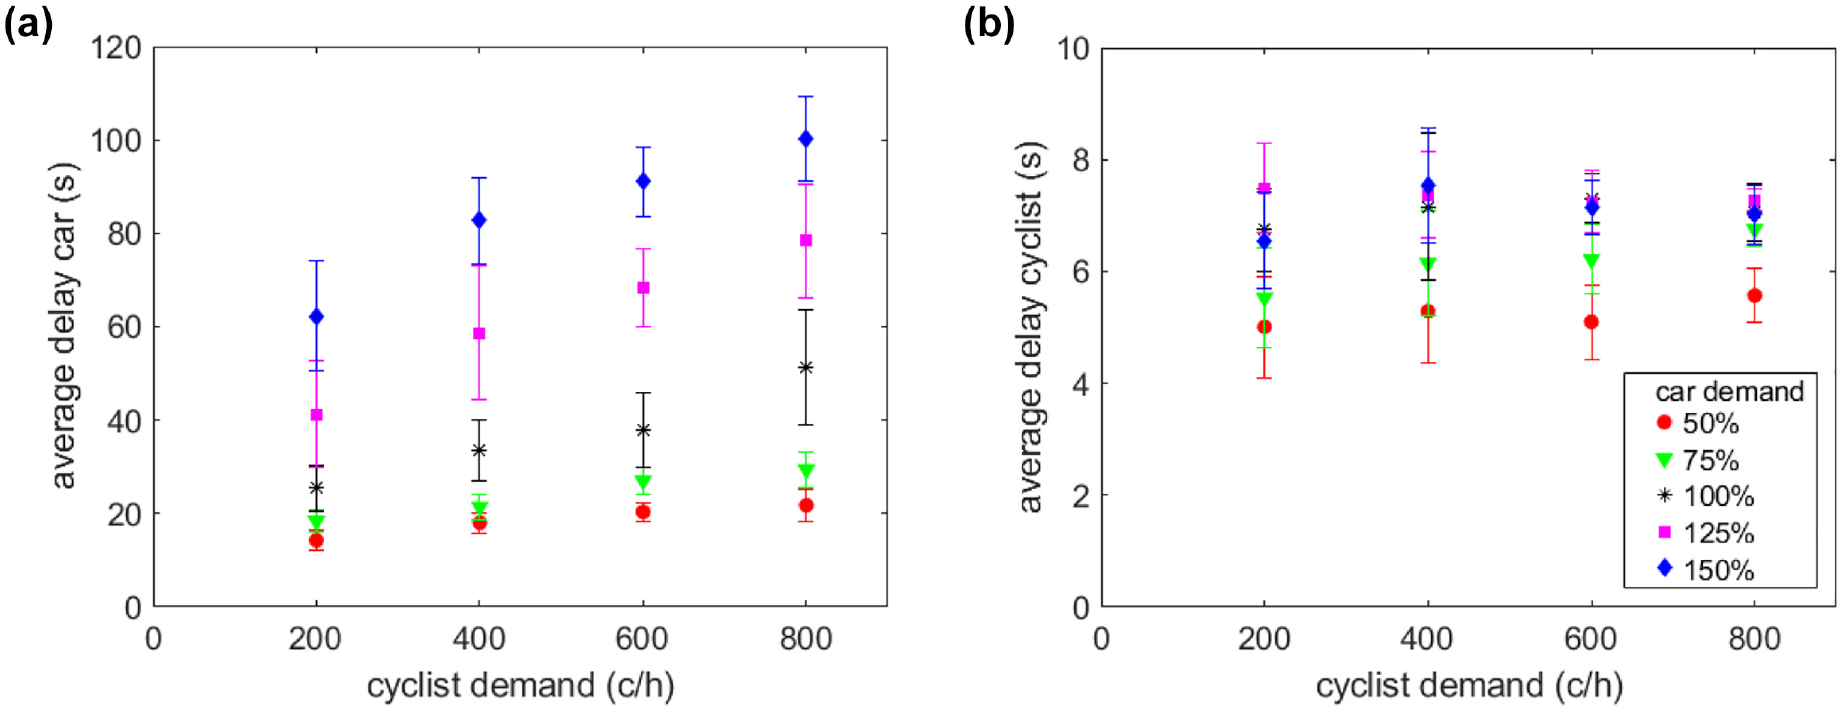
Effect of car demand as a percentage of the baseline car demand: (a) average car delay and (b) bicycle delay demand.
Q2: Bicycle Green Actuation, Bicycle and Car Green Duration, and Green Use
This section aims to answer Q2 by showing how VA, VAP, and VAT each handled bicycle- and car green, and describes the results this had on effective green use in relation to cyclist- and car delay. The green handling in Figure 6 shows (as a function of bicycle demand) how many cyclists crossed the stop line during green, the average green duration for the bicycle signal, and how much time was given per cyclist, that is, per actuation the green duration divided by the number of cyclists during that move over the stop line. As can be seen from Figure 6c, the green allotted per cyclist reduced as cyclist demand increased, indicating the green time was used more effectively with increasing demand, until about 500 cyclists/h where it started to level out. For 300 cyclists/h and above, green time per cyclist was much higher for VAT control than for VA or VAP, indicating the green time per cyclist was used less efficiently.
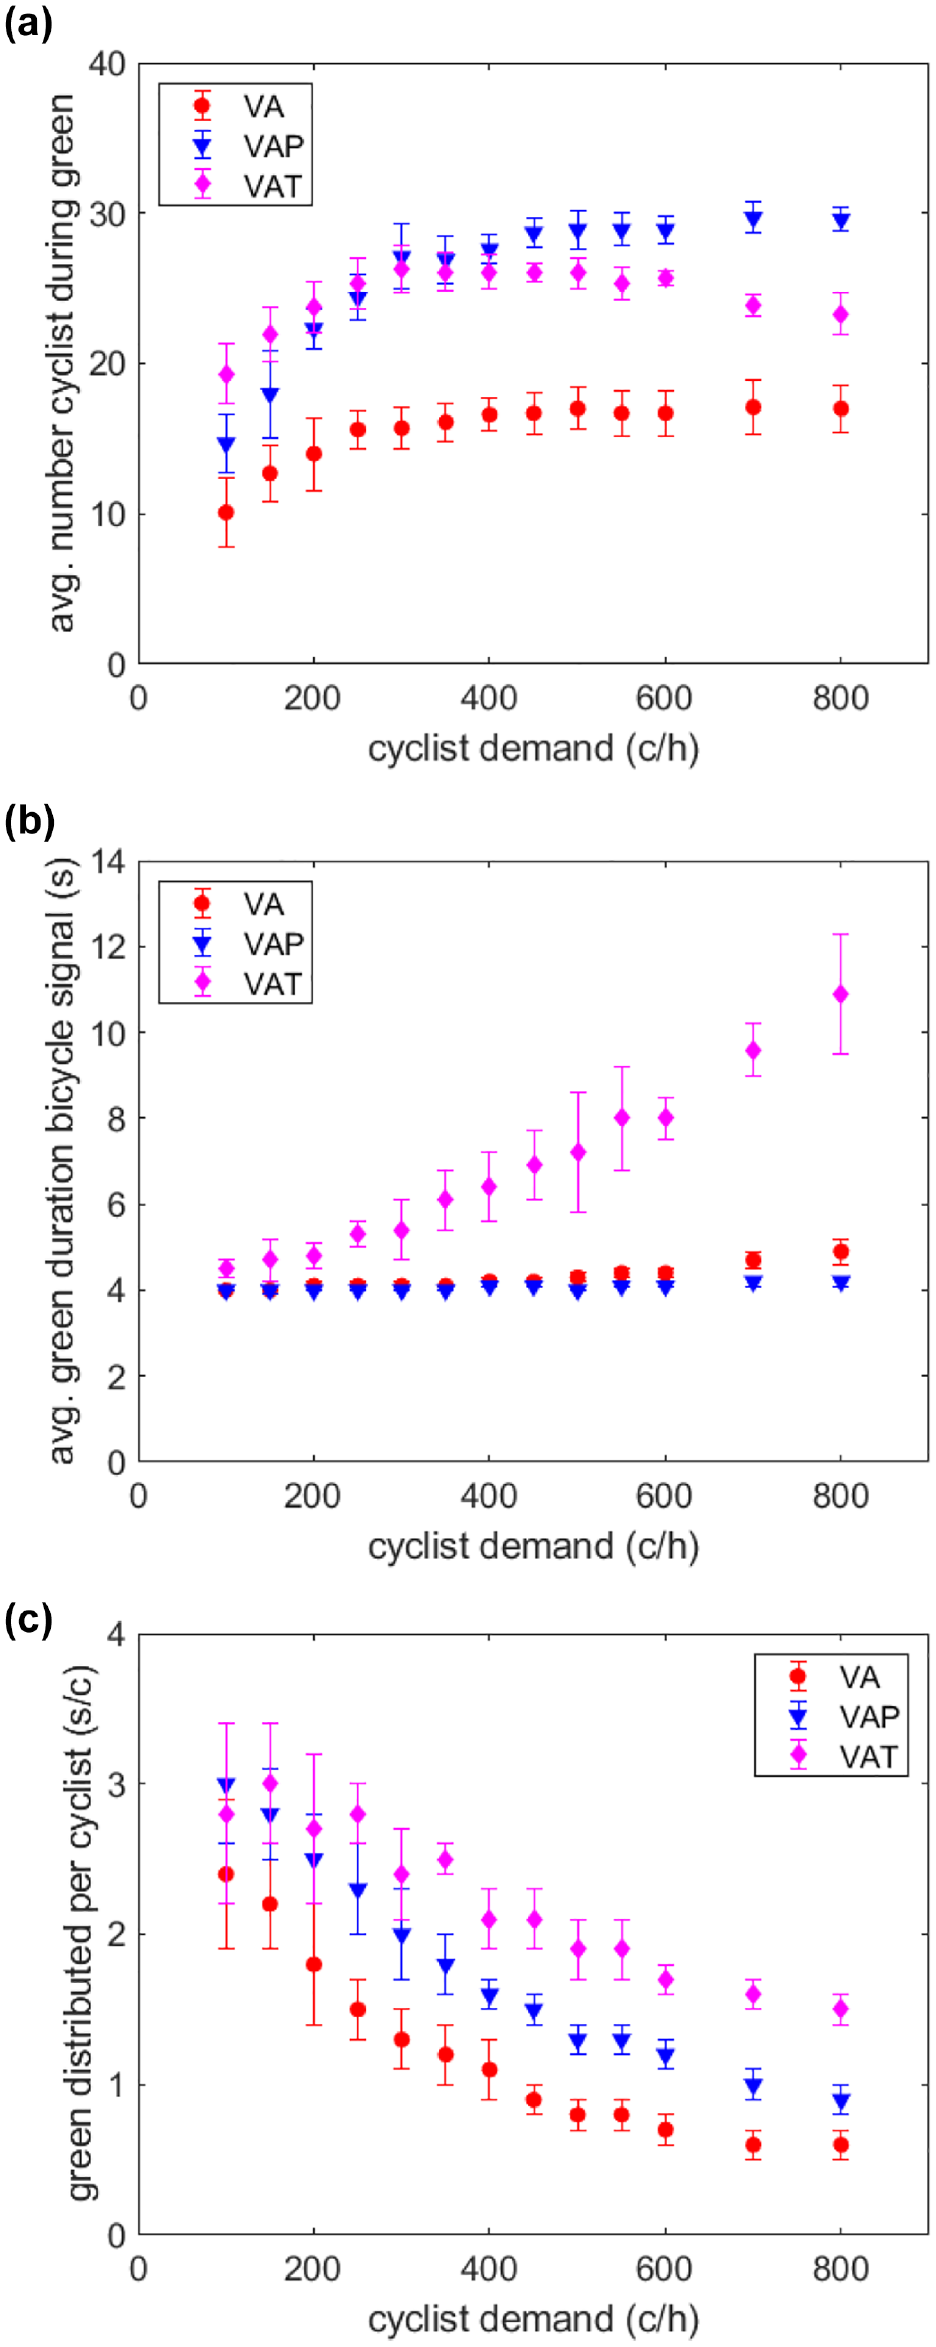
Bicycle green handling for VA, VAP, and VAT: (a) average number of cyclists that moved over the stop line during green, (b) average green duration of the bicycle movement, and (c) average green time allotted per cyclist.
As can be seen in Figure 6, VA control did not actuate the bicycle signal often (6a), and only for a short duration (6b). With increasing demand, the green distribution across cyclists (i.e., the amount of green per cyclist) decreased (6c), indicating that for high demand many cyclists crossed the stop line during green.
VAP frequently actuated, therefore briefer green times were required than for VA, since smaller queues could be discharged faster. Since the duration of the signal was at least the minimum green time, this could have led to unused green after the cyclists had moved over the stop line, so the green used per cyclist was higher for VAP than for VA.
VAT also actuated more often than VA, less than VAP, but extended the green time for longer periods, especially when the demand increased because the green was extended to cater for the approaching cyclists. Unused green time was present before the cyclists moved over the stop line. In further developments of the controller, this extension of the green should be assessed, because for VAT this resulted in high car delays (Figure 7a). However, this relationship was absent for VA and VAP.
In Figure 7a, average car delay is given as a function of average bicycle green duration for the demand. The results indicated a linear relationship between the green time of the bicycle signal and car delay. For the different percentages of car demand, the green time needed to cater for this demand is given in Figure 7b. This green time was calculated using Webster cycle time ( 27 ), which is optimum for nonuniform arrivals. Webster cycle time took into account the control structure, car demand, and the green time used for the bicycle movement. For demand that was equal to or greater than the base scenario, the desired green time was higher than the actual green time the car movement received, leading to greater delays (Figure 7a).
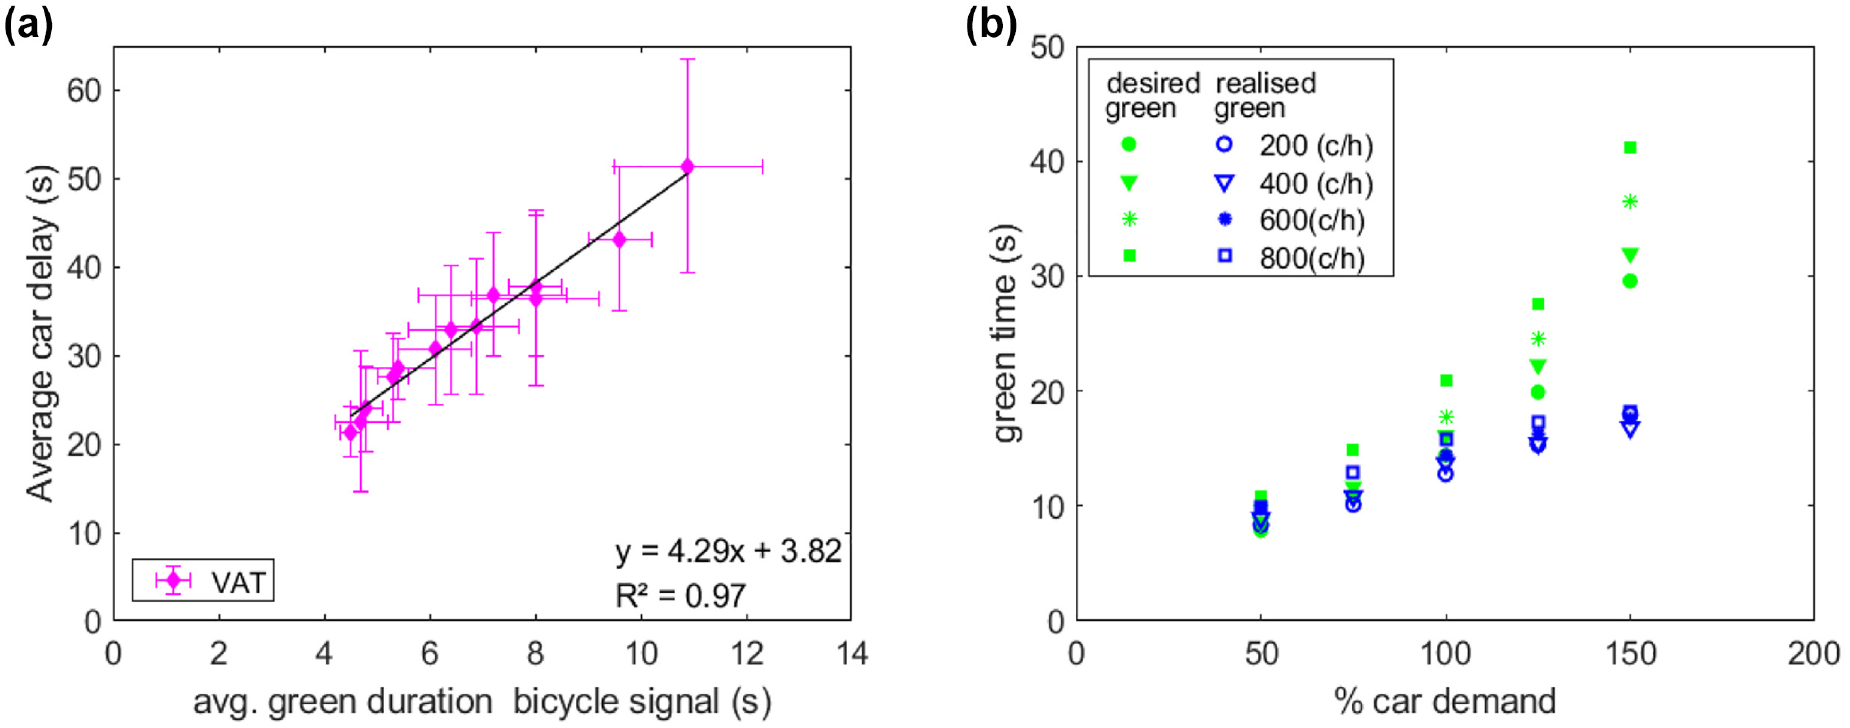
(a) Average car delay as a function of the average bicycle green duration and (b) comparison between the desired green duration and the realized green duration of car movement, as a function of the percentage of car demand for different levels of bicycle demand: 200, 400, 600, and 800 cyclists/h.
Q3: Impact of CAV Penetration Rate and Field of View
The results presented in Figure 8 show the difference in weighted average delay between the new- and the base scenario. The average was weighted for the number of vehicles, which were different for each simulation. When the difference was positive, the new scenario assigned a greater delay than the base scenario.
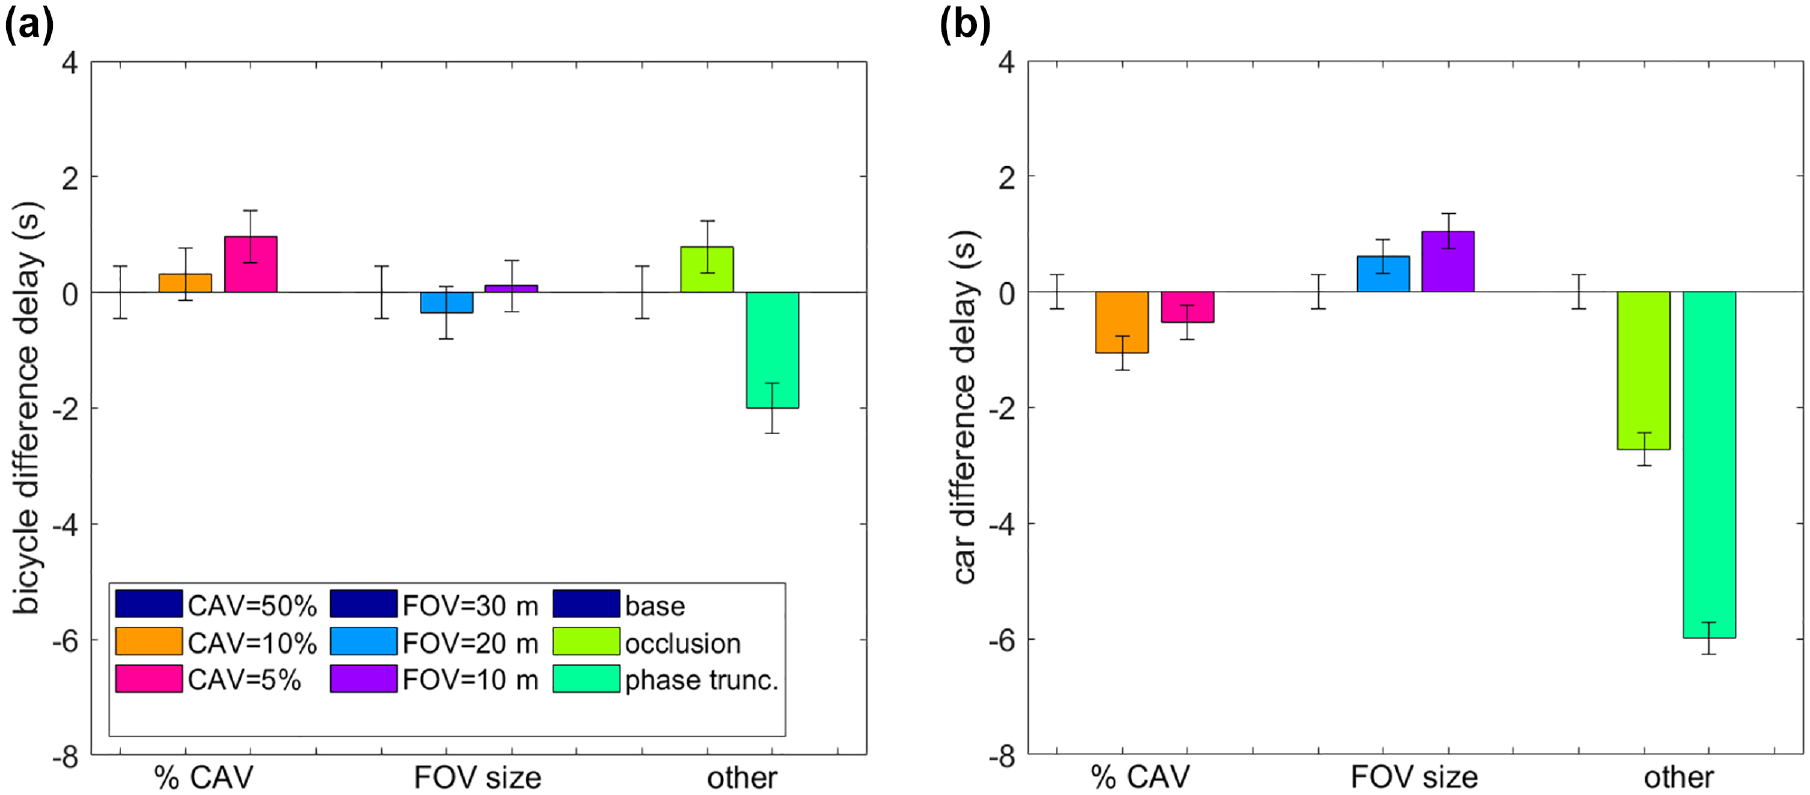
Difference with respect to the base scenario for (a) cyclists delay and (b) car delay.
In answering Q3, Figure 8 indicates that the penetration rate reduction to 10% had hardly any effect on the delay: the standard deviation was larger than the difference. For a CAV penetration rate of 5% the delay was higher for cyclists. Therefore, FoV appeared to have made hardly any difference, a smaller FoV would have yielded slightly more delay on average, but the standard deviation was larger than the difference. Note that the FoVs values chosen for this study were believed to be conservative as compared to setups in practice that which benefit from much wider FoVs. Overall, and as expected, both small FoVs and low CAV penetration led to fewer cyclist observations. Because a cyclist observation initiates the creation of a hypothesized track, when not assigned to an existing track, that cyclist’s trajectory will be estimated until the stop line to eventually request for priority. The lack of interruption of a track may, however, depend on the configured track-pruning strategies applied by the tracker. Therefore, if more observations are generated, either by a larger penetration rate or wider FoV, cyclists will benefit from the priority requested by a cyclist that has been observed. Should this happen less frequently because of a low penetration rate (e.g., 5%), priority will be given less often and the delay will increase with respect to the base scenario.
Q4: What is the Value of Observing the Absence of Cyclists?
In answering Q4, two scenarios were computed that were representative of situations where cyclists are not observed. Figure 8 shows that in the case of occlusion, the delay on average was higher. The tracker removes existing tracks when in too much doubt, thus leaving the cyclist as “unseen” and having no base to request priority. A more detailed look at the behavior of the tracker confirmed that track removal was a consequence of occlusion events in the simulated traffic situation. Therefore, when a CAV failed to generate a cyclist observation (because of occlusion) that should have been seen, the likelihood of that (unobserved) track decreased. Although the tracker was able to handle a reasonable amount of occlusion appropriately given the model, occlusion levels increased significantly close to the intersection. A solution to this would be to implement a more sophisticated place-dependent occlusion model that can manage various levels of occlusion at different locations. With more available observations, however, even higher occlusion levels were handled well by the tracker used, as indicated in Figure 3.
The second scenario presented here was truncation of the green phase. When the minimum green phase, yellow phase, or clearance time is truncated, the gains will be highest. The cycle will be shorter without unused lost time, and priority will be granted earlier, leading to less delay and fewer stops. As can be seen in Figure 8, except for the phase truncation, the difference in car delay was opposite to that of cyclists. Where cyclists had more delay, cars experienced less, although in most cases the difference was smaller than the standard deviation. Both cars and bicycles gained from phase truncation: smaller cycles comprising less lost time were beneficial for both traffic modes. Overall, although phase truncation led to a low levels of delay for all traffic modes, this can only be done when it is absolutely certain that no cyclists are observed within the dilemma zone, and no cyclists are observed in the conflict area, since the risk is very high for a cyclist that is present yet has not been observed. The prevention of occlusion events and false observations, that is, through redundancy of measurements, is thus an important safety factor.
Conclusion
This work has highlighted the potential of cyclist observations made from moving sensor platforms to augment the situational awareness of traffic signal controllers. A simulation study quantified the benefits of the proposed approach, using a VA controller that employs CAV observations to prioritize cyclists and reduce lost time in the control cycle, under two baseline scenarios: with and without cyclist priority.
In relation to car and bicycle delays and stops, the results indicated that with a low penetration rate and occlusion, prioritizing cyclists by tracking (with a small FoV) reduced the delay for cyclists or avoided stops, via a simple algorithm. However, the average car delay increased significantly when the number of cyclists increased, whereas not much variation was found in the average bicycle delay. Prioritization schemes applied in real-world traffic situations confirm this finding, for example, in the city of Rotterdam (NL), when cyclists were prioritized during rainfall, the queues for car directions increased substantially ( 28 ).
An analysis of efficient green use for cyclists indicated that unused green for bicycle movement, or several priority requests by cyclists, led to short green times for cars. An explanation for this result is that the controller did not optimize the delay for all traffic participants, nor did it take into account the platoon dispersion of cyclists.
Both small FoVs and low CAV penetration led to fewer cyclist observations. The results highlighted the importance of handling false observations, as they can lead to unjustified green starts where no cyclists are present. Highly occluded areas (i.e., at the intersection) can have a negative impact on the information available to the tracker and, thus, lead to, for example, the pruning of tracks of existent cyclists, which eventually leads to fewer priority requests.
The results indicated that observational confirmation that cyclists were not present was beneficial for all traffic, leading to less lost time in the cycle.
Future Work
Future work from this study could span in multiple directions. We will outline a set of interesting paths for future research and discuss some of the practical difficulties when implementing such methods.
Although the results from the simulation indicated that a low penetration rate of cyclists can also benefit from priority by CAV observations, in practice, things might look a bit different. For instance, we would expect control cycles in which cyclists are prioritized, and control cycles in which, owing to absence of CAVs (in cases of current low CAV penetration rates [ 29 ]), cyclists are not prioritized. This might raise false expectations among cyclists about such prioritization schemes, which, in turn, could affect the credibility of the control and potentially induce red light running ( 30 ).
Furthermore, the level of false observations and the avoidance missed detections, for example, because of potentially frequent occlusion events in urban areas, should be tackled, as this may lead to unnecessary losses and delays. The model used to realize occlusion was very simple to apply. Further research is needed to determine how severe the occlusion is when CAVs observe cyclists, depending on location and time (e.g., place-dependent occlusion). Further, the value of information in time or quality, for example, the way in which CAVs communicate the quality of observations in the case of occlusion, needs to be investigated.
Experiments under real-world conditions must be performed. Generating real data will provide valuable insights into how efficient CAVs are in observing cyclists, and enable the calibration of a microsimulation. Furthermore, communication between iTLCs and CAVs must be further developed, extending existing setups in which a few static sensors provide traffic data to iTLCs.
Cyclist prioritization should be assessed with respect to safety. When a saturated car queue moves over the stop line, ending green might be unexpected by the car drivers, and less credible control could lead to red light running.
The proposed truncation of phases, especially clearance time truncation, is not yet fit for use in practice. The certainty that no cyclists are in the conflict area should be very high before the clearance time can be ended, therefore, this aspect of the equipment and model should be tested thoroughly before used in practice.
The method of prioritization used by the current controller could lead to a situation in which one cyclist could get 1 s less delay and does not have to stop, but this could mean, for example, that three cyclists arriving just at the start of the red bicycle signal have to wait perhaps 9 s (the time for conflicting movements to start and clear the conflict area). This led to a large variation, from simulation to simulation, in the number of stops and in the delay. Now that the proof of concept has been given that cyclists benefit from prioritization by observation, the next step will be to optimize the control that balances the delay and stops of cyclists and cars. Suitable for VA control would be a function that determines the signal phases with an objective function, based on a weighted combination of the total time spent by the motorized vehicles and by the bicycles in the system and their stops.
When cyclists are prioritized, it is beneficial for the throughput of the intersection that the cyclists are close together, so that the green extension can be shorter, as happens in practice in the municipality of Hengelo (NL) where cyclists are encouraged to form platoons so that they can be prioritized ( 31 ). Furthermore, a combination of speed advice for cyclists ( 32 ) and prioritization should also be researched in future.
Footnotes
Author Contributions
The authors confirm contribution to the paper as follows: study conception and design: A. Vial, A.M. Salomons; data collection: A. Vial, A.M. Salomons; analysis and interpretation of results: A. Vial, A.M. Salomons; draft manuscript preparation: A. Vial, A.M. Salomons. All authors reviewed the results and approved the final version of the manuscript.
Declaration of Conflicting Interests
The authors declared no potential conflicts of interest with respect to the research, authorship, and/or publication of this article.
Funding
The authors disclosed receipt of the following financial support for the research, authorship, and/or publication of this article: This work was supported by the European Research Council and Amsterdam Institute for Advanced Metropolitan Solutions through the ALLEGRO project (Grant no. 669792). The project was also made possible by the European Regional Development Fund and the Delft on Internet of Things fieldlab.