
Abstract
In the United States, roughly one-third of students in public and private K-12 schools ride a school bus to school; in Georgia, that share is even higher (46%). But policy differences between and within states complicate explanations of school trip mode choice. To address this and create a consistent choice set, this article uses the 2017 National Household Travel Survey Georgia Add-On to construct a statewide analysis of school trip mode choice among school-bus-eligible students, as Georgia state law requires students receive a bus service if they live 1.5 mi or more from school, creating a consistent choice set. I use a binary logistic regression model and marginal effects to determine factors predicting school bus use on morning trips to school in Georgia among a suite of trip, individual, household, and environmental characteristics. I find that Black students, older students, and students in greater Atlanta are more likely to use a school bus, while students who live further from school, girls, students who have at least one parent with a college degree, and students who have at least one parent with a flexible work schedule are less likely to do so. Additionally, for those who are age-eligible, possessing a driver’s license strongly predicts not using a school bus. Notably, neither family income nor family structure are significant predictors of school bus use. Ultimately, these findings have implications for state school bus policy in Georgia and help elucidate who uses this important service so that resources can be directed appropriately.
Although often overlooked in the transportation literature, school transportation is a gigantic and important piece of the transportation system in the United States. About 56 million public and private school students—or roughly 17% of the country’s total population—traveled to and from school facilities each day in 2017, with roughly one-third of them riding a school bus on any given day ( 1 , 2 ). Long a staple of American culture, standard yellow school buses likely provided more trips on an average pre-COVID-19 pandemic weekday than every transit system in the country combined. (I calculate this using 2017 National Household Travel Survey (NHTS) data (3), which indicates that 33.2% of students aged 5 to 17 take the school bus to or from school. Applied to 56.4 million students traveling roundtrip, this equals roughly 37.5 million trips each weekday during the 2016 to 2017 academic year. Conversely, the American Public Transportation Association (APTA) estimated that in 2019 the number of transit boardings on an average weekday was about 34 million ( 4 ).)
Yet the future of this American icon is uncertain. At the beginning of the 2021 to 2022 school year, districts across the country struggled to hire bus drivers and staff routes ( 5 ). Before the COVID-19 pandemic, many states, including California, Missouri, and Pennsylvania, were de-emphasizing or reducing school transportation funding ( 6 – 8 ). Georgia faced fiscal woes that prompted its state superintendent Richard Woods to plead with the governor and state legislature to increase available funds, particularly for rural school districts who he believes are challenged with transporting students over comparatively more miles than urban districts ( 9 ). However, it appears the problem may be more universal than just in rural districts: Over 100 school superintendents across Georgia described inadequate transportation funding as a “significant problem” in a 2019 survey ( 10 ).
An apparent gap in Georgia’s understanding of their issue with school transportation is fundamental, and it informs the research question I analyze in this paper: What factors predict students’ use of the school bus in their travel to school? I hypothesize that race explains significant variation in students’ likelihood of using the school bus in Georgia. To answer this question and assess this hypothesis, I analyze the 2017 NHTS Georgia Add-On to examine morning trips to school among children in Georgia aged 5 to 17. Through a binomial logistic regression model, I find significant effects in students taking the school bus based on distance to school, sex, and race, as well as parental factors and location in the state’s only major metropolitan area, Atlanta. Specifically, I find that Black children and children in greater Atlanta are much more likely to take the school bus, while girls, children of parents with college degrees, and children with parents who have flexible work schedules are less likely to take the school bus.
In this article, I first review the literature on school travel mode choice. Then, I examine the data I use, detail my methodology, and present my findings. I conclude by highlighting implications for school bus service and suggesting further research in this area.
Literature Review
Traveling to school is a near-universal phenomenon in the United States, but scholars have compiled a comparatively small literature on this matter. Most studies focus on narrow geographic areas, like cities or school districts, and many rely heavily on hypotheticals and school-based administrative data. In this article, I focus on four aspects of revealed home-to-school travel relevant to the analysis of Georgia school bus use: an overview of travel-to-school behaviors; a review of the school travel mode prediction literature; a brief synopsis of the role of race in school buses and transportation in Georgia; and an explanation of state school bus policy.
Travel to School
Travel to school in the United States occurs on five principal modes: private automobile; yellow school bus; walking; bicycling; and public transit. The big difference between the commuting patterns of children aged 5 to 17 going to school as compared with their adult counterparts is the school bus mode: roughly 33% of students aged 5 to 17 take the school bus to school. Just over half (54%) of students nationally were driven or drove themselves to school in 2017; of the remaining 12% who did not take a private automobile or school bus, about 10% walked or biked and about 2% took public transit ( 2 ). Over time, the school bus mode share has remained relatively steady; however, the share of students who travel by automobile has skyrocketed, while the share of those who travel by active modes has plummeted ( 11 ).
Public transit’s mode share in this area is highly correlated with whether the school districts offer a yellow bus service. Some high-profile school districts in legacy urban areas—most notably New York City Public Schools (for grades 7 and above) and District of Columbia Public Schools (all grades)—do not offer a general education yellow school bus service ( 12 ). Los Angeles Unified School District provides a minimal yellow school bus service for special student populations and school choice programs only, but unlike New York and Washington where many students use public transit, Los Angeles students are mostly driven to school ( 13 ). As I show in this paper, Atlanta’s student transit use for school transportation also appears extremely minimal.
Across all of Georgia, children use the school bus for 46% of trips to and from school, compared with 48% of trips using a private vehicle, 5% walking, and 1% using all other modes, based on weighted estimates from the 2017 NHTS Georgia Add-On ( 14 ). Georgia respondents indicated that the school bus was the most common “usual” mode of transportation to and from school (59%, compared with 48% for private vehicles). The disparity between observed and reported behavior suggests potential bias in the “usual” mode question on the NHTS, but as Kash et al. note, “[s]tudents’ day-to-day travel diverges, to some degree, from their caregivers’ description of their ‘usual’ behavior” ( 14 ).
Predicting Mode Choice
Several scholars have modeled school travel mode choice examining different geographies and thus different mode choice sets. He used a multinomial logit model to examine personal, environmental, and school factors in predicting mode choice in Southern California ( 15 ). Specifically modeling for walk/bike or school bus use, she found distance, age, ethnicity, family income, population density in the home census tract, and median home value in the home census tract to have significant effects in one or more mode. However, understanding mode availability is an acknowledged limitation of this study; that is, we do not know if a student had a school bus available to them in their choice set, and He mentions the need for examining school busing policies ( 15 ).
Ewing et al. address this issue by examining a single school district in Gainesville, Florida ( 16 ). Although they theorize that school transportation could better fit into a nested logit structure (with families first choosing whether to drive and then choosing from a subsequent set of modes), they find the multinomial logit structure to be preferable because of the absence of strong evidence of shared unobservables. They include a wide variety of variables in their models, including built environment, such as jobs–residents balance and density; urban design, such as sidewalks with trees and sidewalk widths; and school data from the Alachua County School District. Notably, they elected to not analyze public transit as a mode, as only 4 total students used it out of a sample of nearly 800. Ultimately, they found that students with shorter walk and bike times were more likely to walk and bike; they describe school buses as “a mode of last resort” ( 16 ). They also found that urban form was significantly related to walking rates; specifically, they found a positive association with sidewalk width. McMillan generally supports this finding in an analysis of urban form variables in several schools in Northern and Southern California ( 17 ).
Several other studies examine the relationships between a variety of factors and the choice to drive or walk to school. One study of a single school district found an inverse proportionality for household income to the probability that a student will travel by private automobile ( 18 ). Schlossberg et al. find distance, intersection density, and dead-end street density as having increasingly negative effects on students’ choice to walk to school, also supporting the idea that urban form matters in effecting students’ active travel behaviors ( 19 ). They also include survey results that begin to postulate reasons why parents may drive their students, including safety, convenience of trip-chaining, and school requirements, such as carrying musical instruments ( 19 ).
McDonald and Aalborg answer the “why” behind parents choosing to drive their children to school ( 20 ). By analyzing survey data for families with children age 10 to 14 in the San Francisco Bay area, they identify two primary categories for reasons parents drive their children: convenience and safety. Specifically, parents identified that “stranger danger,”“school was too far away,” and the ability to “drop off on way to work” as key reasons for driving.
Three studies look at this from a national level using NHTS data, one of which explains overall mode choice and two of which seek to predict active mode selection ( 11 , 21 , 22 ). All three studies use NHTS data to examine choices, in the former among all modes, and in the latter two the choice to walk/bike. Results were mixed. From the 2009 NHTS, McDonald argues that travel time has the strongest effect on mode choice, but also finds significant effects from age, having siblings, and gender: older children and children with siblings were more likely to ride the bus and walk, and girls were less likely to walk ( 21 ). In a follow-up study, McDonald and coauthors add new variables to their analysis, including parent characteristics like education and place of birth, and examine only the probability of walking or biking to school ( 11 ). They find ethnicity (Hispanic/Latino), household vehicles per driver, and low parent educational attainment to be associated with lower odds of walking, while they find being male, having a higher income, having a foreign-born parent, and living in an urban area all to be associated with higher odds of walking. Above all, they find trip distance to have the largest effect, with increasingly low odds as trips increase toward the 1-mi maximum they imposed. Using 2017 NHTS data, some findings remained the same while others shifted: distance to school, age, vehicle availability, and the built environment remained strong predictors of active mode choice, but race/ethnicity and gender proved insignificant ( 22 ).
Travel Behavior and Race in Georgia and the Southeastern United States
Among the studies I mentioned, few found race to have a strong significance in predicting school mode choice. This is despite evidence that race/ethnicity is a determinant of mode choice—especially public transit use—and of trip-making overall among all people aged five and over ( 23 ). Ewing et al. ( 16 ) and McMillan ( 17 ) do not control for race. He found it to be not significant across all modes ( 15 ); Kontou et al. found the same in predicting active mode selection ( 22 ). McDonald found race to be significantly associated with driving to school among Asian-American families only; she found no significance among Black families ( 21 ). Lidbe et al. found both White and Black students were more likely to use the school bus compared with modes other than active travel and private autos ( 24 ). And McDonald et al. found only borderline significance among Black families ( 11 ). These studies focused either on national trends or on specific geographies, including select school districts in California, Florida, Minnesota, and Oregon. But as I explain in the coming section on mode choice and policy, states are different from each other in this policy area. Furthermore, the Southeast is different as a region; race and transportation in the South—specifically with regard to school buses—has a difficult history.
Perhaps the most popular conception of school buses and race in the South (and indeed most of the United States) is the use of busing to desegregate public schools. Following the landmark U.S. Supreme Court rulings of Brown v. Board of Education of Topeka (1954), which declared racially-segregated public schools unconstitutional, and Swann v. Charlotte-Mecklenburg Board of Education (1971), which legalized the use of busing as a means of desegregating public schools, many school districts across the South, and indeed across the country, came to use school buses as a means to transport Black children to previously predominantly White schools, and vice versa. Conclusions about the strategy’s efficacy, from the lenses of both educational outcomes and social equity, are generally mixed ( 25 , 26 ). The legacy of segregated schools has continued long after another case that the U.S. Supreme Court upheld, Capacchione v. Charlotte-Mecklenburg Schools (1999), overturned Swann; although de jure segregation is legally prohibited, schools across the United States and especially in the South have largely resegregated along racial lines through other means like residential selection and attendance zones ( 27 ).
Specific to Georgia, Clark and Huang analyze changes in commute distance and residential locations in metropolitan Atlanta over time, coincidentally among sample data of teachers ( 28 ). They find that higher-income Black workers can choose new homes closer to their jobs when they move, but lower-income Black workers tend to focus more on neighborhood demographics, indicating a trade-off between neighborhood demographics similar to oneself and shortening commute distance. Higher-income Black workers are more likely to accept living in an integrated neighborhood, even at the expense of longer commutes, while lower-income Black workers are more likely to move to neighborhoods with higher percentages of people who are also Black. These findings are based on data for workers, but the natural extension is that many of those workers have or will have children who attend schools.
More recently, 2017 NHTS data show that Black Georgians’ commute distances and person-miles traveled were similar to White commuters, but because Black commuters were more likely to use slower modes like transit and walking, their trip durations were longer ( 14 ). Analogously, children of color (Black and other non-White races) in Georgia were more likely to walk to school; when Black children walked, they did so for an average of almost double the time of White children (39 to 21 min, respectively).
Providing access to jobs and other opportunities via means other than the private automobile in metropolitan Atlanta has also been racialized over the past half-century. During the formation of the Metropolitan Atlanta Rapid Transit Authority (MARTA) in the 1960s and 1970s, the majority-White outlying counties surrounding Fulton (contains Atlanta) and DeKalb counties voted against membership to MARTA. However, in 2014, residents of southern Clayton County—where the Black population has grown substantially over the past 60 years from half to nearly double that of the White population—voted for a 1% sales tax to fund full MARTA membership ( 29 ).
Mode Choice and Policy
While several studies have examined which factors explain travel-to-school mode choice, one challenge is understanding the role of school bus policy. As Barajas writes, “Travel behavior can be thought as a set of realized practices in response to the availability of transportation resources and a supportive context for enabling travel” ( 30 , p. 3). When offered and available, the school bus is clearly an important resource and piece of the transportation system. Yet because of inconsistencies among state and even local policies, generalizing these studies—or even applying methodologies across regions—is difficult to impossible. This, coupled with the difficulty of obtaining travel survey data that analyze minors, causes a dearth of research on this subject.
Unlike public transit, whose federal authority and funding sits with the U.S. Department of Transportation, school transportation policy and funding is the U.S. Department of Education’s domain. As with transportation, the federal government largely relegates education policy matters to the states; many states further relegate most decisions to the school district level. There are three general models by which states set school transportation policy and funding: (1) the state reimburses local school districts for transportation they provide to students; (2) the state mandates that districts provide transportation to their students (or to some subset of students based on distance to school); and (3) the state allows districts to charge families for the use of transportation services ( 31 ).
There are many different combinations and mutations of these models. For example, as McDonald and Howlett point out in case studies, Alabama, New York (except in major cities), Ohio, and Idaho all require school transportation for their students, yet each state reimburses its districts differently ( 31 ). Alabama uses a linear density formula; Ohio uses a multivariate equation; and New York uses an “approved costs” model. Texas, meanwhile, reimburses districts using a linear density formula, but it does not mandate that its districts provide transportation. Straying from all of these, California has been providing its districts with the same dollar amount of school transportation funding since 1982, sums which hardly cover the current costs of transportation and which the state has not adjusted for population growth ( 8 ). Texas, California, and several other states permit districts to charge fees to families; Hawaii requires fees.
How each of these policy structures affects mode choice is unknown, but I can offer some reasonable assumptions. If a state mandates its school districts provide buses to a subset of students who are eligible, those students are obviously more likely to have the service offered to them than any other policy alternative. The role of funding is less clear; although a state providing funds for school bus service will likely increase the number of students who receive the service in the aggregate, a litany of factors would go into the decisions of local policy makers in providing or not providing school buses. Further, conventional economic wisdom suggests that charging fees would depress usage over a free service alternative. California’s unusual approach suggests much of this: in studying Alameda County, McDonald and Aalborg examined a sample in which less than 5% of students used a yellow bus ( 20 ).
Another consideration, which I argue for in this article, is the factor of race, both in mode choice to school and in policy-making around school transportation. It is highly likely that race, given its operationalization as a social construct, has some role in these decisions. First, from the perspective of a family choosing a travel mode for a child’s school trip, communities of color and low-income communities face barriers that White and high-income communities are less likely to contend with: concerns of crime, personal safety, over-policing, and neighborhood othering and belonging (30). Second, in considering school transportation policies, many policies in transportation have been discriminatory on the basis of race and have affected aspects of travel behavior, including subjective norms and attitudes ( 30 ). Especially in the South, with its legacy of Jim Crow segregation, it is likely that these norms have yet to dissipate fully.
In sum, modeling school transportation mode choice is exceptionally challenging because each state—and often different areas within each state—present users with a different choice set and different costs to that choice set and present different societal and cultural environments in which families make these choices. This paper represents an original contribution in the literature to modeling school trip mode choice at the state level to isolate some of these differences, as all prior papers examine these choices either at the local or national level.
Data and Methods
This analysis uses the 2017 NHTS Georgia Add-On (3). The Federal Highway Administration (FHWA) conducts the NHTS periodically to gather information about travelers and travel behaviors across the United States. Respondents are initially asked about their household and socio-economic traits and their usual travel behaviors; then, they are asked to log their trip-making on a given single travel day. For children under 16, parent/guardian proxies complete the travel diary (90% of this sample). The 2017 NHTS observed travel days between April 2016 and April 2017 for a stratified random sample of U.S. households. In addition to the national sample, the FHWA offers states the ability to purchase oversamples so that state-level analyses can be conducted. Georgia was one of 10 states to participate in the state add-on program, and unlike several add-on participants, it included households from across its entire jurisdiction.
Most important to this study, Georgia is a state that requires school bus provision for its students. In the context of McDonald and Aalborg’s ( 20 ) framework, Georgia is a state that both requires transportation and funds it through a distance-based reimbursement formula; that is, every student in that state who lives at least 1.5 mi from school must be offered a school bus, and the state reimburses the district for a portion of that trip’s cost ( 32 ). Georgia state education law does not authorize its districts to charge user fees.
Here I include all trips that have a destination purpose of going to school, a traveler between the ages of 5 and 17, and a start time of between 5:30 and 10:00 a.m. (Restricting the child’s age to 17 reasonably ensures that the child is in kindergarten through grade 12; students who are 18 years old often attend college and the data do not provide a way to separate out such students.) I use the trip data file of the NHTS for the bulk of the explanatory variables, but I also link to the person-level data to associate children with parents. I include trips only for which all relevant explanatory variables have complete data (which excludes eight observations for not recording household income). I also disaggregate between trips that are mandatory under state law and those that are not. Because I cannot assume that a student who lives within 1.5 mi of school had the option of taking a school bus, I exclude 218 such trips, even though districts are permitted to offer bus service to students inside the 1.5-mi threshold. (Note that this inhibits analysis of walking trips as most such trips occur within 1.5 mi of school.) I also eliminate 12 trips with incomplete data. In all, the final sample has 1,044 trips.
Table 1 shows the sample’s frequency statistics and summary statistics for categorical and continuous variables, respectively. Most students in this sample take either a private automobile or the school bus to school; in fact, all other modes collectively only equate to about 2%. Nearly half the students are in elementary school (using age as the proxy for grade level), with roughly a quarter each in middle school and high school. About two-thirds of the sample identifies as non-Hispanic White, about a quarter as non-Hispanic Black, and less than 5% as Hispanic or Latino. In the sample, roughly one-third of trips were taken by children living in the Atlanta core-based statistical area (CBSA). Across the 1,044 trips, the average distance to school was 5.6 mi and the average duration was just shy of 22 min.
Frequency and Summary Statistics
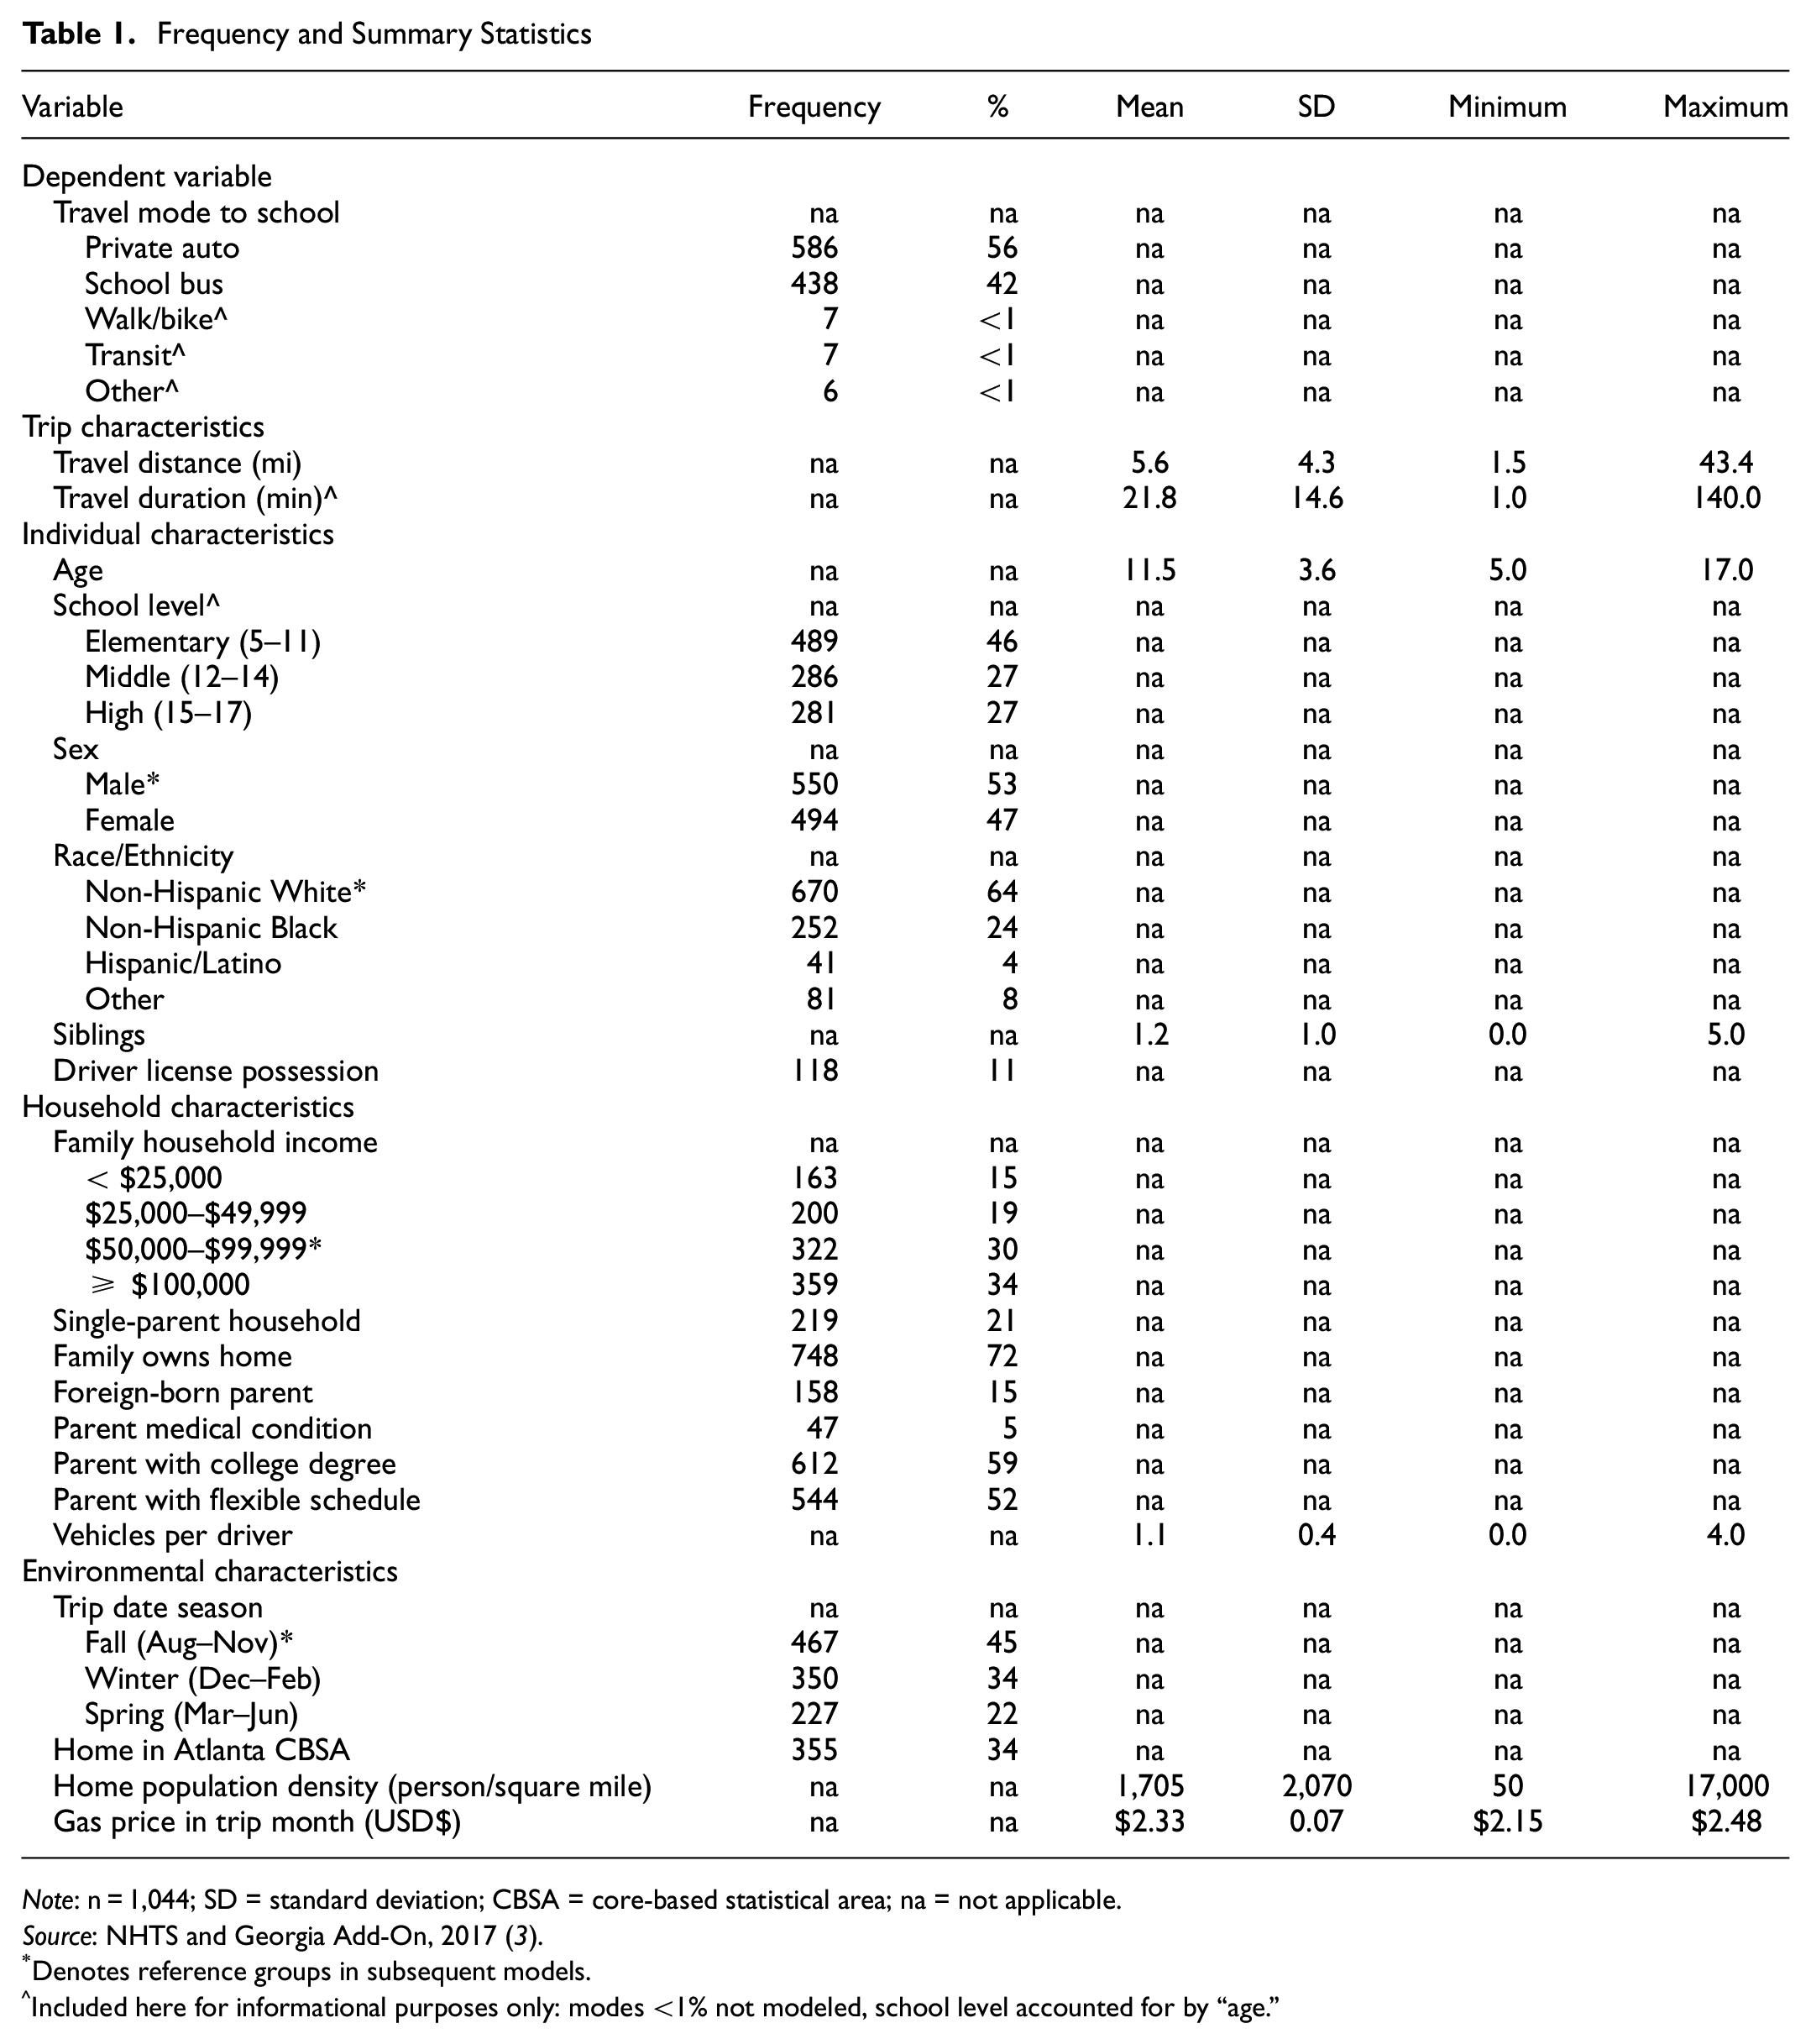
Note: n = 1,044; SD = standard deviation; CBSA = core-based statistical area; na = not applicable.
Source: NHTS and Georgia Add-On, 2017 (3).
Denotes reference groups in subsequent models.
Included here for informational purposes only: modes <1% not modeled, school level accounted for by “age.”
To analyze what factors are associated with school bus use, I use a binomial logistic regression model similar to McDonald et al.’s model of students choosing to walk to school ( 11 ). Because the overwhelming majority of bus-eligible Georgia students choose the school bus or private automobile for school travel, this creates an implicit dichotomous choice set between the two. I focus on school bus use in a binary logistic regression model estimated using maximum likelihood. For reference and confirmation, I also run a binary logistic regression model for automobile use (which is inherently an approximate inverse of the school bus model). I group the explanatory variables into three categories–trip/individual characteristics, household/family characteristics, and environment characteristics–most drawing from prior studies, including Wilson et al.’s list of variables previously examined in this field ( 33 ). I completed all data assembly and analysis using Stata 17.
The binary logistic model assumes that children and their parents, as a collective unit n, choose to use the school bus, a binary dependent variable, based on Equation 1:

where
I then calculate the odds ratio for students taking the school bus. Lastly, I calculate the marginal effects of each parameter by calculating their derivatives. Because I leave the very small number of trips taken on modes beyond the school bus and private automobile, I also repeat the same processes above to model private automobile mode selection. However, by nature of the data being nearly dichotomous between the two modes, the two models are nearly inverse of each other.
Results
As the funding debate (see Introduction) currently surrounds buses, I focus my descriptions here on predicting school bus use. I also provide results for modeling private automobile trips since the two are not perfectly inverse. The binary logistic regression model for school bus trips correctly predicted whether a student used the school bus for 68% of the observations. The private automobile model had the same predictive power. Both models also had McFadden’s R2 of roughly 0.13. Both models had roughly the same significant variables, with one additional variable significant for autos (number of siblings). All models also included significant variables from all four characteristics groups: trip; individual; parent and household; and environment. Table 2 displays the odds ratios, P values, and marginal effects for each variable for both bus and auto predictions. (Tables 3 and 4 in the Appendix include standard errors and confidence intervals for each respective mode model.)
Odds Ratios and Marginal Effects on Probability of Georgia Travel-to-School Mode Choice
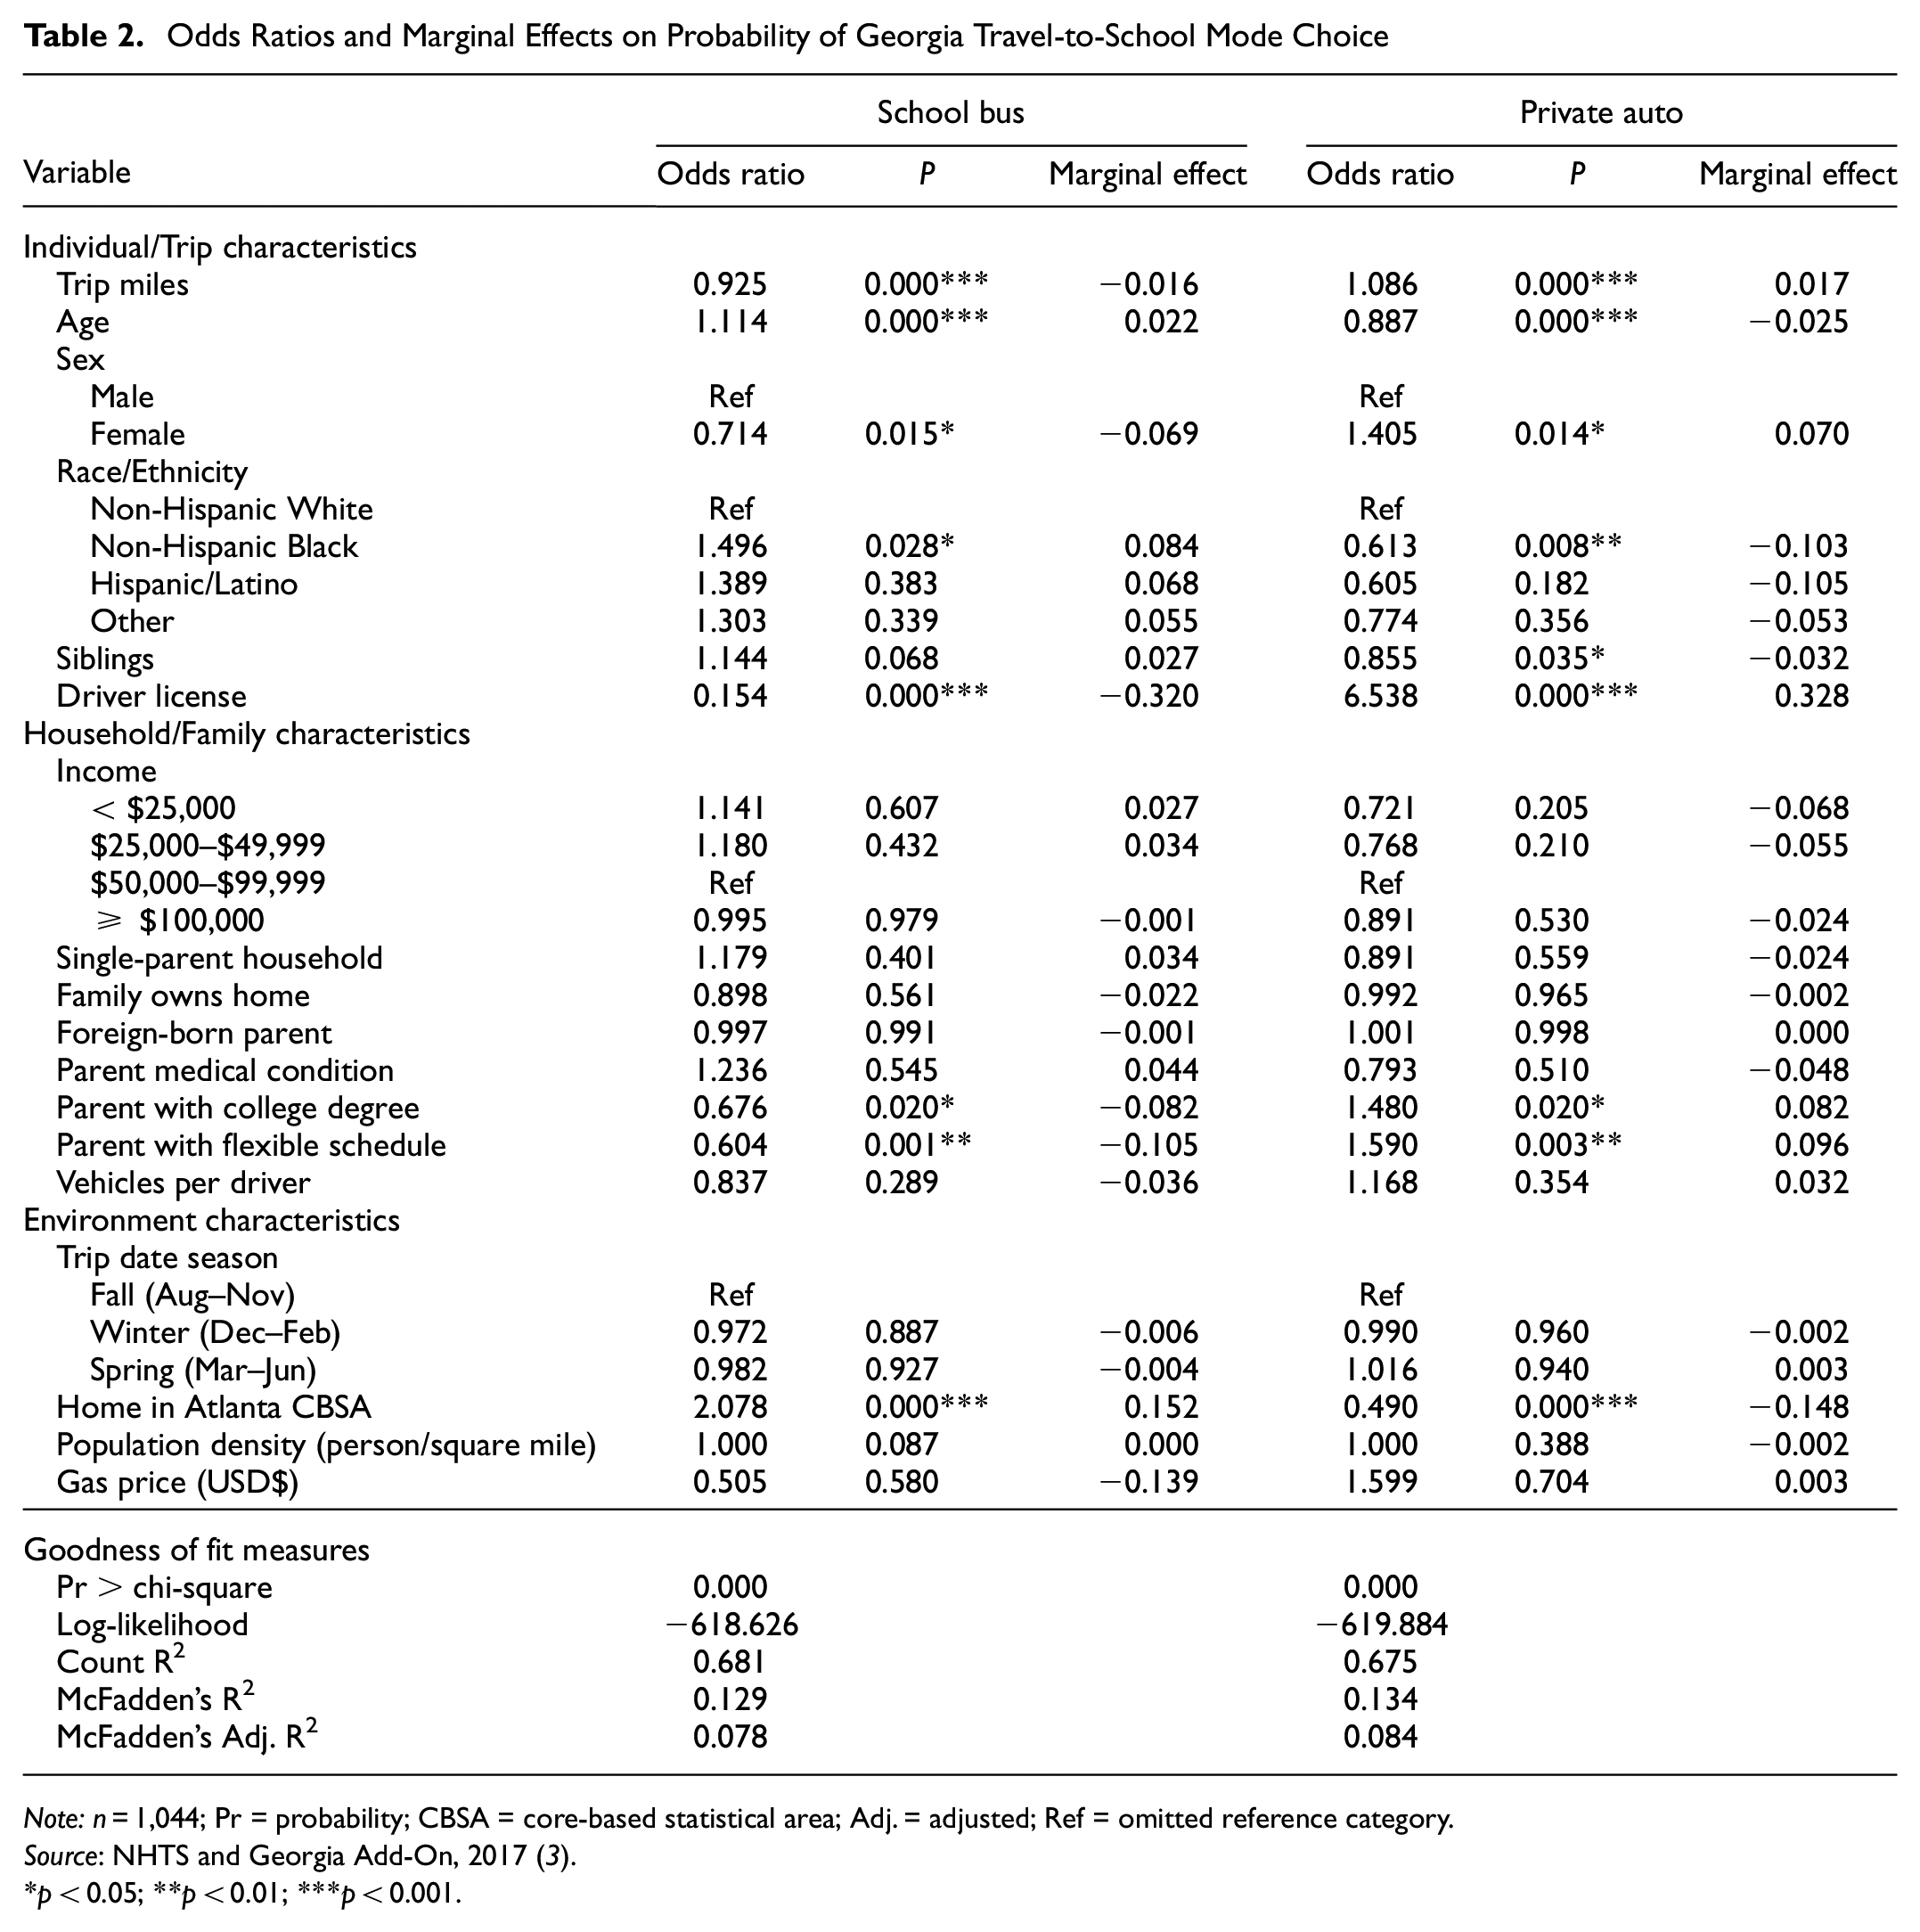
Note: n = 1,044; Pr = probability; CBSA = core-based statistical area; Adj. = adjusted; Ref = omitted reference category.
Source: NHTS and Georgia Add-On, 2017 (3).
p < 0.05; **p < 0.01; ***p < 0.001.
Individual Characteristics
As previous studies suggest, distance is a determinant in school trip mode choice ( 11 , 19 , 21 , 33 ); the longer a student’s trip, the less likely they are to take the bus. Most other studies also suggest that age is a strong predictor, and the same holds true here. Students who are older are increasingly more likely to take the school bus. There is also a gender divide: girls are much less likely than boys to take the school bus, and about 1.4 times more likely to drive or be driven. Once children reach driving age, their possession of a license is a strong predictor that they will abandon the school bus for their own vehicle.
Most notably, race is a significant predictor of school bus use. Black students are about 1.5 times more likely to use a school bus than their White peers. Overall, race as a variable is significant (P >
Parent and Household Characteristics
Contrary to previous studies, household income here is not a significant predictor of school bus use. Nor are other factors that other studies have suggested, including parent marital status, home ownership, parent place of birth, and household vehicles per driver. As with McDonald et al. ( 11 ), I find parent educational attainment to be a significant factor: children of parents with college degrees are about two-thirds as likely to take the school bus as those children of parents without college degrees. The second strongest predictor (aside from driver license, which only applies to children above age 15) of taking the bus belongs to children whose parents have flexible work schedules. Given the meteoric rise in flexible and remote work during the COVID-19 pandemic, I discuss implications for this finding in the next section.
Environment Characteristics
The biggest predictor of school bus use in this study for all ages is whether a student lives in the Atlanta CBSA, which includes Fulton County (Atlanta) and 28 other outlying counties. Here, students are more than twice as likely to ride the school bus as those students outside metro Atlanta. With a population of over 6 million, it is the lone major metropolitan area in Georgia and home to 60% of its population ( 34 ). Thus, this finding does not suggest something unique in Atlanta Public Schools; rather, it suggests something is at play throughout the area. Further research could investigate this growing region. Lastly, with Georgia’s relatively mild climate during the academic year, it is understandable that season of travel is not a significant predictor of mode choice. This might be different for students who live in the Northeast and Midwest during the frigid winter months.
Verifications and Extensions
I find this model to be well-specified using the Hosmer-Lemeshow statistic. Dividing into groups of 10, I find the Hosmer-Lemeshow statistic to be 5.97, and theProbability >chi-square to be 0.65. I first tested model diagnostics using standardized Pearson residuals; although a handful of observations did have residuals greater than 2, none seemed unusual at the observation level. To test for influential observations, I plotted the predicted Pregibon’s influence statistic measure against the observation ID and found only one observation that appeared to be an outlier. I did not remove this observation as doing so did not meaningfully adjust any betas.
In addition, I took two steps toward further investigating to what degree the trip itself is different for Black students. First, I ran the binary logistic regression with an interaction term between trip distance and race. All variables remained at the same levels of significance, and in the interaction Black children were less likely to take the school bus as trip distance increased; however, Black children regardless of distance were three times as likely to ride the bus. (I chose to present the model without the interaction terms because it is not possible to calculate the marginal effects of each variable with interaction terms present, which would prevent a continuation of prior works such as McDonald et al. [ 11 ].) Second, I sought to verify the role of race in predicting distance to school (rather than mode choice). In the results of an ordinary-least squares (OLS) regression with the natural log of trip distance as the dependent variable (results available on request), I find that only age, living in the Atlanta area, population density, and vehicles per driver are significant predictors of trip distance, among the same explanatory variables as the model shown in Table 2. This suggests that Black students are not being subject to longer trips to school, nor are they going to school closer to their homes, but that they are for some otherwise unknown reason much more likely to take the school bus. However, further analysis of this issue is beyond the scope of this article.
Discussion
In building on previous studies, this paper expands the framework of modeling school transportation mode to an entire state with a uniform policy with regard to who is and is not offered school bus service. As in prior studies, I find that distance to school, age, possession of a driver license, sex, and parent education all play significant roles in children deciding their school transportation mode. The first three have obvious explanations. First, parents might be more likely to trust older students to ride to school without them, and older children generally live further from school. Second, even though licensing rates among teenagers have slowed ( 35 ), this analysis indicates that when a student possesses a license, they are quick to abandon the school bus. This could suggest not only that students are more likely to drive themselves but that they could also be more likely to find a ride with a classmate who has access to a vehicle.
Unlike most previous studies of school mode choice detailed earlier, I find race to be a significant determining factor among Black children. I propose that this could be because of two complementary forces. First, this may be because Black students make up a greater share of the overall student population in Georgia: 32% of Georgia families are Black, compared with 13% of the overall U.S. population ( 34 ). Further, the Black population around Atlanta has been growing at a rate that far outpaces that of the White population ( 29 ). A larger share of the population—especially when considering the trend of resegregation in U.S. schools—opens the possibility that Black students might be less likely to experience issues of neighborhood othering and belonging in Georgia, which could alleviate some concerns with using a form of shared mobility like the school bus, especially if riding the school bus becomes normalized in those communities. Second, the history of Black students in the Southeast is different from other regions in the country. While Black students across the United States have undoubtedly faced discriminatory forces in public education, students in the Southeastern states contend with the enduring legacy of Jim Crow segregation laws and the resistance toward undoing that legacy. Part of that legacy was widespread busing for desegregation, which may have had the tandem effect of normalizing school bus use among Black students and deterring its use among their White peers. Taken together, this suggests that nation-level studies of school travel behaviors do not adequately capture regional differences and implies that race in Georgia matters more than other variables found to be significant by other researchers that are not so here, like income.
Also contrary to previous studies with other geographies, income does not predict school bus use in Georgia. This is a departure from other studies at the local or national level—even those that control for race. Descriptively, lower-income students are more likely to take the school bus (60%) than higher-income students (32%), but these differences are explained in the model by the suite of other variables associated with the parents/guardians and household: single-parent, homeownership, place of birth, medical conditions, flexible work schedules, and vehicles per driver. These variables have obvious associations with income; however, other studies found income—especially high-income levels—to be significant in predicting mode choice, even when controlling for some/all of these variables ( 11 , 22 ). Another potential explanation is the correlation between race and income; that is, a much smaller share of Black students is in the highest income group compared with White students, meaning that race may to some degree absorb the effect of high incomes, enabling students to choose modes other than the bus. (Unfortunately, small sample sizes of students who are not White or Black in the NHTS Georgia Add-On do not allow for this race-income interaction in the models.)
Additionally, there is an evident urban–rural gap in school bus use among eligible students: rural students are half as likely to use the school bus as students living in the state’s sole major metropolitan area. Why might this be the case? We know rural students were eligible for a bus by state law, and we know distance to school has a much smaller negative effect on school bus use than residing outside the Atlanta area. I speculate two reasons for this based on some descriptive calculations from the NHTS Georgia Add-On: relative efficiency of school bus service and student population racial composition. First, although rural children live further from school on average, trip durations do not grow consistently with mode. Trips in private automobiles in rural areas take less time to cover greater distance than in urban areas, whereas trips on school buses take more time in rural areas to cover greater distances, thereby creating a relative advantage for the car in rural areas. This is probably because of the combination of less traffic congestion in rural areas and longer bus trips resulting in more stops, with rural students living in less-dense areas, but this may cause families to choose driving their children to school. Second, while the rural Black population share in the sample (25%) still exceeds the national level, the share of Black students in greater Atlanta (41%) is much greater, again suggesting the possibilities that concentrations of Black students normalize school bus use and reduce students’ issues of neighborhood othering and belonging ( 30 ).
Finally, the model introduces a relatively unexplored explanatory variable: the influence of a parent’s flexible work schedule on mode choice. He and Giuliano have found that parents’ flexible work schedules influence a parent’s decision to escort their child to school when the father is part of the trip but not when the mother is on the trip ( 36 ). Here, I find that there is strong overall evidence to suggest that either parent having a flexible work schedule increases the likelihood that a Georgia household eligible for a school bus will forgo that option in favor of chauffeuring their child(ren) in a private vehicle. This potentially corroborates suggestions that school chauffeuring leads to a surprisingly high level of morning peak travel among telecommuters ( 37 ). It also has important implications for a post-COVID-19 pandemic world in which scholars have suggested that many employers will extend some of the flexibility they have offered employees during the pandemic once normalcy returns ( 38 ).
Conclusion
This study offers important information for Georgia policy makers to consider in planning for school travel and a model by which other states could examine school bus use. Although these results may not be generalizable beyond Georgia, the advantage of using a single-state sampling frame—scaled up from previous studies that use a single city or region and scaled down from previous studies that examine the nation—is that it focuses the analysis on one relevant policy environment. This allows important conclusions to be drawn about individuals statewide, including the role of being in the state’s major metropolitan area compared with rural areas.
These findings come in sight of a pending fiscal cliff in public education across the United States. Buoyed by the Elementary and Secondary School Emergency Relief (ESSER) funds, districts have had financial leeway for the past few years that will expire in 2024. Before the COVID-19 pandemic, districts were struggling with funds in recovering from the Great Recession; education economists predict the struggle after ESSER funds run out will be even worse ( 39 ). School bus service was under threat in other states in the Great Recession ( 40 ), but these findings suggest that Georgia state leaders should prioritize resources to continue supporting school bus service in the future on the grounds of racial justice, academic achievement, and practicality.
To address my hypothesis at the outset of this paper, this analysis makes clear that funding and promoting school bus service in Georgia is important from a racial equity and justice standpoint. Black students disproportionately rely on school buses to get to school, in both rural and urban areas. Ultimately, the yellow school bus in Georgia represents Black students’ access to educational opportunity in a place where the Black population continues to grow. Reducing bus service in the face of budget constraints directly diminishes that access and further perpetuates discriminatory policies in transportation and education.
Of further importance, school bus use has been shown to be associated with lower rates of chronic absenteeism for all students ( 41 ), which is a critical part of reducing levels of educational inequality and the Black–White achievement gap ( 26 ). Unfortunately, this article’s data set does not include information on students’ academic outcomes, to which future research should seek to connect to determine the importance of school buses in improving academic outcomes.
Finally, the important issue of school bus use deserves synergistic attention from the Georgia state government. The results of the model make clear that students across Georgia rely on school bus service to attend school, yet funding for it has remained largely unadjusted since the Quality Basic Education Act of 1985. Over the past two decades, the percent of school transportation expenditures borne by the state has decreased from 30% in 2000 to just 14% in 2019 ( 9 , 10 ). While school bus service is the legal purview of the Georgia Department of Education, all Georgians stand to benefit from an increase in school bus use—directly through decreased traffic congestion and lower vehicle emissions or indirectly through improved educational outcomes that positively affect the labor force. Indeed, school buses in Georgia handled more than double the number of trips handled by all of the state's traditional public transit systems combined in 2016 to 2017. School buses in Georgia, and particularly in Atlanta, may be showcasing some of the demand for non-private automobile travel in the state where widespread transit has long been suppressed.
Georgia’s public schools face myriad trade-offs, especially with classroom financial needs. Other government entities, like the state’s Department of Transportation and metropolitan planning organizations—especially the Atlanta Regional Commission, the metropolitan planning organization for the 11-county Atlanta area with higher school bus use rates than the rest of the state—should explore ways they can assist the education department and the state’s school districts in providing this essential service. In doing so, the state could and should return school bus funding to prior levels. Further, the Georgia legislature should adjust its reimbursement formula to keep pace with rising costs and inflation so that the financial burden does not shift onto local school districts who face many competing budget priorities with much smaller coffers. Additional research could assess how any potential additional funds might affect school bus usage among different students in Georgia and how such changes in usage might effect changes in both transportation system and student academic outcomes.
Supplemental Material
sj-pdf-1-trr-10.1177_03611981231164388 – Supplemental material for Who Takes the School Bus? The Roles of Location, Race, and Parents in Choosing Travel-to-School Mode in Georgia
Supplemental material, sj-pdf-1-trr-10.1177_03611981231164388 for Who Takes the School Bus? The Roles of Location, Race, and Parents in Choosing Travel-to-School Mode in Georgia by Samuel Speroni in Transportation Research Record
Footnotes
Acknowledgements
My thanks to Brian D. Taylor and Miriam Pinski for their thoughts on the findings and manuscript. I also thank Jean Daniel Saphores for methods instruction and research design guidance. Finally, I thank the three anonymous reviewers and Alex Karner, handling editor, for their insightful feedback and suggestions.
Author Contributions
The author confirms sole responsibility for the following: study conception and design, data collection, analysis and interpretation of results, and manuscript preparation.
Declaration of Conflicting Interests
The author declared no potential conflicts of interest with respect to the research, authorship, and/or publication of this article.
Funding
The author received no financial support for the research, authorship, and/or publication of this article.
Supplemental Material
Supplemental material for this article is available online.
References
Supplementary Material
Please find the following supplemental material available below.
For Open Access articles published under a Creative Commons License, all supplemental material carries the same license as the article it is associated with.
For non-Open Access articles published, all supplemental material carries a non-exclusive license, and permission requests for re-use of supplemental material or any part of supplemental material shall be sent directly to the copyright owner as specified in the copyright notice associated with the article.