
Abstract
The market penetration of shared micro-mobility services (shared bikes, e-bikes, and e-scooters) suggest that young and highly educated people constitute a group of people that is more eager to use such services. However, little is known about the factors influencing their behavioral intention as a system. The analysis may provide insights on the adoption of shared micro-mobility services by modeling them as a system using multivariate ordered probit. This paper contributes to the existing literature by evaluating similarities and differences to these services focusing on assessing the behavioral intentions of a large sample of young and highly educated people that traditionally show a higher tendency of adopting technologically innovative services. It is hypothesized that the mobility patterns can affect people's adoption of these shared services in a car-dependent empirical setting. The analysis suggested that a variety of variables affect the behavioral intention to use shared micro-mobility services, such as employment situation, household size, travel patterns, level of awareness, and attitudinal variables in the form of perceptions on incentives and infrastructure. This study can enhance the current understanding of the factors affecting the behavioral intention, facilitating the development of policies toward such means of transportation. The results could convincingly answer key questions on the market adoption of these shared services, and characteristics of distinct market segments; thereby providing a deployment pathway for adoption. Additionally, the results could be useful to original equipment manufacturers for marketing and pricing-scheme decisions, planning agencies for policy-making decisions, and to transportation planners for provisions in infrastructure.
Keywords
Technology is rapidly transforming both vehicles and transportation systems. The “sharing” economy is growing and affecting mobility in urban areas including additional travel alternatives, such as active travel, car-sharing, ride-hailing, shared micro-mobility and other micro-transit services ( 1 ). Shared mobility has grown with a renewed interest in urbanism, where developing concerns strengthen the need for sustainable alternatives with regard to the environment, energy, and economy ( 2 , 3 ). Moreover, the literature suggests that the recent pandemic (COVID-19) may affect urban mobility patterns directly, and especially shared transportation modes such as shared micro-mobility ( 4 – 6 ). However, there is no consensus on the impact that this disruption in transportation will have. Some studies concluded that a shift from public transportation and other shared transportation options to private transportation options will be observed ( 7 – 9 ). Whereas other studies indicated that shared micro-mobility services receive more attention as travel behavior trends in the post-pandemic era are shifting in that direction ( 10 – 13 ).
Furthermore, studies suggest that young adults, such as university students, are a population that is more eager to use shared micro-mobility services ( 14 – 17 ). Similarly, there is an upward trend in micro-mobility services on university campuses ( 12 , 18 ). University campuses constitute a prime example of effective applicability of shared micro-mobility services given their high levels of population density and that most of the students’ age and habits (tech-savvy, easy access to smartphones) are apt for active travel. Moreover, there is a higher need of short distance trips on university campuses, where students move around between buildings and many live near the university ( 19 , 20 ). Studies show that universities are embracing sustainability plans in which the implementation of shared micro-mobility services is a major component ( 12 , 19 , 21 , 22 ) that can contribute to anti-congestion and parking management strategies ( 23 , 24 ). Innovative shared micro-mobility services, such as shared e-scooters, are providing new insights into the trend of the sharing economy and its business models. These services are altering transportation supply because of increased demand and providing a form of urban mobility that is more friendly to the environment ( 3 , 25 ).
The COVID-19 pandemic, which began in 2020, affected transportation systems ( 6 , 26 , 27 ). Shared micro-mobility services increased their market share in urban areas ( 4 , 28 , 29 ). For example, it was found that shared e-scooters can substitute trips made by other transportation modes such as car-sharing and ridesharing services ( 30 ), public transportation and walking ( 31 ). Therefore, in the aftermath of the pandemic, the increased use of shared micro-mobility services can serve as an opportunity for sustainable transportation and these emerging transportation services can form an alternative transportation mode from complementary to full trip solutions, where possible.
Many studies have examined shared micro-mobility services, focusing on topics that are demand- and supply-related. The most frequently studied mode of shared micro-mobility services is shared bikes ( 29 , 32 , 33 ). Studies have examined the influence on use of shared bikes of factors such as built environment (i.e., Wang et al. [ 34 ] and Wu et al. [ 35 ]), socio-demographic characteristics (i.e., Shaheen and Chan [ 25 ] and Chen et al. [ 36 ]), trip characteristics (i.e., Eren and Uz [ 37 ] and Wuerzer and Mason [ 38 ]), weather and environment (i.e., Campbell and Brakewood [ 39 ] and Slovic and Ribeiro [ 40 ]). Additionally, there is a surging trend of studies focusing on shared e-bikes (i.e., Guidon et al. [ 41 ] and He et al. [ 42 ]) and shared e-scooters (i.e., Aguilera-García et al. [ 43 ] and Sanders et al. [ 44 ]). However, potential interrelations between these different shared micro-mobility services can be evaluated in a holistic way to understand the public acceptance and shed light on factors influencing the adoption of such services as a system; a topic that has received little attention. Further, a similar finding among studies evaluating shared micro-mobility services across general population groups suggests that young people and people with high education level constitute the most frequent users ( 45 , 46 ); though studies did not focus on specifically examining the factors influencing the behavioral intention of these user groups.
A notable investigation of shared micro-mobility services was the study by Reck and Axhausen ( 16 ) that focused on examining the behavior of commuters with regard to shared micro-mobility services. The empirical setting is Zurich, Switzerland; an urban setting that is considered an early adopter of micro-mobility services, where only one-quarter of the population commute using private vehicles and approximately 8% of commuters use bikes. Additionally, Blazanin et al. ( 14 ) considered awareness or first use and use frequency of shared micro-mobility services by incorporating latent psychological and social constructs using structural equation models applied in a generalized heterogeneous data model. This study focused on the U.S. city of Austin, TX which has an advanced transportation infrastructure and a significant portion of its commuters use alternative transportation modes rather than single-occupant vehicle trips.
Taking the reviewed literature into account, the overall research objective of this study is to evaluate the factors influencing the intention to use shared micro-mobility services, such as shared bikes, e-bikes, and e-scooters. The contributions of this paper are (a) to examine and assess the similarities and differences of shared micro-mobility services, (b) involving a large sample of young and highly educated people, (c) in an empirical setting where people predominantly use private vehicles for their trips, and (d) how the COVID-19 pandemic can serve as an opportunity to alter the current transport culture.
Data and Empirical Setting
The empirical setting evaluated in this study is Nicosia, the capital and the largest city of Cyprus, situated in the southeastern part of Europe with approximately 300,000 inhabitants living in the greater urban area ( 47 ). The statistics of the commuting modal split report that more than 90% of people residing in Nicosia travel using their private vehicles, around 6% and 3% walk or use public transportation, respectively, and less than 1% cycle ( 48 ). Cyprus has approximately 645 passenger vehicles per 1,000 inhabitants, which is above the average of 560 passenger vehicles per 1,000 inhabitants across European Union (EU) member states ( 49 ). These statistics indicate the car dependence of the empirical setting. Thus, there is a great potential, need and applicability of sustainable transportation modes such as shared micro-mobility services in Cyprus, given the binding agreement of EU member states to a climate target plan to reduce their greenhouse gas emissions by at least 55% below 1990 levels by 2030 ( 50 ).
Nextbike is the bike-sharing system currently operating in Nicosia, where interested people can rent bikes, return bikes, or both, via an app. The Nextbike service is expanding in Nicosia and currently there are 56 stations (including six e-bike stations) and 121 bikes. The pricing scheme provides a monthly subscription service (€20), where subscribers can use the service for up to 2 h on a daily basis and a pay-as-you go service that costs €2 for the first hour and €1 for every successive hour (€8 maximum daily charge). Figure 1 provides a visual depiction of the trips (origin–destination) conducted using the bike-sharing service in Nicosia for the period from September 2019 to September 2021 (27,597 total trips).
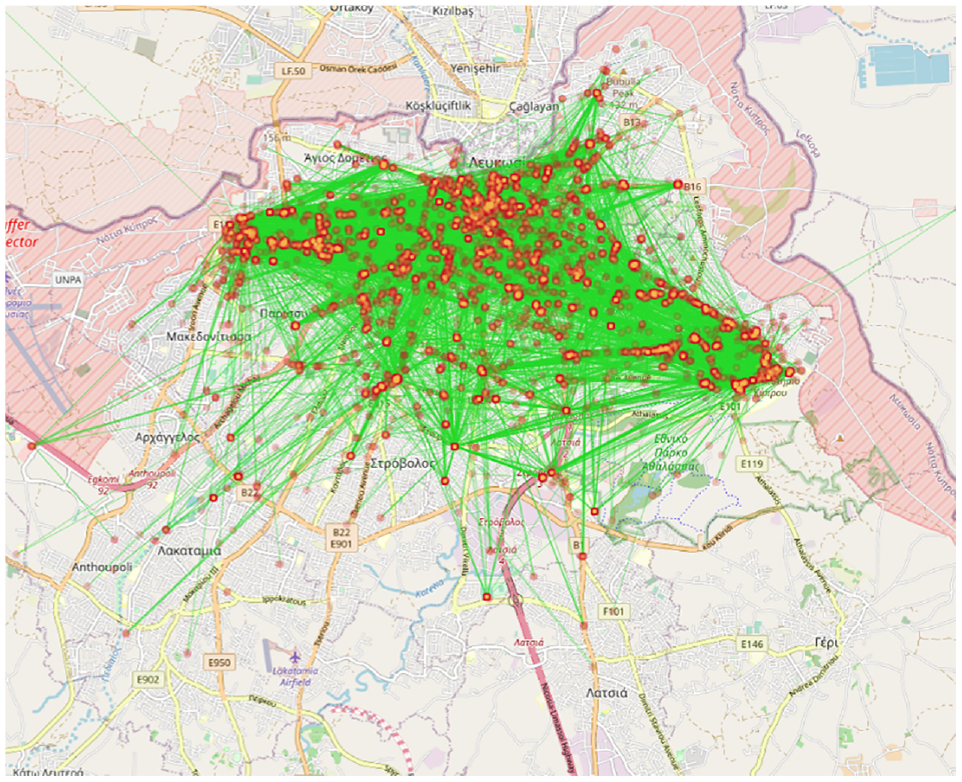
Map of Nicosia showing shared bike trips (September 2019–September 2021).
To achieve the research aim stated above, a detailed survey was designed. The target population of the survey were young (18-30 years old), highly educated adults residing in Nicosia. To reach such a population, we decided to distribute the survey across the undergraduate and postgraduate students at the University of Cyprus (UCY). UCY is the largest public university in Cyprus, located in the urban area of Nicosia; the campus is rapidly expanding (approximately 85,000 m2) with more than 6,000 students, 113 laboratories, and 22 departments ( 51 ). The survey was distributed to capture students’ current travel patterns and to understand their mobility portfolios and intentions toward sustainable transport strategies. After the questionnaire was drafted and reviewed, it was pretested before the survey launch via a pilot survey, where the survey instruments were tested successfully in a smaller sample.
The survey included five main sections based on the supporting literature, where the first section included socio-demographic questions relating travel characteristics to different socio-demographic profiles. Questions were included about gender, age, employment situation, annual household income, highest level of education, people and children living in a household, and holders of a driver’s license. The second section included questions on travel-related characteristics, where respondents were asked to fill out a mini travel diary recording their transportation mode for each trip purpose. This had the purpose of soliciting a mobility portfolio for each respondent and thereby understanding their travel patterns. The third section of the survey included residence, with area-specific questions to capture built environment characteristics aiming to implement a spatial component in the analysis. The fourth section of the survey included questions about respondents’ awareness of bike-sharing services. The fifth section included questions about perceptions of different sustainable strategies that aim to disincentivize single-occupant vehicle trips and promote sustainable transportation options, such as shared micro-mobility services, public transportation, parking management strategies, and carpooling.
The final survey instrument was distributed online in April and May 2022. A total of 2,462 anonymous responses were received (GDPR (EU) 2016/679) as a part of a larger project that collected data from students, staff, and faculty. After data cleaning and preparation, 1,216 completed responses from students were used for the analysis. Adequacy analysis evaluating the precision or degree of confidence of the sample is an important step. The parameters particularly influencing the sample size are the population of the target group (student population of the university), the confidence level, and the margin of error, as shown in Equation 1.

where MoE is the margin of error, z is the z-score for 95% confidence level (1.96), p is the initial estimate of probability which is not known (a value of 0.5 is used as a conservative assumption), and n is the targeted sample size (student population of the university equates to 6,127 students). It is recommended that a minimum sample size for a survey is associated with the targeted confidence level, typically at 95% ( 52 ). A confidence level of 95% is widely used as a benchmark tackling the trade-off of cost and data precision ( 53 ). The collected sample that will be used for the analysis corresponds to at least a 99% confidence level and 3% margin of error. These statistics ensure the representativeness of the collected data and the robustness of analysis since they are above typical statistics of state-of-the-art surveys. The descriptive statistics of survey variables included in the final model are shown in Table 1.
Descriptive Statistics of Survey Variables
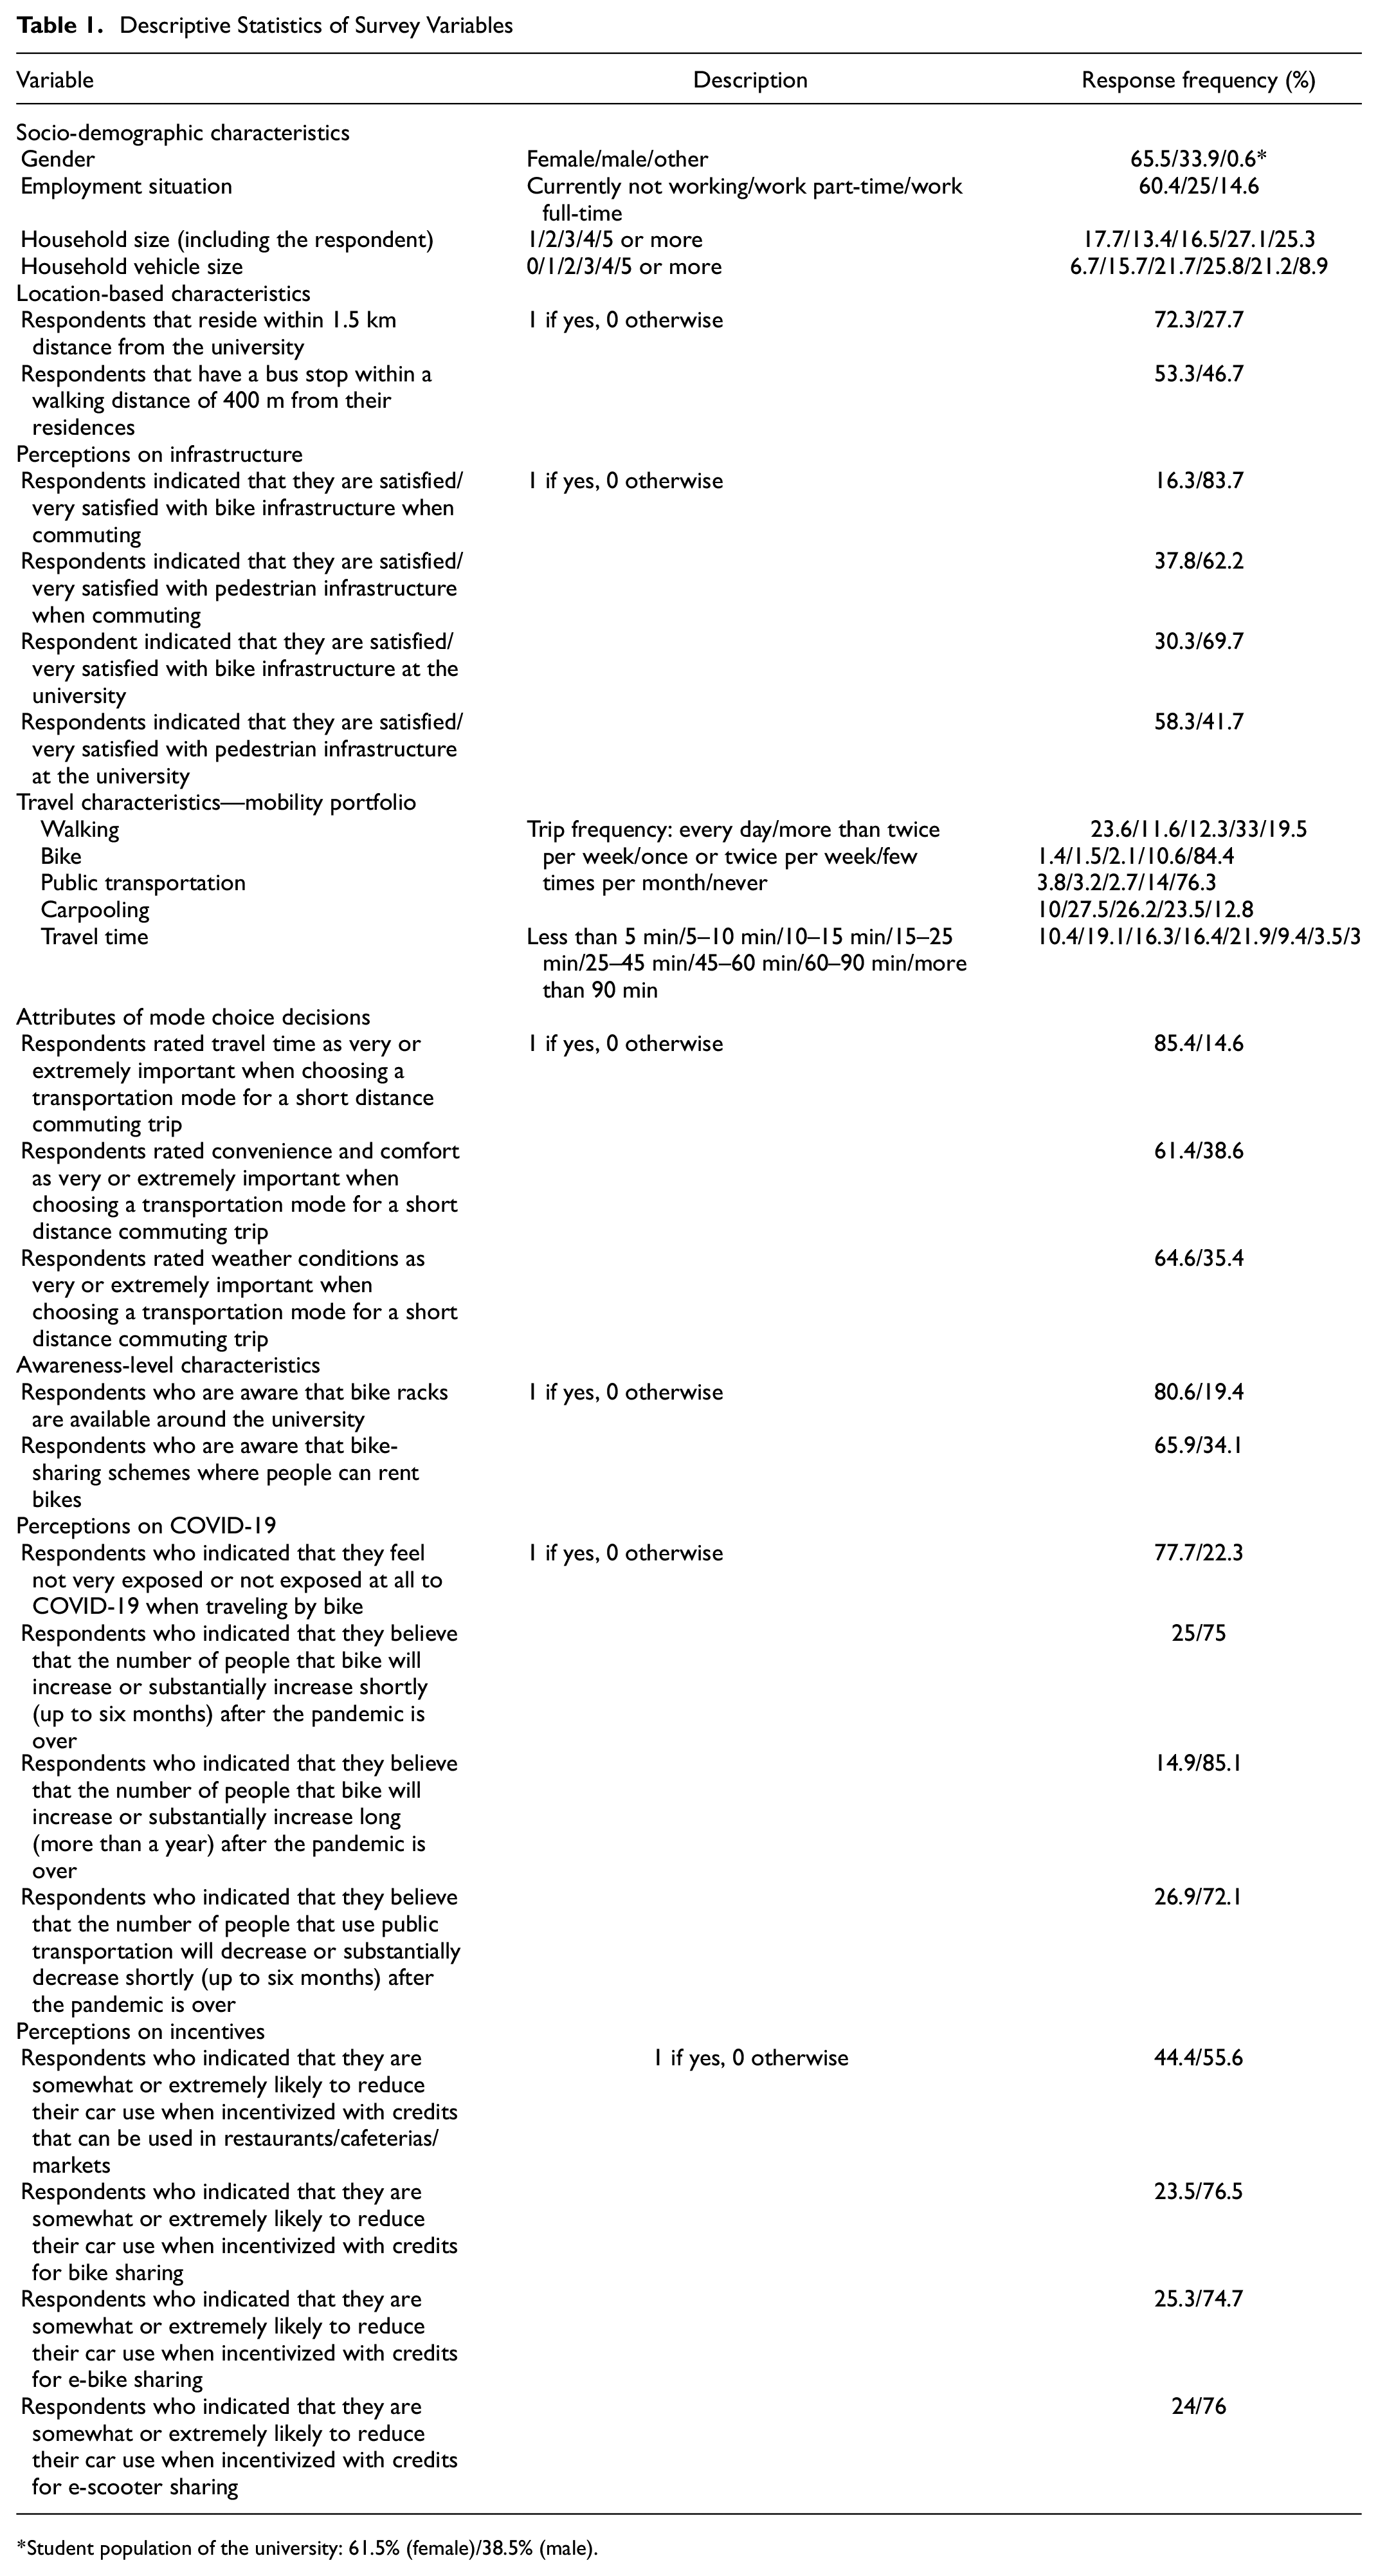
Student population of the university: 61.5% (female)/38.5% (male).
Turning to the evaluation of factors influencing young people’s behavioral intention to use shared micro-mobility services, the respondents were asked to indicate their intention to use shared bikes, e-bikes, and e-scooters. Specifically, the survey questions that were modeled as dependent variables are the following: “Suppose that the university decides to provide you with (i) shared bikes, (ii) shared e-bikes, (iii) shared e-scooters that are widely available. How frequently are you planning to use a (i) shared bike, (ii) shared e-bike, (iii) shared e-scooter?” The responses were expressed in a seven-point Likert-type scale as: never, a few times in a couple of months, a few times in a month, once a week, two to three times a week, once a day, more than once a day. However, where there were few responses for some categories, they were grouped and thus four categories were formed for each dependent variable. These categories are labeled for descriptive purposes as: “non-riders” (people who responded “never”), “occasional riders” (a few times in a couple of months), “frequent riders” (a few times in a month and once a week), and “captive riders” (two to three times a week, once a day, and more than once a day). The descriptive statistics of the dependent variables are presented in Figure 2.
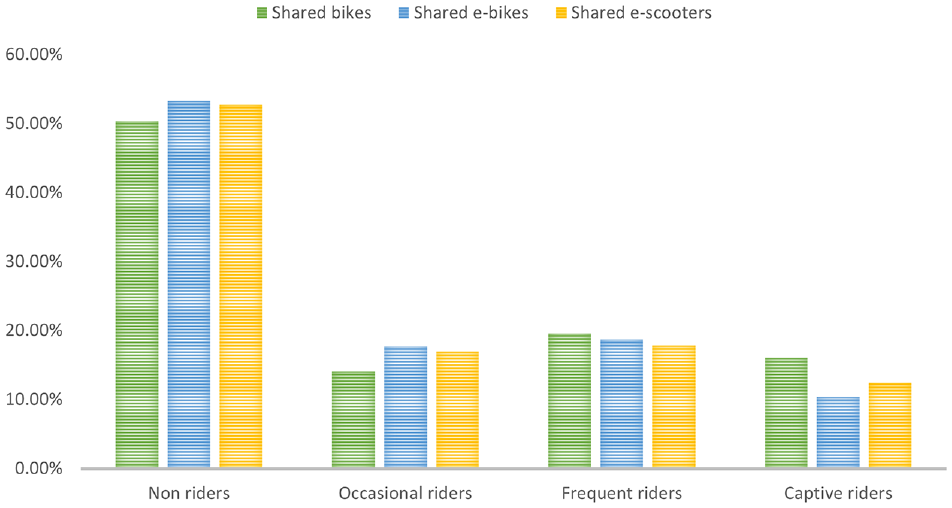
Descriptive statistics of dependent variables.
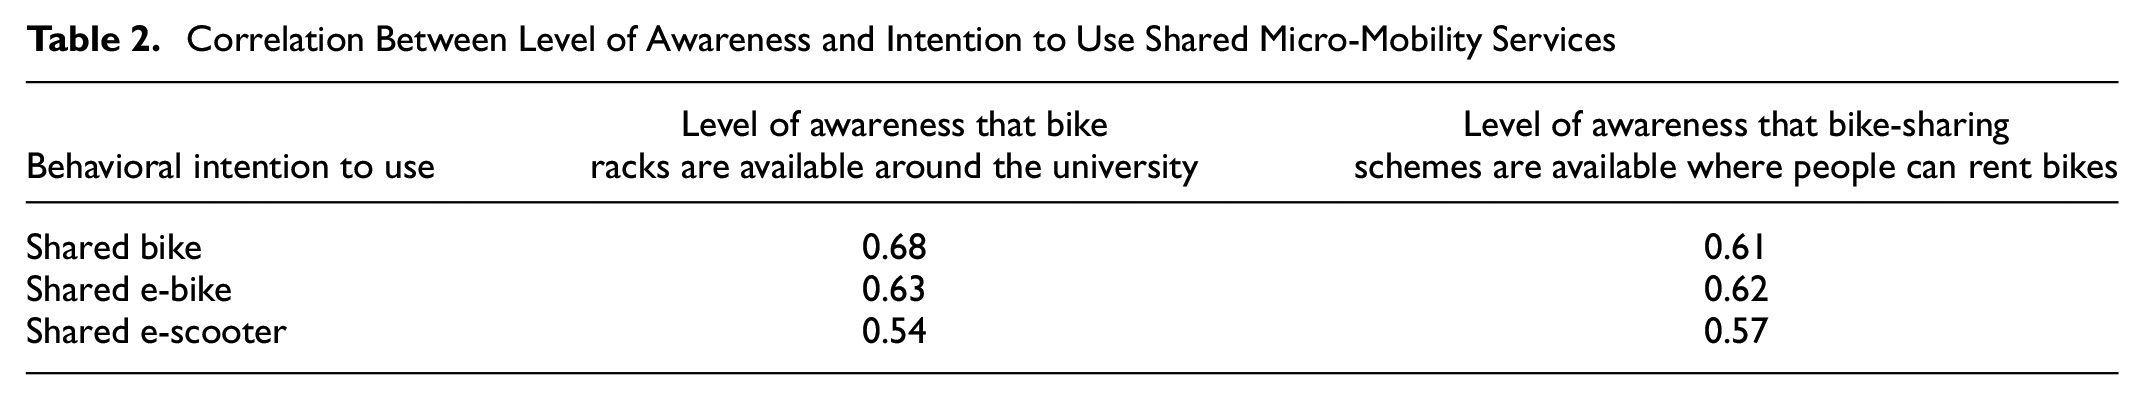
With regard to sustainable strategies promoting shared micro-mobility services, the patterns depicted in Figure 3 suggest that relatively few respondents were not aware of available bike racks or the existence of bike-sharing services. The illustration suggests that there is a correlation worth exploring in a higher level of awareness of these facilities and the intention to use shared micro-mobility services. Particularly, it was found that the correlation coefficients (presented in Table 2) of the level of awareness that bike racks are available around the university are 0.68, 0.63, and 0.54 between the behavioral intention to use shared bikes, shared e-bikes and scooters, respectively. Similarly, the correlation coefficients of the level of awareness that bike-sharing schemes are available where people can rent bikes are 0.61, 0.62 and 0.57 between the behavioral intention to use shared bikes, shared e-bikes and scooters, respectively. Therefore, emphasis on enhancing the level of awareness might be a key factor toward increasing modal share for these modes.
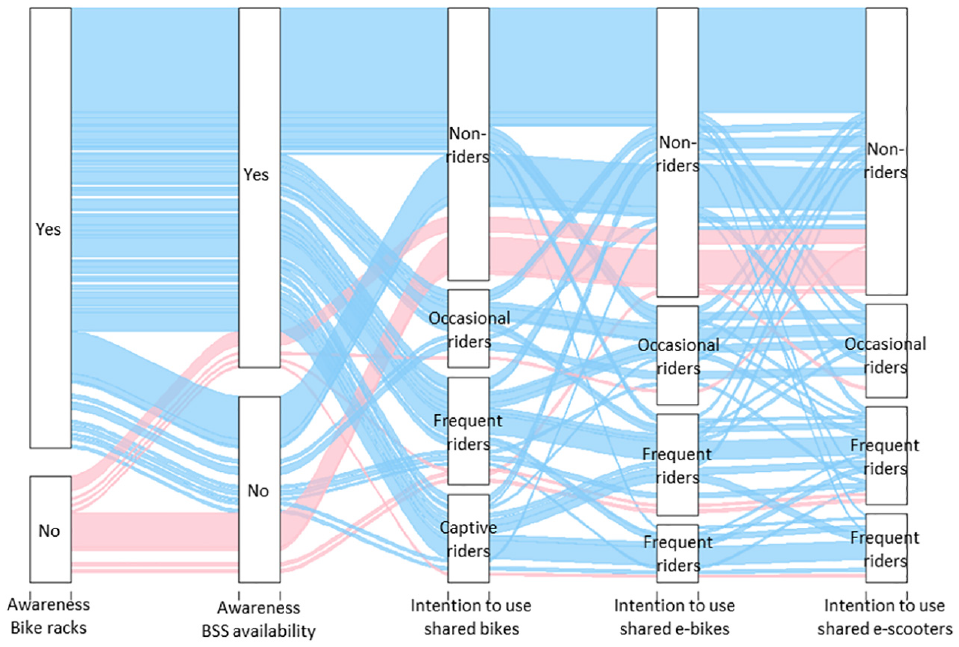
Alluvial diagram of shared micro-mobility services.
Correlation Between Level of Awareness and Intention to Use Shared Micro-Mobility Services
Methods
The nature of the dependent variables is discrete ordered. Ordered probit models are derived by defining an unobserved variable Z for modeling the ordinal ranking of data ( 54 ). The unobserved variable Z is specified by a linear function characterized by Equation 2:

Using Equation 2 and assuming the random disturbance ε as normally distributed across observations with mean equal to zero and variance equal to one, an ordered probit model can be determined with the probability of each ordered category being selected, characterized by Equation 3:

where Φ is the cumulative normal distribution, following this straightforward representation for evaluating an ordered probit model.
A critical methodological issue when evaluating dependent variables in univariate ordered probit models in this case is the neglect of the apparent correlation between the behavioral intention to use shared bikes, e-bikes, and e-scooters. Particularly, the intention to use shared bikes may act as a motive for the intention to use shared e-bikes and e-scooters. This hypothesis is also tested for whether it is supported by quantitative evidence. Indeed, the correlation coefficients between the behavioral intention to use shared e-bikes and e-scooters are 0.60 and 0.53, respectively. Similarly, the correlation coefficient between the behavioral intention to use shared e-bikes and e-scooters is 0.68.
It is assumed that the existence of cross-correlation, in combination with the potential existence of unobserved factors related to the behavioral intention to use shared micro-mobility services, suggests that modeling them as a system may be most appropriate ( 55 ), as shown in Equation 4.

where y is ordinal nature of the integer,

where
The model is estimated through an iterative process, while making educated hypotheses and assumptions on the variables used. The iterative process also factors the pairwise correlation matrix between the independent variables to ensure that highly correlated variables (i.e., as a rule of thumb, a cutoff value of 0.6 was used) are not included simultaneously in the final model, thereby avoiding potential multicollinearity issues. When the model is estimated, the signs of the parameter estimates are interesting for the interpretation of the model. Specifically, a positive sign of parameter estimate indicates increase of the probability of the outcome and decrease of the probability. The opposite interpretation is applied when the parameter estimates have a negative sign.
Results
Travel Patterns
The statistics of the collected data elucidate the modal split of the obtained sample. The results suggest that more than 66% of the respondents opt for single-occupant vehicle trips, followed by the proportions who carpool, walk, use public transportation, and cycle. These travel patterns are illustrated spatially in Figure 4. Specifically, spatial analysis of the travel patterns was conducted, which produced different maps for each transportation mode, depicting the number of responses per ZIP code and the respective trip frequency for each mode.
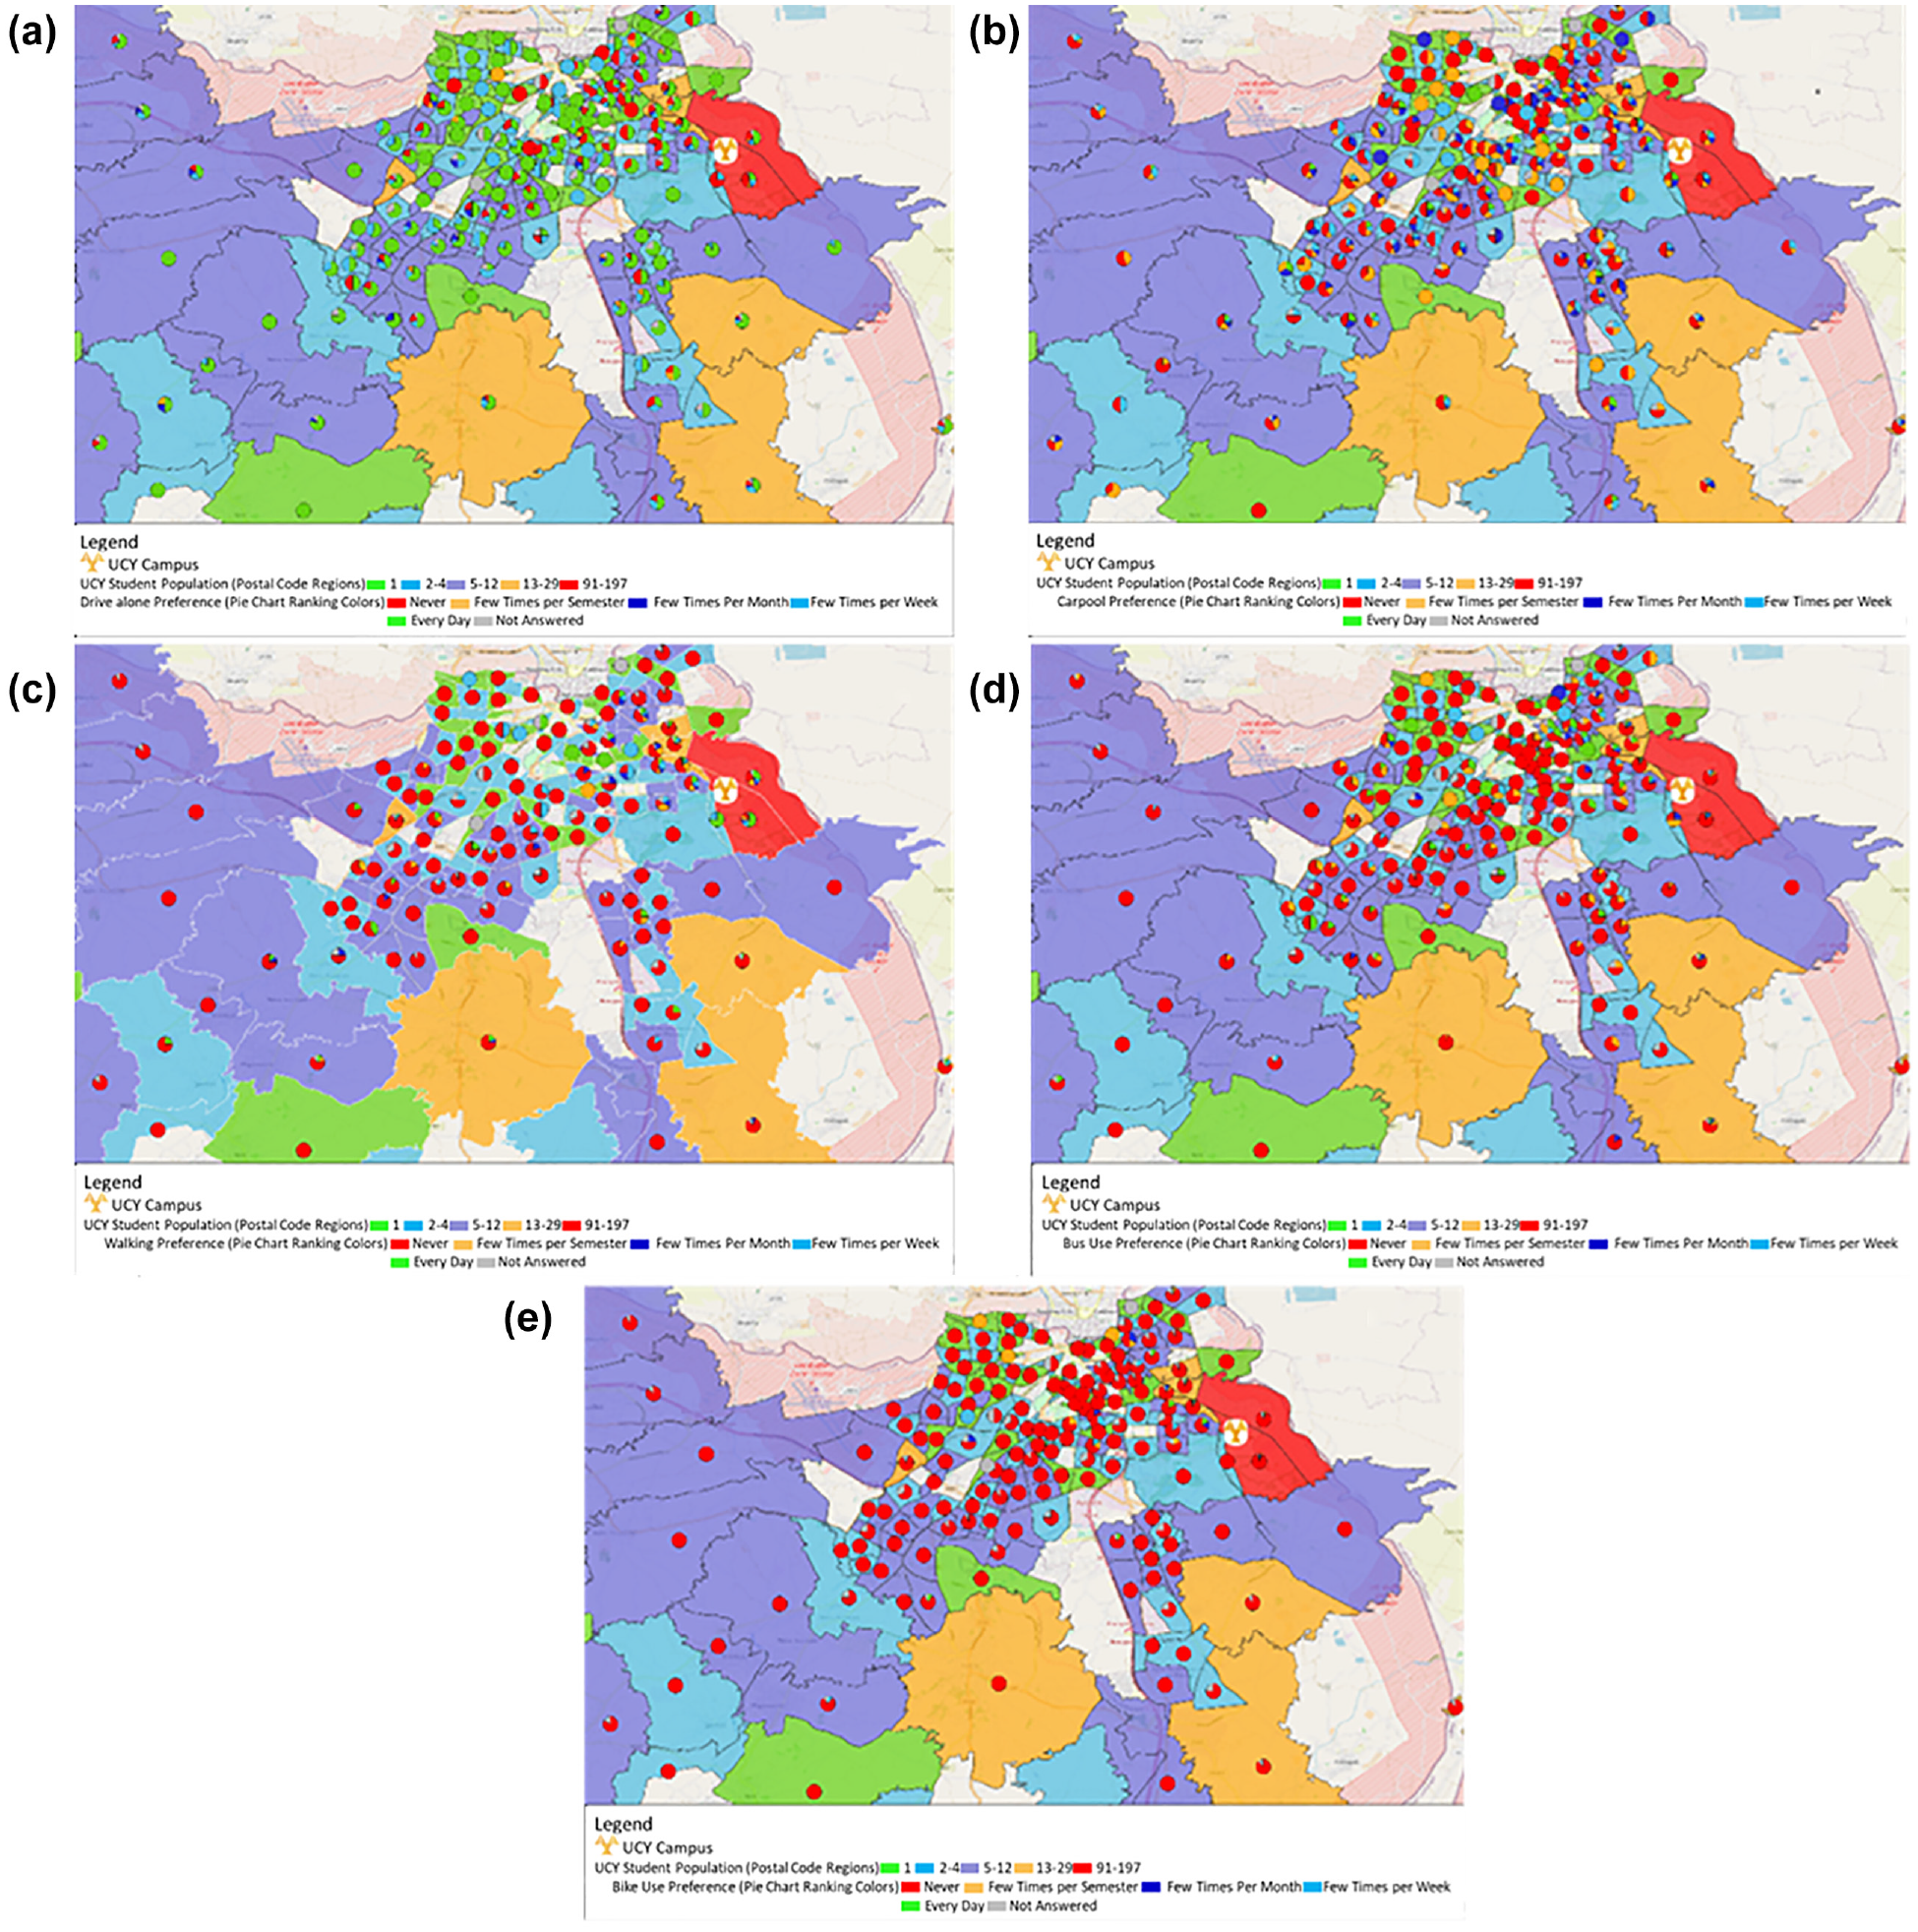
Travel patterns by spatial level of analysis: (a) single-occupant vehicle trips, (b) carpool, (c) walk, (d) public transportation, and (e) bike.
Overall, the results suggest that people who live close to the university tend to be less car-dependent and opt to use alternative transportation modes for their commuting trips, whereas people who live further from the university are more likely to drive alone daily.
The spatial distribution of people who drive alone indicates that driving alone constitutes the dominant transportation mode for commuting trips (e.g., pie charts of Figure 4a have a more dominant green color—driving on a daily basis—compared with the pie charts of Figure 4, b to e , that have a more dominant red color— never using these modes). As shown in Figure 4a, the respondents who reside further away from the university have a higher tendency to drive alone more frequently (green color). A portion of those residing in specific ZIP codes close to their jobs indicate that they never drive alone (red color), signifying that this group of people does not have access to a private vehicle and opt for commuting via alternative sustainable transportation options. This can indicate that trip distance may be correlated to people driving alone. Furthermore, as shown in Figure 4b, carpooling is the second most popular transportation option. (There is no official carpool service, people arrange carpool travel to the university ad hoc). The spatial analysis shows particularly that carpooling does not include captive riders, people who carpool every day; whereas it includes frequent and occasional riders (blue and orange colors), people who either carpool a few times per week (who tend to live closer to their jobs) or few times per month (who tend to live further away). The spatial distribution of people who walk, as shown in Figure 4c, shows that people who live closer to the university tend to walk every day (green color). Lastly, the spatial analysis indicates that only a small fraction of people use public transportation (Figure 4d) or bike (Figure 4e) for their commuting trips (red color), an indication that these options may have inadequate infrastructure, operational, and supply-related characteristics.
Statistical Analysis
The estimation results of the multivariate ordered probit model are presented in Table 3. The independent variables related to the respondents’ perceptions of the pandemic and of incentives were shown to be inherently endogenous with the behavioral intention to use shared micro-mobility services. Therefore, to account for the potential endogeneity, binary univariate probit models were calculated as instrumental variables. Particularly, the endogenous independent variables related to the perceptions were modeled as dependent variables, where socio-demographic and travel characteristics were used as independent variables. The calculated probabilities of these univariate binary ordered probit models were thus used as the independent variables in the estimation of the multivariate ordered probit model that evaluates the factors influencing the intention to use shared micro-mobility services.
Parameter Estimates
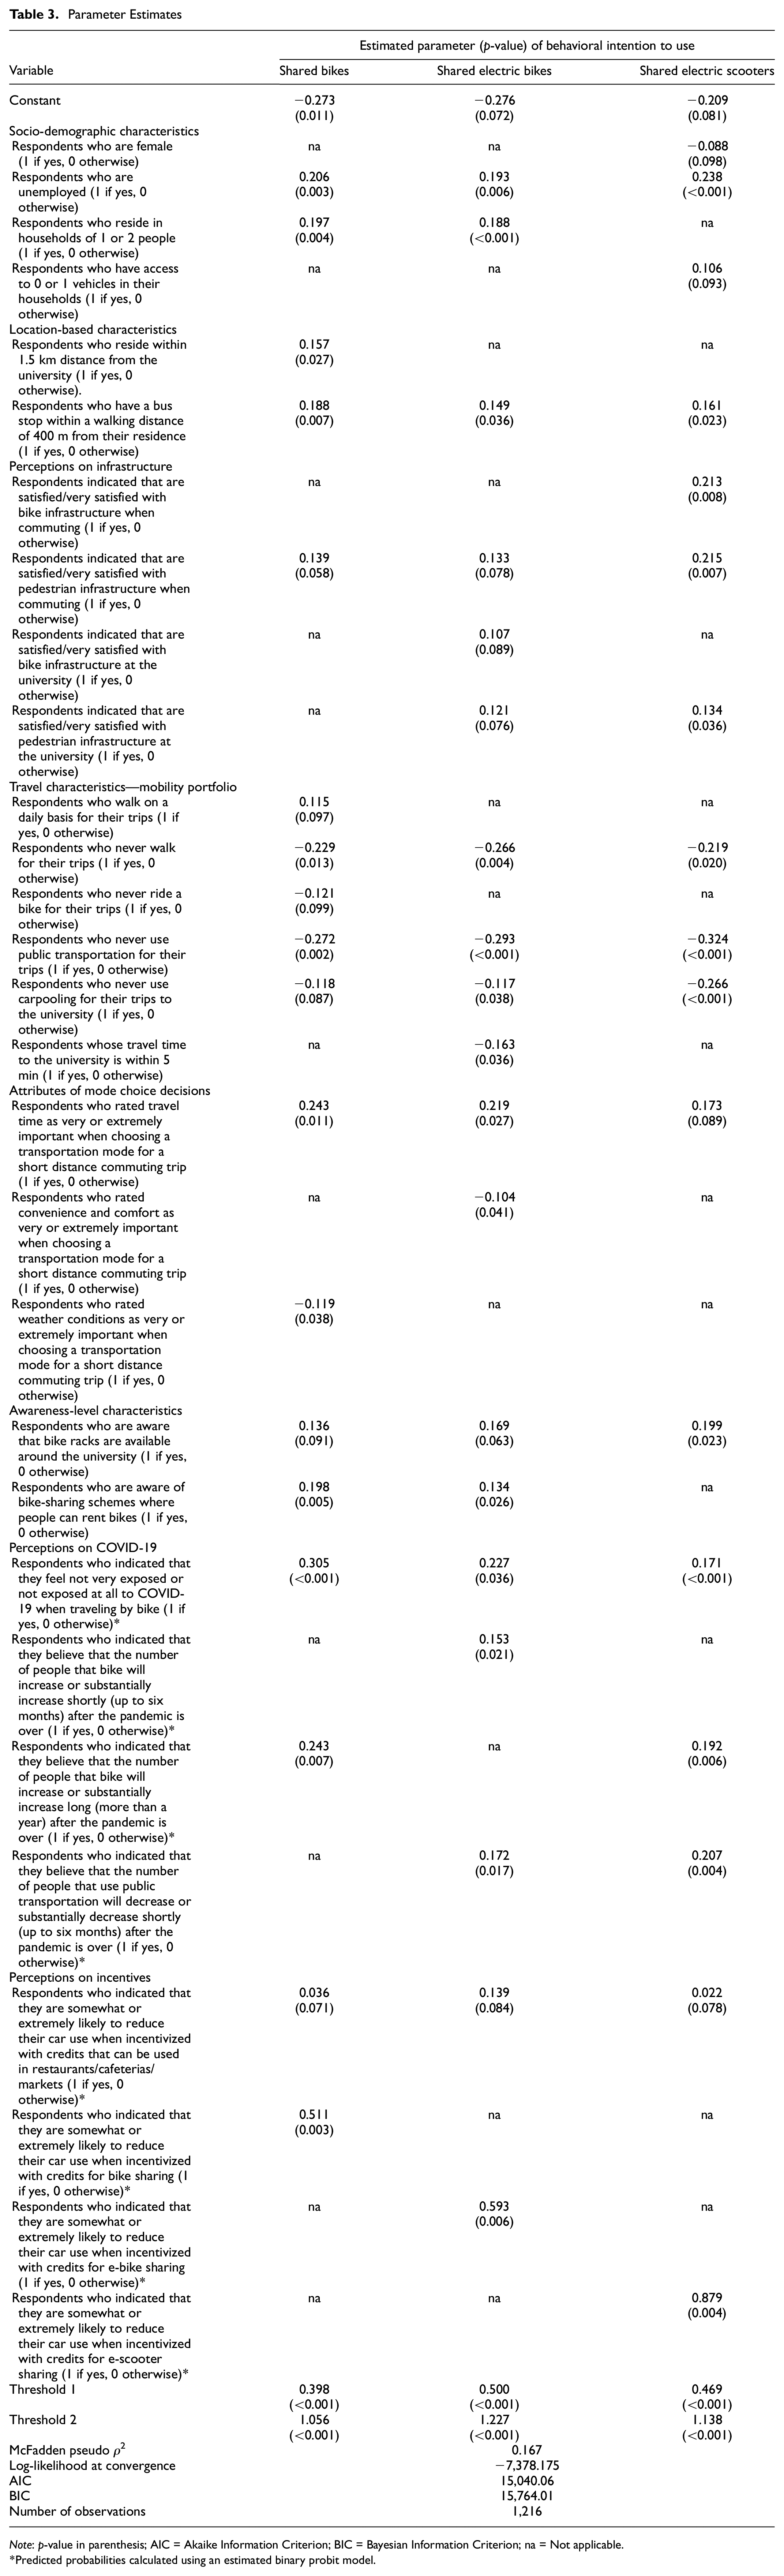
Note: p-value in parenthesis; AIC = Akaike Information Criterion; BIC = Bayesian Information Criterion; na = Not applicable.
Predicted probabilities calculated using an estimated binary probit model.
The goodness-of-fit measures for selecting the best model include the likelihood ratio test statistic, the McFadden pseudo R2, and the AIC (Akaike Information Criterion) and BIC (Bayesian Information Criterion). Further, the cross-eq6 correlation coefficient between the behavioral intention to use shared bikes and e-bikes was 0.687 (p-value < 0.001), between shared bikes and e-scooters was 0.618 (p-value < 0.001), and between shared e-bikes and e-scooters was 0.772 (p-value < 0.001). Given the statistical significance level for all pairs of variables, evaluating the factors influencing young people’s behavioral intention to use shared micro-mobility services as a system (via multivariate ordered probit) is the appropriate modeling technique, thereby confirming the initial hypothesis statistically.
The results based on the socio-demographic characteristics indicate that female students are less likely to use shared e-scooters, compared with their male counterparts. Further, unemployed people are willing to use all shared micro-mobility services, a finding that contrasts with Reck and Axhausen ( 16 ), who found that full-time employed people are more willing to use shared micro-mobility services. Additionally, people who reside in households of one or two people are more willing to use shared bikes and e-bikes, whereas it people who have access to one or no vehicles in their households are more prone to use shared e-scooters, which is supported in Reck and Axhausen ( 16 ) but contrasted in Blazanin et al. ( 14 ) and Aguilera-García et al. ( 43 ).
With regard to the location-based characteristics, it was found that people residing within 1.5 km from the university campus are more likely to use shared bikes, which is supported by the literature ( 56 ). The explanation for this may be that shared bikes, compared with shared e-bikes and e-scooters, necessitate physical activity (no electric motor is available) and distance is influential in this decision. Further, people who have a bus stop within a walking distance of 400 m (a widely used rule of thumb for public transportation accessibility, e.g., Brand et al. [ 57 ]) from their residence are more prone to be captive riders of shared micro-mobility services; a finding that elucidates that this group of people might also use public transportation for their trips which indicates a multi-modal lifestyle ( 58 – 61 ).
The results based on the perceptions of infrastructure suggest that people who are satisfied with the bike and pedestrian infrastructure when commuting and at the university are more likely to use shared micro-mobility services. This finding might suggest, on a policy level, that emphasis on the infrastructure of active travel modes may yield a higher market share. This might be particularly the case for urban settings that are car-dependent, as the results suggest that efforts on improving infrastructure yields positive effects on increasing the public acceptance of shared micro-mobility services. This key outcome was found in previous studies focusing on bike sharing ( 32 ); however, this study extends this finding to other shared micro-mobility services across young people.
With regard to the travel characteristics, it was found that people who walk daily are more likely to use shared bikes. On the contrary, people who never walk, bike, use public transportation or carpooling for their trips are not likely to use the shared micro-mobility services; this is the group of people who predominantly rely on their private vehicles for their trips. Turning to the attributes of mode choice decisions, it was found that people who rated travel time as an important attribute when choosing a transportation mode for short distance commuting trips are willing to use shared micro-mobility services, whereas people who rated convenience, comfort, and weather conditions as important attributes are less willing to use them. That young people who value travel time are more willing to use shared micro-mobility services is an indication that this group of people is more prone to use these services for commuting trips. Therefore, this finding on young people corroborates the results found in the literature for the general population ( 28 , 62 ).
The results based on the awareness-level characteristics suggest that people who are aware that bike racks and bike-sharing services where people can rent bikes are available around the university are are more likely to use the shared micro-mobility services. These outcomes suggest that awareness is a key determinant for increasing the modal share of these modes and therefore communication plans should emphasize increasing people’s awareness. This key outcome that the level of awareness plays a pivotal role in increasing the public acceptance of these modes is supported by the literature ( 22 , 63 ); a finding that was found for other emerging services, such as autonomous vehicles ( 64 – 67 ) and electric vehicles ( 68 – 71 ), and it has the potential to increase the knowledge and eventually aid in increasing the uptake of these emerging services ( 72 ).
With regard to perceptions of the effects of COVID-19, it was found that the pandemic could constitute an opportunity for policy makers to embrace an increase in people’s willingness to use these shared micro-mobility services. Specifically, the respondents believed that there will be an increase in the number of people using bikes for their trips when the pandemic is over; a finding that is also supported by the literature, where it is indicated that riding a bike is one of the transportation modes with the lowest level of exposure to the COVID-19 virus ( 13 , 73 ). Moreover, people who believe that the number of people using public transportation will decrease when the pandemic is over are more likely to use shared e-bikes and e-scooters, which suggests that substitution patterns might occur where people will shift from public transportation to shared micro-mobility services.
The results based on the respondents’ perceptions of incentives suggest that those who are likely to reduce their car use when incentivized with credits that can be used in restaurants, cafeterias and markets are more likely to use shared micro-mobility services. This is a key finding of this study, with its focus on young people that past studies deemed to be a population that is more keen on using shared micro-mobility services, as the results suggest that incentives play an important role in increasing their intention to use such services.
In evaluating the effects of individual variables, the multivariate ordered probit model can provide insights based on the signs of coefficients. Particularly, it provides a general indication on how the probability increases or decreases in the extreme categories (“no-riders” and “captive riders”). However, as noted in Washington et al. ( 54 ), a practical difficulty of ordered probit models is associated with the interpretation of intermediate categories. Depending on the location of the thresholds, it is not necessarily clear the magnitude of effect a positive or negative β has on the probability of these interior choices ( 74 ). To address this problem, marginal effects are calculated for each category. Their values provide an understanding of the direction of the effects on intermediate categories (“frequent riders” and “occasional riders”). The marginal effects for the final multivariate ordered probit model are presented in Table 4. Note that the analysis produces marginal effects for each respondent, so the values presented in this table are the average marginal effects over the population. In general, the values show the change in the categories’ probability from a unit change of each independent variable.
Marginal Effects of Final Model
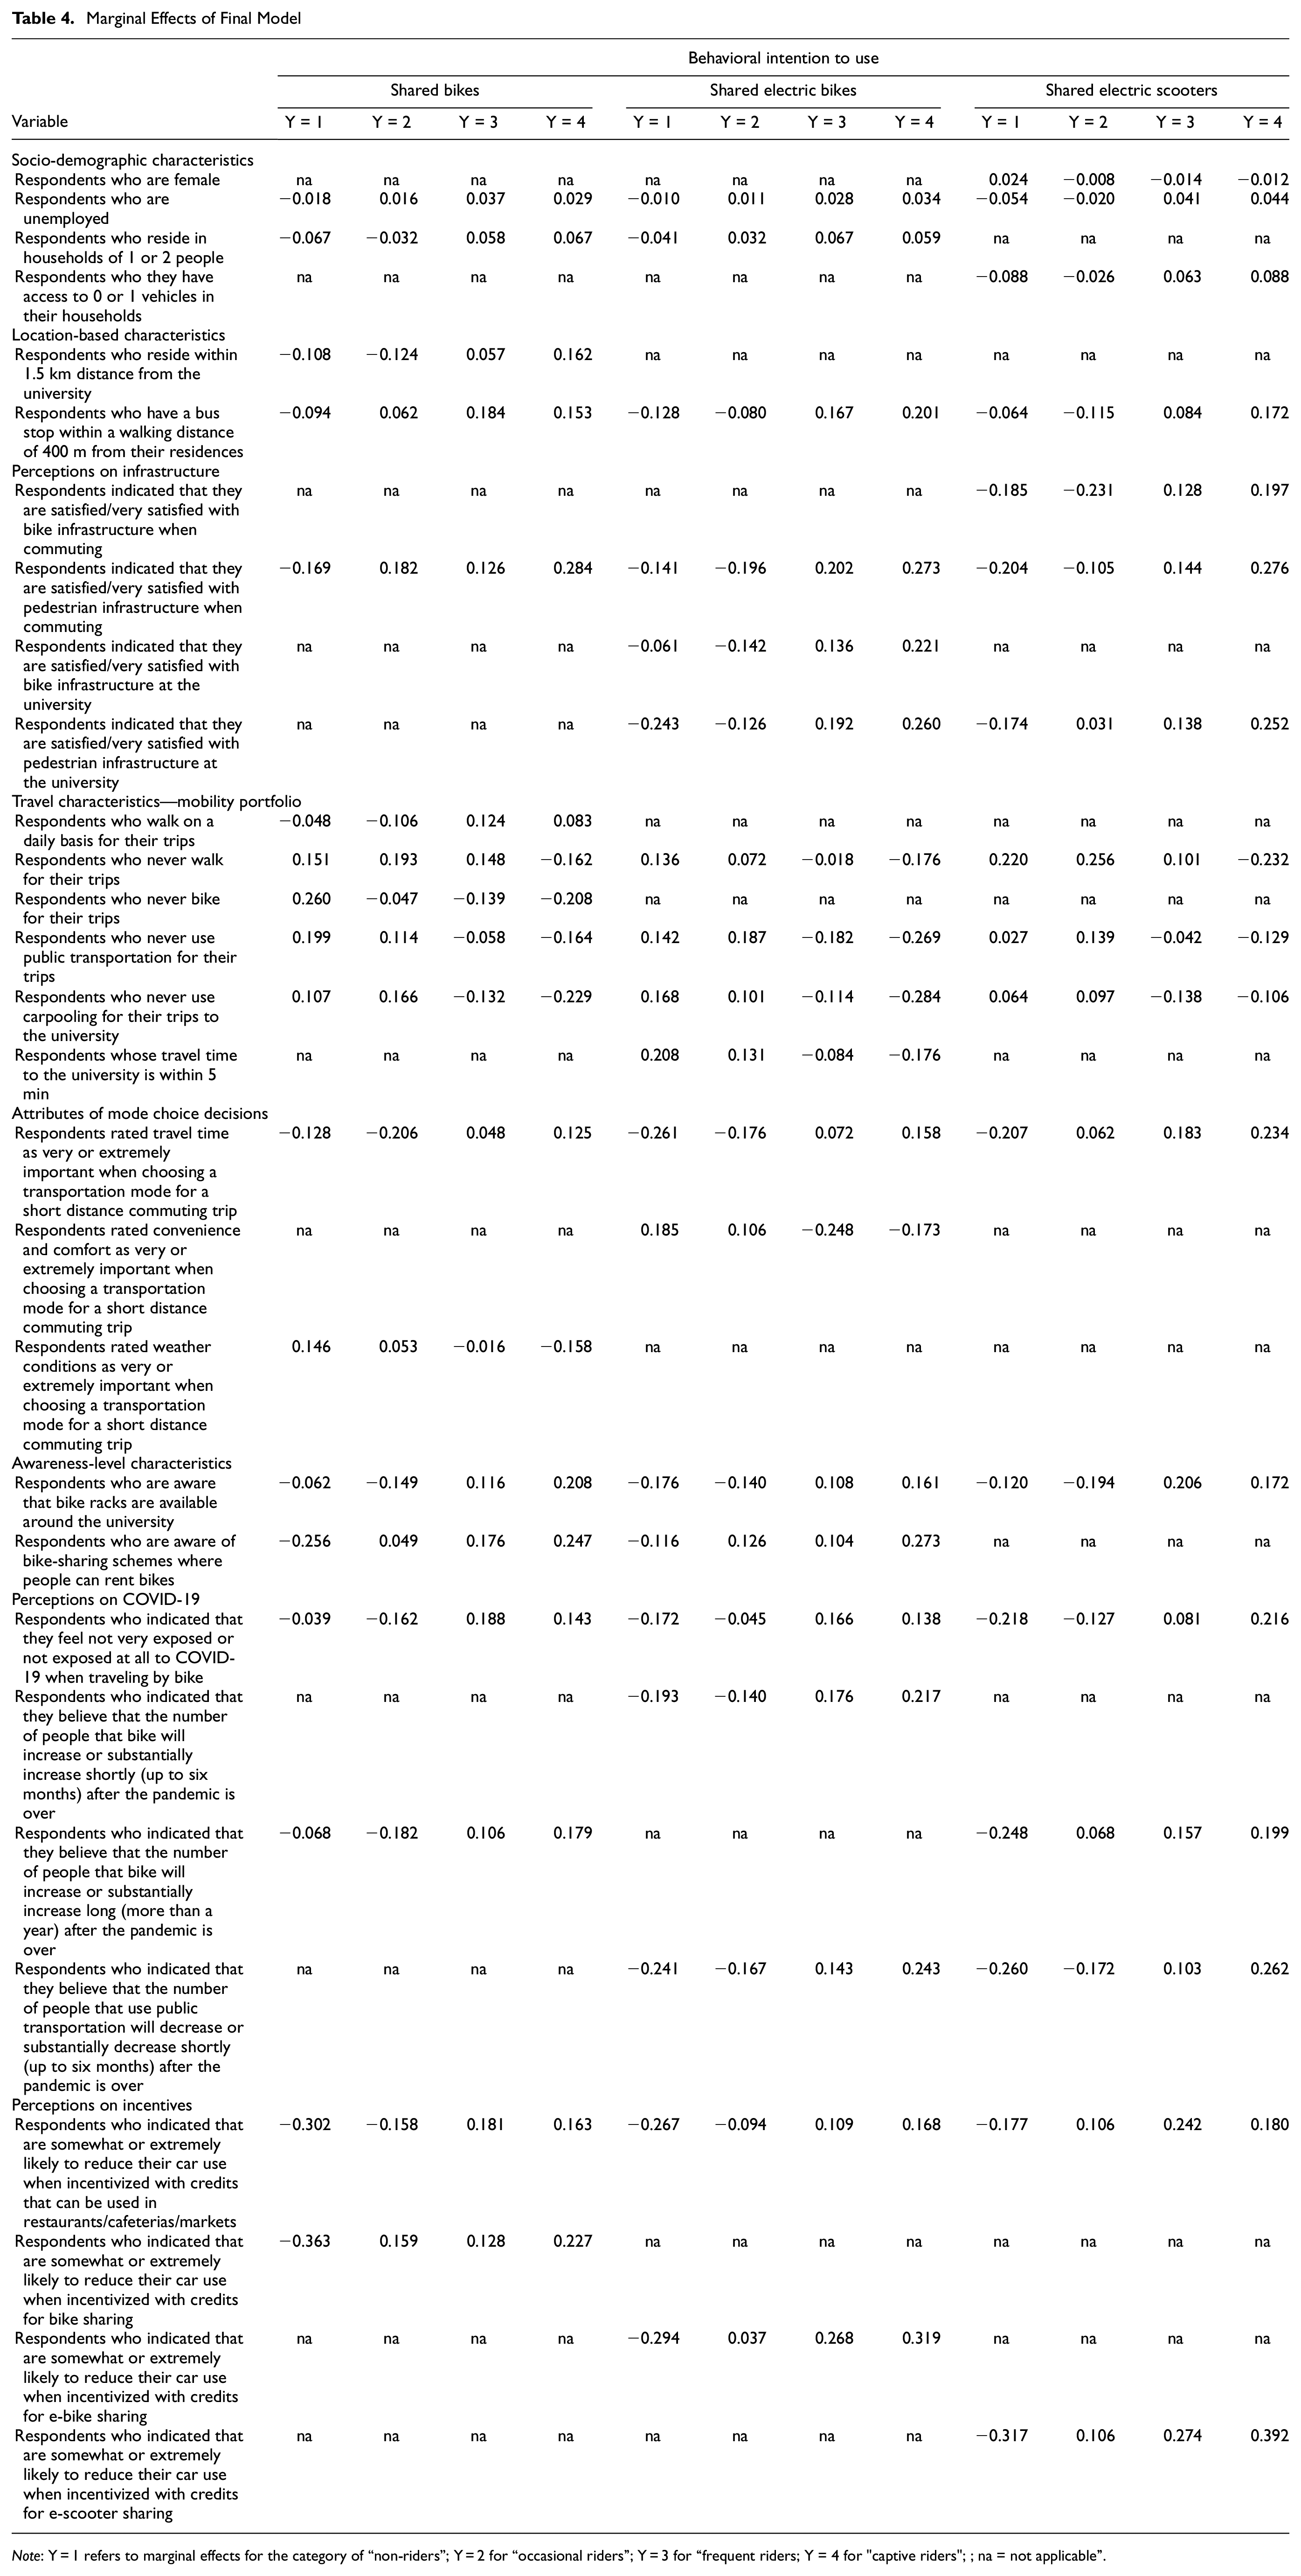
Note: Y = 1 refers to marginal effects for the category of “non-riders”; Y = 2 for “occasional riders”; Y = 3 for “frequent riders; Y = 4 for "captive riders"; ; na = not applicable”.
The marginal effects for the behavioral intention to use shared micro-mobility services suggest that similar trends occur between the coefficient results. As mentioned, the marginal effects can elucidate the interrelationships between various factors and the likelihood of observations for the intermediate categories. For example, the findings show that a respondent who has a bus stop within a walking distance of 400 m from their residence is more likely to be a “captive rider” of shared bikes (higher probability by 0.153) and less likely to be a “non-rider” (lower probability by 0.094). The marginal effects for the other independent variables can be assessed following a similar process. Particularly, a respondent that is satisfied or very satisfied with the bike infrastructure when commuting is associated with a 0.284 increase in the probability of being a “captive rider” of shared bikes; whereas a respondent who never walks for their trips is associated with a 0.162 decrease in the probability of being a “captive rider” of shared bikes. Furthermore, similar trends are observed for the rest of the independent variables that were statistically significant. This means that the signs of the probabilities for the independent variables that were common among all shared micro-mobility services are analogous, however, some variations are observed in the magnitude of the probabilities.
Conclusion
Past studies used general population data and concluded—derived from diffusion of innovation theory ( 75 )—that certain socio-demographic profiles such as young and educated people are, as a group, more eager to use new technologies such as shared micro-mobility services ( 14 , 16 ). Further, the recent COVID-19 pandemic constitutes an opportunity to alter the current transportation culture toward using sustainable transportation modes ( 4 , 5 ). This paper addresses this gap in the literature, that is, to analyze a large dataset of young and highly educated people. Therefore, this analysis sheds light on identifying the key factors influencing the behavioral intentions of young people toward shared micro-mobility services as a system, such as shared bikes, e-bikes, and e-scooters.
A plethora of variables were found as significant determinants that were classified into categories: socio-demographic characteristics (i.e., female, unemployed, household size), location-based characteristics (i.e., proximity of residential location to job/school and bus stop), perceptions on infrastructure (i.e., bike and pedestrian infrastructure), travel characteristics (i.e., trip frequency of different transportation modes), attributes of mode choice decisions (i.e., travel time, convenience/comfort, weather conditions), awareness-level characteristics (i.e., bike racks availability), perceptions on pandemic (i.e., level of exposure for different transportation modes), perceptions on incentives (i.e., incentives on sustainable transportation modes).
The modal share of shared micro-mobility services is increasing swiftly in urban settings both with evident multi-modal culture and car-dependent culture. The current literature has focused in the former ( 4 , 5 ), accentuating the need for analysis of the latter that this study has emphasized. This study yields early insights that can help policy makers understand user preferences on shared micro-mobility services, thereby investigating the potential for substitution patterns from single-occupant vehicle trips to shared micro-mobility services. Policies that can facilitate this substitution involve disincentivizing private vehicle use, which can take multiple forms such as regulating driving plates, parking spaces, car use on certain areas and time periods.
Shared micro-mobility services can provide mobility in transportation networks with limited to zero availability of alternative transportation modes, and especially for user groups that do not have access to private vehicles, which ensures the policy goal of social equity. Similarly, they can be effectively applied in areas with limited public transportation coverage or at time periods when that service is not provided. Thus, shared micro-mobility services can provide solutions on first/last mile accessibility as well as being the sole transportation mode for certain trips (e.g., short distance trips). Given the benefits of these sustainable modes on short distance trips (limited walking time, no need for multi-modal trip), the finding that people who value travel time highly tend to use shared micro-mobility services is substantiated.
The current study presents opportunities for future work; the results on the user preferences of shared micro-mobility services in urban areas constitute a steppingstone for simulation models analyzing travel patterns in a multi-modal environment. Furthermore, the potential substitution patterns between different transportation modes can be evaluated to understand their impacts. Particularly, it could be examined whether shared micro-mobility services as first/last mile solutions to public transportation can complement its service and increase its market share or whether they constitute a competing transportation mode to public transportation.
Discussion
This section explains the practical implications, while also providing study limitations and suggestions for further research based on this study. The results of the analysis can be utilized as inputs by policymakers, other practitioners, and scholars to direct investments and assess impacts of shared micro-mobility services more effectively. Furthermore, the study can provide relevant authorities and other stakeholders related to shared micro-mobility services with valuable knowledge needed to create a deployment pathway of how the shared micro-mobility services should be diffused to yield higher market penetration levels. Specifically, the results indicate that there is a substantial potential for framing particular policy strategies with regard to the different segments of shared micro-mobility services and the composition of their fleets.
Gender is relevant, as specifically male people are more likely to use shared e-scooters. This finding is in accordance with Blazanin et al. ( 14 ) and Reck and Axhausen ( 16 ) for the general population and this study confirms that this pattern occurs for younger people as well. Additionally, the analysis indicated that positive perceptions on the bike and pedestrian infrastructure are linked to higher likelihood of using shared micro-mobility services. This finding might suggest, on a policy level, that emphasis on the infrastructure of active travel modes may yield a higher market share. This might be particularly the case for urban settings that are car-dependent, as the results suggest that efforts at improving infrastructure yield positive effects on increasing the public acceptance of shared micro-mobility services. A general strategy to encourage the use of shared micro-mobility services can be related to upgrading the current infrastructure, which can take various forms such as safety-related measures (e.g., dedicated lanes of shared micro-mobility services, improvement of road environment, prohibition and monitoring of parked vehicles). The analysis showed that a respondent with a higher level of awareness about shared micro-mobility services is more likely to use them. Therefore, the level of awareness plays a key role and also reinforces the need for wider availability of these services (more densely distributed stations, higher number of bikes and scooters in road networks, availability of racks and other parking spaces in areas with high visibility such as major attractions and public buildings) coupled with targeted marketing campaigns designed to increase public awareness of these services. What is more, the study suggested that the introduction and implementation of specific incentives can increase people’s intention of using the shared micro-mobility services. This is another indication of where an effective, efficient, and well-designed communication plan is of the essence. Particularly, when targeted incentives are offered to people, they might be more willing to opt in using sustainable transportation modes for their trips at a higher frequency. Lastly, the results may provide evidence that the availability of bus stations and therefore the promotion of other sustainable transportation modes such as public transportation can have the potential to increase the uptake of shared micro-mobility services. The potential for complementing sustainable transportation modes may also lead to synergies between policy makers, stakeholders and service providers with the aim of working together to offer appropriate services that can be associated with higher market penetration levels of sustainable transportation modes.
This study has some limitations, but many of these limitations also provide opportunities for further research. The data analyzed to evaluate the behavioral intention to use shared micro-mobility services was solicited through a stated preference survey that is hypothetical in nature, a survey that is a valuable data source for assessing people’s perceptions when faced with emerging technologies. The methods applied attempted to overcome these limitations through proper data preparation and analysis, such as the removal of incomplete responses and passive responses and rigorous econometric modeling. The results of the proposed model examine the behavioral intention to use shared micro-mobility services. However, at some point when the shared micro-mobility services have become more diffused, a subsequent analysis can be conducted to evaluate the actual behavior and compare the results to those derived from the proposed model, which can enable policymakers to gain a more accurate understanding of the results on other emerging transportation services or phenomena.
Additionally, the survey instrument was distributed to the university student population of Nicosia. This approach can identify which groups of young people (socio-demographic characteristics, location-based characteristics, travel characteristics) or which characteristics (perceptions on infrastructure, incentives and the pandemic, awareness-level characteristics, attributes of mode choice decisions) influence their likelihood of using the shared micro-mobility services leading to targeted policy-making decisions. However, it is acknowledged that a direct comparison of the student population with the general population cannot be achieved. Therefore, the survey and the proposed model can be transferred to and replicated in multiple study areas to evaluate whether the effects of different variables are similar across the different geographical areas. Understanding the differences in the sign/magnitude of the effects of various variables across different study areas and obtaining insights into whether some variables do or do not affect the behavioral intention can aid policymakers to develop strategy more efficiently. Lastly, the study is cross-sectional and assesses a snapshot of a given point in time. It would be interesting to undertake a longitudinal study covering several points in time to evaluate whether the factors influencing the behavioral intentions toward shared micro-mobility services vary over time. Particularly, by expanding the scope of the study from a cross-sectional assessment of the current situation to a longitudinal one, changes in people’s opinion and the factors that affect people’s opinion over time can be captured.
Since shared micro-mobility services are novel, modeling them as a system is still in its infancy, and there is limited literature about the factors affecting behavioral intentions toward such services, the goal of this study was to examine the intention as a measure of young people’s attitudes toward these emerging technologies, which is the first step for designing effective ways to accelerate their adoption, which have not been considered before in previous studies, thereby adding to the body of knowledge. However, researchers can build on the results and the attitudinal variables found in this study, while also including other factors or integrating components based on social science theories. Specifically, widely used theoretical models of adoption and diffusion of new technologies include the Theory of Reasoned Action, the Theory of Planned Behavior, and Diffusion of Innovation, which can be used for further research. Therefore, a theoretical model can be based on these theories that can be enriched and extended by implementing additional factors. As more information on the adoption of shared micro-mobility services is obtained and to further expand the analysis in the future, a further analysis can focus on the adoption theories and the evaluation of the attitudinal components as latent variables. Specifically, the existence of attitudinal perceptions can be explored via structural equation modeling (SEM), where SEM can evaluate the potential associations between the attitudinal variables while simultaneously modeling multiple related pathways that determine their relationship with the behavioral intention to use shared micro-mobility services.
Footnotes
Author Contributions
The authors confirm contribution to the paper as follows: study conception and design: C. Gkartzonikas, L. Dimitriou; data collection: C. Gkartzonikas; analysis: C. Gkartzonikas; analysis and interpretation of results: C. Gkartzonikas, L. Dimitriou; draft manuscript preparation: C. Gkartzonikas, L. Dimitriou. All authors reviewed the results and approved the final version of the manuscript.
Declaration of Conflicting Interests
The author(s) declared no potential conflicts of interest with respect to the research, authorship, and/or publication of this article.
Funding
The author(s) disclosed receipt of the following financial support for the research, authorship, and/or publication of this article: This work was supported by the “Smart and Sustainable Mobility Plan for the University of Cyprus” within the internal research program “Transportation Improvements at the University of Cyprus”.
Data Accessibility Statement
The data are not available for sharing because of the terms of the Research Ethics Protocol.