
Abstract
This paper discusses 38 bridge- and eight culvert deterioration models of three bridge and one culvert condition rating stored in the National Bridge Inventory (NBI) as Items 58, 59, 60 and 62. The models were developed by age groups and by families of relevant variables such as span type, deck material, and bridges over water or land. Each model is a 2-year Markov matrix for every age group or family, containing the probabilities that each rating will remain the same, or transition to all possible lower ratings. These probabilities were calculated by counting all actual transitions in a database containing 19 years of bridge inspection data in Texas, unlike previous models which assumed that ratings cannot drop by more than 1 point in one inspection cycle. Models were validated and standard errors calculated. Updatable results were implemented in Excel workbooks and included 18-year forecasts of condition rating and network deterioration tables and curves, and comparisons between the current network condition and 10-year forecasts. The culvert models also included updatable cost forecasts to maintain the culvert network above Condition Rating 4. The main technical contribution of this project is the probabilities of bridge and culvert ratings decreasing by more than 1 in a 2-year inspection cycle being greater than zero for all condition ratings modeled (range: 8% to 61%). The models developed using the Texas data were strictly applicable to maintenance, environmental, and traffic conditions comparable to those prevalent in Texas. However, the modeling methodology is applicable to any state or location.
Keywords
Texas has the largest statewide inventory of culverts and bridges, with over 55,000 bridges open to public traffic in 2020 and, on average, 350 new bridges added per year. This includes on-system (i.e., owned or maintained by the Texas Department of Transportation [TxDOT]) and off-system structures (i.e., owned or maintained by another entity). In 2020, only 787 bridges (1.4%) were in poor condition (minimum Condition Rating 4 or less)—much lower than the national average. This percentage has steadily decreased over time from 4.5% in the year 2000 ( 1 ).
A 2017 Federal Highway Administration (FHWA) rule mandated, among other requirements, that states have procedures for (a) collecting, processing, storing, and updating inventory and condition data for National Highway System (NHS) pavement and bridge assets; and (b) forecasting the deterioration of all NHS bridges and pavements ( 2 ). TxDOT commissioned this study to fulfill the aforementioned item (b), using the state’s NBI/PonTex database, which stores bridge and culvert inventory and inspection data. The project developed a total of 46 bridge and culvert deterioration models, developed and validated using a 19-year historical database containing almost a million culvert and bridge condition and inventory records ( 3 ).
An extensive literature review conducted during the project indicated Markov methodology to be the most appropriate considering the available historical data ( 3 – 6 ). The models were split into families by traffic, environment type, material type, and other relevant variables. The output was the probabilities that each condition rating in each statistically validated family of bridges and culverts would deteriorate within the desired planning horizon, which is generally 10 years but does not exceed 18 years. These outputs were then used to prepare deterioration curves that fulfilled FHWA’s mandate (b) for Texas. Forecasts can be used to predict the future condition of the bridge and culvert network, estimate budget needs to attain maintenance goals, and obtain data for technical reports on bridge and culvert network condition.
Research Database Preparation
TxDOT provided 19 access files containing bridge and culvert data tables from 2001 to 2019, totaling 992,119 records in their PonTex database, pertaining to 61,996 bridges and culverts, 22,167 of them off-system and 39,829 on-system. PonTex is more recent than FHWA’s NBI, and includes all NBI data. A 19-year time series was nearly twice TxDOT’s desired planning horizon of 10 years, and therefore enough to ensure that the desired forecasts remained well below the data time range. This was further underscored by the 2020 data containing 55,000 structures, and 2022 data (currently in use in a new project) containing 57,108 structures. The historical database, therefore, also contained data on all structures that have been decommissioned, closed, and so forth, between 2001 and the present date, which increased the models’ accuracy.
Given the massive amount of data, and the complexity of the analyses performed, the original access files were converted into SAS™ and then organized into one historical SAS dataset containing annual bridge and culvert data. Most of the data preparation effort was performed during the first year of the project, when 2019 data were not yet available; the 2019 data were cleaned, added to the inspection history database during the second year, and included in the model development task.
The data preparation was a major project task, in a few instances requiring visual inspection of the structure to ensure data accuracy. This is fully documented in the project report ( 3 ). The task consisted of the three following major subtasks: (1) to prepare an annual inspection history SAS dataset; (2) to extract from the annual dataset a biannual subset spaced every 2 years, regardless of whether or not the structure was inspected; (3) to obtain and analyze climatic data, then merge this into the biannual inspection history by county.
Annual dataset was used in the statistical analyses of the potential variables defining modeling families, and to compare predictions to forecasts for every pair of years in the database. The biannual dataset was used to calculate the 2-year transition probabilities for the Markov models. The latter must include all counts of ratings remaining the same as well as those transitioning to all other lower ratings. Preparing the annual and biannual SAS datasets from the yearly PonTex Access tables included the following steps:
Import into SAS the abovementioned Access data tables, containing the NBI/PonTex inspection data from 2001 to 2019. Ensure compatibility of all raw variables’ lengths, formats, and names among all 18 annual files. Create a variable storing the original file year. Append all data.
Remove tunnels, cross-checking Items 5.1 (structure function) and 43.5 (structure type, tunnel); 25 tunnels were removed.
Cross-check all variables needed for the subsequent analyses. For example, Item 27 (i.e., year built, one of the variables necessary to calculate structure age), had 282 values greater than the file year, one record containing “65–” and 734 blanks. The entire history of these structures was examined, and nearly all invalid values could be logically filled in based on data from the rest of the bridge or culvert history.
When logically possible, interpolate missing ratings based on previous and subsequent ratings to maximize the available valid data. A total of 6,397 deck ratings, 3,076 substructure ratings, 3,076 superstructure ratings, and 3,064 culvert ratings that were missing from the annual history could be logically interpolated. This step was especially important to ensure the inclusion of all new bridges and culverts in the modeling data, since they are inspected every 4 years, and the model consists of 2-year transitions. Lack of ratings in the intervening years would result in excluding nearly all new bridges and culverts from the modeling data, resulting in deterioration overestimates. For bridges inspected every 2 years, it would primarily decrease the paired data available to check model accuracy. There were over 15,000 such omissions in the 19-year dataset; therefore, this step was very important—it required complex SAS code to mimic the way a human would look at each structure’s history and inspection dates.
Calculate the structure age at each year, cross-checking Item 27, year built, Item 90, inspection date, and Item 106, year reconstructed. Set age to 0 in years in which all the structure’s ratings increased to 9 with respect to the previous year, to properly consider the maintenance impacts. Negative ages were retrieved, and most typographical errors in the original data were corrected with code that looked at the entire structural history.
Calculate the interval between consecutive inspections based on Item 90, inspection date. Intervals between 18 and 26 months were considered biannual. Intervals below 18 months were flagged. Intermediate ratings were interpolated for inspection frequencies of 4 years, based on the values of two consecutive inspections. Finally, for every structure’s history, logically delete intermediate records to ensure an approximate 2-year gap between all consecutive records of each structure. This last step ensured the most accurate time series possible to estimate 2-year transition probabilities for the Markov matrix, which must contain only transitions observed every 2 years.
Climatic data consisted of monthly and annual rainfall precipitation, averaged for the period between 1981 and 2010, downloaded from the Texas Water Development Board (TWDB) website ( 7 ). This was, and still is, the most recent georeferenced precipitation data available in Texas. The data consisted of a shape file with the annual precipitation isopleths, compatible with ArcMap. The TWDB data were loaded into ArcMap, then overlaid with bridge and culvert coordinates from the latest available PonTex/NBI, thus assigning bridges and culverts to the different annual precipitation regions. Such regions are not part of the PonTex/NBI, but counties are, so it was necessary to estimate a meaningful average precipitation for each of the 254 Texas counties. TWDB data indicated that rainfall was not uniform within counties. Two weighted annual precipitation averages were calculated for each county, one for bridges, and another for culverts, using the number of bridges and culverts located inside each precipitation region as weights. These precipitation averages were then merged into both the annual and biannual SAS datasets by county. This approach was required to account for differences between culvert and bridge densities among rainfall areas within counties ( 3 ).
Next, the number of days per year in which TxDOT potentially deices Texas roads was estimated for each county by averaging the number of days in which freezing rain, sleet, or snow occurred in various recording stations across Texas in 5 years of data ( 8 ). Given the predominantly warm weather in Texas, 90% of the counties averaged 1.8 days or fewer per year with deicing conditions. The maximum was 7.6 days.
Modeling Methodology
The methodology relied on estimating transition probabilities from the relative frequencies observed in a 19-year inspection history database containing PonTex/NBI data. An exploratory data analysis was performed before modeling to identify potential variables for modeling families. Markov matrices were then developed for all potential families, defined by variables such as age, material type, truck traffic, and environment, and the standard forecasting errors were calculated. Models with standard errors of 5% or less, and resulting in significantly different predictions for each family, were recommended for implementation.
Underlying Concept
A review of the methodologies that have been used to develop bridge deterioration models indicated the Markov process to be the optimal approach to take full advantage of the 19-year inspection history. It is also the most common approach found in the literature, and has a long track record indicating ease of implementation and accuracy of network-level forecasts (e.g., Cesare et al. [4], Kobayashi et al. [5], and Li et al. [6]).
The models forecast the deterioration rates of the following PonTex/NBI condition ratings: deck (Item 58), substructure (Item 59), superstructure (Item 60), and culvert (Item 62). The ratings consist of integers from 0 (failed condition) to 9 (new condition). The three bridge components’ condition ratings “are used to describe the existing, in-place bridge as compared to the as-built condition.” (9) Culvert ratings also evaluate the overall culvert condition in an analogous way ( 9 ).
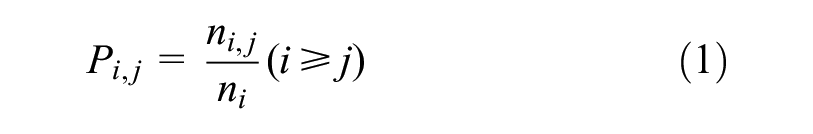
The historical biannual dataset was used to calculate the probability, Pij, that each condition, i, will either remain the same, or transition to all worse conditions, i-1, i-2, and so on, in a 2-year transition period. Equation 1 shows the calculations.
where
i = 0, 1, 2,…9;
j = 0, 1, 2,…9;
Pij = probability of transitioning from condition i to condition j in 2 years;
nij = number of data points in condition i in year y that transitioned to condition j in year y + 2; and
ni = total number of data points in condition i in year y.
A SAS program was coded to count the number of all 2-year rating transitions in the database that included ratings remaining the same, and ratings decreasing to all other ratings, that is, how many ratings of 9 remained at 9, how many decreased to 8, to 7, and so forth, all the way to zero. Then, the program divided each of these counts by the total counts of each initial rating to calculate the relative frequencies, which are the best estimates of actual probabilities. Table 1 illustrates one of the Markov matrices developed in this project. The leftmost column shows the initial ratings, and the top row, the ratings predicted 2 years later. For example, after 2 years, an initial on-system deck rating of 9 had a 3.32% probability of remaining as 9, a 60.757% probability of decreasing to 8, a 35.53% probability of decreasing to 7, a 0.398% probability of dropping to 6, and zero probability of decreasing below 6 (see the second row of Table 1).
Example of a 2-Year Markov Transition Probability Matrix (On-System Deck Ratings)
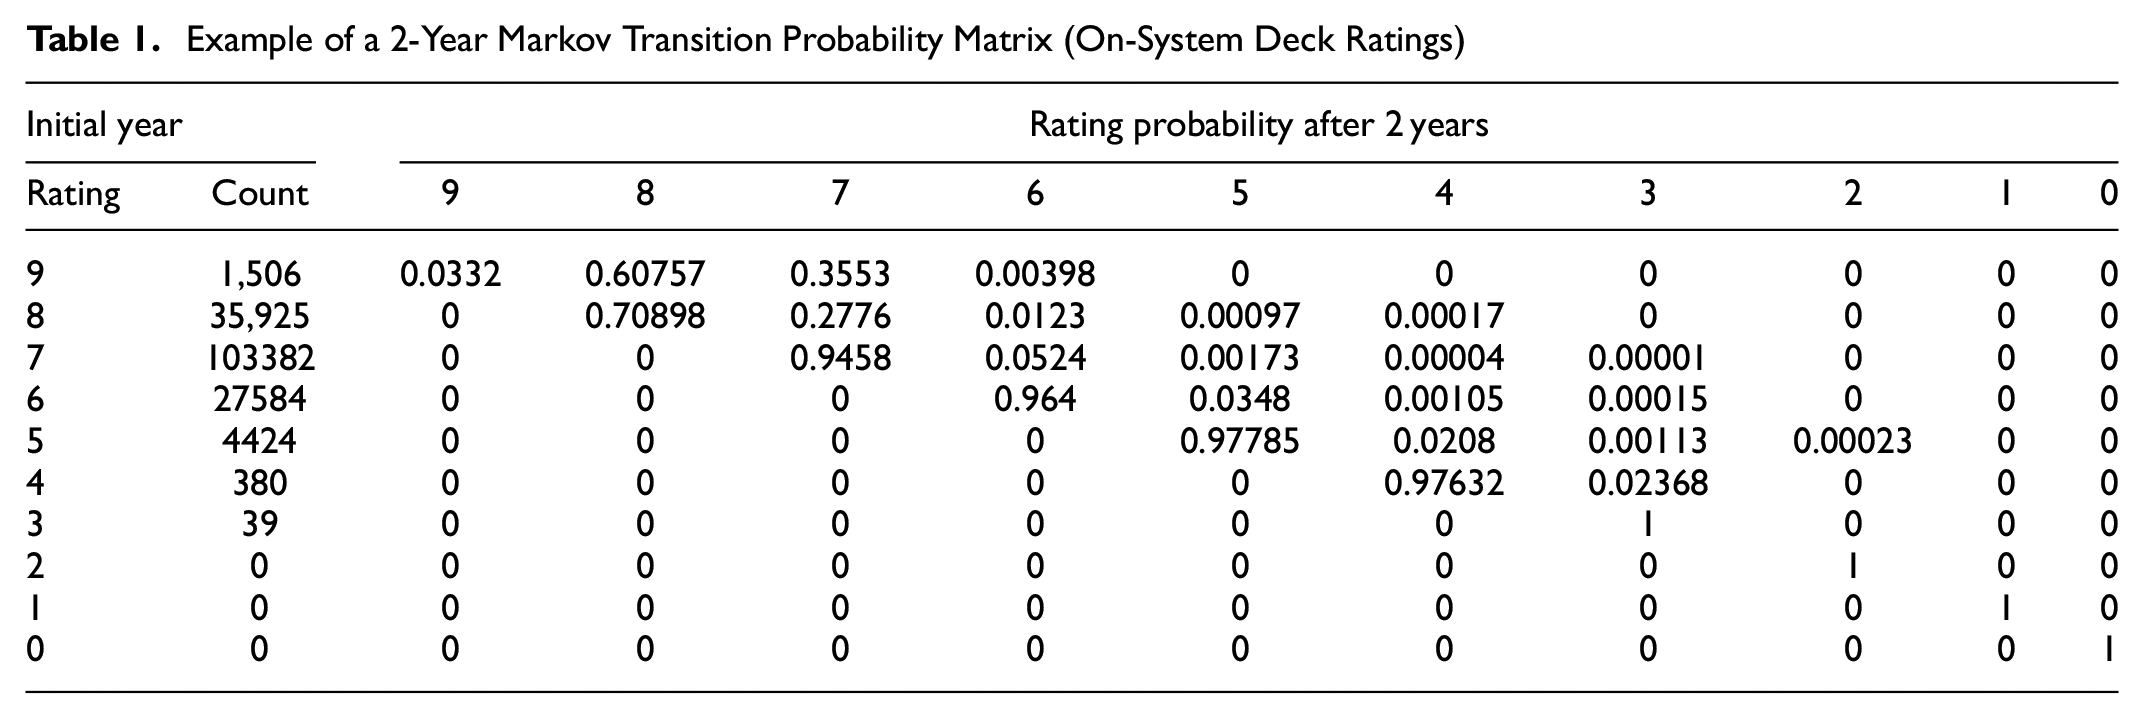
If the total count in the second column of Table 1 was less than 9 transitions, this would have resulted in unreliable probability estimates; therefore, the corresponding row was left blank and not considered in the model. The program sets to 1 the probability of a rating of zero remaining as zero, since a rating cannot deteriorate any further. It also sets all probabilities of rating improvements to zero, since the matrix’s purpose is to estimate deterioration. In addition, when there are no ratings of a certain level (e.g., below 3 in Table 1), the probability of a nonexisting rating remaining the same can be set to 1 just to ensure that all rows add up to 1.
Elevating the 2-year transition probability matrix to the nth power ages the matrix by 2n years. The models are recommended for forecasts every 2 years, up to 18 years, to remain within the database time range and the most common inspection cycle. Markov matrices were the basis for calculating the network condition forecasts and deterioration curves presented in the Results section.
Methodology Steps
Before undertaking the Markov calculations described, an exploratory data analysis determined potential modeling families based on variables such as age, material type, truck traffic, and environment. TxDOT requested that on- and off-system culverts and bridges be analyzed separately. One aggregated on-system as well as one aggregated off-system model was also developed for each rating.
Not all variables potentially affecting deterioration had enough data to develop a valid transition matrix. For example, PonTex/NBI Item 107.1, “type of deck system on the bridge,” has nine categories: concrete cast in place, concrete precast panels, open grating, closed grating, steel plate, corrugated steel, aluminum, timber, and other. However, over 98% of on-system decks are concrete. In other cases, there were too many missing data points; for example, Item 29 (average daily traffic) and Item 109 (percent trucks) are not sufficiently populated in off-system bridges and culverts to allow accurate modeling by traffic families ( 3 ).
Potential families defined by 56 variable combinations that had enough data for modeling were explored. Some resulted in insignificant deterioration differences among family groups. In other cases, the matrices had undesirable forecasting errors. These issues were found primarily when families combined more than one variable, such as a certain material type disaggregated by age group. All ratings and material types were tested for the influence of freezing, and all deterioration differences were minor. The same was observed for families defined by truck traffic, annual rainfall, culverts under fill versus no fill, and other potential variables. This was not surprising, since design, construction, and maintenance practices counteract such effects to the maximum extent possible, keeping the infrastructure in good repair under a variety of conditions. Table 2 shows the implemented model families ( 3 ).
Models Recommended for Implementation ( 3 )
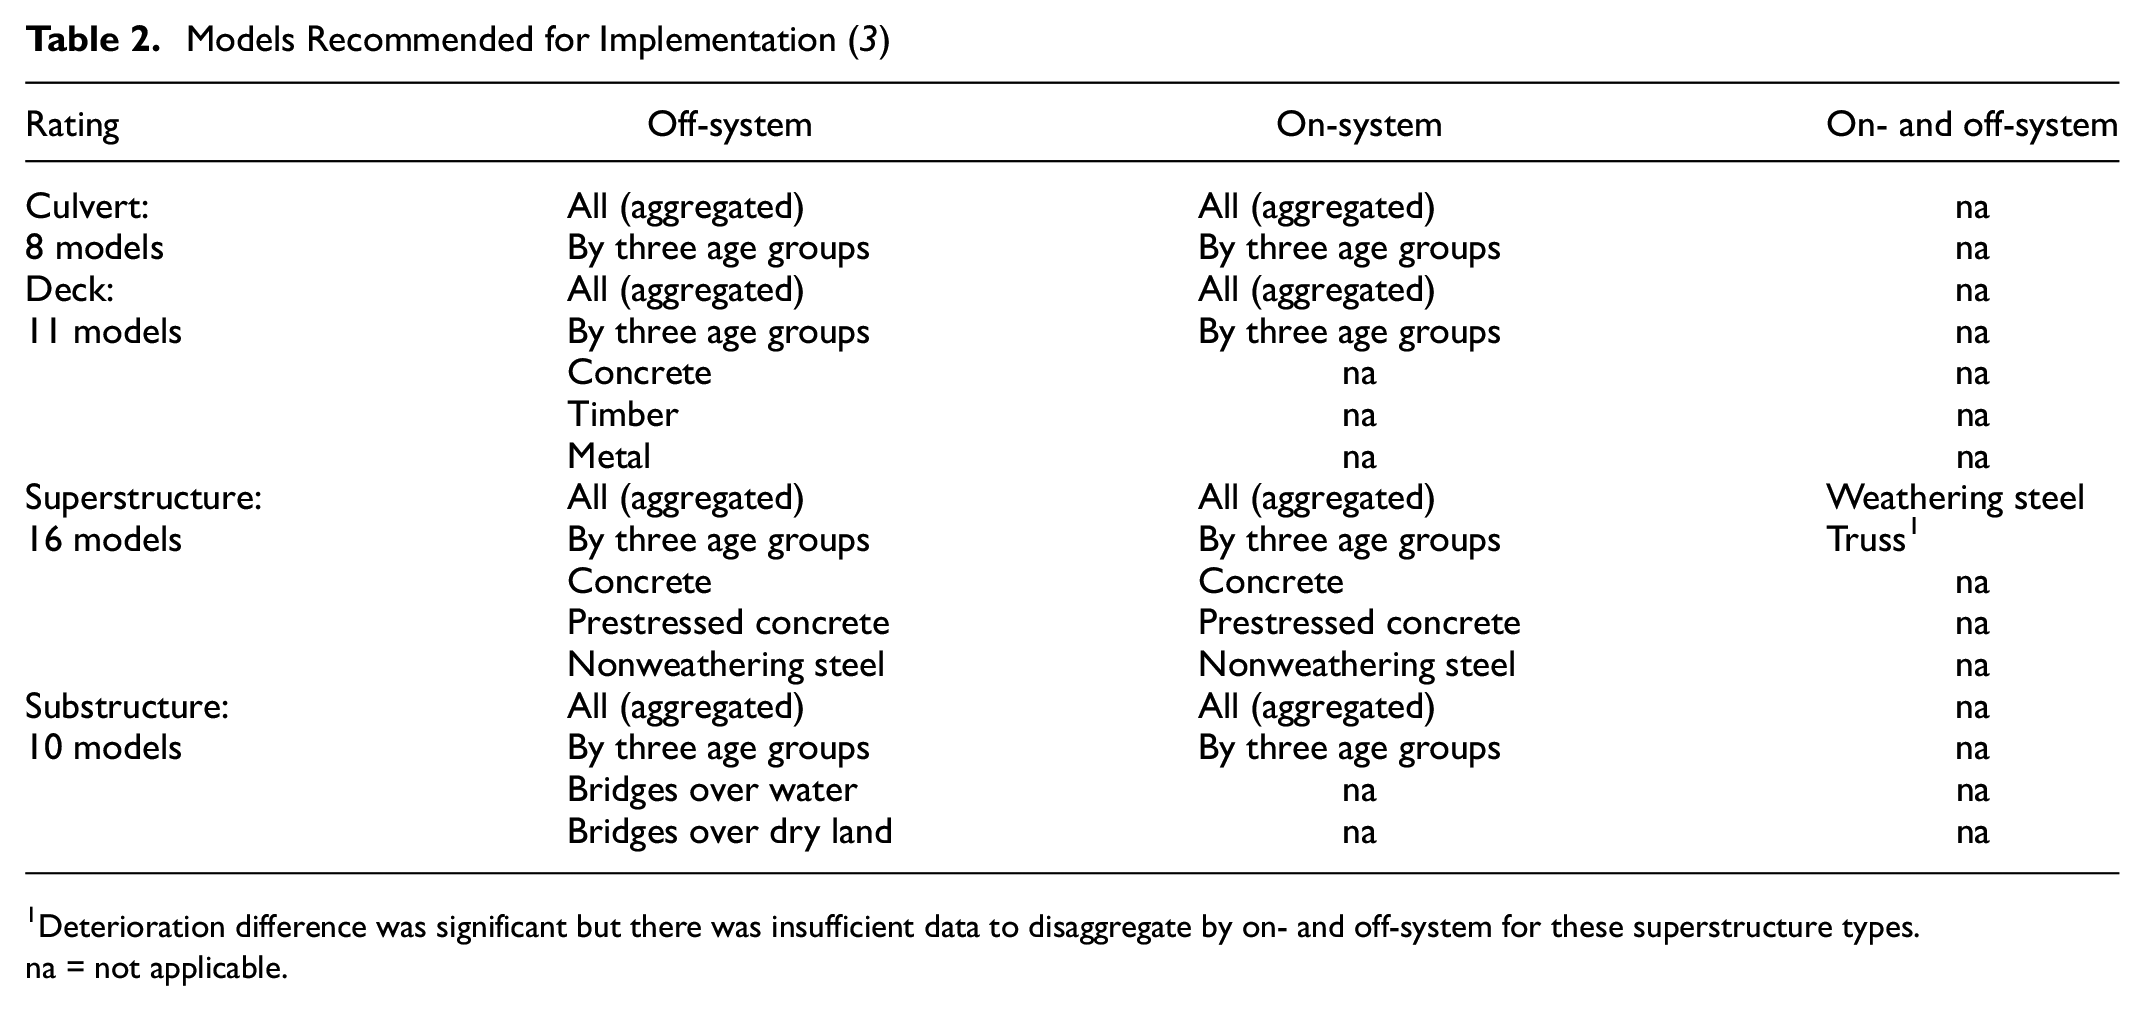
Deterioration difference was significant but there was insufficient data to disaggregate by on- and off-system for these superstructure types.na = not applicable.
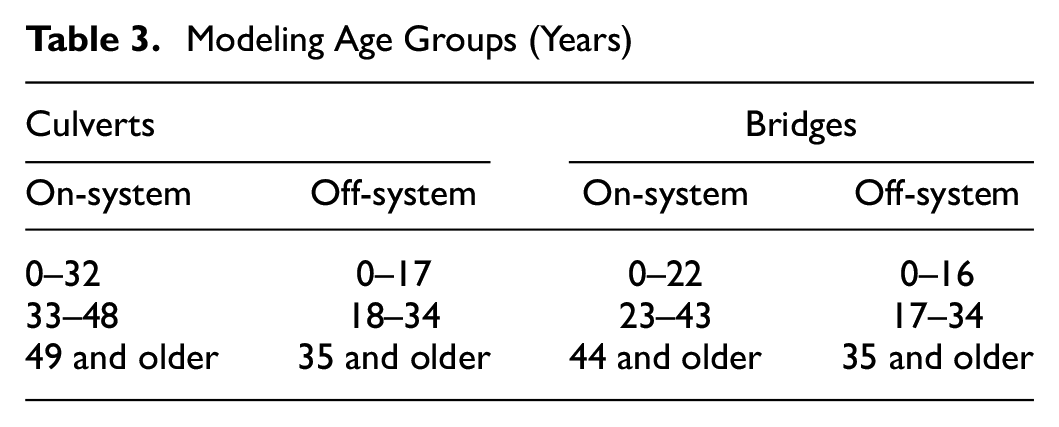
To be consistent with the desired 10-year forecast horizon, age group thresholds had to be at least 10 years apart, also have a similar number of data points in each group, and not be broken into too many groups with only a few data points each. Age distributions were plotted, and different thresholds were tested for the aforementioned criteria. Table 3 shows the age groups developed for on- and off-system bridges and culverts. Deterioration was significantly different among the age groups for all four ratings, so all models by age group were recommended, as depicted in Table 2 ( 3 ).
Modeling Age Groups (Years)
The model development and validation procedures are explained in the following, using deck rating models as an example. The same procedure was applied to all potential modeling families, and to each of the four ratings, on- and off-system.
Step 1: Calculate the 2-year transition probability matrix as previously discussed, resulting in matrices analogous to the on-system deck rating matrix depicted in Table 1, for each age group, potential family, and age within family combinations. Relevant variables such as truck traffic, rainfall, deck type, superstructure type, freezing days, substructures underwater and over dry land, and combinations thereof were all analyzed.
Step 2: Calculate standard errors of the forecast estimates according to Equation 2 ( 10 ), for every pair of years in the database. For example, compare 2003 predictions made with 2001 data, 2004 predictions made with 2002 data, to 2004 data, and so on. The program that calculates the standard error contains code to ensure that the observed and predicted values to be compared are retrieved for the same bridges. Initially, an attempt was made to calculate the error for 10-year forecasts, a common managerial horizon. However, it was found that the quality of Texas maintenance practices precluded this: too few bridges had rating decreases 10 years later. Long-term comparisons were found to be uninformative, ergo the selected 2-year period for accuracy checks. For the matrices with acceptable standard errors, the relative standard error, multiplied by 100 and expressed as percentage are calculated and reported ( 10 , 11 ).
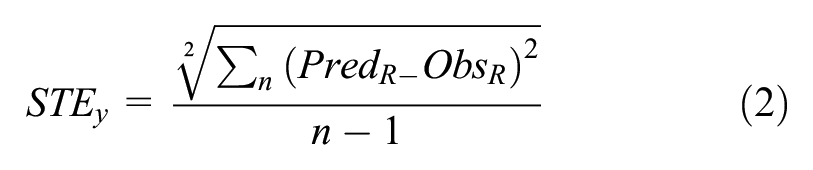
where
Pred R = predicted rating “R” count in year y;
Obs R = observed rating “R” count in year y
n = number of pairs compared; and
R = 0 to 9 (ratings).
In the case presented in Table 1, the average relative standard error of all pairs of years was 3.7%, and the maximum was 5.9%. For the on- and off-system aggregated models, a low standard error was the only criterion to recommend the model for implementation. For age groups and model families, this was the criterion to go to Step 3 of the validation procedure. This step is best explained using an off-system family of deck types (Item 107.1). As depicted in Table 2, separate models for timber and metal decks were recommended. Their matrices’ relative standard errors were respectively 10.5% and 7.5%—among the highest of all models, but still worth recommending for further analysis.
Step 3: Elevate the 2-year transition probability matrices to the 5th power and obtain the 10-year transition probabilities. Multiply the number of current bridges in each condition by the respective 10-year probabilities to forecast the number of bridges in each condition 10 years later, then calculate the percent in each condition. Compare the magnitudes of the forecasts among different families (or age groups) and the overall aggregated model forecast.
Figure 1 shows the comparison among deck types and the aggregated off-system models. Ratings below 4 are not shown owing to insufficient data points. It is clear from Figure 1 that the network-level forecasts were significantly different for the three models. For example, 28% of metal decks with an initial rating of 7 or greater are expected to still be rated 7 after 10 years; for timber, this percentage was only 15.4%, and for the aggregated model, 46%. A separate model for concrete decks was not recommended for implementation and is not shown because the forecasts for concrete deck ratings, and for overall off-system deck ratings, were very similar. This was not surprising, since concrete decks comprise almost 76% of all off-system decks.
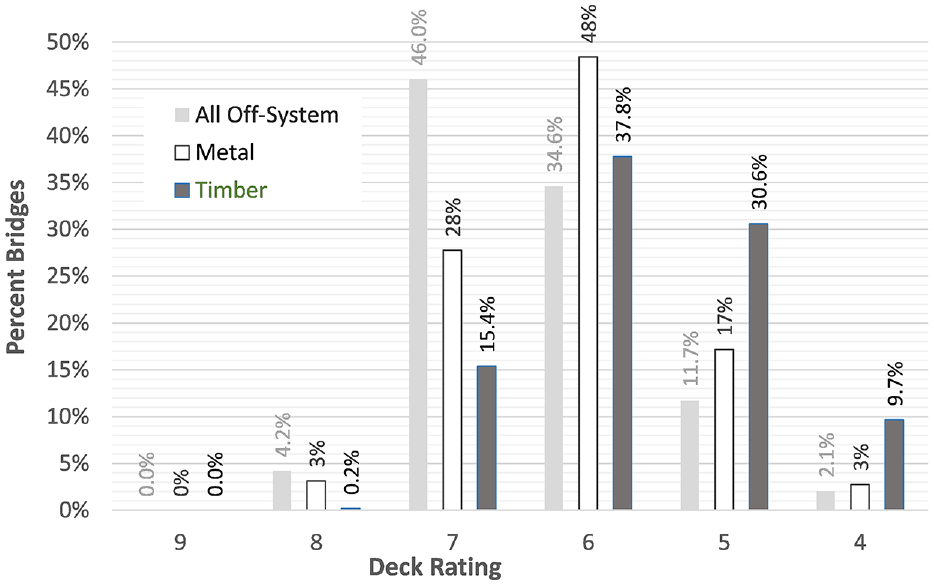
Off-system deck ratings: 10-year network condition forecasts by deck type.
Results and Applications
The models and their results were programmed into updatable Excel workbooks and consist of (1) PonTex/NBI rating deterioration tables and curves; (2) network deterioration tables and curves, by number of bridges and by bridge area, and (3) cost estimates for culverts. A methodology for bridge cost estimates was developed and is explained in the project report, but was not conducive to spreadsheet programming because of the need to check three different ratings ( 3 ).
Deterioration Forecasts
Deterioration curves predict the change in condition ratings over time. Figure 2 illustrates one of the deterioration curves, where each point consists of the expected rating value after 2, 4, 6 years, and so on. Equation 3 gives the expected value formula. Boldface items indicate matrices.
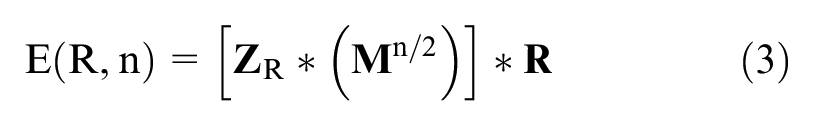
where
E(R,n) = expected future value of rating R after n years;
n = the number of years of the desired forecast; and
The product
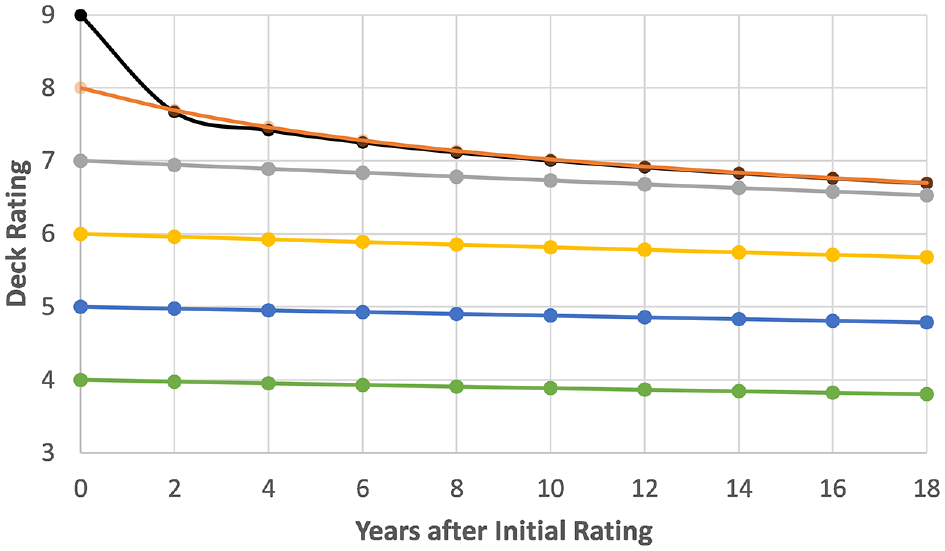
Rating deterioration curves, on-system decks.
The network deterioration tables and curves forecast the percent of the bridge and culvert networks that will be at each rating 2, 4, 6, … 18 years later. They were developed for the number of bridges or culverts and the bridge deck area. Figure 3 (number of bridges) and Figure 4 (deck area) depict the network deterioration curves for the on-system deck rating. The percentages were obtained by multiplying the current number of bridges (or bridge deck area) at each rating, by the transition probabilities at each desired future year, then adding the totals at each future rating to obtain the denominator for the percentages. Ratings not shown had insufficient data points in 2019. Network deterioration curves were prepared for each model and delivered in Excel workbooks. Network deterioration forecasts are updated by pasting the current number of bridges and bridge deck areas at each rating, and the current year, in the appropriate cells.
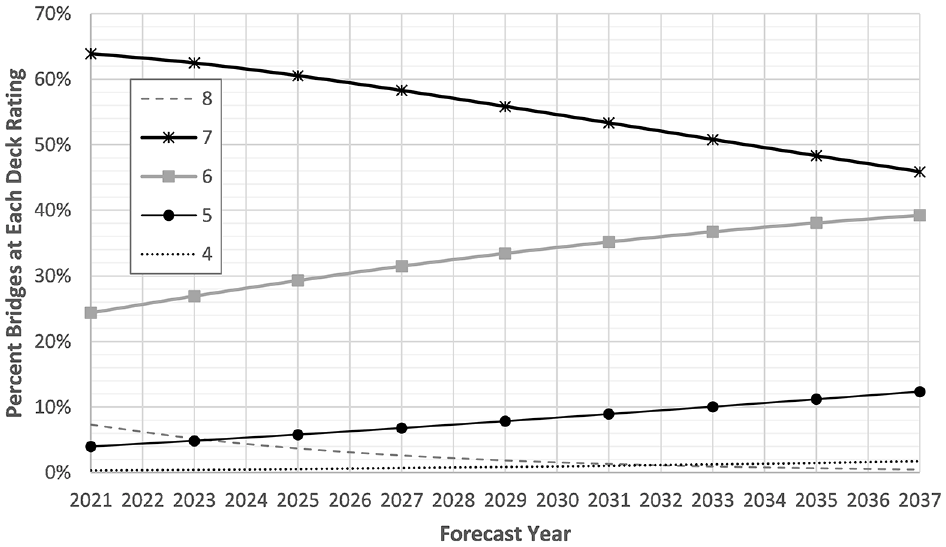
Network deterioration curves, on-system deck rating, number of bridges.
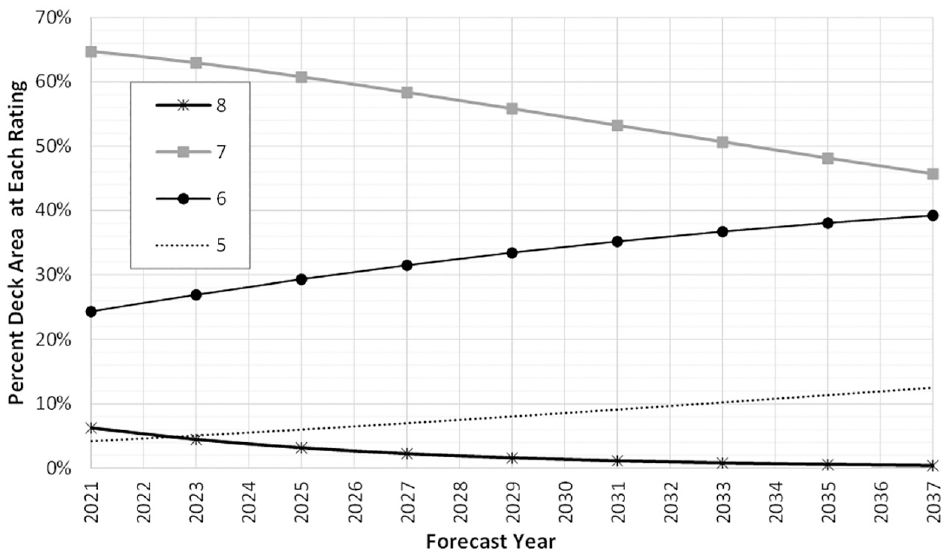
Network deterioration curves, on-system deck rating, bridge deck area.
Network-level forecasts (Figures 3 and 4) are helpful for bridge management purposes. As will be explained in this paper, they can be used to estimate budgets and prepare annual reports. For example, every year TxDOT publishes the percent of the network in “good or better condition,” which corresponds to ratings of 7 or greater ( 1 ). The aggregated models provide a similar future snapshot. For the preferred planning horizon (10 years), the aggregated models forecast the following decreases in the overall percentage of ratings in good or better condition:
On-system culverts: from 55.7% in 2019 to 36.7% in 2029.
Off-system culverts: from 60.3% in 2019 to 41.4% in 2029.
On-system decks: from 74.9% in 2019 to 57.7%% in 2029, and from 74.7% deck area in 2019 to 57.4% in 2029.
Off-system decks: from 71.6% bridges in 2019 to 50.2% in 2029, and from 73.3% deck area 2019 to 50.3% in 2029.
On-system superstructures: from 71.5% in 2019 to 54.4% in 2029.
Off-system superstructures: from 63.9% in 2019 to 45.3% in 2029.
On-system substructures: from 63.0% in 2019 to 48.8% in 2029.
Off-system substructures: from 55.1% in 2019 to 33.4% in 2029.
Culvert Cost Forecasts
The predicted number of culverts rated 4 or less in 2029 was 163 for on-system and 159 for off-system. The average cost of culvert and bridge replacement had been investigated in detail during a previous project ( 12 ). These costs were corrected for inflation with data from recent TxDOT bid tables, resulting in $80/ft2. Variables necessary to calculate culvert area were missing in nearly 30% on-system and over 45% off-system culverts, so it was necessary to estimate a representative culvert area. A weighted average of all culvert areas available for on- and off-systems, using 2019 data, resulted in 2,418 ft2 for on-system culverts, and 2,087 ft2 for off-system culverts. Therefore, the average replacement cost per culvert was $193,440 and $166,960, respectively, for on- and off-system. Multiplying this cost by the number of culvert ratings of 4 or less predicted for 2029, one obtains budgeted amounts of $31.5 and $26.7 million, respectively, for on- and off-system culverts. Replacement costs may be reduced if some culverts with ratings of 4 or less are rehabilitated or replaced during this 10-year planning horizon. However, maintenance costs to prevent replacement are not included in these estimates.
Bridge Cost Forecasts
A bridge is considered deficient when any one of the three bridge ratings is 4 or less. The network deterioration models forecast the total number of bridges, as well as total bridge area, at each level of deck-, superstructure-, and substructure rating. The total bridge areas with at least one rating of 4 or less, predicted for 2029 were 9.6 million ft2 off-system and 23.6 million ft2 on-system ( 3 ).
However, the aforementioned totals overestimate deficient bridge areas, because the same bridge may have either 1, 2, or all 3 ratings at or below 4; therefore, future duplicates and triplicates need to be eliminated from the above total areas. A correction factor for the total was developed based on actual duplicates and triplicates mined from 2019 data. The final research report explains this procedure in detail, which resulted in a correction factor of 0.872 for the predicted on-system deficient area and 0.876 for that of the off-system. The predicted 2029 replacement costs were estimated to be $4.11 billion for on-system and $1.68 billion for off-system ( 3 ).
Conclusions
The models were implemented with a maximum planning horizon of 18 years, to avoid extending forecasts beyond the historical database range (i.e., 19 years of data). All four PonTex/NBI condition rating deterioration models reflect the quality of TxDOT’s maintenance practices. The deterioration over the 18-year horizon was negligible for nearly all ratings of 7 or less, in all models.
Ratings of 9 deteriorated rapidly in the beginning, reflecting the definition of this rating, which is reserved for new structures ( 9 ). Initial ratings of 9 were predicted to remain at 8.5 or greater after 2 years in only two models: ratings for new bridge substructures (10 years) and superstructures (6 years). The following models predicted only 2 years to deteriorate from 9 to 7: on-system culvert ratings, off-system culvert ratings in the oldest age group, and off-system superstructure ratings in the oldest age group. On-system substructure and superstructure ratings took longer than 18 years to drop from 9 to 7 for new bridges. Prestressed concrete superstructure models predicted 10 years to get from 9 to 7. All deck models predicted either 4 or 6 years to get from 9 to 7. Substructure models predicted 4 years to drop from 9 to 7 in all models except new on-system bridges (over 18 years). Initial ratings of 8 were predicted to remain at 8 as follows:
Two years in six culvert models;
Less than 2 years in two culvert models;
Four years in deck models for new bridges, as well as for the aggregated off-system deck model; 2 years in all other deck models;
Off-system prestressed concrete superstructures were the best performing, maintaining an initial rating of 8 for 10 years;
Substructures with initial ratings of 8 were predicted to remain at 8 for 4 years in six models, and 6 years in off-system bridges over dry land; and
The impact of age was clearly evident in on-system superstructures. In the newest, intermediate, and oldest age groups, the initial rating of 8 remained at 8, respectively, for 2, 4, and 6 years, and dropped to 7 after 8, 6, and 4 years, respectively.
Discussion
The extensive literature review conducted in this project did not find Markov transition probabilities estimated from relative frequencies observed over 19 years of inspection history—a database with nearly a million records. Some references estimated the probabilities based on experience and expert opinions, alone or in combination with inspection data (e.g., Cesare et al. [4], Kobayashi et al. [5], and Li et al. [6]). Moreover, all Markov-based bridge deterioration models found in the literature assumed that no rating drops by more than 1 in any one inspection cycle ( 3 ). This assumption was not met for the Texas data, especially for ratings of 9, for which the probability of dropping from 9 to 7 in 2 years was consistently quite high in all models, as illustrated in Table 1 and discussed for other cases. On-system culverts with an initial rating of 9 had a 57.9% probability of dropping to 7 in 2 years, and off-system decks aged between 17 and 34 years had a probability of 39%. The smallest probability of a rating of 9 dropping to 7 in one inspection cycle was 7.6% for off-system substructures. Initial ratings of 8 had a smaller probability of dropping to a rating of 6 in one inspection cycle, but their magnitude was not negligible for network-level forecasts, for example, this probability was 6.6% for off-system culvert ratings.
The simplifying assumption that such probabilities are zero can grossly underestimate deterioration, since it disregards all instances of accelerated deterioration: the higher the actual deterioration rate, the higher the probability of a rating dropping by more than 1 point in 2 years. Over 90% of the data records contain a designated inspection frequency of 2 years, and only 0.36% of the data records consist of bridges and culverts with designated inspection frequencies of 1 year or less; therefore, 2 years is the most realistic transition period for a Markov model, and only 2-year intervals could be counted when calculating the transition probabilities from the observed relative frequencies. This was strictly observed by the careful data preparation discussed previously.
Excessive data scatter precluded the development of reliable models consisting of equations that correlate ratings to age and other variables. On the other hand, the Markov transition probabilities were estimated directly from observed relative frequencies and were reasonably accurate, resulting in reliable network-level forecasts ( 3 ).
PonTex/NBI data do not contain information on maintenance and preservation activities. Therefore, it is impossible to know whether changes (or not) in ratings resulted from no maintenance or rehabilitation, in spite of it, or because of it. As such, any infrastructure condition data necessarily reflect the design, construction, and maintenance practices intended to prevent or counteract as much deterioration as possible, under local environment and traffic conditions. Data that capture true deterioration from a do-nothing approach do not exist. In that sense, all deterioration models are approximations.
It would have been valuable to investigate the impact of various types of maintenance and rehabilitation activities to counteract bridge and culvert deterioration in Texas, even though this topic was not part of this project scope. In Texas, this type of information is recorded in internal databases varying from construction bids, to in-house services performed at TxDOT district- or area-within-district levels. The effort required to collect, organize, and merge data scattered among different internal databases precluded this interesting analysis within the time and budget constraints of this project.
The PonTex/NBI condition ratings are a tried and true measure of bridge and culvert deterioration, and a long history is available. Prediction errors of the Markov basic matrices were low, and the Markov process provided useful network condition forecasts, which in turn could be readily used to improve future budgets required to support TxDOT’s management goals. Model updates are recommended no later than the year 2030.
One of the primary functions of a bridge management system is to provide a data-driven decision-making support system by forecasting future network-level needs and anticipating the costs and benefits of bridge replacement, rehabilitation, and preservation actions. Of these actions, bridge replacement projects account for a significant part of the current funding needs and annual allocations for transportation agencies such as TxDOT. Consequently, shortcomings in the cost forecasting models used within bridge management systems can impose serious and potentially costly errors affecting financial needs projections and project selection and prioritization. The models developed and implemented in this project could be valuable bridge and culvert management tools, allowing TxDOT bridge managers to forecast network-level needs to maintain management goals for both on- and off-system Texas bridges and culverts. Reliable forecasts for these conditions add significant value to the research documented in this paper. Inaccurate deterioration forecasts by TxDOT bridge managers may lead to shortcomings in budgets for bridge rehabilitation and replacement, with heavy financial costs for TxDOT and, consequently, for Texas citizens.
Element-based inspections measure both the severity and extent of bridge deterioration, and provide a better understanding of maintenance needs. The authors recommended developing deterioration models for bridge elements. This would refine the network condition forecasts, thus improving future budget allocations for maintenance, rehabilitation, and replacement.
Footnotes
Acknowledgements
The authors are grateful to the Bridge Division and Research and Technology Implementation personnel of Texas Department of Transportation involved in this project, especially Chad Dabbs, Drake Builta, Mark Wallace, Tom Yarbrough (retired), and Tom Schwerdt. This project could not have been performed without their prompt assistance with the inspection data, as well as their invaluable insights and advice.
Author Contributions
The authors confirm contribution to the paper as follows: study conception and design: J. Weissmann, A. Weissmann; data collection: J. Weissmann, A. Montoya; analysis and interpretation of results: J. Weissmann, A. Weissmann, A. Montoya; draft manuscript preparation: A. Weissmann. All authors reviewed the results and approved the final version of the manuscript.
Declaration of Conflicting Interests
The authors declared no potential conflicts of interest with respect to the research, authorship, and/or publication of this article.
Funding
The authors disclosed receipt of the following financial support for the research, authorship, and/or publication of this article: The authors acknowledge Texas Department of Transportation for financing this study, under contract number 0-6979.