
Abstract
This study aims to conduct a thorough assessment of pedestrian and cyclist safety in autonomous vehicle (AV) environments. To that end, the study utilized AV sensor data of over 1,500 driving hours from five sources in Canada, the United States, and Singapore. The sensor data were used to extract conflicts between AVs and active road users. The conflicts were then processed to develop accurate estimates of AV collisions involving pedestrians and cyclists based on the extreme value theory. Further in-depth assessments were conducted on the identified conflicts, by type and location, to highlight potential issues leading to risky conflicts. The results showed that the total number of predicted AV collisions involving active road users was 2.17 collisions per million AV kilometers travelled. Collisions involving pedestrians were slightly higher than those involving cyclists. Also, collisions in clear weather conditions slightly exceeded collisions in adverse weather conditions, although the difference was not statistically significant. The relative risk of collisions was developed for both pedestrian and cyclist conflicts per AV movement type. The results showed that for pedestrians, interactions with right-turning AVs are the riskiest, while interactions with left-turning AVs are the riskiest for cyclists. A thorough analysis of conflicts revealed many issues, including a higher tendency for pedestrian violations when interacting with AVs, aggressive AV behavior (particularly when interacting with pedestrians while making a right turn), AVs struggling to predict the path of cyclists (mainly because of cyclist violations), and AVs failing to interpret pedestrian intentions in some cases.
Keywords
The development of self-driving (autonomous) vehicles (AVs) and the outpouring of funds to support them has been propelled by many factors, one of which is undoubtedly improved road safety ( 1 ). Since the early development years, researchers and AV developers focused on developing the algorithms used by the AV to navigate complex roads and interact with other road users safely ( 2 ). Nevertheless, researchers have been faced with the challenge of accurately quantifying the safety impacts of AVs, mainly given the lack of reliable data (such as historical AV collision records or conflicts), a challenge that became more pressing with the accelerated rate of AV utilization ( 3 ). In urban roads, AVs must account for an increased number of variables and driving situations compared with freeway autopilot and platooning applications ( 4 ). In addition, the diverse traffic stream that exists on urban roads adds another layer of complexity. As such, the problem of assessing the safety of AV interactions with urban road users becomes a cornerstone toward preparing AVs for widespread deployment.
Active road users, including pedestrians and cyclists, constitute a critical group that exerts unique behavior traits compared with motorists. Both cycling and walking are essential modes of transport that represent a significant portion of the traffic mixture on urban roads. As such, active road users must not be overlooked when assessing the impacts of AVs on safety, especially given their inherent vulnerability. In the era of automation, the interactions between active road users and AVs are yet to be fully understood, given a combination of public skepticism and unfamiliarity, on top of the low market penetration of AVs to date ( 5 ). Early projections also hint at the possibility of risky situations as a result of active road users relying on AV capabilities to keep them safe ( 6 ). This knowledge gap, coupled with the restrictive regulations on AV deployment, indicates the need for proactive safety assessments that provide reliable solutions, especially in the early years of adoption. In the last decade, an abundance of survey studies has emerged in an attempt to set expectations and identify the concerns of pedestrians and cyclists about sharing the road with AVs ( 7 , 8 ). Some of the studies suffered from biased and improper design, while the number of respondents and covered demographics were limited in others ( 9 ). Still, the findings offered a peek at the consensus of the public toward AVs and some of the areas that could help alleviate their concerns. This was followed by several studies that utilized computer simulations to overcome the lack of AV data and predict potential risky situations involving active road users and AVs ( 10 , 11 ). These initial applications lead to the next logical step, which is utilizing real-world data to verify or refute previous findings quantitively and discover unforeseen risks to active road users in AV environments.
As with every traffic-related problem, data-driven assessments are among the most convenient approaches to grasp the impacts of disruptive technologies and develop a clear understanding of potential issues. Recently, several AV developers started to operate their fleets on open streets in many cities around the world. Collectively, millions of miles have already been recorded by AVs of different manufacturers ( 12 ). The onboard sensors of the operating AVs, such as cameras and light detection and ranging sensors (LiDARs), were used to collect accurate trajectories, heading, and speed data of the AVs as well as nearby road users ( 13 – 18 ). For safety applications, the collected data, while different in structure, all share the necessary measures to accurately map out the interactions and conflicts involving the AVs on their routes. The trajectory data facilitate reliable safety assessments that could be carried out to quantify traffic conflicts and predict traffic collisions eventually.
Early traffic collision prediction, conducted by Alozi and Hussein ( 19 ), indicated alarming numbers of AV–pedestrian collisions per driven distance, which signaled the need for further investigation of AV conflicts. In this study, we aim to conduct a thorough assessment of pedestrian and cyclist safety in AV environments. This is achieved by collecting AV sensor data from five datasets in the United States, Canada, and Singapore to capture diverse behaviors and environmental settings. The conflicts are then processed to develop extreme value theory models and predict the frequency of collisions involving active road users. Further in-depth assessments are then conducted on the identified AV–road user conflicts, by type and location, to highlight potential causal relationships leading to risky conflicts. This study provides several contributions to the literature, including the prediction of collisions involving active road users in AV environments using real-world data. In addition, the study sheds light on several key issues that can lead to increased safety risks and require enhancing the AV driving behavior, our understanding of active road user behavior, or both. This is essential in order for AVs to be better suited for urban streets with increased pedestrian and cyclist volumes. The rest of the paper is organized as follows: the next section presents a rundown of previous studies and their relevant findings. The third section presents the AV data sources and structure. The fourth section explains the methods utilized in the study. The fifth and sixth sections present the modeling results, in-depth assessment, and discussion of observed conflicts. Finally, the last section includes the concluding remarks and limitations of the study.
Literature Review
Several methods have been utilized in the literature to evaluate the safety of active road users around AVs, some more prominent than others. Computer simulation has been widely considered a convenient tool to test scenarios of upcoming technologies, like AVs, without the need for historic data. In simulation studies, participants were placed in simulated environments through virtual reality kits or driving simulators to test their responses to different interactions with AVs. These studies reported minor impacts on the observed road user behavior as a result of the AVs’ presence, despite significant changes in the participants’ perceived levels of safety ( 10 , 20 ). Other studies used different alternatives such as a ‘fake AV’, by posing a regular car as an AV through signs and stickers ( 21 ), or by disguising the human driver to give the impression of an empty driver seat ( 22 ). More recent attempts saw researchers experimenting with AV shuttles operated on open roads, which showcased interesting behavioral patterns. For example, two recent studies collected data from AV shuttles that operated on pre-planned routes in Greece, France, and Canada ( 23 , 24 ). While neither of the two studies focused solely on active road users, the findings indicated enhanced safety for pedestrians, particularly women and elderly pedestrians, around the AV shuttles compared with regular vehicles. However, cyclists demonstrated some risky behaviors by travelling beside the AV shuttles on narrow paths and attempting to overtake despite the limited space.
Recently, with the advancement of AV technology and the availability of more data, other approaches have been used to assess the safety impacts of AVs. For example, Scanlon et al. ( 25 ) reconstructed 72 fatal collisions based on pre-crash scenarios and then replaced the human drivers with a Waymo Level-4 AV system to assess if those collisions could be mitigated. The results showed that all collisions that involved active road users were mitigated with the AV system, even when the active road user was at fault. Recently, as more AV collision and disengagement data became available, several studies have been undertaken to investigate AV collision patterns. For example, Liu et al. ( 26 ) compared the patterns of AV collisions to those of conventional vehicles. Despite the majority of AV collisions being rear-end collisions caused by other vehicles, the study found that a significant number of these collisions were partially caused by the AV’s sudden stop to avoid an active road user. A later study found that cyclists were not only the most likely to collide with an AV, but that they were often at fault in serious interactions ( 27 ). In another study that focused on AV disengagements, one of the primary causes of disengagements initiated by the AV was external factors such as excessive pedestrian traffic ( 28 ). This critical finding points out the difficulty of proper detection of pedestrians in large groups.
As can be seen in the literature, concerns were raised about bike safety around AVs. Also, despite the promising results that show improved pedestrian safety around AVs, it is well-known that AV fatal collisions involving pedestrians did in fact happen in real life. These collisions had an adverse impact on public perceptions of the technology, even if these concerns were somewhat eased for people who got to interact with AVs ( 29 ). This goes to show the critical role that proactive safety assessments play in addressing safety concerns of active road users for the future of AV technologies. The traffic conflict technique was established as a reliable and proactive safety assessment tool that has been successfully used to address numerous safety applications in the literature, for example, Hussein et al. ( 30 , 31 ), Tageldin et al. ( 32 ), Zaki et al. ( 33 ), Kumar and Ghosh ( 34 ), and Nasernejad ( 35 ). In this technique, the frequency and severity of the observed conflicts between road users are used as a surrogate measure for actual collisions. Generally, traffic conflicts are quantified by one or more conflict indicators. Among the various indicators that can be used to describe the severity of a conflict, temporal proximity measures are by far the most widely used, whereas some measures like the post-encroachment time (PET) are particularly useful for active road user conflicts with vehicles ( 36 ). Recently, traffic conflict studies incorporated the concept of extreme value theory to predict collisions ( 37 , 38 ). This approach added the much-needed quantifiable result, which is the number of collisions, to be directly used as a safety indication. The technique has been validated against actual collision records in several studies ( 39 , 40 ). This approach was used recently to assess the safety of pedestrians interacting with AVs in urban areas ( 19 ). The study developed a framework for predicting pedestrian–AV collisions using real-world conflict data. Nevertheless, the study neither investigated the extracted conflicts in detail nor discussed the factors that lead to some serious interactions between pedestrians and AVs.
In summary, the contributions of previous works indicate the critical role of proactive safety assessments in evaluating the actual impacts of AVs. While several studies focused on the effects of AV presence on pedestrians and cyclists, the methods mostly relied on simulated environments and included limited scenarios. To the best of our knowledge, the research still lacks a comprehensive assessment of active road user safety around AVs using real-world data. Furthermore, of the many methods that can be used for such assessment, the combination of the traffic conflict technique and the extreme value theory modeling proves to be reliable and produce accurate estimates of safety.
Data
The AV data utilized in this study were collected from five separate sources, including Lyft Level-5 ( 16 ), Argoverse 2.0 ( 18 ), nuScenes ( 15 ), Waymo ( 17 ), and the Canadian Adverse Driving Conditions (CADC) dataset ( 41 ). The two largest data sources in terms of travel time are Lyft and Argoverse, which contain over 400,000 scenes combined. The remaining datasets, nuScenes, Waymo, and the CADC, all include hand-picked scenes that were deemed interesting by their respective AV developers because of frequency of interactions with other road users, special weather conditions, or challenging detection situations. Therefore, these three datasets contain a higher density of interactions between the AVs and active road users. Table 1 lists the dataset statistics including the number of observed AV-active road user conflicts, while the locations of the data collection are highlighted in Figure 1.
Dataset Statistics
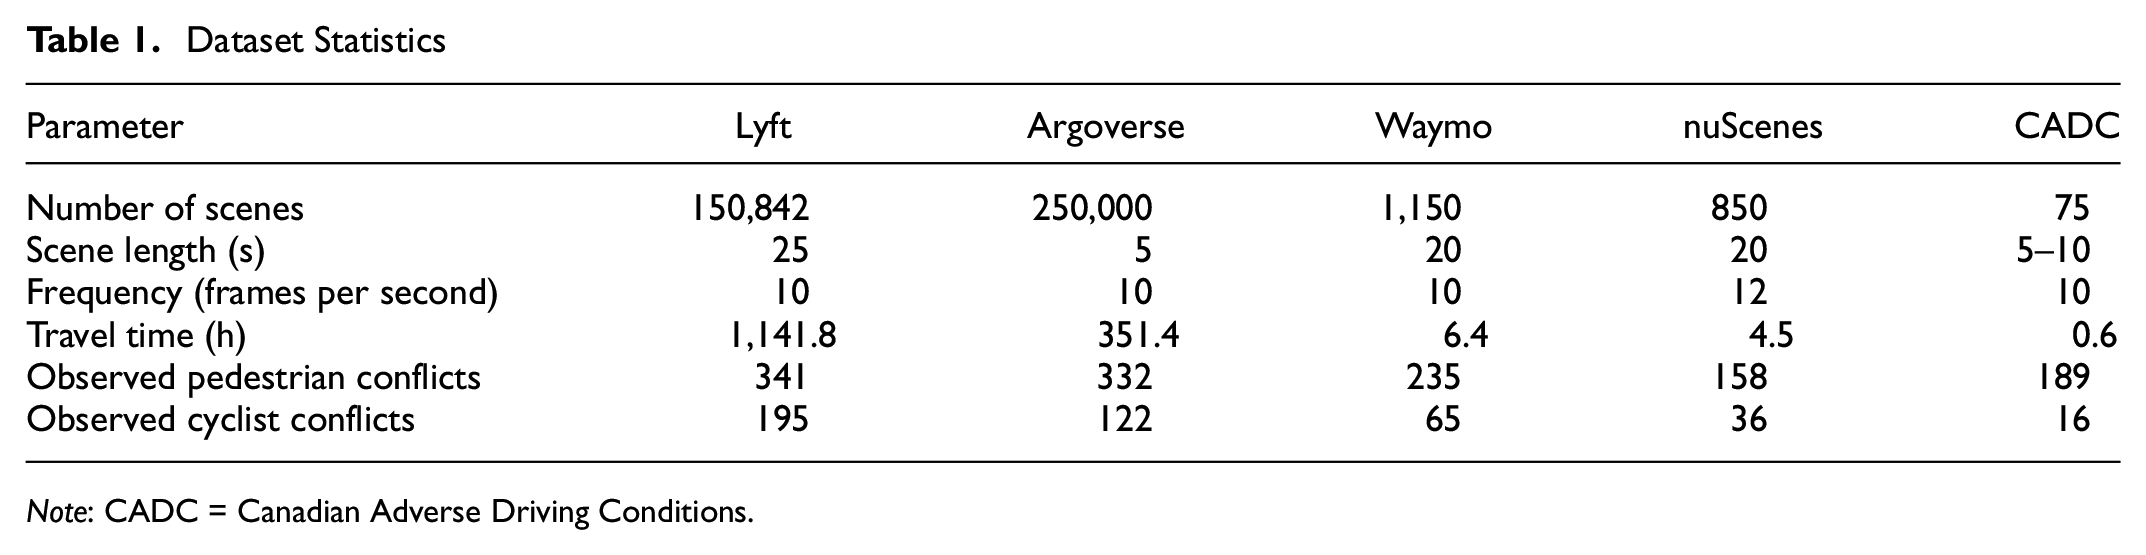
Note: CADC = Canadian Adverse Driving Conditions.
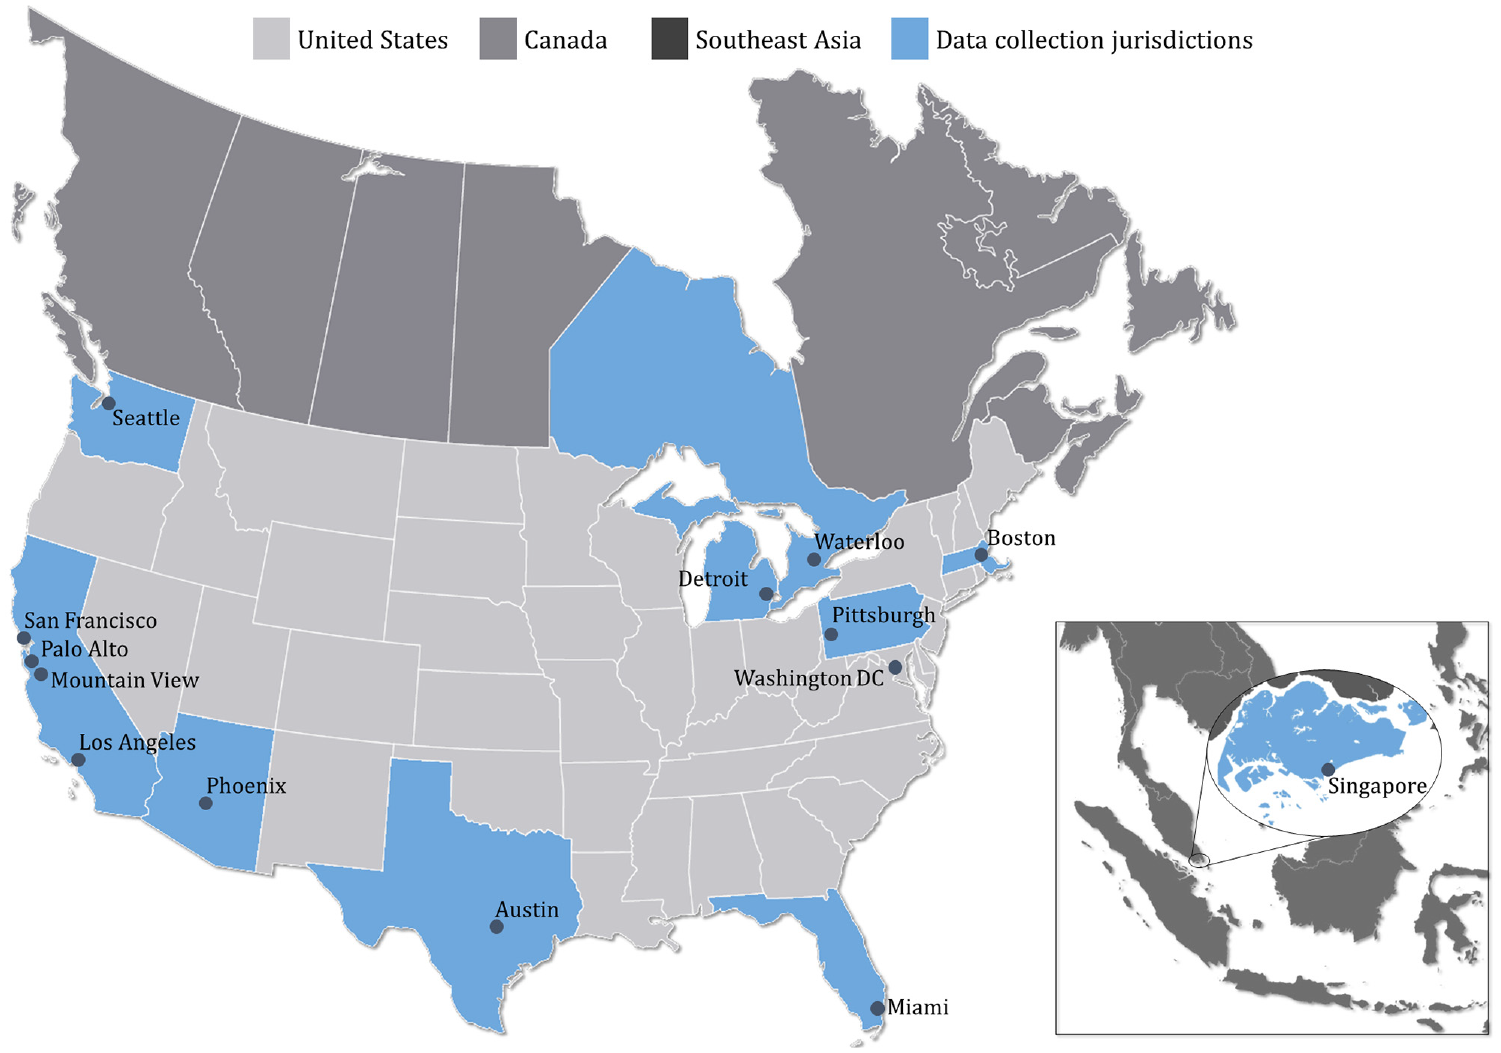
Dataset collection locations.
All five datasets provide trajectory data of the subject AV, including timestamps, 3-dimensional map coordinates, and heading angles. In addition, LiDAR point clouds of each timeframe along the trajectory are collected to capture the surroundings and nearby road users within a radius of 200 m from the AV. Using the LiDAR data, 3-dimensional cuboids of all passing road users are extracted and categorized into different road user groups. The movements of each individual road user are mapped by their unique identifiers, timestamps, map coordinates, size, and heading. The datasets also include additional camera footage of the traversed trips. The videos are recorded by a camera system consisting of five to seven high-resolution cameras mounted in a ring-shaped format on the roof of the subject AV to cover 360° angles. These recordings provide additional information to the observer that help describe the scenario before, during, and after the potential conflict. Minor differences between the AV on-board sensors in each dataset include additional radar sensors in nuScenes vehicles, additional upward cameras in Lyft vehicles, and additional LiDAR sensors on the front bumpers in Lyft and Argoverse vehicles. Figure 2 demonstrates a sample of the typical AV sensor suites, including the essential “self-driving” side stickers. In total, the five datasets provide a diverse collection of AV trips, reaching over 1,500 h of travel time collectively. In Figure 3, sample snapshots from the five datasets are provided, showing different weather conditions and times of the day.
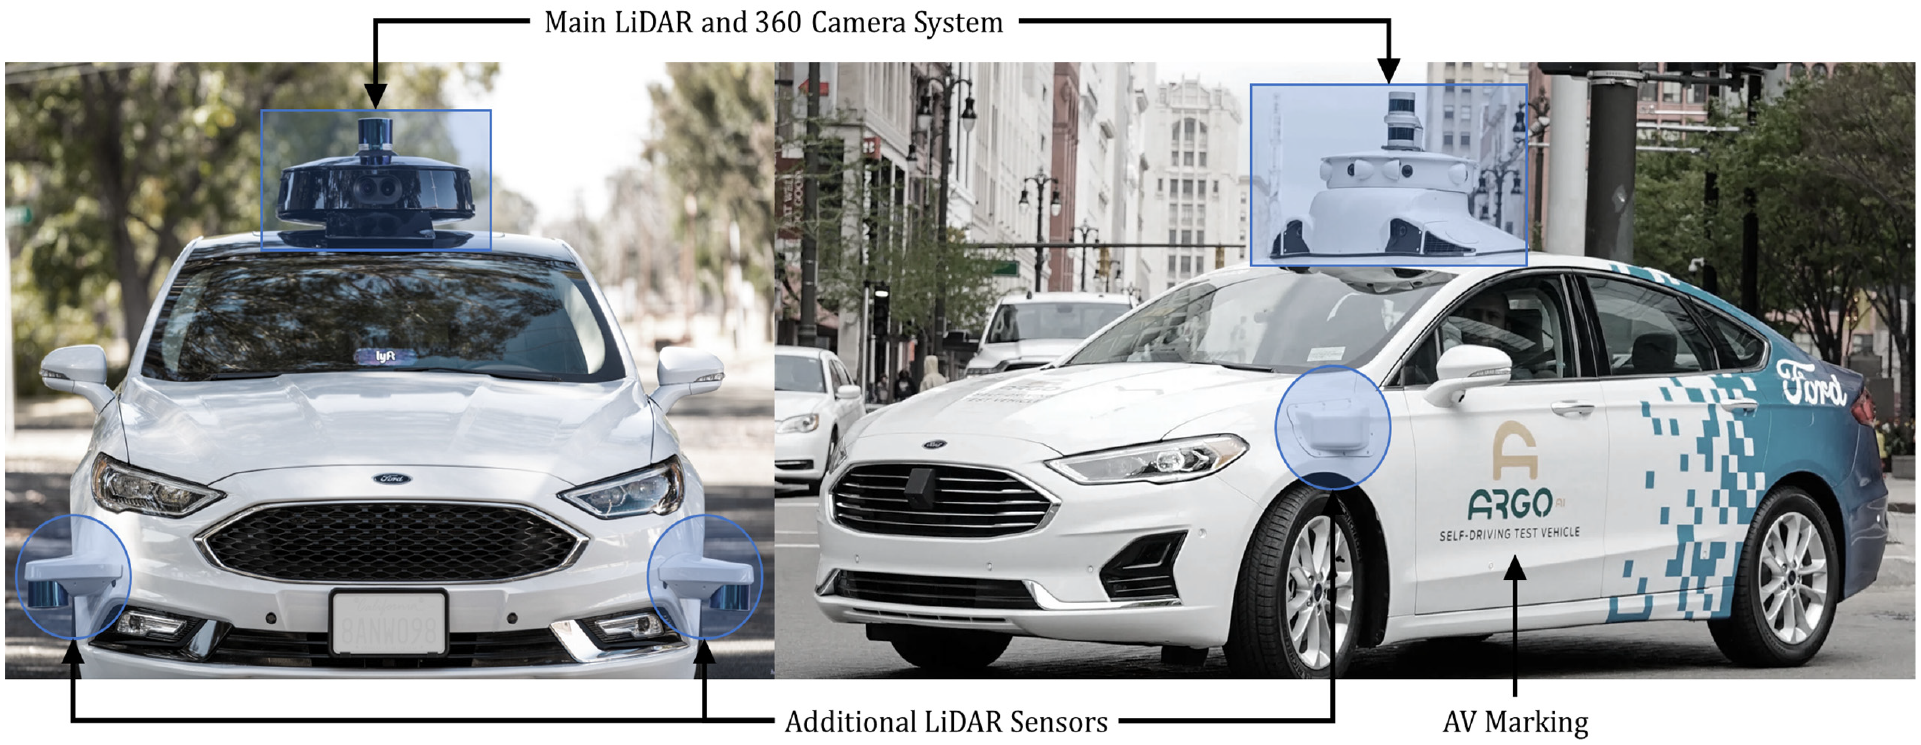
Typical autonomous vehicle sensor configuration demonstrated on Lyft vehicles (left) and Argoverse vehicles (right).
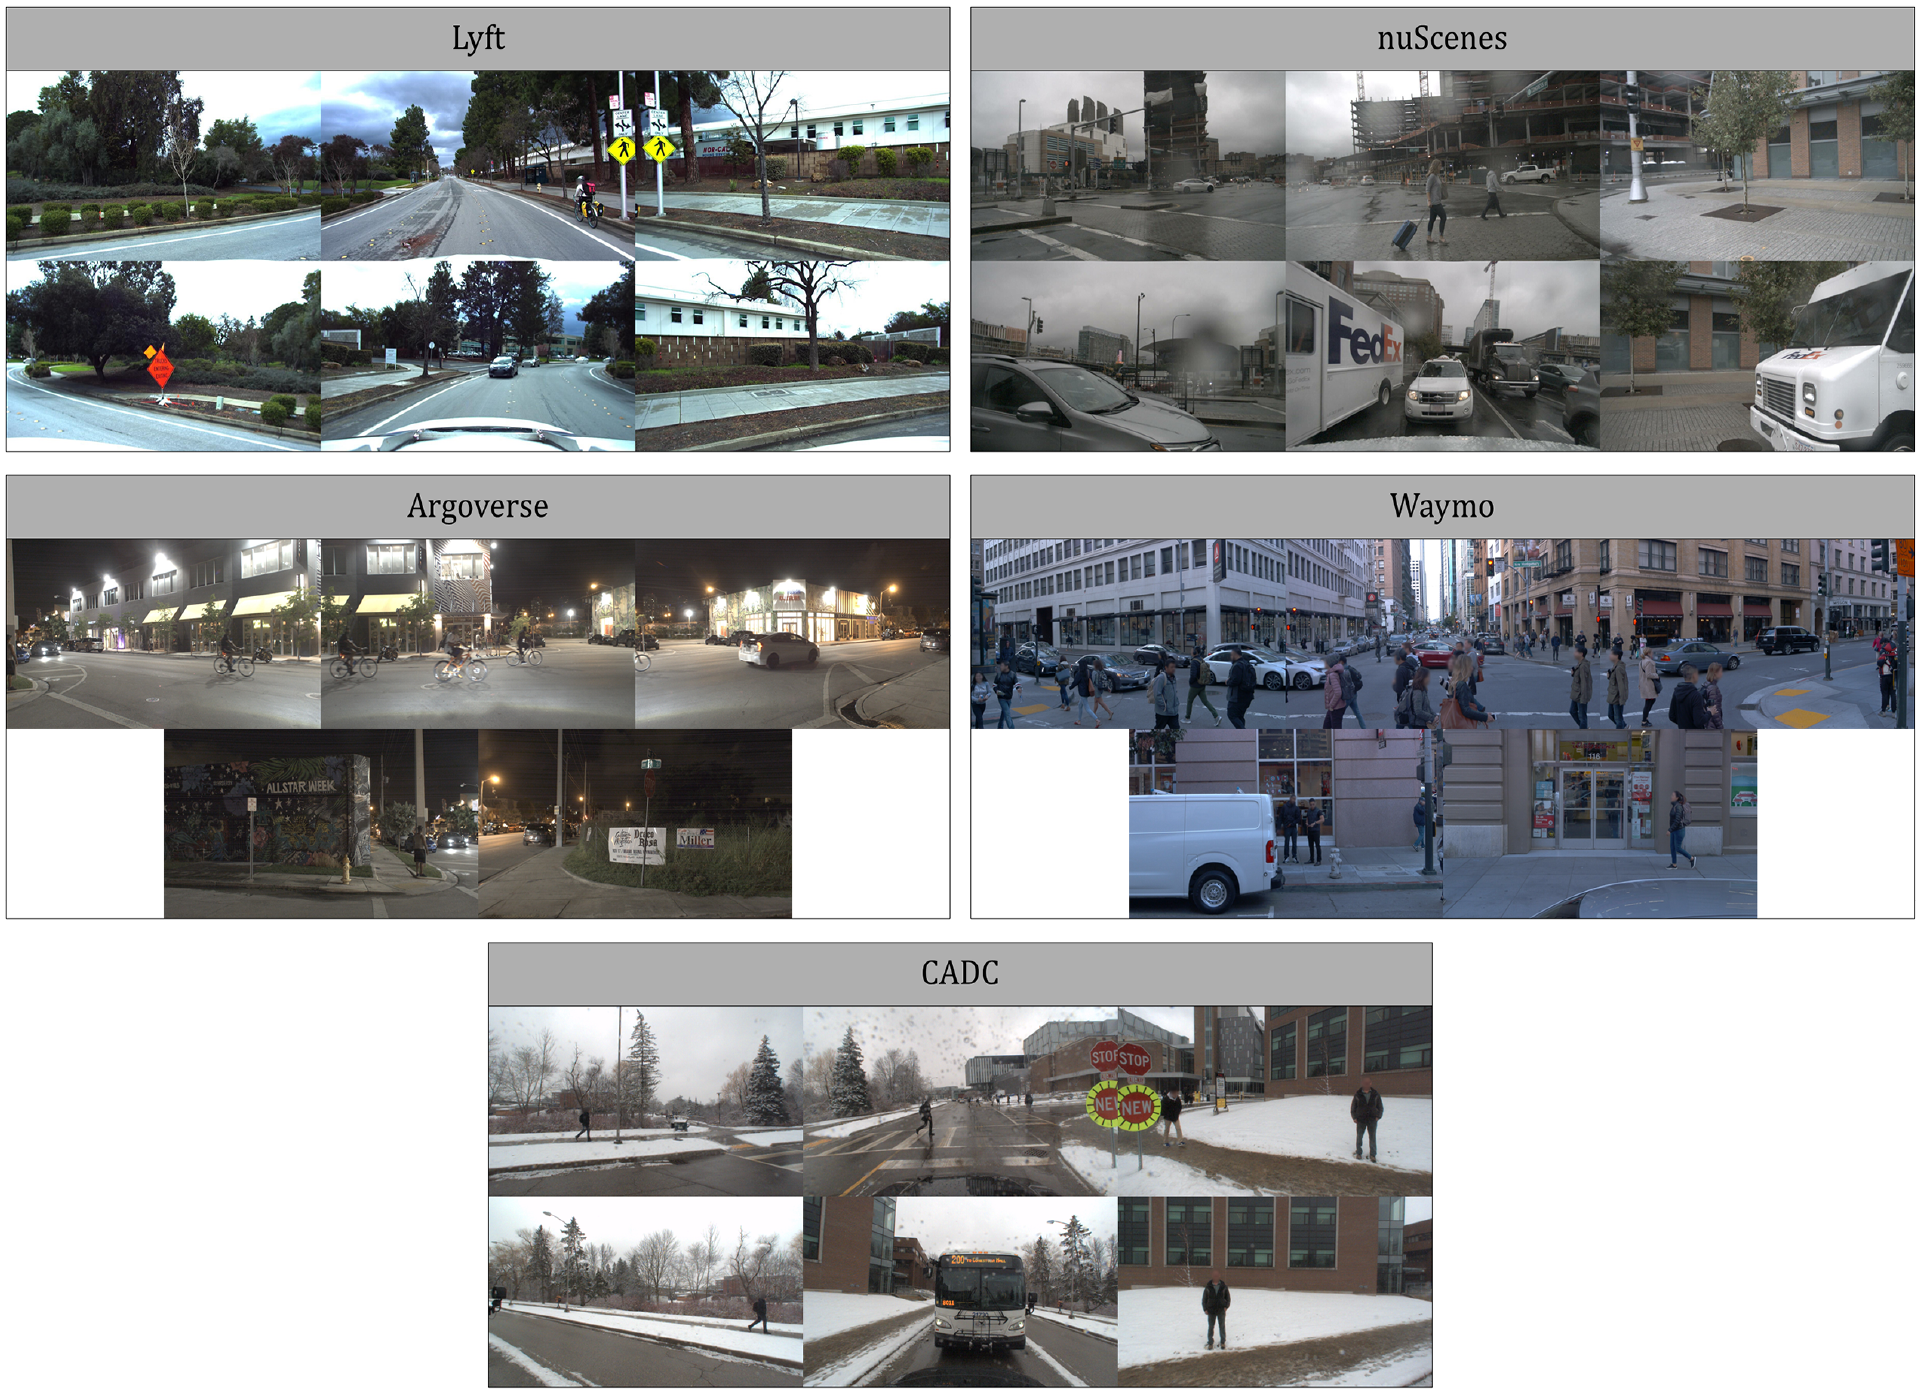
Sample frame snapshots from the considered autonomous vehicle datasets.
Methods
To meet the objectives of the study, traffic conflicts involving active road users were first extracted from the five datasets. The conflicts were then quantified and categorized by road user type, AV movement, and weather conditions. Afterwards, the extreme value theory was used to predict AV-active road user collisions. The observed conflicts, predicted collisions, and other trajectory-related information were further used to investigate specific issues relating to the safety of pedestrians and cyclists around AVs. The following sections provide a brief overview of the conflict identification and classification process and the collision prediction using the extreme value theory.
Conflict Identification and Classification
The conflict identification and classification step was conducted using Python language to handle the necessary processing power. For each scene, conflicts between the AV and other road users were identified using the extracted trajectories. Conflicts were quantified using the post-encroachment time (PET) conflict indicator. The PET is defined as “the time difference between the moment an active road user passes out of the area of a potential collision and the moment a vehicle arrives at that same area of the potential collision” ( 42 ). The PET was calculated for all observed interactions using the AV and active road user trajectories. A simple Python code was developed to calculate the PET for each conflict as the time difference between the moment an active road user clears a point of a potential collision and the moment the AV arrives at that same point. Only conflicts that involved pedestrians, cyclists, or both, were retained for further analysis based on the scope of the study. In total, 1,255 and 434 conflicts involving pedestrians and cyclists, respectively, were extracted from the five datasets. The identified conflicts were then categorized by road user type (AV–pedestrian and AV–cyclist conflicts), AV movement (through, left turn, and right turn), and weather conditions (adverse and clear). The classification of conflicts by road user and weather conditions was straightforward. The classification of conflicts by vehicle movement involved automatic detection of the AV movement. This was done using the difference in the AV’s heading angle along the trajectory during the time of the conflict. Following some preliminary testing, vehicles with a difference in the heading angle greater than 30° along the trajectory were set as right-turning vehicles, while vehicles with a difference less than −30° were set as left-turning vehicles. Manual validation of a sample of conflicts showed a high classification accuracy of 98.3%.
Finally, since the data are measured at a frequency of 10 to 12 frames per second, the annotated speed profiles of road users were sensitive to slight inaccuracies in the instantaneous speed tracking. As such, a smoothing algorithm was applied to eliminate significant oscillation and enhance the accuracy of any parameters extracted from the speed profile for further analysis (e.g., AV instantaneous acceleration). Specifically, the single exponential smoothing algorithm was applied for its simple implementation and effectiveness for speed profiles with low relative variability over time ( 43 ). A sample of the smoothing process results is presented in Figure 4.
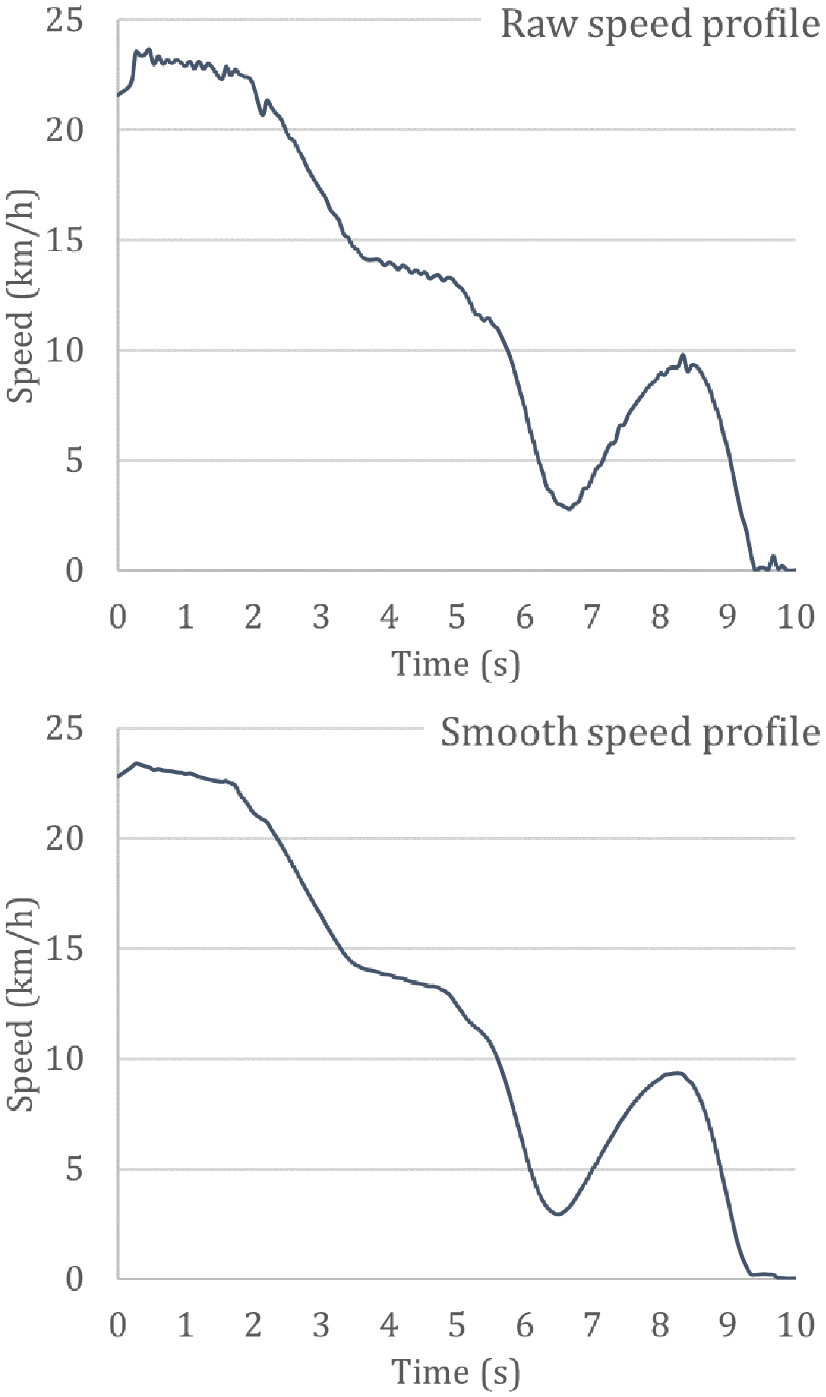
Sample speed profiles of an autonomous vehicle showing the speeds before and after applying the smoothing algorithm.
Collision Prediction Using the Extreme Value Theory
For the accurate prediction of collisions, this study employs the framework developed in Alozi and Hussein ( 19 ) to evaluate the safety of active road users in AV environments. Across a scale of traffic conflict severity, measured using the PET, predicted collisions can be approximated using the extreme events with high severity. In total, models were developed for active road users and classified by road user type and weather conditions. The specific approach selected in this study is the peaks over threshold technique, where the generalized Pareto distribution is fitted to the conflict severity distribution. The tail end of the fitted distribution is then isolated to calculate the risk of collisions, which in this case is defined by reaching a PET ≤ 0, as demonstrated in Figure 5. This extrapolation relies essentially on the observed traffic conflicts to predict the rare collisions over a long exposure metric. In this study, the exposure metric of desire is the AV kilometers travelled (VKT), which can offer a solid representation of the actual safety performance of AVs without waiting for AVs to drive the necessary distance. Although AVs of different types have been operating for extended distances, recent estimates suggest the need for hundreds of millions of miles of driving data to confidently verify the safety impacts ( 12 ); hence the value of the extreme value theory as a convenient alternative.
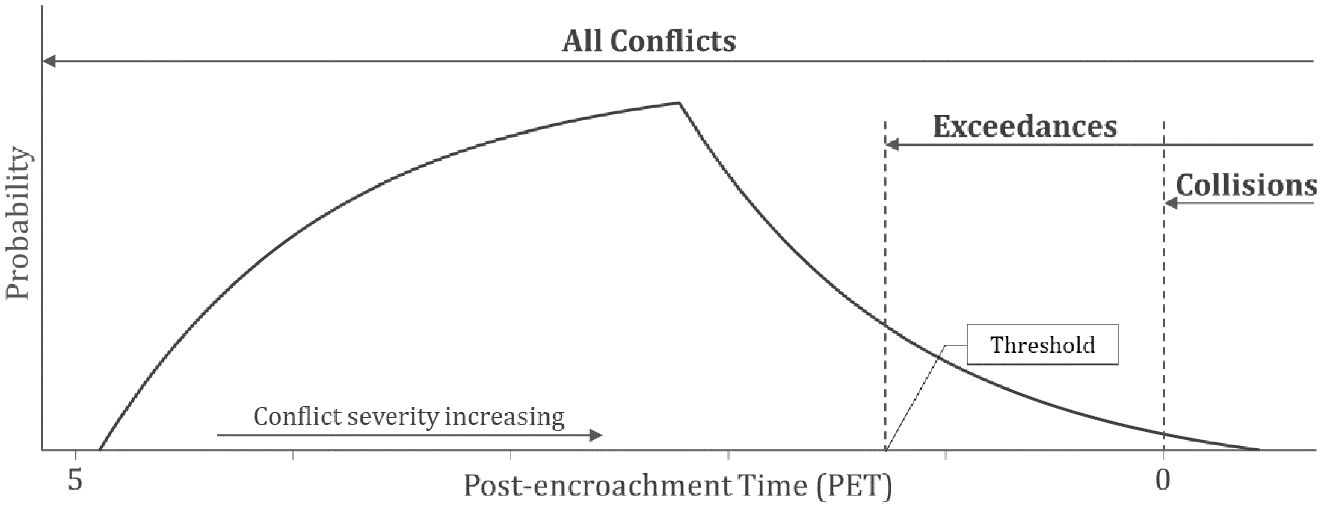
The elements of conflict severity distribution.
The initial setup of the extreme value theory models requires setting a threshold on the scale of conflict severity for each model, which is determined beforehand. The threshold is selected by testing the linearity of the exceedances and the stability of the two parameters of the fitted distribution, that is, the scale and shape parameters. Assuming that the observed conflicts are random independent events X1, X2, …, Xn, and the predetermined threshold is denoted u, then the cumulative distribution function of exceedances can be written as:

The distribution can then be approximated by a generalized Pareto distribution, given a sufficiently high threshold. The form of the distribution becomes:
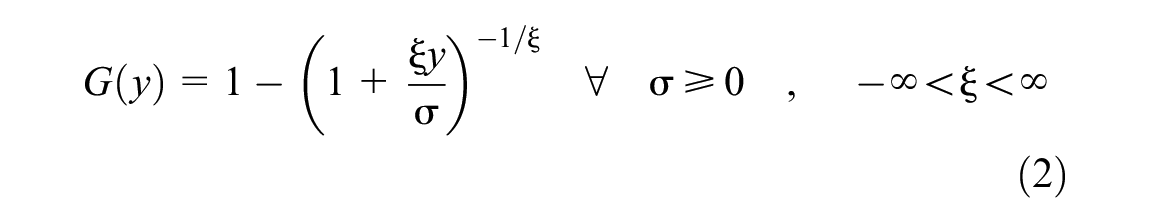
where σ is the scale parameter and ξ is the shape parameter. Since the conflict severity is measured by the PET, the distributions are used as a basis of the developed models. For the sake of simplicity, the negated values of the PET are used, leading to collisions being defined by a PETneg ≥ 0. It follows that the risk of collisions, which is the probability of observing a conflict exceeding zero, can be calculated using the following equation:

where Z is the negated conflict indicator and G is the generalized Pareto distribution. The expected collisions can be calculated by multiplying the resulting risk factor by a ratio to reach the desired exposure, which in this study was set to a million VKT. In the collected datasets, the subject AVs travelled a combined distance of 27,860 VKT. By dividing the desired travelled distance by the actual travelled distance, the predicted collisions can be calculated in the following form:

For the purpose of predicting AV–active road user collisions, conflicts with PET values less than or equal to 5 s were considered. This 5-s upper limit is considered a reasonable cut-off point to eliminate non-severe conflicts while also allowing the extreme value theory models to select a suitable exceedances threshold between 0 and 5 s ( 44 ).
Results
The distributions of the identified AV–active road user conflicts are provided as boxplots in Figure 6. Overall, it appears that pedestrian conflicts are relatively riskier than cyclist conflicts since the distribution is skewed toward lower PET values. This is not surprising given the closeness between pedestrians and vehicles in many interactions. Figure 6 also shows the distribution of pedestrian and cyclist conflicts classified by AV movement type. For pedestrians, it seems that through and right-turn conflicts are riskier than left-turn conflicts, while conflicts with turning AVs seem riskier for cyclists than conflicts with through vehicles. Nevertheless, the different interactions will be assessed further following the estimation of the predicted collisions.
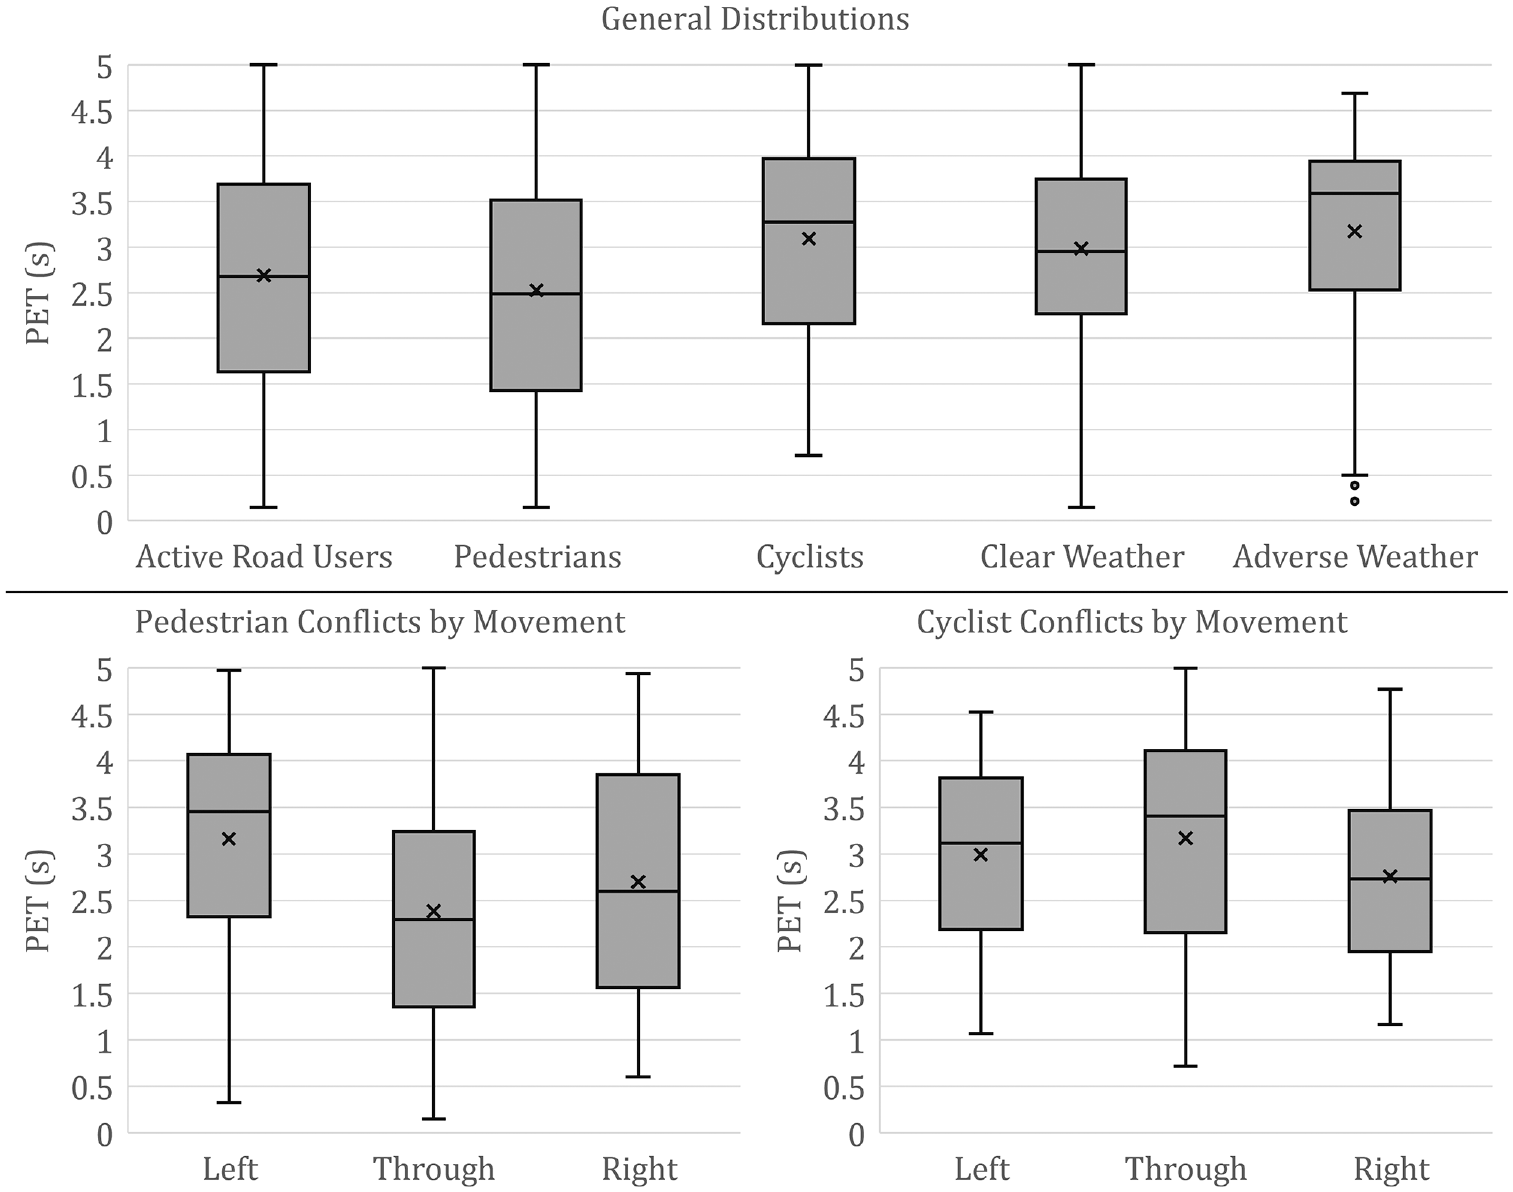
Statistical distribution breakdown of the considered conflicts.
On top of the behavioral issues and traffic scenarios, weather conditions have been a concern for AVs in general, given the risk of obstructed sensors in severe weather. One key benefit of including diverse datasets is the ability to study the effect of adverse weather conditions—that is, rain and snow—and how AVs perform as a result. Figure 6 includes the boxplots of the conflicts in clear and adverse weather, which show relatively similar trends. AV–road user conflicts in adverse weather conditions appear to be slightly less severe compared with clear weather conflicts, but not enough to have a significant impact on the overall PET distribution, as was confirmed by the statistical testing (P-value of 0.34). On closer inspection of the video footage, several key observations were noted that could explain this finding. For instance, except for a few risky conflicts with running pedestrians, active road users mostly exhibited cautious behavior in adverse weather conditions, mainly because of slippery pathways and snow accumulation on the side of the road. Moreover, most of the adverse weather conflicts came from one dataset, the CADC, which was collected mainly around a college campus. This could have introduced a bias in the demographics of the crossing pedestrians and cyclists. Finally, in many of the observed conflicts, large numbers of active road users forced the subject AV to yield well ahead of potential conflicts, leading to higher PET values. Moreover, observed conflicts were utilized to develop several extreme value theory models to predict AV collisions based on the methodology presented in the methods section, whereby five models were developed in total. The first model is a general model that is developed using all observed conflicts. The second and the third models were developed to predict the pedestrian and bike collisions with AVs, respectively. The fourth and the fifth models focus on predicting AV–active road user collisions under clear and adverse weather conditions, respectively. The graphical method of setting a suitable threshold to isolate the conflict exceedances is demonstrated on a sample set of plots in Figure 7 for the general active road users’ model. Essentially, a reasonable range can be identified in each of the three plots, which includes the portion where the mean residual life plot starts to become linear, and the parameter stability plots become near constant. Then, the minimum common value from all three ranges is set as the threshold of the model, which in this case is −1.65. Plots to showcase the goodness-of-fit are shown in Figure 8, in the form of probability plots. Overall, the models demonstrate a reasonable fit across the five developed models.
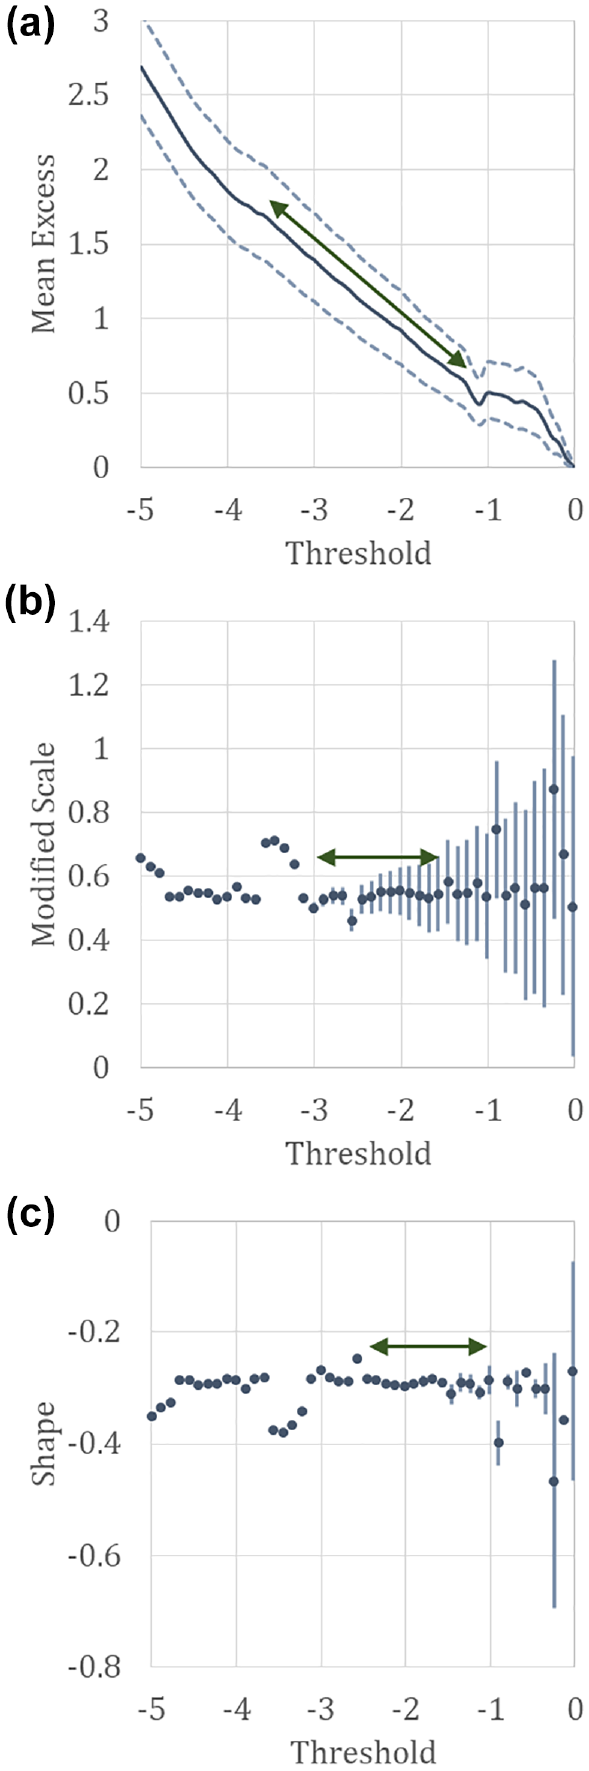
Graphical method plots for the threshold selection (active road users’ model), including the (a) mean residual life and (b) and (c) parameter stability plots.
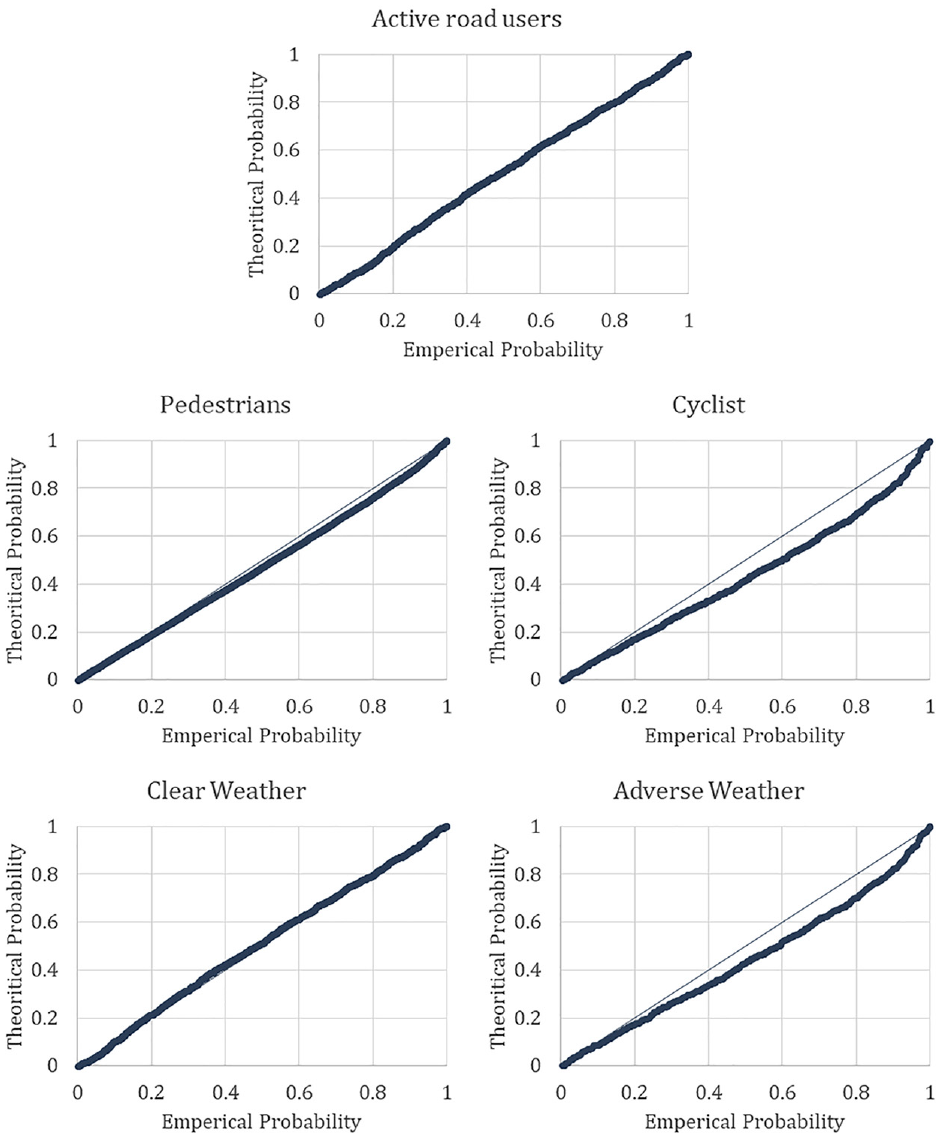
Goodness-of-fit plots for the developed models.
Table 2 summarizes the parameters of the developed models, including the scale and shape parameters of the fitted distribution and the number of predicted collisions per million VKT. For starters, the broad model including all active road users resulted in 2.165 predicted collisions per million AV VKT. When separated, the pedestrians’ model produced a higher number of predicted collisions compared with the cyclists’ model, although the difference was not drastic. The separate models based on weather conditions also indicated a relatively similar outcome, with 0.974 and 0.845 collisions per million VKT in clear and adverse weather, respectively. However, when considering the confidence interval, the difference becomes more evident, with the majority of collisions occurring in clear weather. It should be noted that the total collisions from the general active road users’ model will not equal the sum of predicted collisions of the separate models (by road users or weather conditions). This outcome can be mostly attributed to the potential correlation between the separate models, as reported by Fu et al. ( 45 ). For the purpose of this study, the measured difference was not drastic, indicating a minor correlation. Yet, the confidence interval of the combined model indicated a more accurate estimate.
Model Parameters and Results for Collision Prediction
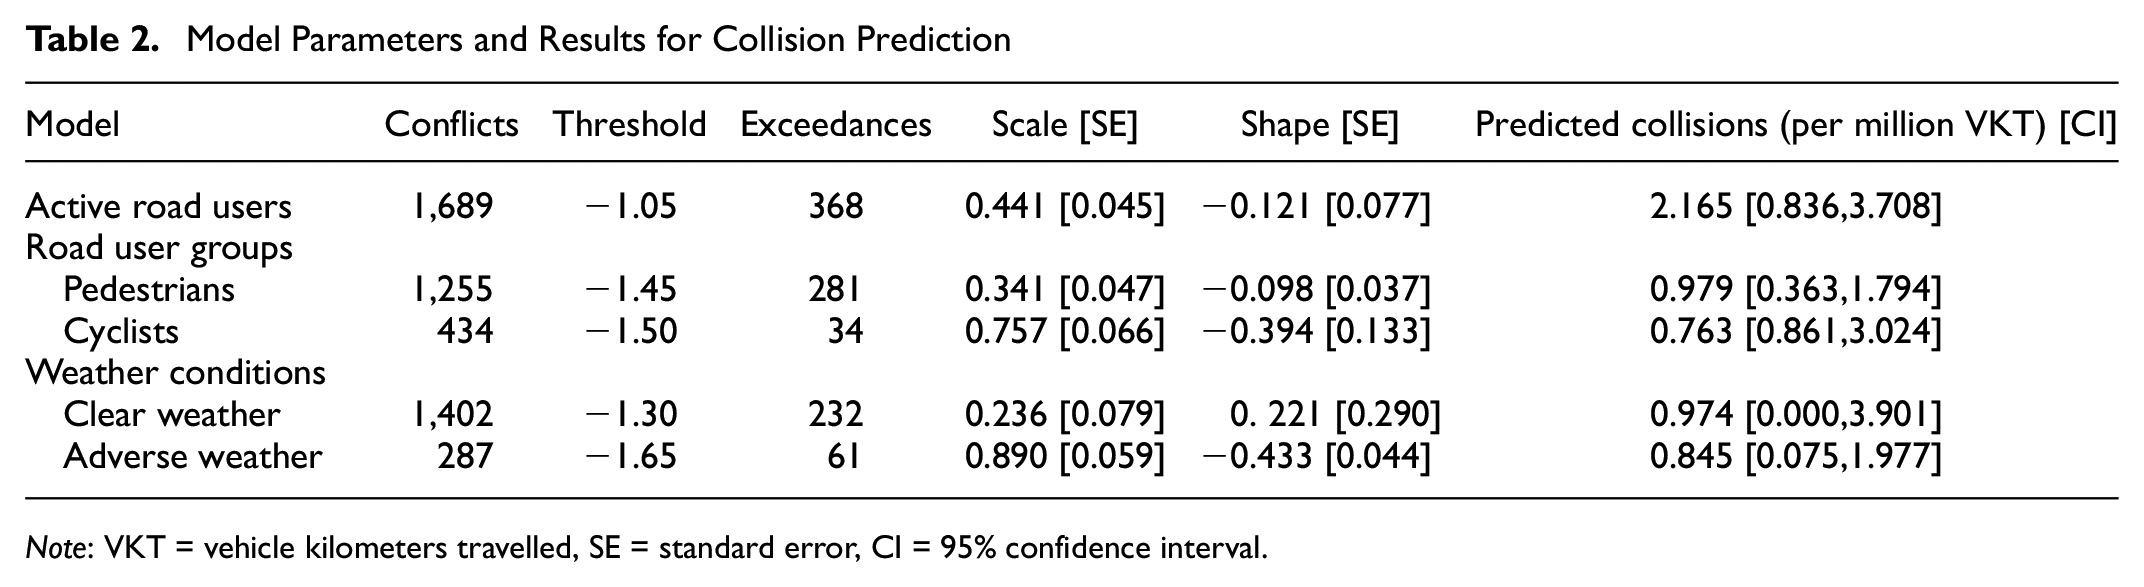
Note: VKT = vehicle kilometers travelled, SE = standard error, CI = 95% confidence interval.
To analyze the risk further, relative collision risk was calculated for the different AV movement types for both pedestrians and cyclists. Through movements were set as the reference scenario, and the risk of collision with the left and right turns was calculated as a ratio of the risk of collision with through movements. The risk of collision was utilized as opposed to actual predicted collisions because of the high inherent correlation between the AV movement types. This was confirmed by previous studies that attempted a similar segmentation by conflict types from the same population ( 45 ). As shown in Figure 9, right-turning conflicts had the most alarming result for pedestrians, with over three times the risk of through conflicts. As for cyclists, conflicts with right-turning AVs were the least risky, with less than half the risk of through conflicts. Left turns were especially risky for cyclists followed by through conflicts, although the through conflicts had a wide confidence interval indicating uncertainty associated with this estimate.
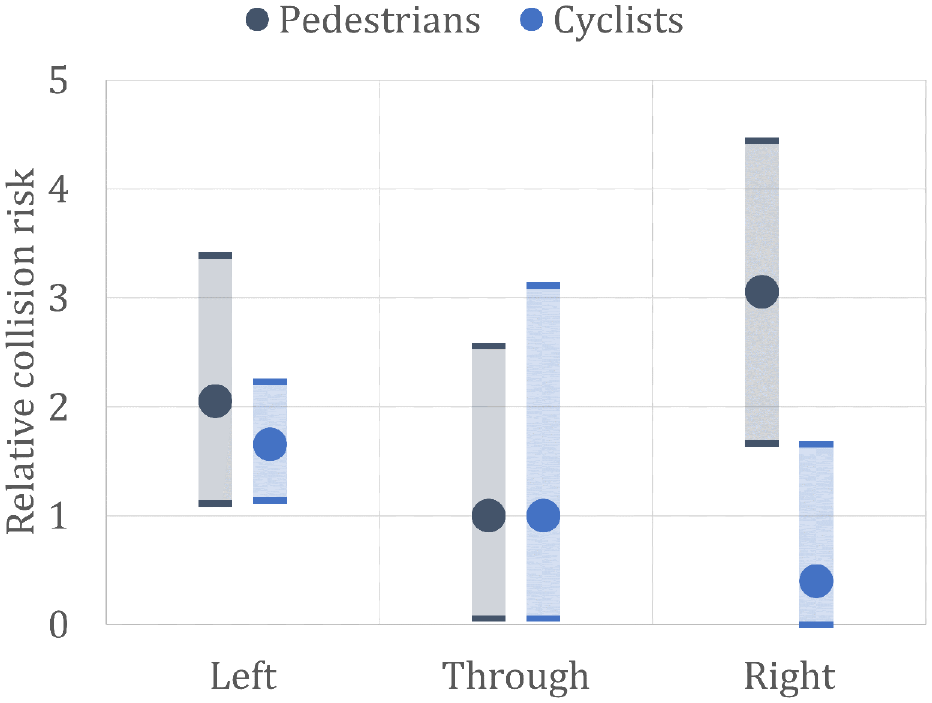
Relative collision risk by movement type (based on through conflicts).
Discussion
The results suggest that special attention should be given to certain movements when it comes to the safety of active road users around AVs. One of the first prominent observations that were unexpected in the results was the high number of conflicts between through AVs and pedestrians. Reviewing those conflicts showed that a significant portion involved pedestrian violations (i.e., jaywalking or crossing during Do-Not-Walk signal phases). The percentage of conflicts with through AVs that involved pedestrian violations was calculated using the semantic map data provided with the datasets to be over 63%. Besides, conflicts involving violations were deemed higher in severity, as shown in Figure 10. The difference in severity between the two groups of conflicts was found to be statistically significant at a 95% confidence level (P-value = 0.007). The high number of conflicts involving pedestrian violations can be attributed to the nature of the streets where the data was collected, most of which were minor urban streets where the subject AV was travelling at low speeds. As a result, many pedestrians would cross in groups, giving them a higher sense of safety and leading to other pedestrians following along once the AV yields, as demonstrated in Figure 11.
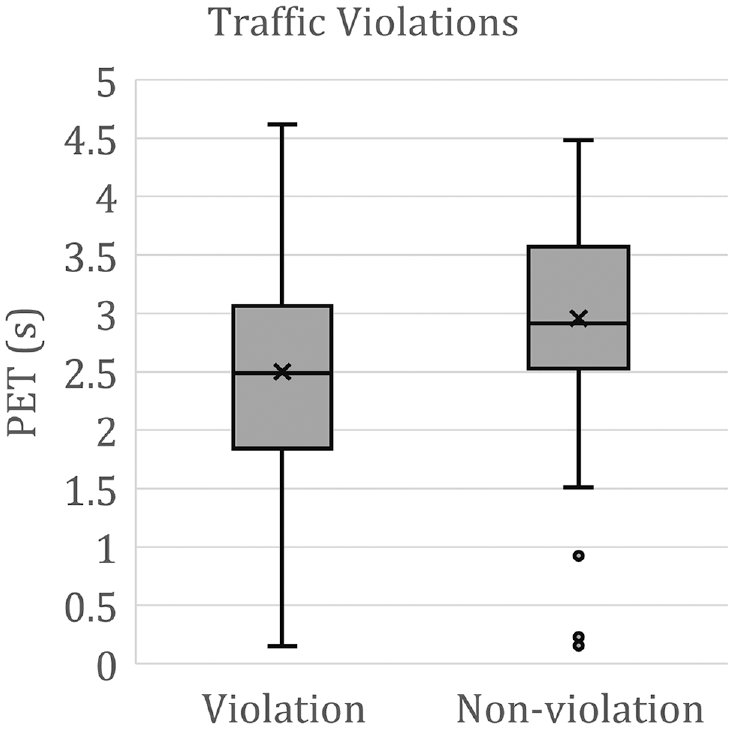
Distribution comparison of through conflicts involving pedestrian violations.
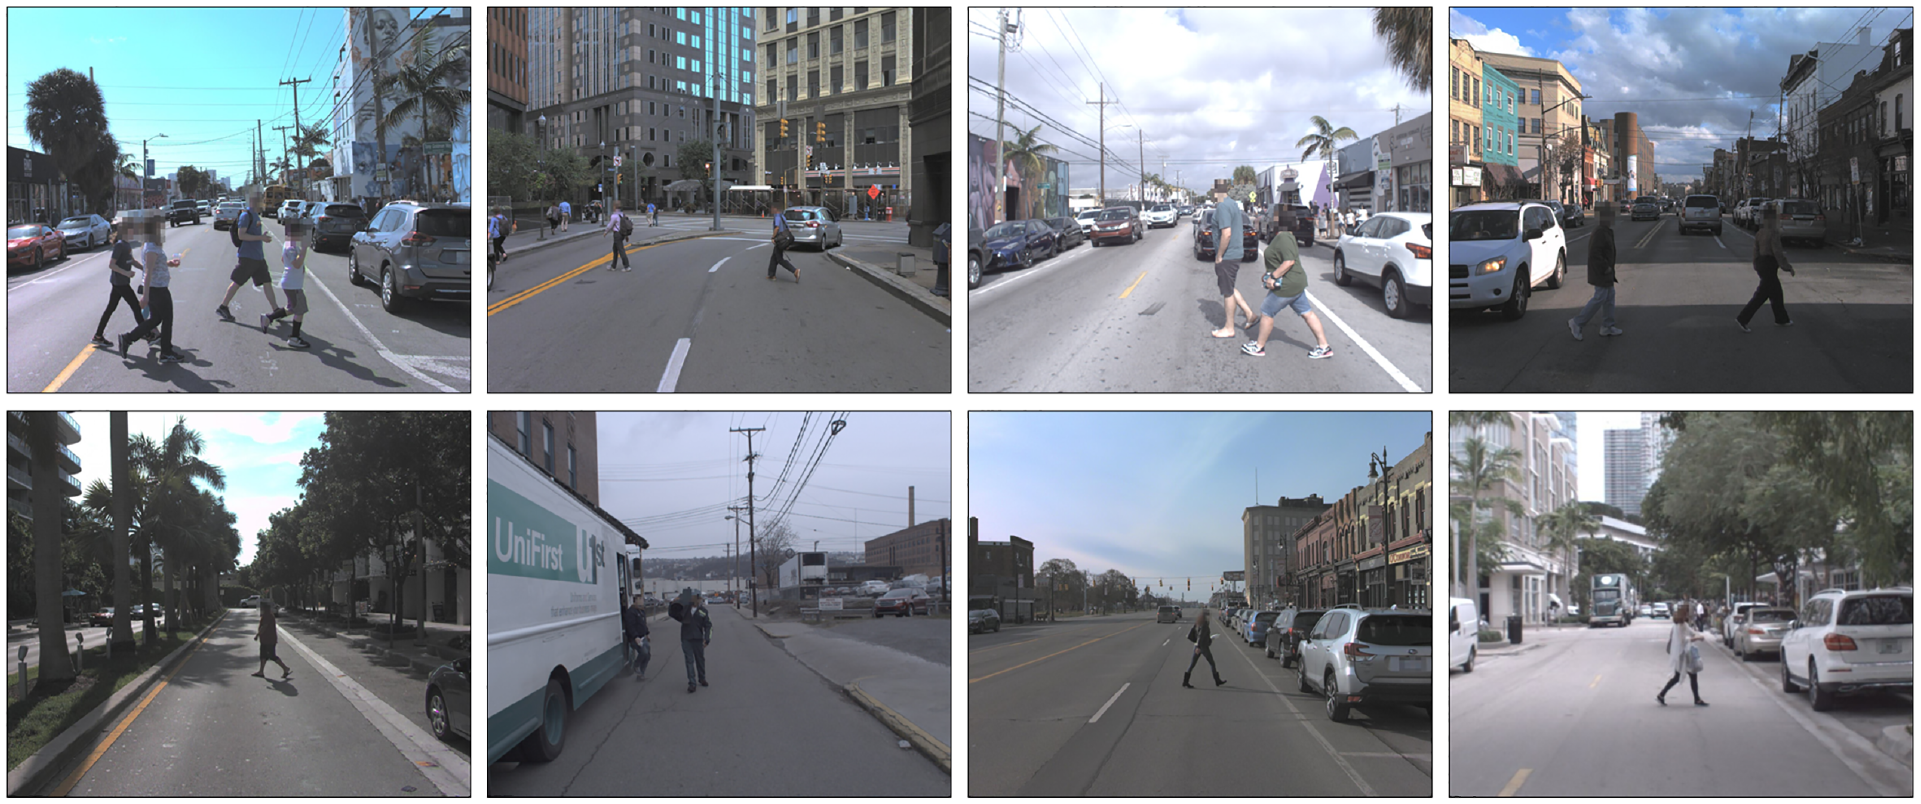
Crossing conflicts involving violating pedestrians.
The relative risk of collisions, shown in Figure 9, indicates that pedestrian conflicts with right-turning AVs are the riskiest conflict type for pedestrians. When these conflicts were further reviewed, some issues related to the AV turning behavior were identified. The example in Figure 12a demonstrates a conflict where the AV detected a pedestrian crossing a red light before initiating its right turn. The AV was still accelerating up to 10 m before the conflict point, only to slow down sharply moments away from the pedestrian. The pedestrian hesitated because of the sharp deceleration, then crossed when the AV stopped. In other instances, the AV demonstrated a slightly irregular deceleration profile before a right turn, leading the pedestrians to run to clear the crosswalk. Specifically, in Figure 12b the pedestrian struggled to interpret the fluctuating speed of the AV, while in Figure 12d the AV decelerated sharply 5 m before the conflict point. In Figure 12c, after reaching a full stop, the AV started to move while a pedestrian was still approaching on the crosswalk. The AV then corrected its action to allow the pedestrian to cross. This inconsistent behavior could be because of late detection or misinterpretation of the scene by the AV as a result of the large number of pedestrians involved. Overall, the observed behavior on right-turning conflicts seem to coincide with the findings of previous studies that reported a high number of rear-end collisions as a result of the AVs’ abrupt stop for pedestrians and cyclists ( 26 ).
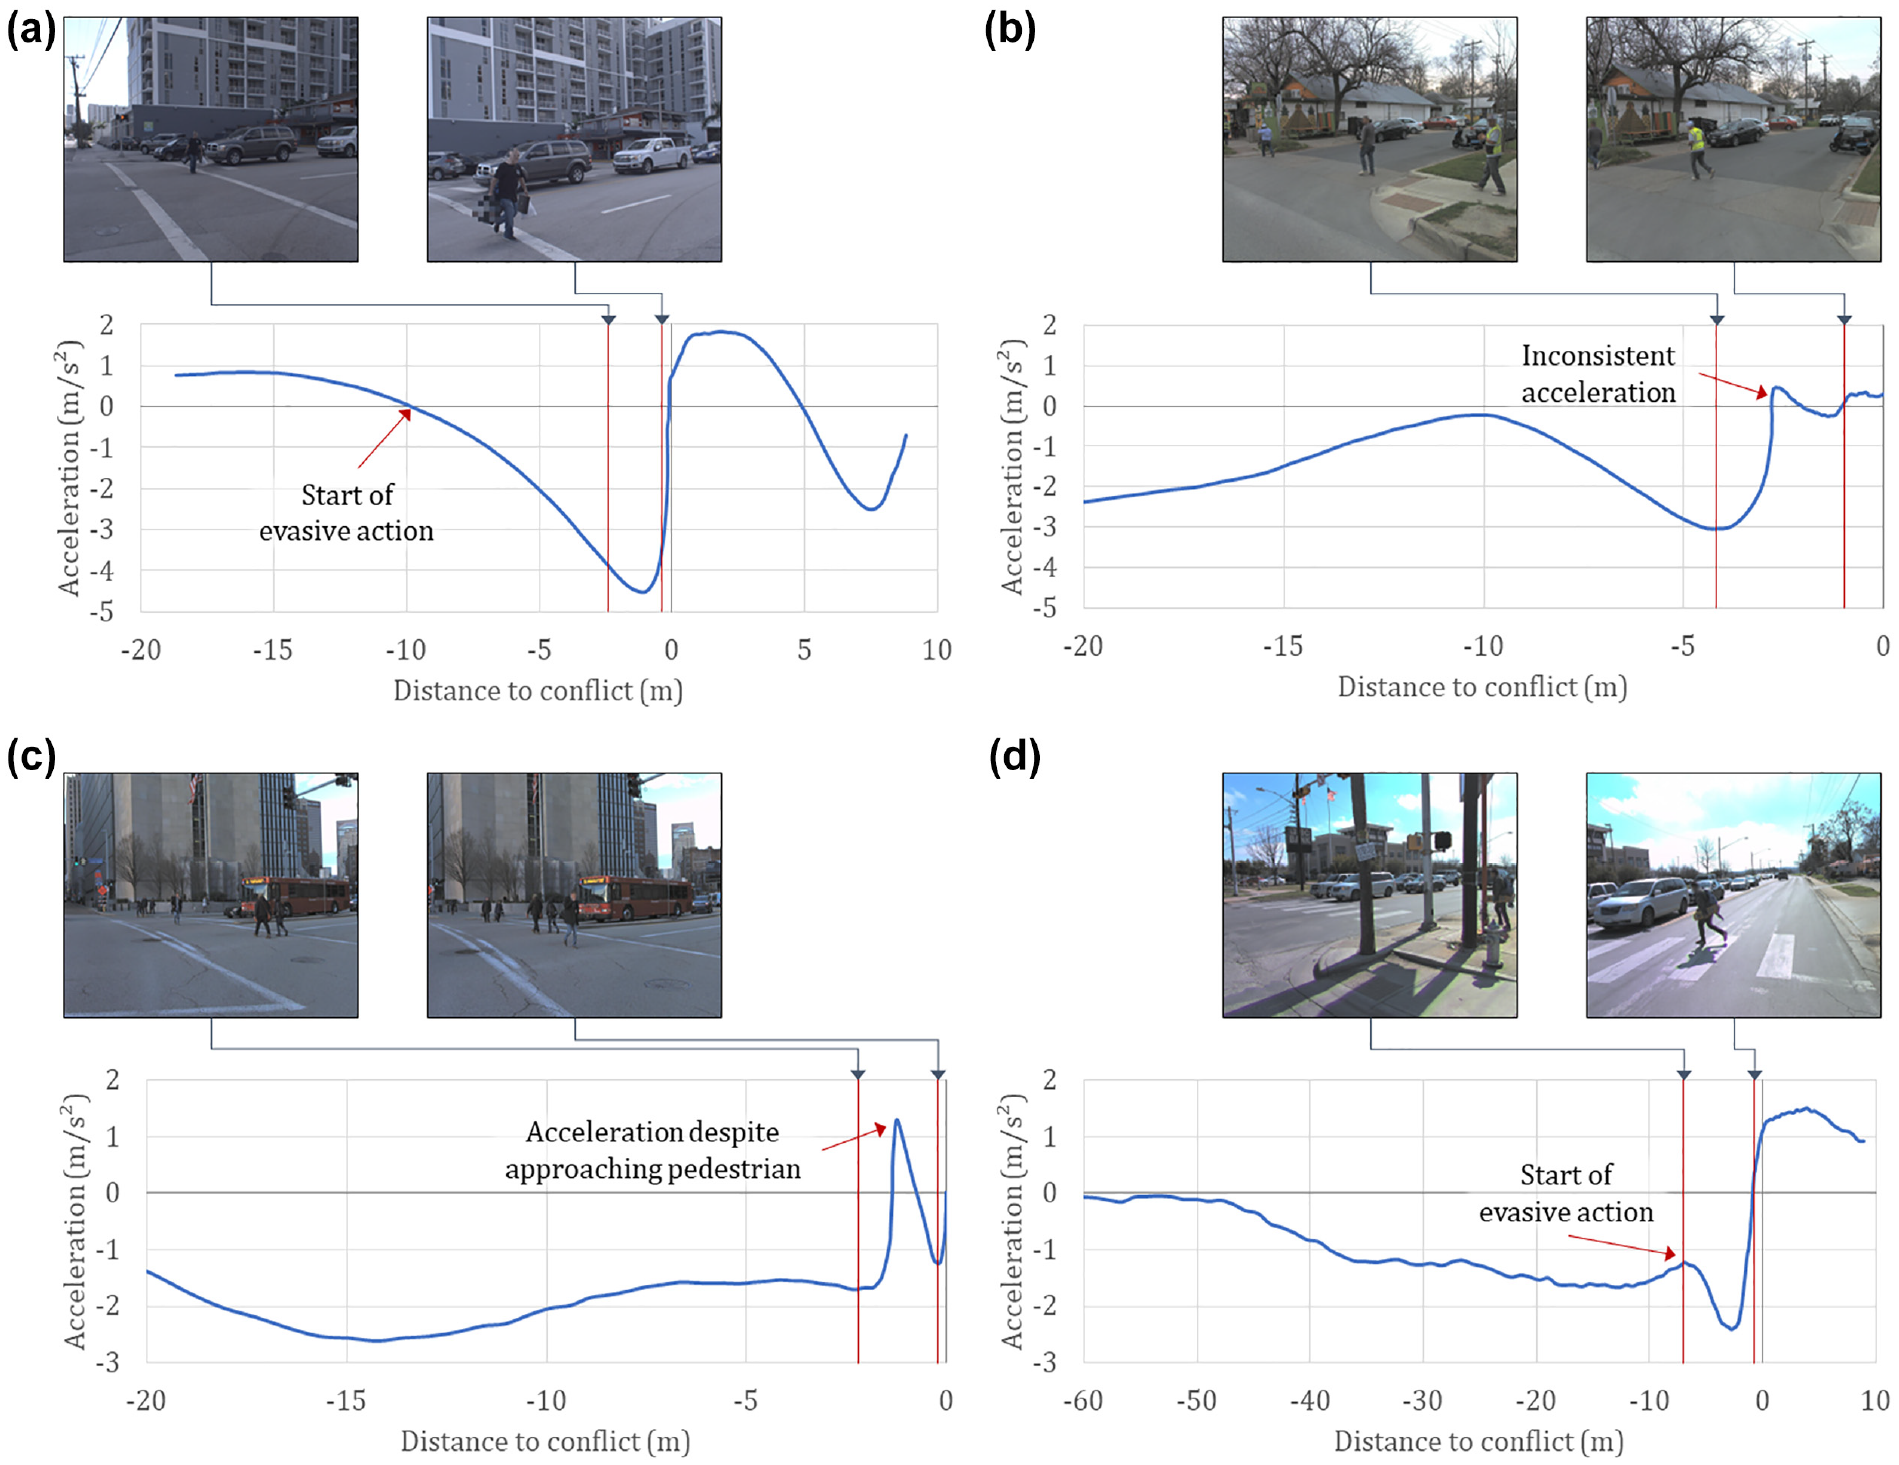
Right-turning conflicts with pedestrians.
Moreover, several AV-pedestrian conflicts clearly showed strange interaction behavior, which necessitates the development of better models to interpret the intention of pedestrians in the future. For example, in Figure 13a, the AV stopped for traffic but did not move for a long time after the road cleared. A group of pedestrians waited to cross and attempted to gesture to the AV and only started to cross after a motorcycle overtook the stopped AV. Figure 13b shows a conflict with a pedestrian getting out of their parked car on the side of the road. The AV seemed to not detect the pedestrian at first or assume their path was out of its lane, as evidenced by the increasing speed till the last second. The AV eventually started to slow down to a near stop after the conflict point.
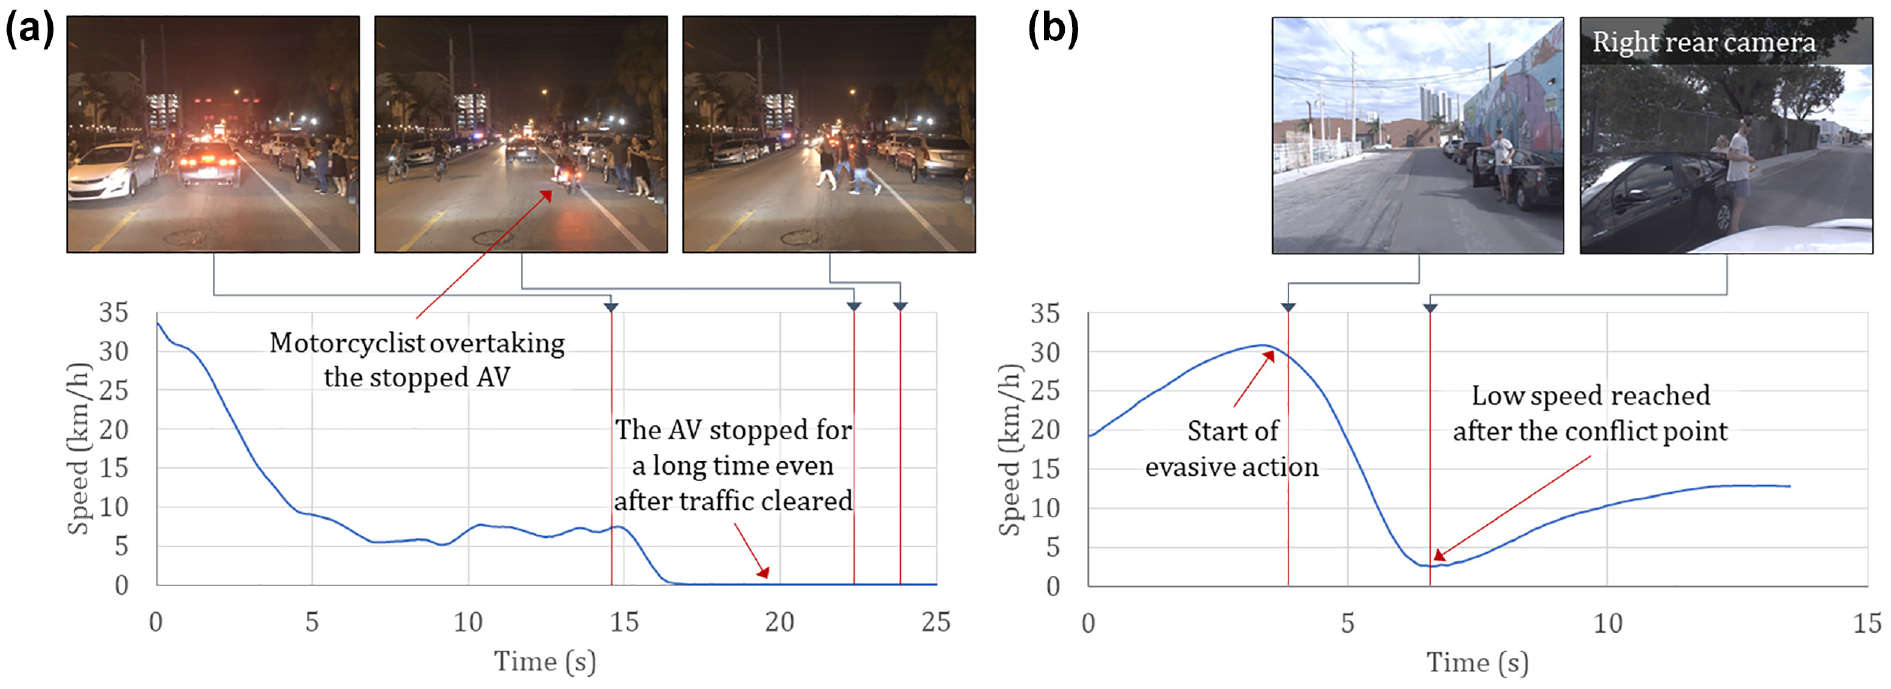
Conflicts with strange interaction behavior.
The relative risk of collisions for cyclists, shown in Figure 9, indicates that the riskiest conflict types are with left-turning AVs. Reviewing the conflicts revealed several issues for both AV and cyclist behaviors. For instance, Figure 14a demonstrates a crossing cyclist that did not yield for the AV despite not having the right of way, forcing the AV to complete its left turn after the cyclist had passed. In more serious conflicts, seen in Figure 14b, while making a left turn, the subject AV encountered a cyclist exiting a residential area and heading toward a bike lane across the street. Despite the AV stopping ahead of the conflict at a stop sign, once it initiated the turn the AV did not slow down for the cyclist. This could be because of the AV incorrectly predicting the path of the cyclist, but the conflict still led to a near-collision when both the AV and cyclist attempted to merge close to each other, forcing the cyclist to slow down and continue their path behind the AV. Figure 14c shows a violation by a cyclist travelling in the opposite direction in the lane of the AV. The AV was passing straight through an intersection but had to reduce its acceleration to avoid hitting the cyclist before the cyclist eventually moved out of the lane.
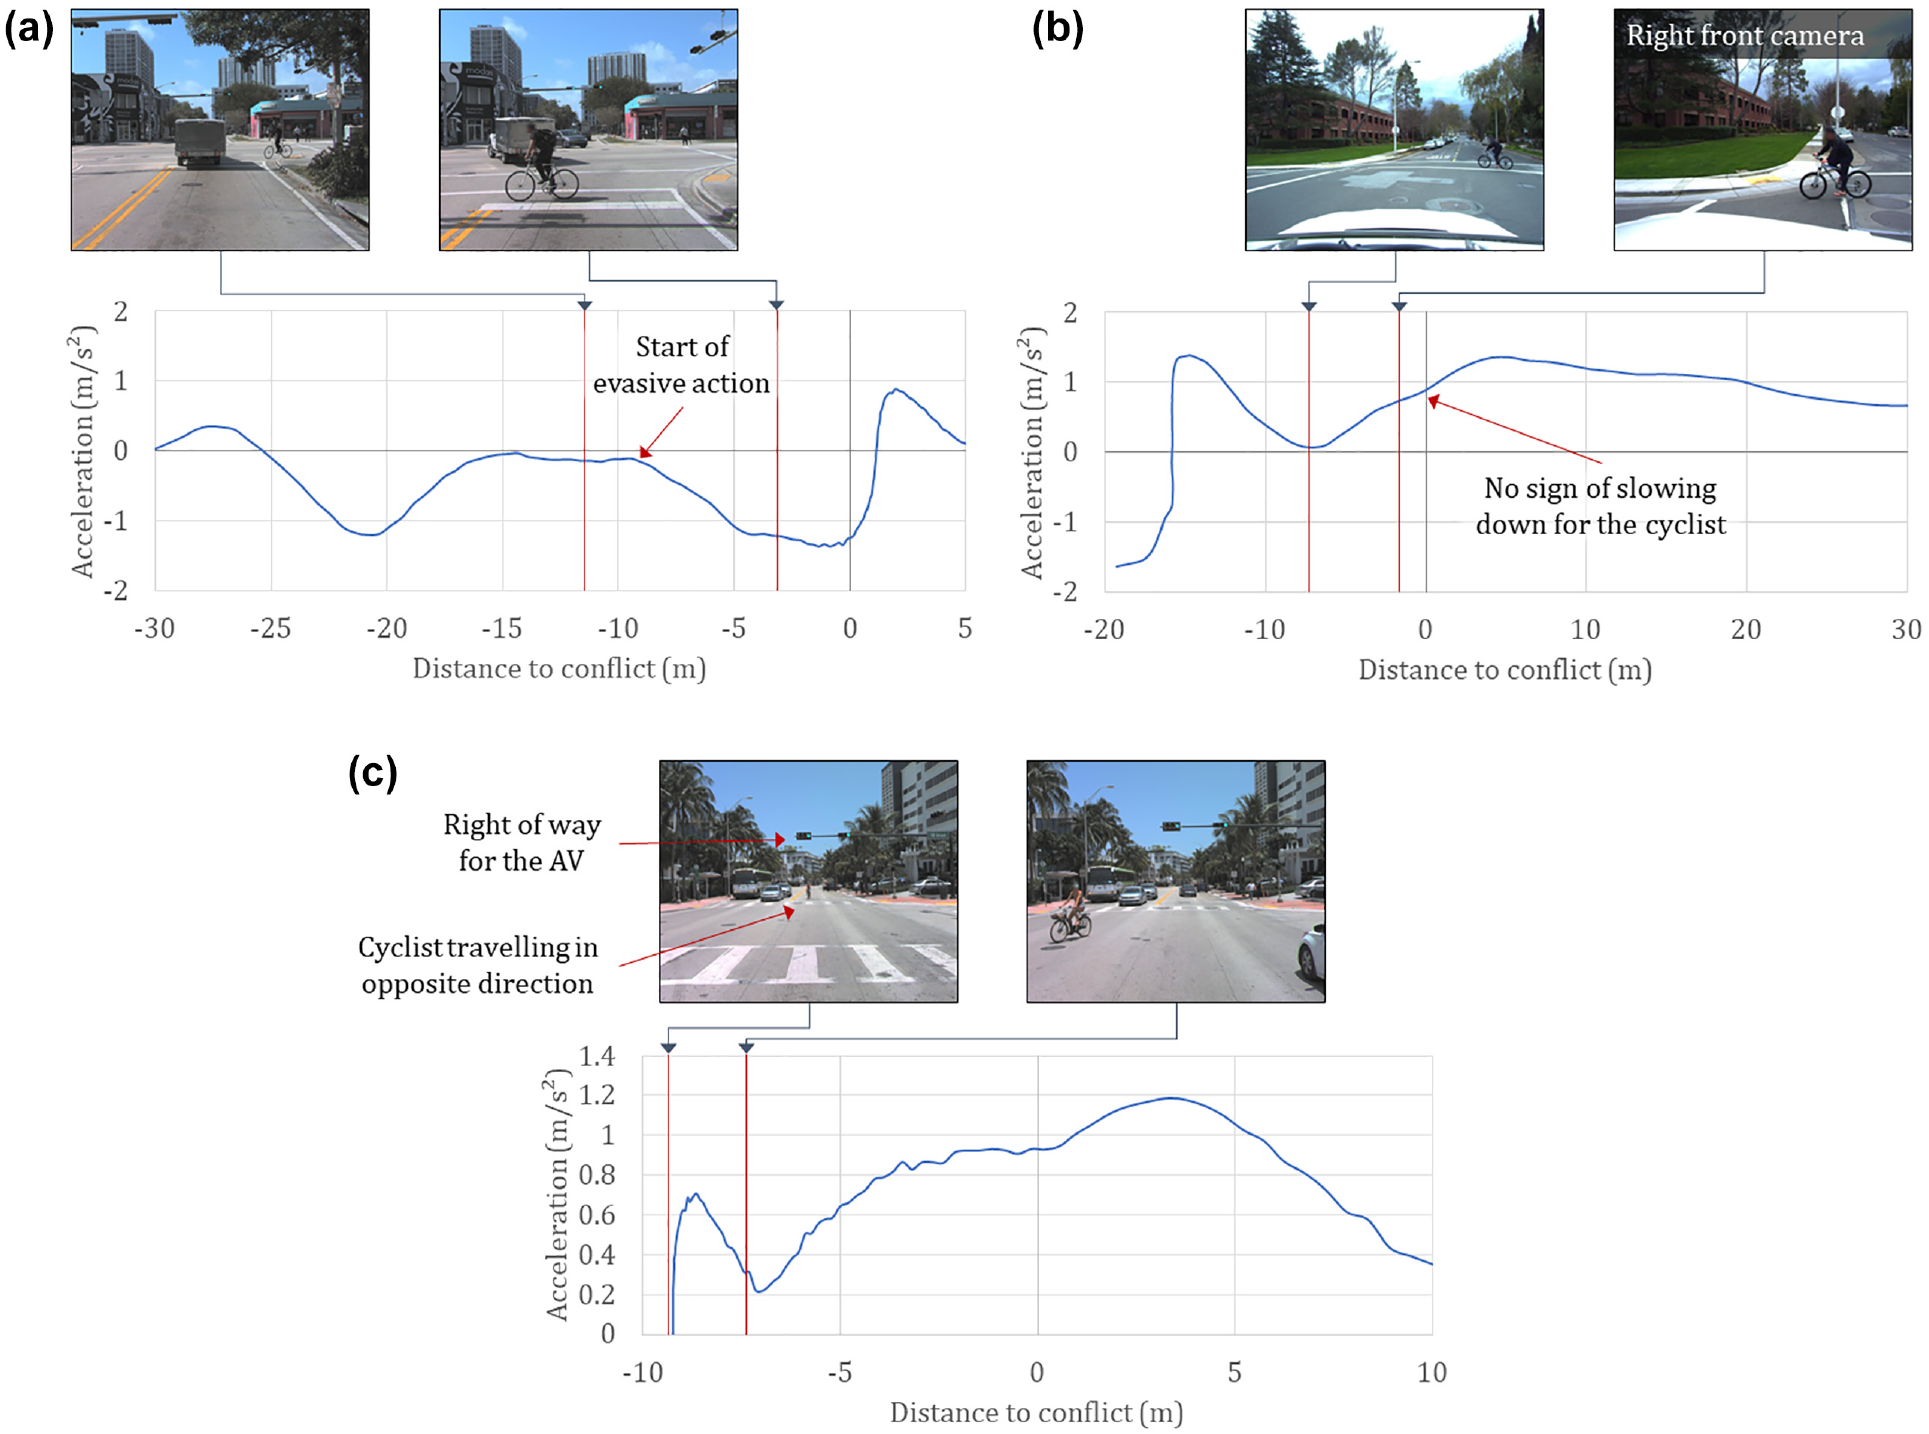
Left-turning conflicts with cyclists.
Conclusion
The aim of this study was to investigate the safety of interactions involving AVs and active road users in urban traffic. This was achieved by processing five sets of AV trajectory and sensor data, totaling over 1,500 h of travel time. Data processing led to identifying 1,689 conflicts involving pedestrians and cyclists. To evaluate road user safety, extreme value theory models were developed for active road users in general. Further analyses were separated by road user type (pedestrians and cyclists) and weather conditions (clear and adverse). The number of predicted AV collisions involving active road users was 2.165 per million VKT. The number of estimated AV–pedestrian collisions was higher than AV–cyclist collisions, but only by 0.216 collisions per million VKT. As for the different weather conditions, no significant differences were observed in conflict severity, which was also translated into a minor difference in the predicted collisions.
The observed pedestrian and cyclist conflicts were categorized based on the movement of the AV into through, left-turning, and right-turning conflicts. Relative collision risk peaked in pedestrian conflicts with right-turning AVs, compared with the other movements. As for the cyclists, the relative risk of collisions was highest on AV left-turns, followed by through and right-turning conflicts. Several issues were identified through the detailed investigation of conflicts, including, for example, the higher tendency for road user violations around the AVs, AV aggressive behavior in many situations, particularly when the AV was interacting with pedestrians while making a right turn, and AVs failing to interpret road user intention in some cases, which led to a high risk to surrounding road users.
The findings of this study point toward several key issues that deserve further consideration before AVs are widely deployed. The task of keeping active road users safe, while tricky in some situations, can be improved by more cautious AV behavior, a better ability to interpret active road user intentions, and a better understanding of the specific risky scenarios. Nevertheless, the study had several limitations, including the lack of demographic data on the observed pedestrians and cyclists like age and gender. Moreover, the subjective evaluation and description of the observed scenes can be susceptible to misinterpretation. As such, future research could benefit from utilizing objective methods to quantify the interactions between AVs and active road users and to understand the causes of observed behavior.
Footnotes
Author Contributions
The authors confirm contribution to the paper as follows: study conception and design: Alozi and Hussein; data collection: Alozi; analysis and interpretation of results: Alozi and Hussein; draft manuscript preparation: Alozi and Hussein. All authors reviewed the results and approved the final version of the manuscript.
Declaration of Conflicting Interest
The author(s) declared no potential conflicts of interest with respect to the research, authorship, and/or publication of this article.
Funding
The author(s) received no financial support for the research, authorship, and/or publication of this article.