
Abstract
Understanding the logistic determinants of freight trips is an important goal in freight transport modeling. Freight shipments move between nodes in the supply chain for different logistic purposes, including production, storage, transshipment, and consumption. A key problem with data availability is that databases generally do not identify these purposes, given the commercial sensitivity of the data. In addition, including information on senders and receivers of the shipments is often prohibitively costly. Therefore, one of the challenges of transport data analysis is to identify freight trip purposes using data fusion, linking information about the main function of logistics nodes to trips in existing databases. This paper proposes a data fusion approach to enrich big truck shipment databases with firm registry data. We use the national freight shipment micro-database from the Netherlands which includes shipment, vehicle, and tour information. Although our presentation here uses formats and methods of accounting for freight data used in the Netherlands, it can be readily replicated for conditions in other countries, as long as similar data sets on shipment data and firm registry are available. The enriched, new database contains transport and firm data for more than 2 million observed trips with information on the vehicle used, shipments carried, and sender/receiver firm. An initial descriptive analysis provides unique empirical insights into the logistic determinants of freight trips. These include the share of national trips that use intermediate nodes, typical changes in shipment sizes, and the role of distribution centers for (de)consolidation of shipments.
Keywords
Freight transportation is made up of multiple movement types depending on the freight agents, goods, and/or logistics nodes involved. While there has been significant research on the analysis of freight trip patterns, understanding the logistic purpose of freight movements has received little attention. To address this challenge, researchers are turning their attention to microscopic disaggregate modeling approaches which include the logistic aspects of freight transport. In these microscopic agent-based systems, freight nodes can be producers, consumers, distribution centers, or multimodal transhipment terminals. Freight movements between these nodes can be broadly classified into direct consumer-related flows (i.e., shipments transported directly from producers to consumers) and indirect distribution-related flows through intermediate nodes. Since distribution centers and wholesale warehouses allow shippers and carriers to (de)consolidate and store shipments to minimize logistics costs, a substantial part of freight is routed via intermediate nodes. Figure 1 conceptualizes the movement types between these logistics nodes. Flows move from producers (P) to consumers (C) via distribution centers (DC) or transhipment terminals (TT), if not routed directly (arrow P–C). An important open challenge for empirical freight transport analysis is to unravel what is now only known as freight trips, into trips by the different purposes sketched here.
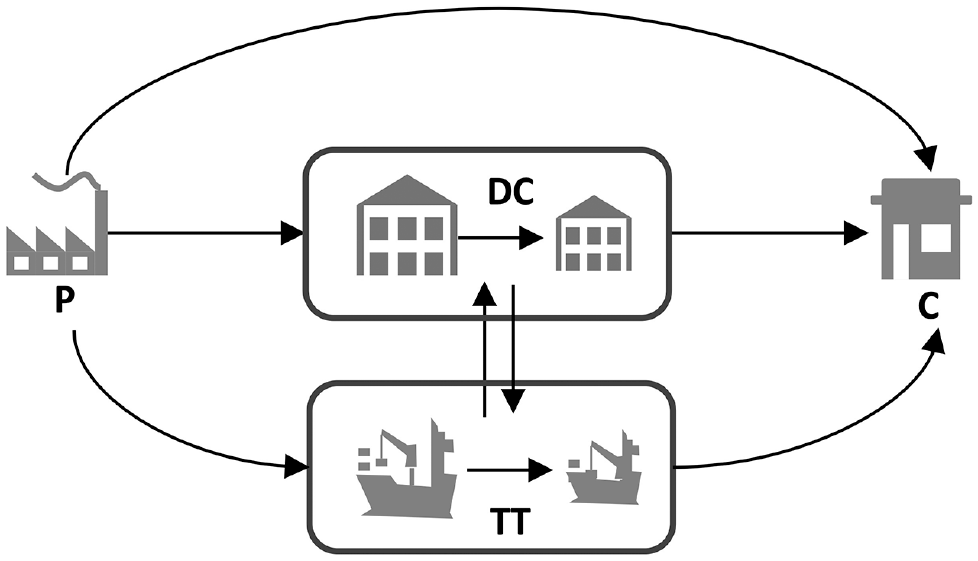
Freight trip purposes in a distribution network.
This type of analysis requires detailed information at the firm level where movement patterns emerge as a result of individual firms’ decisions on logistic operations. Probably the biggest hurdle in the way of microscopic analysis is the absence of microdata reflecting the prohibitive cost of data collection. In this regard, freight studies have been generally slow to adopt innovative data collection schemes and/or use multiple data sources to acquire large microdata sets. A comprehensive review of survey techniques and data used in urban freight studies is given by Allen et al. ( 1 ). Of the data collection methods, survey-based travel diaries (filled out by drivers or dispatchers) offer rich information for behavioral analysis of freight movements. These methods however are expensive, have a low response rate ( 2 ), and are significantly misreported ( 3 ). A better collection scheme is, therefore, to automatically generate data from the transport management systems (TMS) of logistics companies ( 4 ). This approach is currently being pioneered in some countries, including the Netherlands. Data are automatically extracted from TMS with relative ease and at low cost; this allows for efficient collection of truck trip diaries, including shipment, vehicle, and tour information. Even though the data are high in volume and rich in attributes, they still lack explicit information on the sender/receiver of the shipments because of privacy concerns and commercial sensitivity. Such a data set is rather inadequate when differentiating movements of different purposes as defined above. One of the challenges of working with large-scale shipment databases is, therefore, to include missing information in these data sets.
A solution to the missing data problem is to fuse multiple data sets and impute crucial missing information. This interest in applying data fusion in transport engineering and more notably freight data is quite new ( 5 ). Much of the work uses GPS data in combination with other sources ( 4 , 6–9). Also, no study has yet been directed at enriching the microdata set of trips for identifying distribution movements. There is, therefore, a need for new approaches that impute sender/receiver agents’ information into large-scale freight transport databases.
Our contributions to the literature are the following:
Firstly, we present a methodology to enrich freight microdata with firms’ registry databases. Since truck trip data often include information on loading/unloading addresses, it allows imputing the sender/receiver information from a firm’s registry database at similar geographic detail. Using different algorithms of varying degrees of certainty, we identify the sender/receiver information of individual shipments in a tractable way. To demonstrate our approach, we use the national freight shipment micro-database from the Netherlands. We acknowledge that the proposed data fusion approach depends on the data structure and the method of accounting for freight data in the Netherlands. Nonetheless, we argue that it is readily extendible to conditions where similar data exist on shipments and firm registries.
Secondly, we generate unique empirical knowledge and descriptive insights into the use of intermediate logistic facilities by carriers of goods. An important implication of the research is that the database provides new opportunities to further develop shipment-based and agent-based freight transport models.
The paper is built up as follows. We review the relevant literature on freight data and data enriching techniques. We then describe the characteristics of data sets that the approach builds on, before presenting the methodology for the data enrichment process. We follow up with the empirical analysis of the data and provide insights about different trip purposes. Here we also take account of different commodity groups. Finally, we draw conclusions and highlight opportunities for further research.
Literature Review
Data fusion is a collection of techniques by which information from multiple sources is combined to reach a better inference. Tasks that demand any type of parameter estimation from multiple sources can benefit from the use of data/information fusion methods ( 10 ). Artificial intelligence, pattern recognition, statistical estimation, machine learning, and other areas laid the foundation for the development of different data fusion techniques in transport systems.
These fusion techniques have seen limited use in freight studies. For example, You et al. ( 6 ) proposed the Future Mobility Sensing (FMS) digital survey of driver activity and integrated the information with the GPS data for Singapore. The GPS data were then enriched with smartphone data using machine learning that is assisted by a driver verification process. They later made inferences on tour characteristics of shipments in Singapore using the enriched data. Alho et al. ( 7 ) paired GPS traces and stop activity surveys in Singapore to describe the stop location and parking characteristics of freight trucks. Zhao et al. ( 11 ) and Eluru et al. ( 8 ) used a data fusion approach to integrate the US Commodity Flow Survey with multiple data sets. They used a joint econometric model framework grounded in the maximum likelihood approach to estimate country-level commodity flows. You and Ritchie ( 12 ) also developed a framework to process GPS data to interpret clean drayage truck tour behavior. Research from Zhu et al. ( 13 ) presented the development of a data fusion method to impute variables of interest for large GPS data sets by establishing a link to a behaviorally rich commercial travel survey data set. They fused three data sets to take advantage of having a large sample size and rich information from roadside interviews. None of the above techniques/methods, aim to identify freight trip purpose in the sense of position in the distribution chain, as illustrated in Figure 1, in relation to other trip characteristics.
Previous studies that include big data at the shipment level are limited. In the United States, the US Commodity Flow Survey (CFS) was used to characterize shipments based on modes and destinations ( 14 ) or to characterize the transport chain of shipments ( 15 ). Here, the focus was on shipment size and mode choice, disregarding different types of node. The Swedish CFS was also used to characterize transport chains from an intermodal chain perspective ( 16 ), however without differentiating between types of intermediate nodes. Sakai et al. ( 17 ) used large disaggregate shipment data of the Tokyo Metropolitan Area to generate statistics on intermediate logistic facilities. Here, the data lack detailed location features. To the best of our knowledge, big empirical data has not been used to differentiate between shipments that use direct and indirect channels explicitly. Available big data concern either truck diaries or commodity flow surveys, and do not specifically include the type of logistics node involved in the movement of the shipment.
Although data fusion from multiple sources sheds light on freight transport, it usually requires many assumptions to support linking databases. Alho et al. ( 7 ) cautioned that the results of big data analysis are highly dependent on the data type and the associated assumptions made, underling the importance of carefully selecting and disclosing the methods for data processing. In this paper, we contribute to this field of research by making specific and explicit descriptions of the big data fusion process that we translated into a data matching scheme for automated truck shipment data collection in the Netherlands. Our method uses the structure of the data to make as few assumptions as possible. We also mark the imputed data with a certainty indicator that clearly explains which part of the data is filled with higher certainty (i.e., no assumption) and which part has a lower level of certainty (i.e., probabilistic assumptions).
Data
The Shipments Database
We define shipments to be consignments that are transported from a producer to either a consumer or an intermediate logistics node, or from intermediate logistics node to a consuming agent. They are transported in a single vehicle individually or with other consignments. We have access to the microdata of these transported shipments collected by Statistics Netherlands (known as CBS). This is a set of data collected at three levels (tours, trips, and shipments) for Rijkswaterstaat (the Dutch Road and Waterways Authority, or officially the Directorate-General for Public Works and Water Management) which uses it to develop freight models and evaluate related policies (for more detail see De Bok and Tavasszy ( 18 )). Companies are obliged to report on their shipments per vehicle which allows high volumes of data with high density. CBS keeps track of shipments carried by trucks with a capacity of at least 3.5 metric tons. Thus, their target population is all road transportation done by Dutch companies. Companies share a week of transported shipments data for their vehicles. The unit of analysis is, therefore, vehicle-weeks for trucks with a loading capacity of at least 3.5 metric tons. However, the shipments are not complete per company, since the data extraction is done for a sample of all registered Heavy Goods Vehicles (truck) vehicles in the Netherlands.
The chance of drawing a vehicle depends on company size, vehicle age, vehicle capacity, and vehicle type. Each vehicle from the sample group is assigned to a specific week in which all transported shipments and tours are to be reported. The requested data include origin/destination location of shipments, type of commodity of transported goods, and their weight among more than 80 other features. In total, 0.7% of yearly total vehicle movements in the Netherlands are recorded in the shipment data. Since reporting is mandatory and CBS keeps reminding respondents, the response rate is very high.
Reporting of the data can be done through three survey tools: paper, internet, and structured XML format. The latter data set is the source for our study where denser and higher quality is achieved by automatic input. Responses come from companies in three categories: only requested vehicles, all vehicles for the requested week, and all vehicles for the entire year. We have made no distinction in the data with regard to this category. We also point to the limitation in the data where most of it comes from larger companies that have the set-up to include an automated XML reporting system (and the willingness). It is wise to note that these companies have an advanced and efficient transport system that would be of interest to see in the data. But it means our analysis can only draw conclusions about large road haulage companies that have invested in optimizing logistic processes.
In total, CBS extracted 2.65 million shipment data from the year 2013 to 2015 which contains rich information with regard to loading, unloading locations, commodities carried, and vehicles used. The database has been used in previous agent-based urban freight models ( 18 , 19 ). A particular interest for this study is the geographic detail of loading and unloading points of the shipments given as either a six-digit postal code, four-digit postal code, or international destinations. However, the database lacks the sender/receiver firm of each shipment and whether each shipment went directly from producers to consumers or went through an intermediate firm. About a million records have registered six-digit loading/unloading locations and another million have four-digit registrations allowing for matching the shipments to registered freight agents in those geographic zones.
The most important feature of our data fusion process is the detailed location attributes of the shipments. We use this feature along with firms registered at that specific location to draw a match between the sender/receiver agent.
Firm Databases
As shown in Figure 1, in this study, we consider producers, consumers, distribution centers, and transshipment terminals as freight agents. The firm registry database for each of these agent populations is available separately. For our analysis, we are primarily interested in differentiating shipment flows along direct and indirect paths. Direct paths are the ones that go from producer to consumer while the indirect shipments make use of intermediate facilities such as DCs, warehouses, or transshipment terminals.
Production/Consumption Business Units
The firm registration data are collectively known as the ABR database in the Netherlands. This contains all registered companies in the country and contained over 1.9 million registered local business units in 2015 (CBS 2017b). The database gives the sector codes (SBI), employment size, and six-digit postal code addresses of registered firms. This database is used as the main source for identifying producers and consumers of freight. For our analysis, we group business units into sectors based on the SBI identifier. Fifteen aggregate sectors are identified: agriculture, manufacturing-food, manufacturing-nonfood, retail, horeca, chemicals, minerals, raw materials, construction, utility, waste management, auto and heavy machinery, wholesale, and storage. We classify all other business firms that do not belong in these categories as “others.” We have filtered out business units that only employ one person as these are assumed to be not the generators of freight.
Intermediate Logistic Nodes
The Netherlands is a hub for freight distribution in Europe. The variety of these intermediate locations makes it important to differentiate them into categories. For our study, we have classified the intermediate nodes into two categories; distribution centers (i.e., wholesale and storage/cross-docking centers) and transshipment/port-related facilities. The distribution center database comes from Rijkswaterstaat and, as of 2015, contains over 1,600 registered distribution centers along with their six-digit address, size, and sectors. The database for transshipment terminals and ports contains 54 transshipment terminals in the Netherlands. The registered location of the terminals is given in six-digit postal codes. However, the geographic coverage of transshipment terminals extends beyond the registered address. For this reason, we modify the border of the transshipment terminal zones to cover larger areas using neighborhood codes and Google Maps image processing.
Spatial Data
This section describes the geographic zoning used. For our study, we use a very dense geographic zoning of the Netherlands at six digits. The country is divided into more than 400,000 of these zones. As the origin and destination of the shipments are registered at either six-digit or four-digit levels, we also use the latter classification, which divides the country into more than 4,000 zones.
Methods
In this section, we explain the required three steps and methods used to explore freight trip databases and firm registries. As is demonstrated in Figure 2, the first step is the data acquisition and preprocessing and explains the initial preprocessing needed to make this data ready for further analysis. The second step is to combine the shipment database with the firm registry. Finally, we explore the enriched data. We elaborate on these steps further in the next paragraphs.
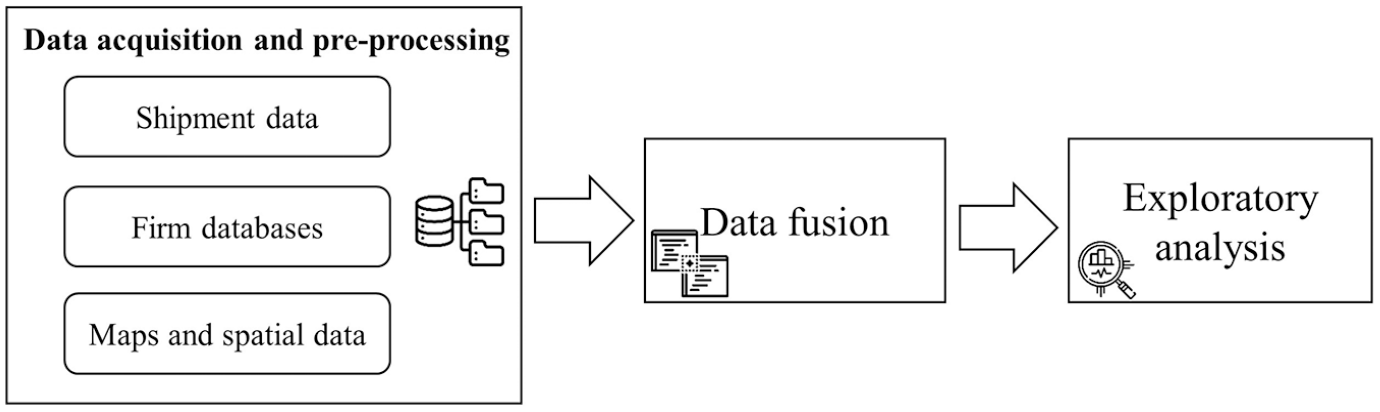
Steps in the data fusion and analysis.
We start the data fusion scheme with preprocessing of the truck shipment database. Tasks in this step include importing and reading the data set, cleaning false data, and spatial refinement of the loading and unloading nodes to bring them into a standard six-digit or four-digit format. On the other hand, the firm registry databases of transshipment terminals, distribution centers, and freight producing/consuming firms are fed into the “Freight Agent Fuser” module that combines and generates a unified “Freight Firms” database. Using the industry sector code (SBI) of the firms, the module reduces the firm registry database into freight generating and attracting firms. The fused Freight Firms database includes over 55 transshipment terminals, over 1,600 distribution centers (sub-categorized into wholesale, storage, and freight transport nodes), and over 323,000 producers, consumers, or both. We classify these firms into four categories based on their logistic functions: producers, consumers, distribution centers, and transshipment terminals. Note that the producers and consumers categories are not mutually exclusive; a firm can be a producer or a consumer. As an example, a manufacturing factory can be a consumer of raw materials and a producer of finished/semi-finished products. Within the shipment database, we distinguish between these functions by considering the loading/unloading zones of the shipments. If a firm is located at the loading end of a shipment, we assume that the firm takes the role of the producer. Similarly, firms located at the unloading end take the role of consumer. We denote
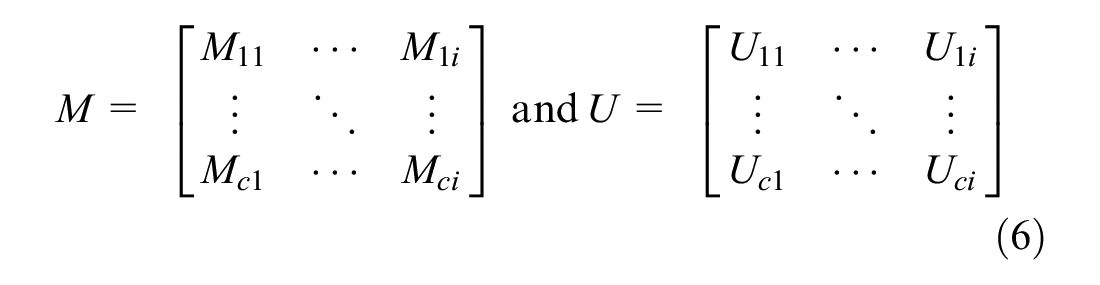
Next, we aggregate the total number of each firm category at each geographic zones in the spatial data. For this, we use the unified Freight Firms database. The database gives the total number of each type of firm available at every six-digit postal code in the spatial data. We denote the set of geographic postal zones by
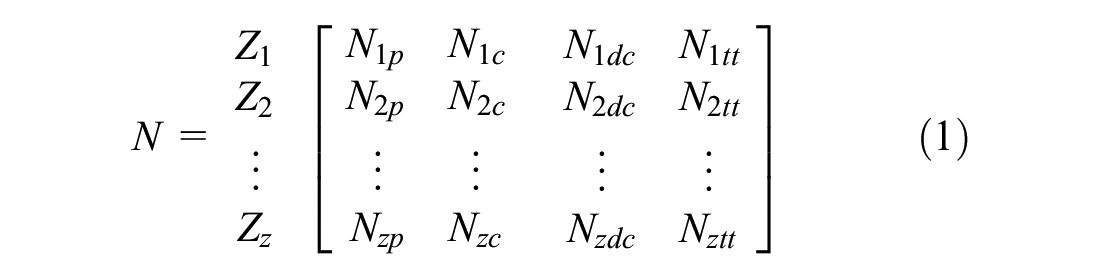
where
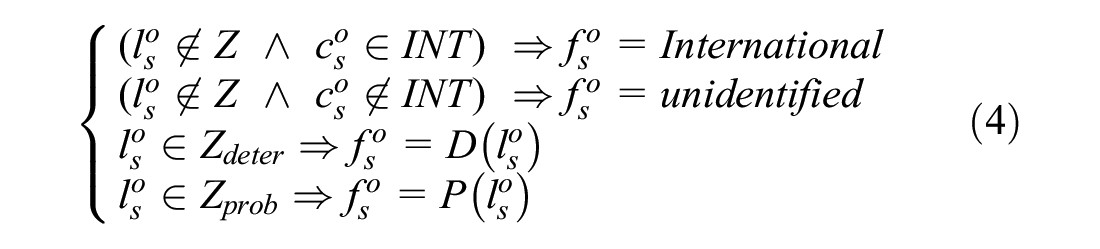
Next, spatial data are parsed into two categories. The first category of postal codes hosts a single type of freight firm while the second category hosts multiple types of freight firms within them. When a geographic zone has a single firm category, we call it a deterministic node. Otherwise, it is a probabilistic node. Here, the main objective is to classify the spatial data into either deterministic or probabilistic zones. It follows that if a zone where the shipment is generated/attracted only hosts a single type of firm, the sender/receiver of the shipment will be the same type of firm. As an example, if in zone

From the probabilities of firms, we then classify the spatial zones set

Note that the number of zones in the spatial data is quite large. However, not every zone is an origin or a destination of shipments. Since we are only interested in the zones that generated/attracted shipments, we can reduce the computational cost by only selecting zones that generated or attracted shipments in the truck shipment database. We, therefore, made a list of unique geographic zones out of the truck shipment data. If a geographic zone is in the list, then the location is classified. Otherwise, it is not.
Once the spatial nodes are grouped into two categories, we now turn into the main phase where we determine the sender/receiver firm of each shipment. Let
The deterministic algorithm is an algorithm that imputes the firm types

The probabilistic assignment procedure is used when there exist multiple firms with different logistic functions at a specific location. The probabilistic algorithm uses the commodity type of the shipment
Let
where
At the same time, we now have an updated aggregation of firms by the new industry classification. The matrix for the total number of firms is then updated to reflect the industry classifications.

where

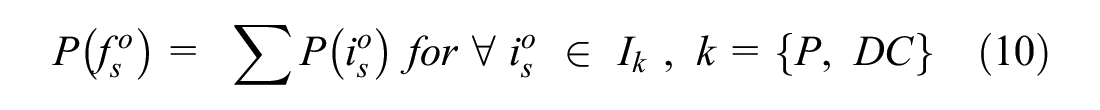
However, since we have additional information on the commodity type of the shipment and the associated make/use probabilities, we update this probability by considering the associated make/use probabilities. Note that if the commodity type is unknown, all the industry sectors get an equal chance. The assignment will, therefore, be based solely on the total number of firms in each sector as shown in Equation 9

where
For our study, we are interested in the logistic function of the sender/receiver firms. Recalling that we classified the industry sector set
Finally, given the loading/unloading location data and the commodity type of shipment, a random firm type is assigned to its potential sender/receiver based on the probabilities generated from its respective algorithm. For this, we use the random generator functionalities of the Python program.
We consider Shannon entropy (Equation 11), adopted from information theory, to indicate uncertainty in the probabilistic assignment. This will help the user of data to select a sample from data based on a predefined uncertainty level. Since,

When one of the discrete values of
Note also that if there is a mix of freight agents with transshipment terminals, the shipment sender/receiver is directly assigned to the transshipment terminal or port-related activities. We make this assumption with the idea that distribution centers located near transshipment terminals primarily serve transshipment services to switch between transport modes. Therefore, our assignment algorithms will strongly discriminate between intermediate logistics nodes and producers/consumers of goods. Importantly, we also correct for tours within the truck shipment database, that is, we make sure to assign the shipments part of a tour to the same type of sender/receiver. Finally, the assignment is also corrected for carriers of the shipments (3PLs); where the “tour origin,”“shipment origin,” and “firm address” in the shipment database are found to be identical, the sender/receiver of the shipment is assigned to a distribution center. The overall process is summarized in the flow chart shown in Figure 3.
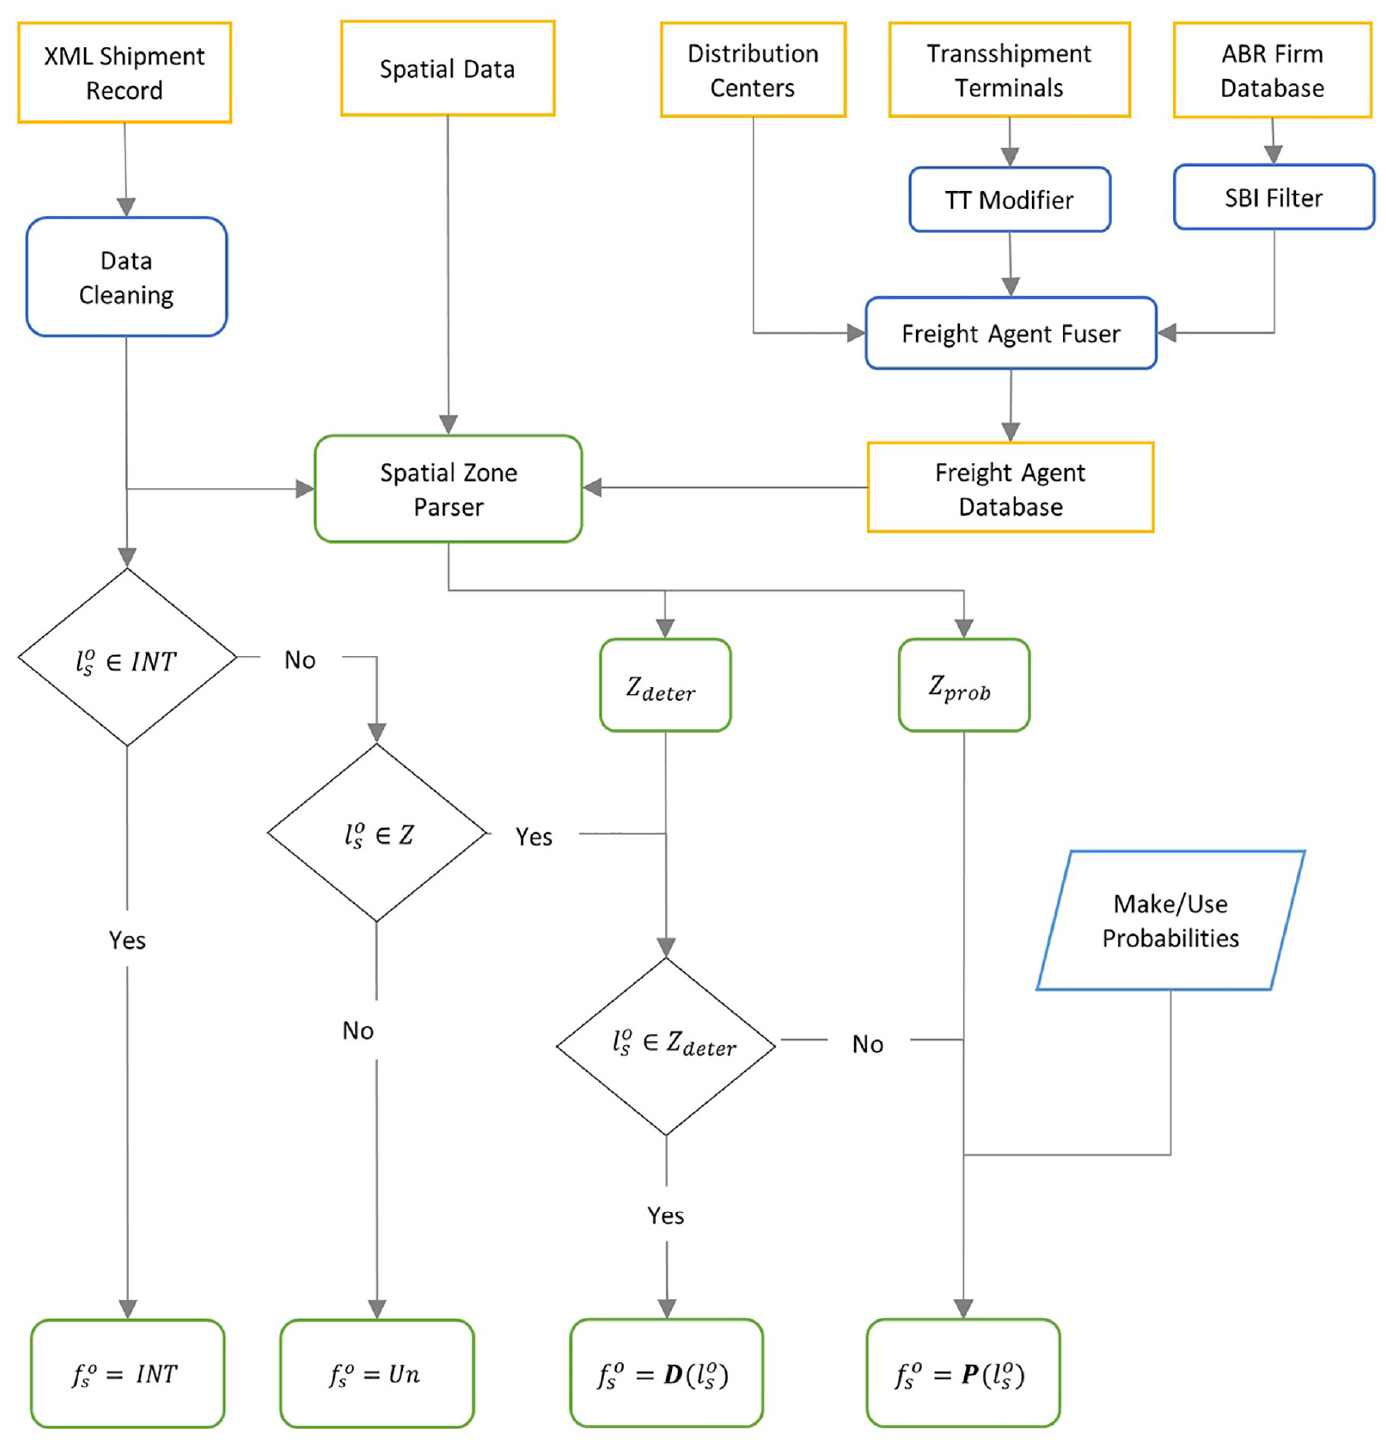
Flow chart for fusing truck shipments database and firms’ registry.
Below we describe the results of the imputation process using the different schemes. Figure 4 shows the proportions of shipments’ sender/receiver firms imputed by the different assignment procedures. Figure 5 shows that a similar result is obtained by both the probabilistic and deterministic approaches.
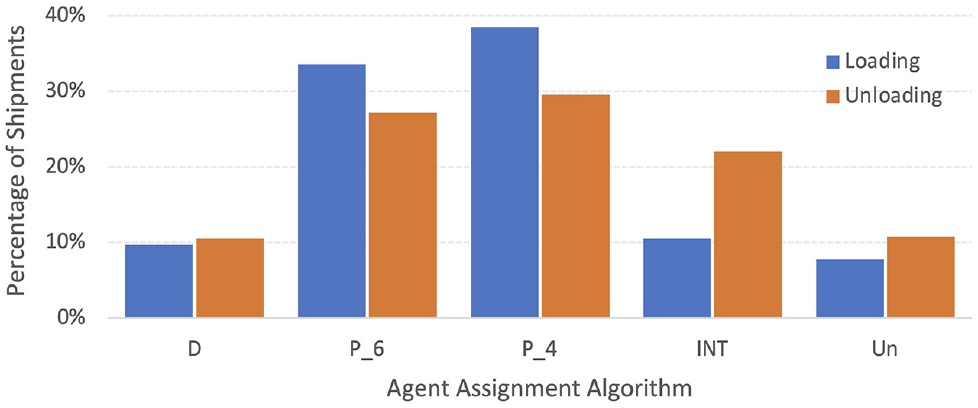
Proportion of loading and unloading locations identified by different assignment schemes.
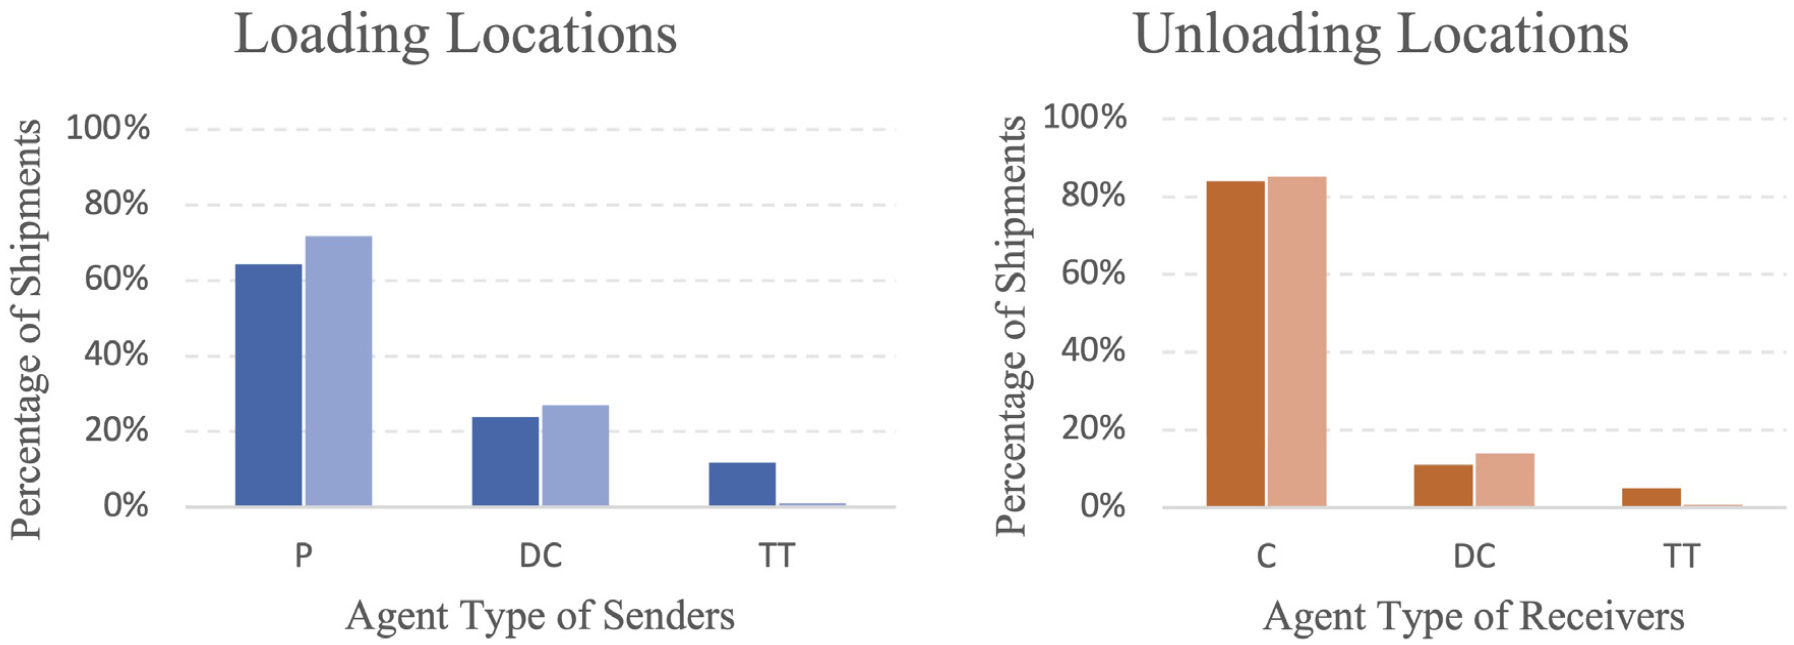
Proportion of freight agents assigned at loading and unloading nodes by deterministic (dark) and probabilistic (light) assignment schemes.
Figure 4 indicates that our algorithm can assign up to 10% loading/unloading locations within the Netherlands using a deterministic assignment at 100% certainty. Approximately 70% of loading/unloading locations are assigned using the probabilistic assignment with varying degrees of certainty. This illustrates the difficulty of making a deterministic match between observed stops and loading locations, and thus the need to implement additional probabilistic matching schemes. Another 20% of locations are assigned to international origin/destination with 100% certainty. Only 10% of the records could not be unidentified with our scheme. The main reason is that the location record is non-existent (a false record) or there exists no registered firm in the firm repository at the loading/unloading location. Similar results for unidentifiable shipment locations in an automated data collection were found in Alho et al. ( 7 ). Figure 5 offers reassurance that our probabilistic assignment follows a similar pattern to our deterministic approach where the assignment is 100% precise.
In the following, we proceed with an empirical analysis of the combined database.
Empirical Results
Here we are primarily interested to see how shipments are distributed according to the different trip purposes as shown in Figure 1, and how this differs across commodities. We discuss these questions in two respective subsections.
Freight Trip Purpose
As explained above, the characteristics of the databases used mean that the overview here is limited to shipments transported within the Netherlands, excluding all import and export shipments. This represented approximately 1.8 million shipments which account for 69% of the total shipments. Table 1 presents the share of shipments for the different logistics segments and the mean values for the flow characteristics measured: shipment size, number of shipments per trip, and trip distance. Figure 6 and Figure 7 show the distribution of these values with box plots, again for the different segments.
Characterization of Shipments Within the Netherlands by Purpose
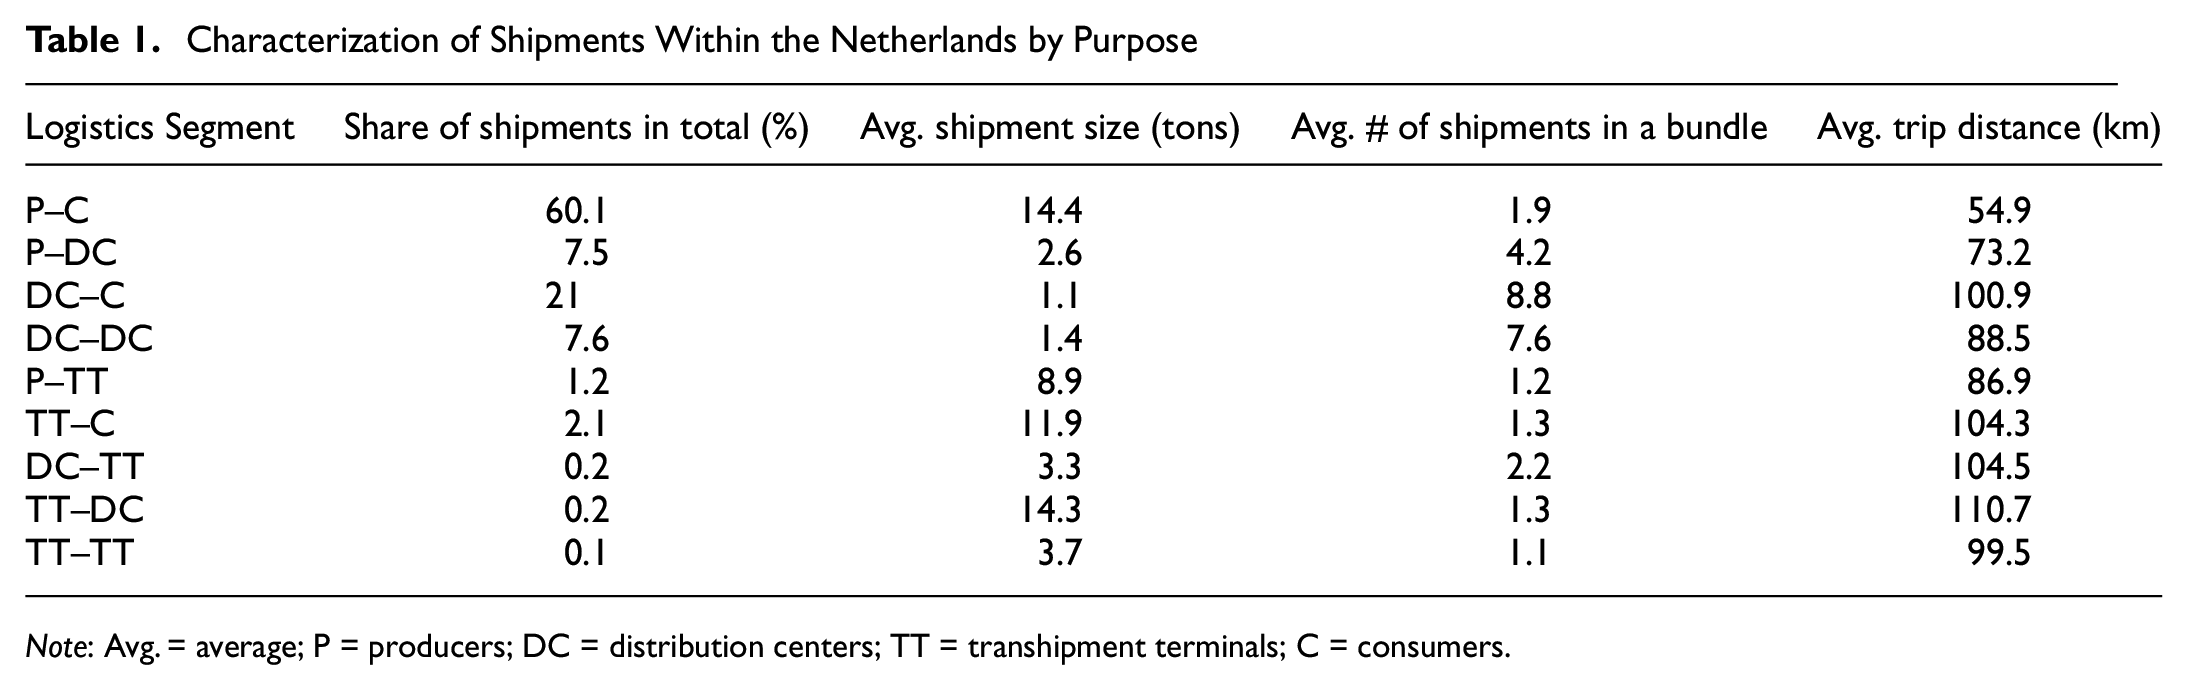
Note: Avg. = average; P = producers; DC = distribution centers; TT = transhipment terminals; C = consumers.
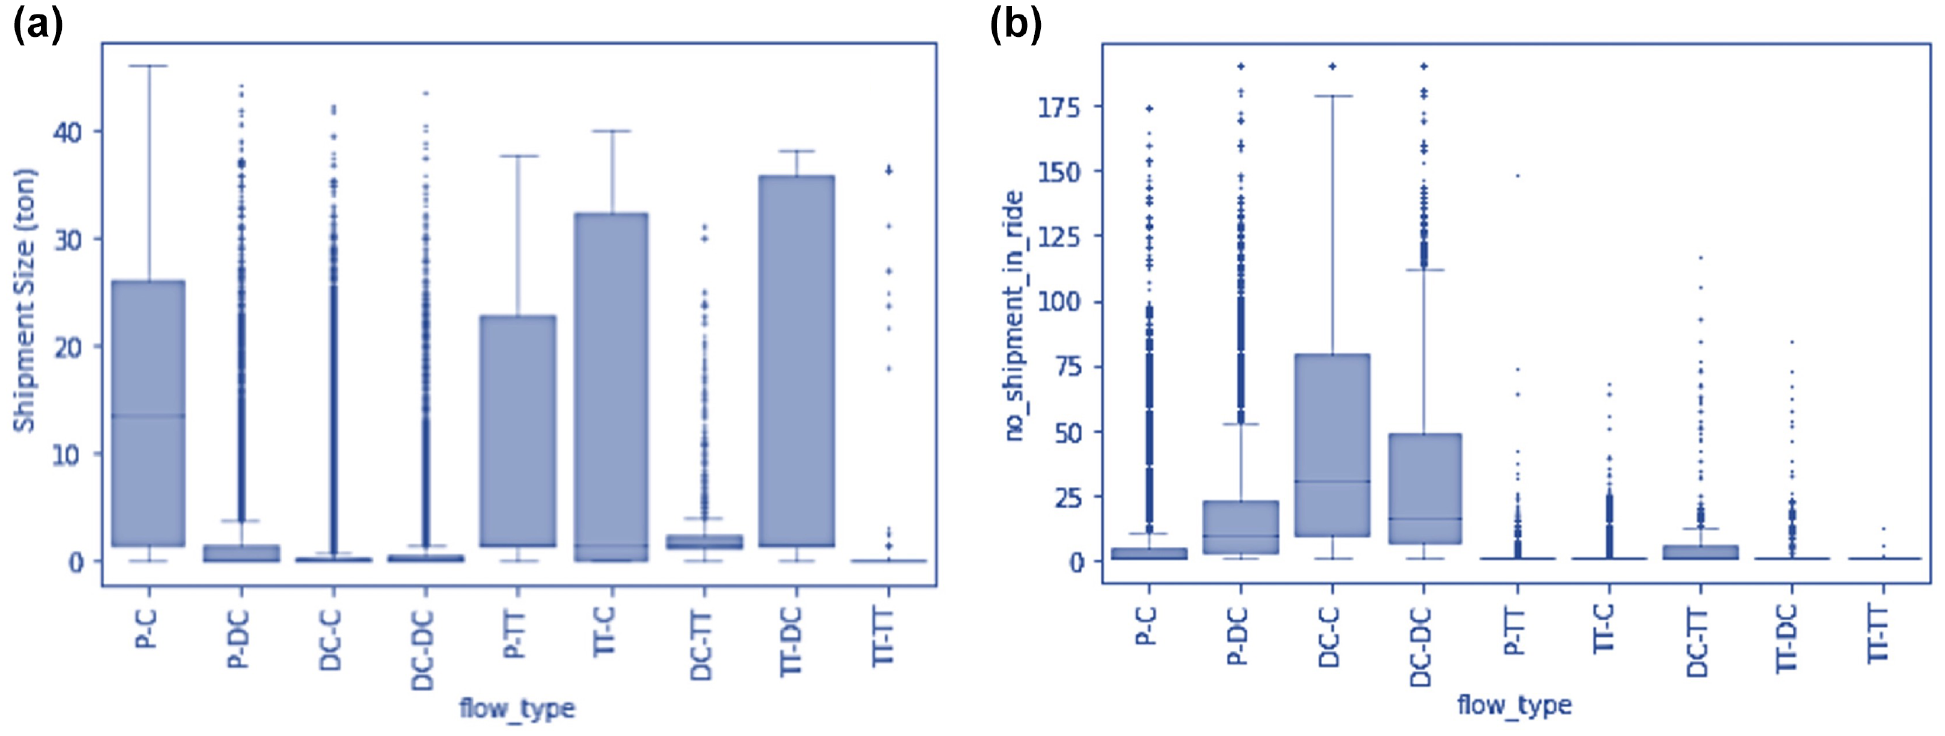
(a) Shipment size distribution by flow type; and (b) number of shipments in a bundle by flow type.
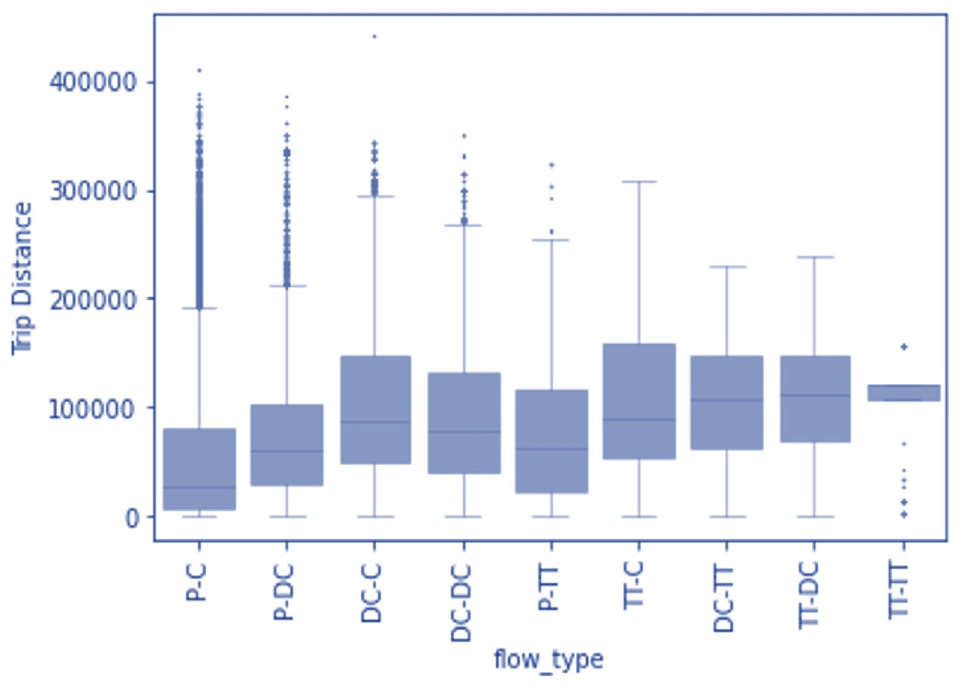
Shipment distance distribution by flow type.
The observations from the enriched database show that close to 60% of shipments in the Netherlands are transported directly between producers and consumers. For our database, another 35% of the shipment transport demand goes through distribution centers. Similar statistics are reported by Davydenko et al. ( 20 ) who estimated the market share of distribution centers to be around 40% of the total trips. We also observe that distribution centers receive similar shares of shipments from producers and other distribution centers. This suggests that distribution centers are used equally for both single and double echelon chains. The number of shipments departing from a DC is higher than the sum of the arrivals, which matches the general idea of DCs for break-bulk purposes. The share of shipments that involve a transshipment terminal is significantly lower. This is mainly a reflection of the relatively small volume of intermodal flows, compared with all other freight flows in the country. It may also be a result of the existence of cross-border trips related to these terminals, although these constitute a minority of trips compared with domestic flows.
On average, direct shipments are considerably heavier than indirect shipments that use distribution centers. As shown in Figure 6a, direct shipments also have significantly different weight distribution than their indirect counterparts where shipments through DCs follow a skewed distribution with a long tail and peak at very a small weight. Although small in number, shipments that make use of transshipment terminals are large in size. We may speculate about the reasons for this since transshipment terminals are largely used for modal transfer from ships or trains and are used for heavy-bulk goods.
We also observe that the average number of shipments that are consolidated together in direct shipments is considerably smaller than indirect shipments. On average, 8.8 shipments are bundled together in a distribution run to consumers while less than two shipments are bundled together for direct flows. However, the box plot in Figure 6b for the number of shipments bundled together suggests that for each of the flow types, the empirical distribution is skewed with a long tail. Note that there are cases where hundreds of shipments are bundled together to a destination. This may be a result of multiple small orders assembled in a palette to a single destination. An example of this is observed with agricultural produce where a typical shipment order is in the range of 50kgs.
A combined analysis of the shipment size distribution and the numbers of shipments in a bundle in Figure 6, a and b , shows that shipments going out of distribution centers are smaller in weight and consolidated in larger number than shipments going into distribution centers. This suggests a typical break-bulk role for distribution centers. On the other hand, the difference in the shipment size and the number in a bundle for transshipment terminals suggests that transshipment terminals have a different intermediate role (mainly of mode transfer) than distribution centers in the freight system.
Shipment distance distribution (Figure 7) and average distance (Table 1) together indicate that direct shipments travel shorter distances than indirect shipments. This is attributed to the sparse network of distribution centers in the spatial organization.
Commodity Specific Analysis
The use of intermediate nodes differs strongly between commodity types. It is expected that certain types of commodity make use of distribution centers more often than others. Also, the role of distribution centers may differ from cross-docking, warehousing, and rapid fulfillment depot. Although this heterogeneity is a well-known phenomenon, data to help identify these differences has been lacking. With the current database, we can start mapping these differences. We classify commodity types into eight broad groups based on the available commodity classification in the database. We distinguish between four typical bulky categories with two at endpoints of the supply chain (mineral ores, household waste) and two major intermediate goods for industry (chemicals, building materials), two food-related categories (temperature-controlled and agricultural), and two mixed cargo categories (manufactured products and general cargo).
Figure 8 presents three logistic indicators for each of the commodity groups and the segments (direct [P–C] and indirect related to distribution centers [P–DC, DC–C, and DC–DC]). The three indicators include the market share, the shipment size distribution, and the number of shipments consolidated together in one truck for each distribution type.
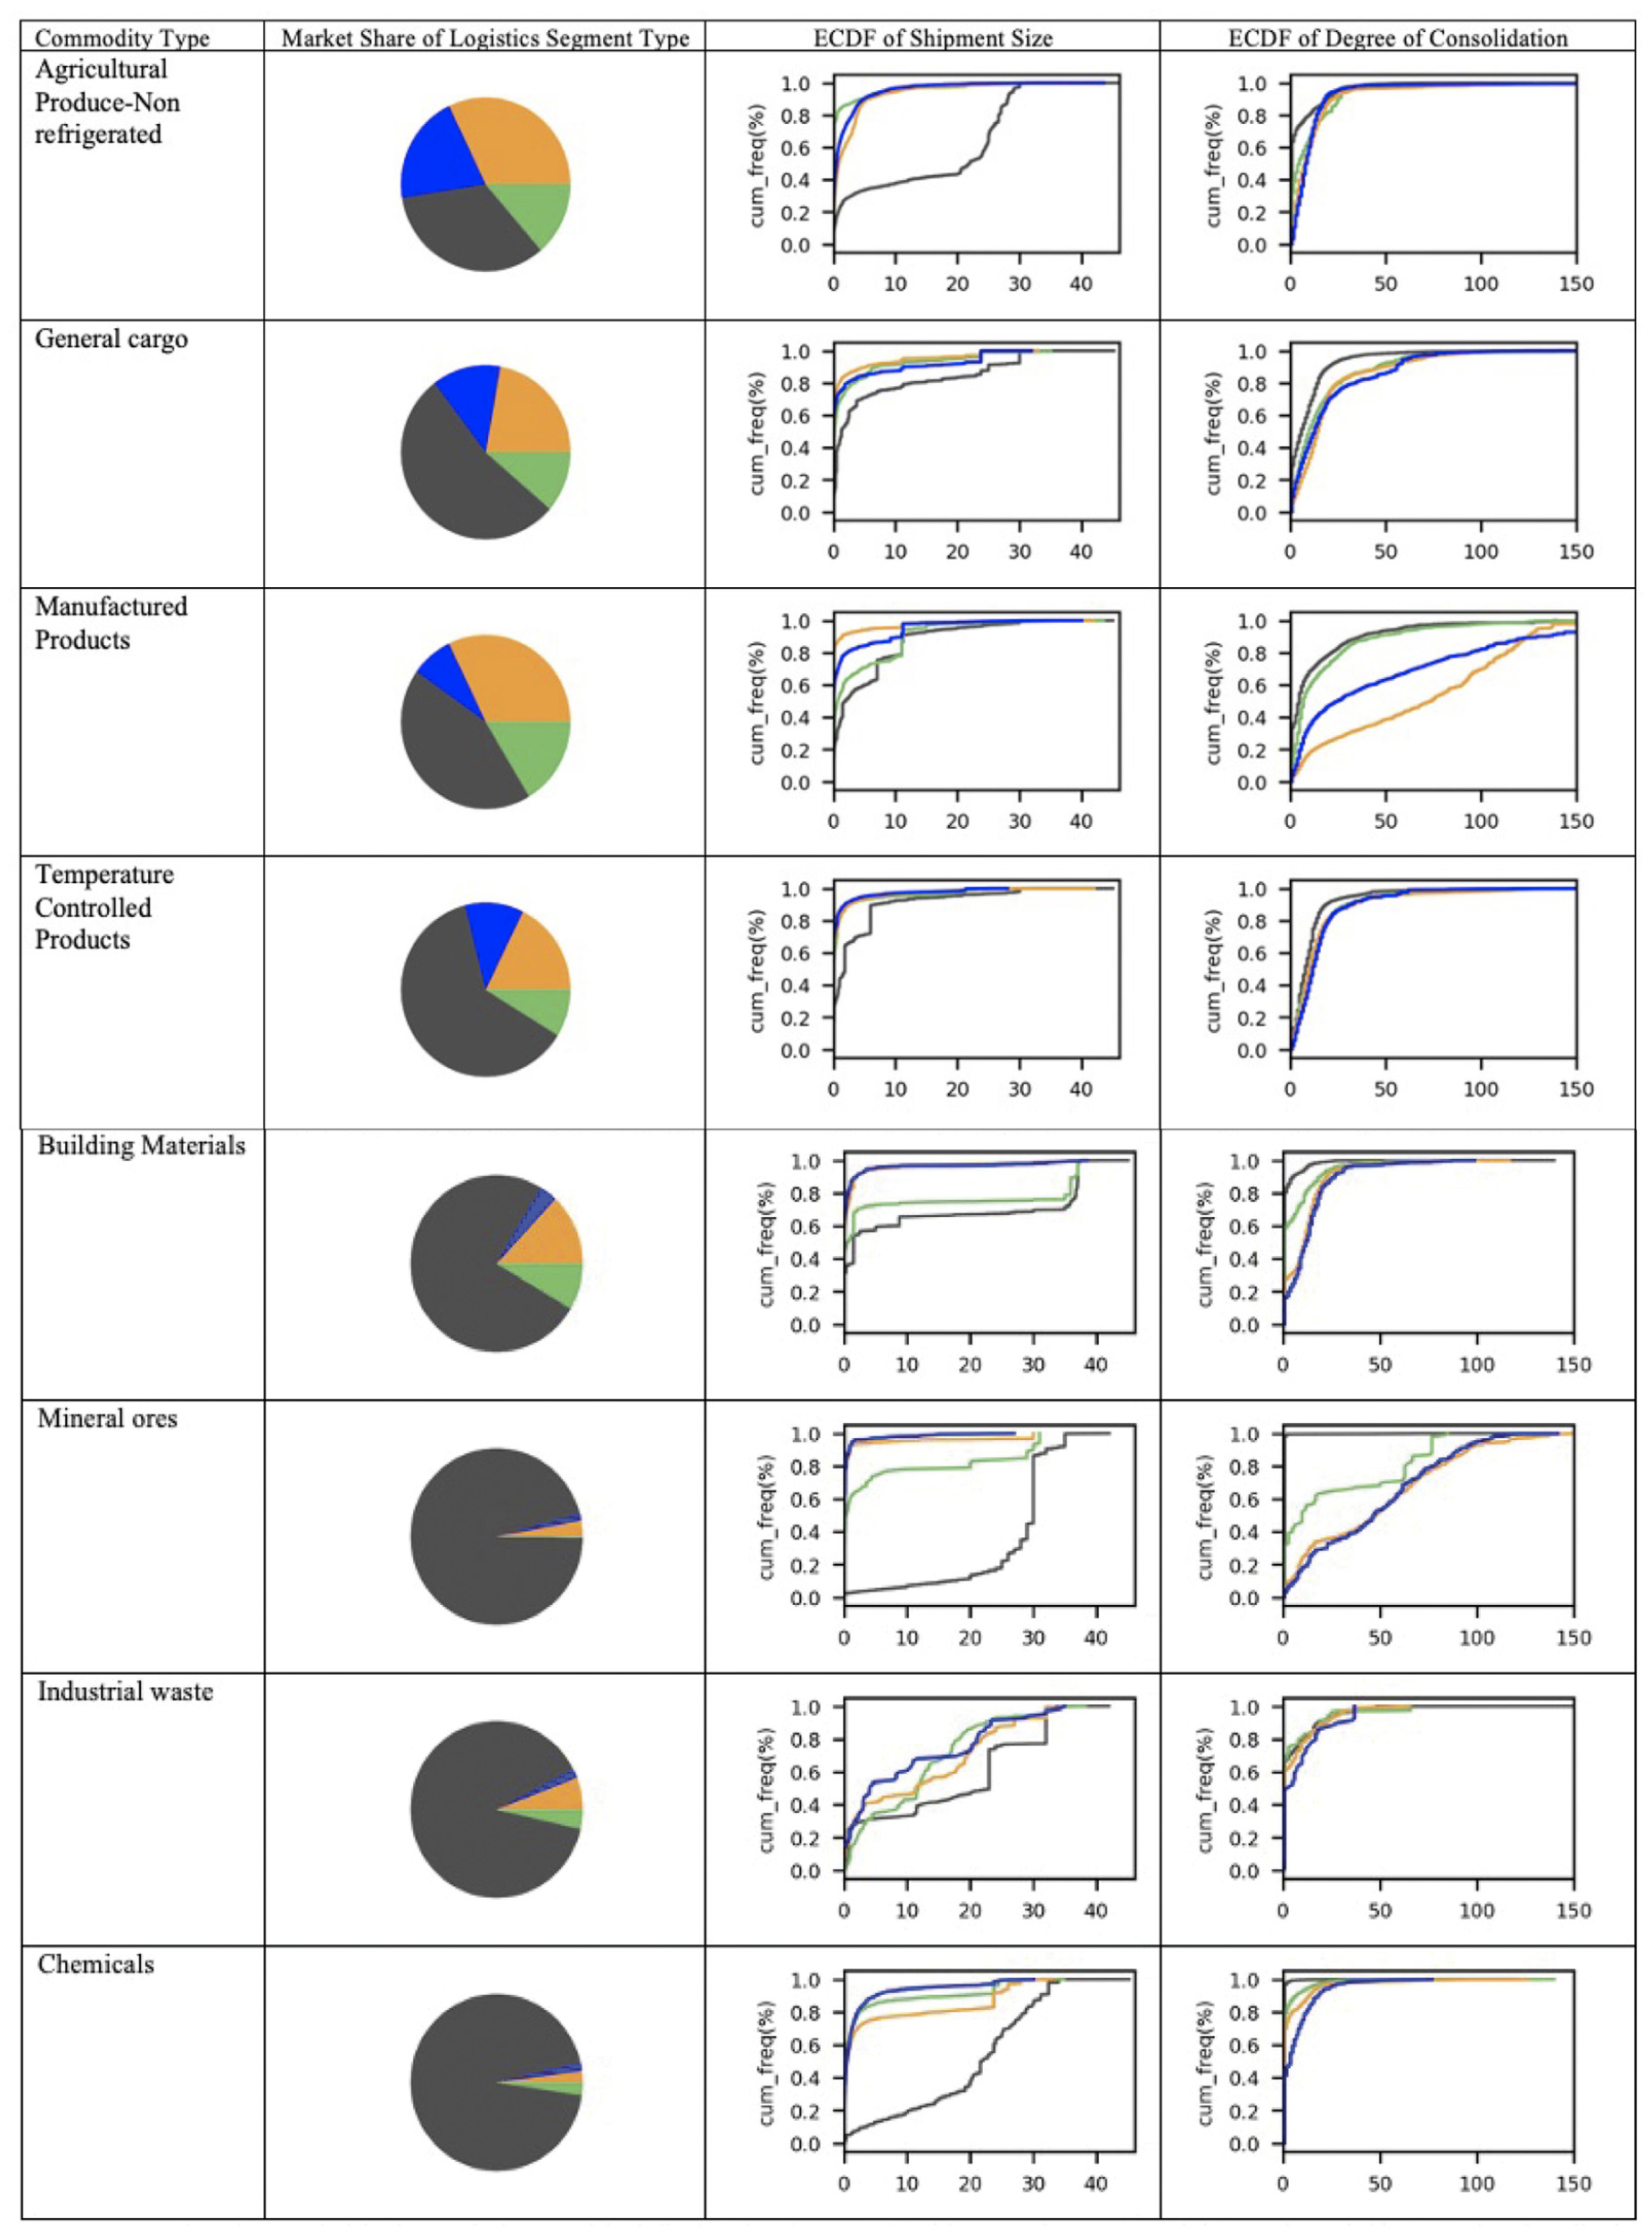
Market share, empirical cumulative empirical distribution (ECDF) for shipment size (ton), and the number of shipments in a bundle; by commodity type and segment.
The logistic indicators show some general patterns for all commodity types: transports directly from producer to consumer (P–C: orange) have higher average shipment sizes. This is logical as larger clients will typically receive full truckloads from factories rather than running these via distribution centers. Across all commodity types, we observe a certain degree of consolidation, meaning that there are multiple shipments carried in one tour. This confirms that it is important to take into account the bundling of shipments and multi-stop tour patterns in freight transport modeling.
For bulky commodity types such as mineral ores, chemicals, and building materials, we observe that the majority of the shipments are transported directly from the factory or the mine to the consumer. For these commodities, the shipment weight pattern from the empirical cumulative distribution shows that the shipment weight of direct transport is significantly heavier than indirect shipments. At the same time, shipments through distribution centers are consolidated in larger numbers than the direct shipments. This suggests that these are bulk goods that benefit from economies of scale in size.
For goods packaged in pieces or perishable products such as temperature-controlled agricultural produce or fashion items, the share of using distribution centers is significantly higher than for bulk products. However, the difference in shipment size distribution or degree of consolidation distribution is not as pronounced as bulk products. This may be for two reasons: these are high-value low-density products that fill trucks with volume instead of weight or are items stored close to the consumer to satisfy service demand as quickly as possible.
For the commodity groups of general cargo, manufactured products, temperature-controlled products, and agriculture-produced goods, we observe the most significant share of use of indirect distribution channels. General cargo and temperature-controlled products show similar distribution patterns with roughly half of all shipment transports being part of a distribution channel. The shipment size distribution shows that most of the shipments have small shipment sizes (<3 ton), both for direct and indirect channels. For agriculture-produced goods, results show that trucks are used to transport a considerable share of agricultural and food products to distribution centers. The cumulative shipment size distribution shows that the inbound trips to distribution centers (P–DC: green) have higher average shipment weight compared with the outbound trips to consumers (DC–C: orange). This aligns with a distribution pattern where agricultural products are transported to centers of storage or wholesale for further distribution to retailers.
Manufactured products also make use of distribution centers. Most of the transports observed are transports from the distribution centers to consumers. We also observe a high degree of consolidated manufactured product shipments from the producer to DCs (P–DC: green line). This implies a distribution structure where producers send out large batches of orders in consolidated transports to logistic nodes for further distribution.
A considerable share of wet and dry bulk, such as chemicals, mineral ores and industrial waste are transported in large shipment sizes, in the range of 20 to 30 tons. Most of the shipments in these commodity types are direct (P–C: black lines), without using indirect distribution channels. In particular, mineral ores are transported in heavy shipments from producer to consumer. There is a marginal number of observations of mineral ores that are transported between logistic nodes, but with a very high degree of consolidation with many shipments in one transport. These are interpreted as batches of orders of specific minerals, not typically associated with low-value bulk transport of ores.
Together these descriptive statistics characterize freight flows in distribution chains at different levels of aggregation. They present insights into the relationship between logistic segments and the associated characteristics shipment size, consolidation levels, trip distances, and commodity types. They demonstrate how additional information allows the development of shipment-base and agent-based freight models. As an example, with the new database it is now possible to infer underlying structures in freight transport as investigated by Nadi et al. ( 21 ). Similarly, agent-based models such as MASS-GT (18) can be estimated and validated with the statistics produced here.
Discussion and Conclusions
This paper presents a hierarchical data matching scheme with minimal assumptions for the enrichment of a large shipment database. Our assignment algorithm uses different levels of certainty to assign logistics activity types to origins and destinations of shipments. This approach makes it easier for future analysis to develop more comprehensive disaggregate behavioral models, in a framework of activity-based freight demand modeling. The proposed methodology can be replicated by analysts who work with big data from freight transport markets. However, the reproducibility of the proposed data fusion method depends on the format of the data structure, and the richness of the data set in commodity types, details of loading/unloading locations, and firm population. Such data is collected in the Netherlands by tapping into the transport management systems of companies. This data source comes with relative ease and less cost and can be readily adopted by other countries. In fact, we recommend that statistics agencies and freight modelers collaborate to collect similar data in other countries.
The logistic indicators reveal patterns of distribution structures that can be interpreted from a logistics perspective. We have also presented an exploratory analysis to understand the difference between flows on direct and indirect segments of distribution chains. We find that close to 40% of shipments are transported through intermediate nodes. Shipments that go indirectly through intermediate nodes are distinctly smaller than shipments that go directly between producers and consumers, and they are combined in higher numbers than the direct ones. This suggests that intermediate nodes serve as (de)-consolidation points. In addition, the findings differ over commodity groups. For bulk low-value goods, the use of distribution centers is very limited. When used, however, it is where consolidation occurs. For high-value or perishable goods, distribution centers are commonly used. Here, DCs may serve for both (de)consolidation and fulfilling service demand.
The research demonstrates that data fusion can provide valuable empirical insight into the logistic patterns behind freight transportation. Future works may include the improvement of the assignment algorithm by reducing the level of uncertainty. Also, more disaggregate descriptive analysis supported with data-driven modeling will provide additional empirical insights. Further systematic and formal analysis at deeper levels of detail could be worthwhile to study specific commodities and characterize their spatial and functional organization. Finally, we believe that disaggregate freight trip data have great potential for data mining and, in particular, for forecasting freight transport activities where machine learning techniques (e.g., classification and cluster analysis) can be adopted to extract valuable knowledge from these data with applications in forecasting (see e.g., Nadi et al. [ 21 ]).
Supplemental Material
sj-docx-1-trr-10.1177_03611981221147049 – Supplemental material for Data Fusion Approach to Identify Distribution Chain Segments in Freight Shipment Databases
Supplemental material, sj-docx-1-trr-10.1177_03611981221147049 for Data Fusion Approach to Identify Distribution Chain Segments in Freight Shipment Databases by Raeed Ali Mohammed, Ali Nadi, Lórant Tavasszy and Michiel de Bok in Transportation Research Record
Footnotes
Acknowledgements
We would like to thank CBS for providing us with the shipment data. The authors sincerely appreciate all anonymous reviewers for helping us to improve our manuscript.
Author Contributions
The authors confirm contribution to the paper as follows: study conception and design: Raeed Ali Mohammed, Ali Nadi, Lórant Tavasszy, Michiel de Bok; data collection: Raeed Ali Mohammed, Ali Nadi; analysis and interpretation of results: Raeed Ali Mohammed, Ali Nadi, Michiel de Bok; draft manuscript preparation: Raeed Ali Mohammed, Ali Nadi, Lo'rant Tavasszy; All authors reviewed the results and approved the final version of the manuscript.
Declaration of Conflicting Interests
The author(s) declared no potential conflicts of interest with respect to the research, authorship, and/or publication of this article.
Funding
The author(s) disclosed receipt of the following financial support for the research, authorship, and/or publication of this article: This research was partly supported by ‘ToGRIP-Grip on freight trips’ with grant number 628.009.001, a project funded by NOW, and PhD grant from Nuffic for the project Ethiolog.
Supplemental Material
Supplemental material for this article is available online.
References
Supplementary Material
Please find the following supplemental material available below.
For Open Access articles published under a Creative Commons License, all supplemental material carries the same license as the article it is associated with.
For non-Open Access articles published, all supplemental material carries a non-exclusive license, and permission requests for re-use of supplemental material or any part of supplemental material shall be sent directly to the copyright owner as specified in the copyright notice associated with the article.