
Abstract
Safety issues associated with transporting crude oil by rail have been a concern since the boom of the U.S. domestic shale oil production in 2012. During the last decade, over 300 crude-oil-by-rail incidents have occurred in the United States. Some of them have caused adverse consequences including fire and hazardous materials leakage. However, only limited information on crude-on-rail routes and their associated risks is available to the public. To this end, this study proposed an unconventional way to reconstruct crude-on-rail routes using geotagged photos harvested from the Flickr website. The proposed method linked the geotagged photos of crude oil trains posted online with national railway networks to identify potential railway segments that those crude oil trains were traveling on. A shortest path-based method was applied to infer the complete crude-on-rail routes, by utilizing the confirmed railway segments as well as their directional information. Validation of the inferred routes was performed using a public map and official crude oil incident data. The results suggested that the inferred routes based on geotagged photos had high coverage, with approximately 96% of the documented crude oil incidents aligned with the reconstructed crude-on-rail network. The inferred crude oil train routes were found to pass through several metropolitan areas of high population density, who were exposed to potential risk. These findings could improve situational awareness for policy makers and transportation planners. In addition, with the inferred routes, this study has established a good foundation for future crude oil train risk-analyses along the rail route.
Keywords
Typically, petroleum crude is transported by pipelines, which is the most cost-effective and safest mode of operation. The U.S. domestic shale oil boom in 2012, however, left oil and gas extraction and related industries without sufficient opportunities to plan, design, build, and operate much-needed pipeline infrastructures. Pipelines serving the shale oil fields, especially Bakken shale, did not have sufficient capacity to carry all the shale oil. Shippers, therefore, utilized trucks and railroads to transport the oil that could not be served via pipeline. The boom of crude oil by rail transportation started in 2012 and peaked in 2014 ( 1 ). Although pipelines (e.g., Dakota Access Pipeline) have been built in subsequent years to address the demand, rail continues to serve as the second largest crude oil transportation mode in North Dakota, carrying 14% of crude oil produced in the state in 2017 according to the latest version of the Freight Analysis Framework dataset ( 2 ). The crude oil moved by rail from North Dakota traverses a long distance to petroleum refineries located on the West-, East-, and the Gulf Coast. In addition to North Dakota, the railway also plays a role in delivering the crude oil produced to refineries in Wyoming, Colorado, and several other states.
One of the biggest concerns with crude-on-rail transportation is safety. In 2013, a train carrying crude oil derailed and exploded in Lac-Mégantic, Quebec, killing 47 people. The publicity generated by this fiery crude-on-rail mishap led to public awareness of the dangers and risks associated with crude oil trains. Frequent minor incidents, however, are less likely to attract public attention than major fiery accidents. Between 2013 and 2021, the United States experienced over 300 crude oil rail-related accidents involving several types of direct consequences, including spillage, fire, explosion, water contamination, gas dispersion, and environmental damage ( 3 ). Fourteen of these accidents were derailments that lead to fire, crude oil leakage, and/or people evacuation. For example, the most recent crude oil train derailment that occurred in Custer, WA in 2020, caused a train fire that burned for 8 h. Nearly 29,000 gal of crude oil were spilled during this incident. Aware of the possible catastrophic consequence, government agencies, researchers, and the public are eager to obtain information on the crude-on-rail operation to evaluate hazardous circumstances.
Conversely, railroad companies are protective of their train operational information because oil train routes are considered to be business sensitive. Given this situation, in 2014, the U.S. Department of Transportation issued an emergency order to safeguard crude oil shipments. That emergency order requires railroad operating trains to submit their crude-on-rail movements, volumes, and frequencies to the State Emergency Response Commissions, when they contain “more than 1,000,000 gal of Bakken crude oil, or approximately 35 tank cars, in a particular state” ( 4 ). Such information helps government agencies to manage crude oil movements through their jurisdictions and evaluate the risks. By agreement, however, this information is not publicly available. In 2015, The Wall Street Journal (WSJ) collected the crude-on-rail movements, volumes, and frequencies information submitted by oil companies to the State Emergency Response Commissions and made it publicly available ( 5 ). There are several limitations of the map published by WSJ, however. First, it only covers rail routes originating from Bakken Formation. Second, the route information obtained is at the county level, which is not sufficient for accurate safety analysis. Moreover, because of the addition of new oil fields and changes in market demands, rail routes are subject to change over time. The WSJ-published map was compiled in 2015 and has not been updated since. Thus, up-to-date crude-on-rail routes information at the network-link level are still required for risk analysis.
To approximate unknown routes and obtain knowledge concerning crude-on-rail safety, this study proposed an unconventional way of obtaining route information using social media data, specifically, the Flickr photo-sharing website. We also integrated information from different data sources to validate inferred routes. We anticipate that our findings from this research could inform the concerned public and help policy makers and transportation planners in their decision making.
Literature Review
The literature discussed below is organized under two themes: the first theme is related to crude oil transportation by rail and the second reviews route determination efforts based on Flickr data.
Given the risk associated with the transportation of crude oil by rail, to human life and the environment, special attention has been given to this topic by several researchers, especially those published in the last decades. In a 2016 paper, Liu developed a probabilistic risk-analysis model and a decision support tool for estimating in-transit risk of crude oil transportation by rail in unit trains ( 6 ). The risk is measured by the expected number of affected persons on rail network segments (i.e., links). It is suggested that the model and tool could be used for identifying, evaluating, comparing, and prioritizing potential risk-mitigation strategies. Around the same time, Oke et al. presented a market equilibrium model for investigating strategies to mitigate the environmental and public safety risks from crude oil transportation by rail in the United States ( 7 ). It is suggested that an integrated policy of targeted rail network capacity, pipeline investment, and lifting the ban on U.S. crude oil exports would be able to address the medium-term risks of crude oil transportation by rail.
Busteed provided a comprehensive law review of crude oil by rail transportation dangers in relation to casualty and environmental concerns, existing regulations, and responses by the rail and oil industries ( 8 ). Another law review was published by Gerrald and McTiernan in relation to crude oil transport by rail in New York State ( 9 ).
Vaezi and Verma analyzed the rail network for crude oil transportation in Canada and its potential impact on flows should a pipeline network become available ( 10 ). They proposed a biobjective routing model that can capture both cost and risk minimization. Specifically, the cost objective represents the total railcar distance traveled, and the risk objective represents the product of the population density in the vicinity of the rail links and the volume of the crude oil traversing the links. Identification of high-risk rail links was found to help in the devising of appropriate emergency responses were an incident to occur. Mason found a positive association between the accumulation of minor- and the frequency of serious incidents for transportation of crude oil by rail, as reported in his 2018 article ( 11 ). Additionally, a positive association between increased rail shipments of crude oil and the occurrence of minor incidents was found. Morrison et al. developed a model for crude oil mode split and route assignment that considered pipeline and rail modes ( 12 ). The model was tested in relation to its capacity to predict changes in crude oil flow patterns and mode share in response to changes in transportation network attributes and oil demand. Clay et al. provided estimates of the air pollution, greenhouse gas (GHG), and spill and accident costs from the long-distance movement of crude oil by rail and pipelines considering North Dakota as the shipment origin ( 13 ). Air pollution and GHG costs for rail were almost double those of pipelines. Additionally, air pollution and GHG costs were found to be higher than spill and accident costs.
More recently, Schneller et al. conducted a case study for Saratoga County in the state of New York on public perceptions of technological risk, state responses, and policy for crude oil transportation by rail ( 14 ). The authors emphasized the risk to safety, property, and the environment posed by crude oil by rail for the communities residing near railways in the event of a disastrous derailment. It was found that the public in the county had a low level of knowledge about oil shipments and emergency management plans. Smith assessed regulatory compliance of crude oil by rail and its impact on air pollution for the community in the city of Baltimore, MD ( 15 ). From two study sites, transportation of hazardous materials (including crude) was found to be more prevalent at night. The authors recommended further research on the detection and impact of volatile organic compounds at sites close to rail lines that carry crude oil.
There have been several studies that have explored the use of social media data such as geotagged Flickr photos to determine, as well as infer, transportation routes. However, these studies have mostly focused on passenger travel and, in many cases, are applicable only for tourists or by tourism industries. Specifically, Chareyron et al. presented a methodology to mine tourist routes using Flickr photos ( 16 ). Both the fastest and most likely paths were considered to determine tourist itineraries in the destination location. Kurashima et al. proposed a method for travel route recommendation that uses Flickr photos to infer the location histories of tourists ( 17 ). One of the key model inputs was the location sequences of the person taking the geotagged photos. Sun et al. built a travel recommendation system that is road-based and uses Flickr photos ( 18 ). The system provides users with the most popular landmarks as well as the best travel routes between them. Steiger et al. proposed a framework for the purpose of detecting human mobility transportation hubs and inferring public transport flows based on geotagged social media data ( 19 ). Cai et al. developed a framework that can mine frequent travel trajectory patterns as well as regions of interest based on Flickr photos ( 20 ). It is mentioned that the framework is able to extract expected major landmarks (e.g., cities and tourist attractions). Spyrou et al. analyzed user-generated routes within downtown city areas that were derived using a Flickr photo dataset ( 21 ). In a more recent study, Cai et al. proposed itinerary recommender systems based on Flickr photos that considered the mining of semantic trajectory patterns as well as sequential points of interests with temporal information ( 22 ). Yang et al. developed a neural network that can provide travel route recommendations geared toward a sequence of points of interest as well as in relation to visitors’ personal interests ( 23 ). The model was validated using a dataset consisting of Flickr photos. In their 2021 paper, Kádár and Gede proposed a methodology that uses network analysis with efficient clustering algorithms and Flickr photos ( 24 ). The purpose was to determine tourism flows in large-scale destination systems.
Route Inference Methodology
Public geotagged crude-oil-train photos in the contiguous United States were collected from Flickr to identify the locations where crude oil trains were sighted. Then, the proposed methodology identified the railroad segments these trains had traveled, and inferred the missing routes connecting those identified railway segments.
Harvesting Crude-Oil-Train Photos from Flickr
The crude-oil-train photos and videos hosted on the Flickr website provided an opportunity to find the locations of crude oil trains and their routes. Flickr photos and videos contain a wide range of user-provided information including title, description, textual tags, geographical coordinates, and time stamps indicating when the picture or video was taken. The first three data elements (i.e., title, description, and tags) give concise descriptions of photo contents, which allow for the retrieval of photos that are related to a specific topic. The geographical coordinates provided are either automatically synchronized from cameras with GPS functions or provided by users (when clicking on the map) ( 25 ). Geographical coordinates could represent where the contents were located or where the photographer stood ( 25 ). In this study, we assumed that the geographical coordinates of a crude-on-train photo represented the train’s actual location at that time. By harvesting the geolocations of the crude-oil-train photos taken in the contiguous United States, information about where crude oil trains were sighted, and which railroad segments they had traveled, could be obtained.
Using the publicly available Flickr application programming interface, information from photos whose title, description, or textual tags contained the keyword “crude oil train” were collated. Photos that were taken between January 1, 2008 and June 1, 2022, were utilized for this study ( 26 ). Over 1,300 crude-oil-train photos taken in the contiguous United States were retained. Their locations and time stamps were stored as points in an ArcGIS geodatabase and used in the next step.
Figure 1 shows the total movements of crude oil by rail according to Energy Information Administration (EIA) statistics originating from each Petroleum Administration for Defense District (PADD) ( 27 ). The boom of the crude-on-rail movement in the year 2012 is clearly shown in this figure, although the movement began a couple of years earlier. The total crude oil by rail tonnage increased from 41,626,000 barrels in 2011 to 144,240,000 barrels in 2012, at a growth rate of 246%. The growth of crude oil by rail continued and peaked in 2014 with over 250 million barrels. In recent years (from 2016 to 2021), however, total crude oil by rail movements have decreased. Among all the PADDs, the largest portion of crude oil transportation by rail originated from PADD2 (Midwest) where Bakken shale plays a big role.
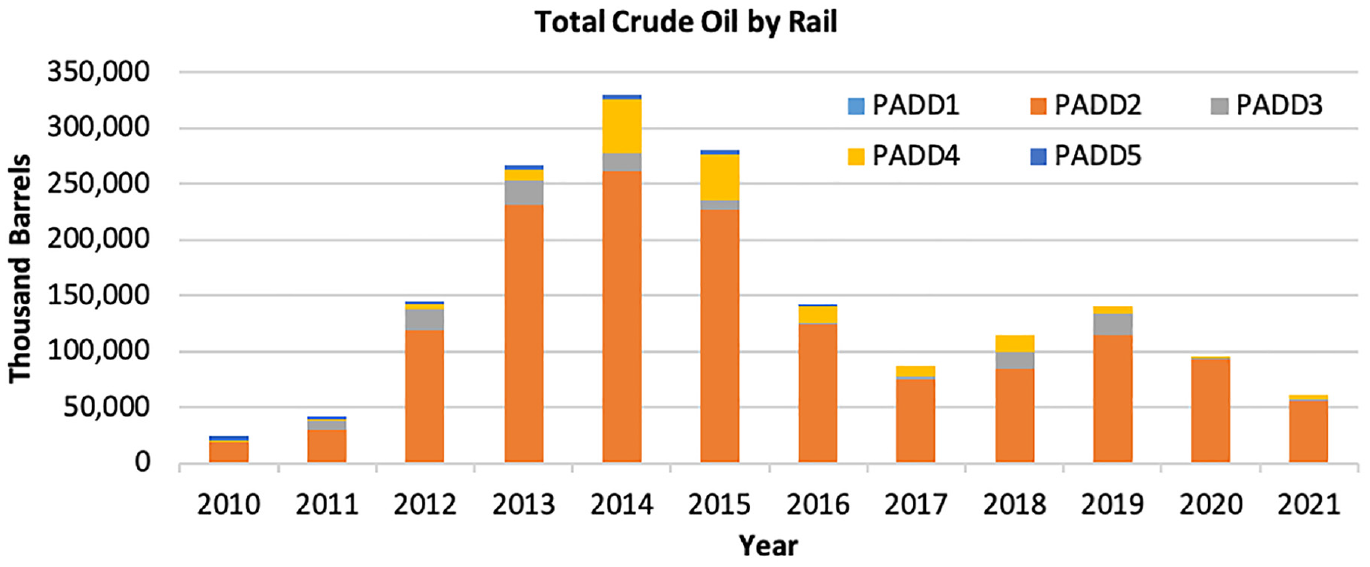
Crude oil by rail received from each PADD zone over the years.
Figure 2 shows the temporal variation in spatial distribution of the crude-on-train photos taken during the period 2008 to 2022. Red dots on the map represent the location of these crude-on-train photos. Consistent with statistics reported by EIA, before 2012, very few crude-oil-train photos were identified. The number of photos started to increase in 2012 and, clearly evident from the map, showed the Bakken crude oil train corridor linking North Dakota to the East Coast that dominated domestic oil train movement. Other major flows that could be observed from Figure 2 include
1) Bakken crude oil trains heading south to the storage and pipeline hub in Oklahoma, as well as to the refineries in Texas and Louisiana along the Gulf Coast;
2) Bakken crude oil flows into the State of Washington on the West Coast, where the oil is refined or transloaded onto barges heading down to California; and
3) Bakken crude oil production from shale deposits in Utah and Colorado.
These temporal variations (Figure 2) might have indicated that rail movements of crude oil were relatively flexible, which would allow for more frequent changes in response to new oil fields, market demand, or both.
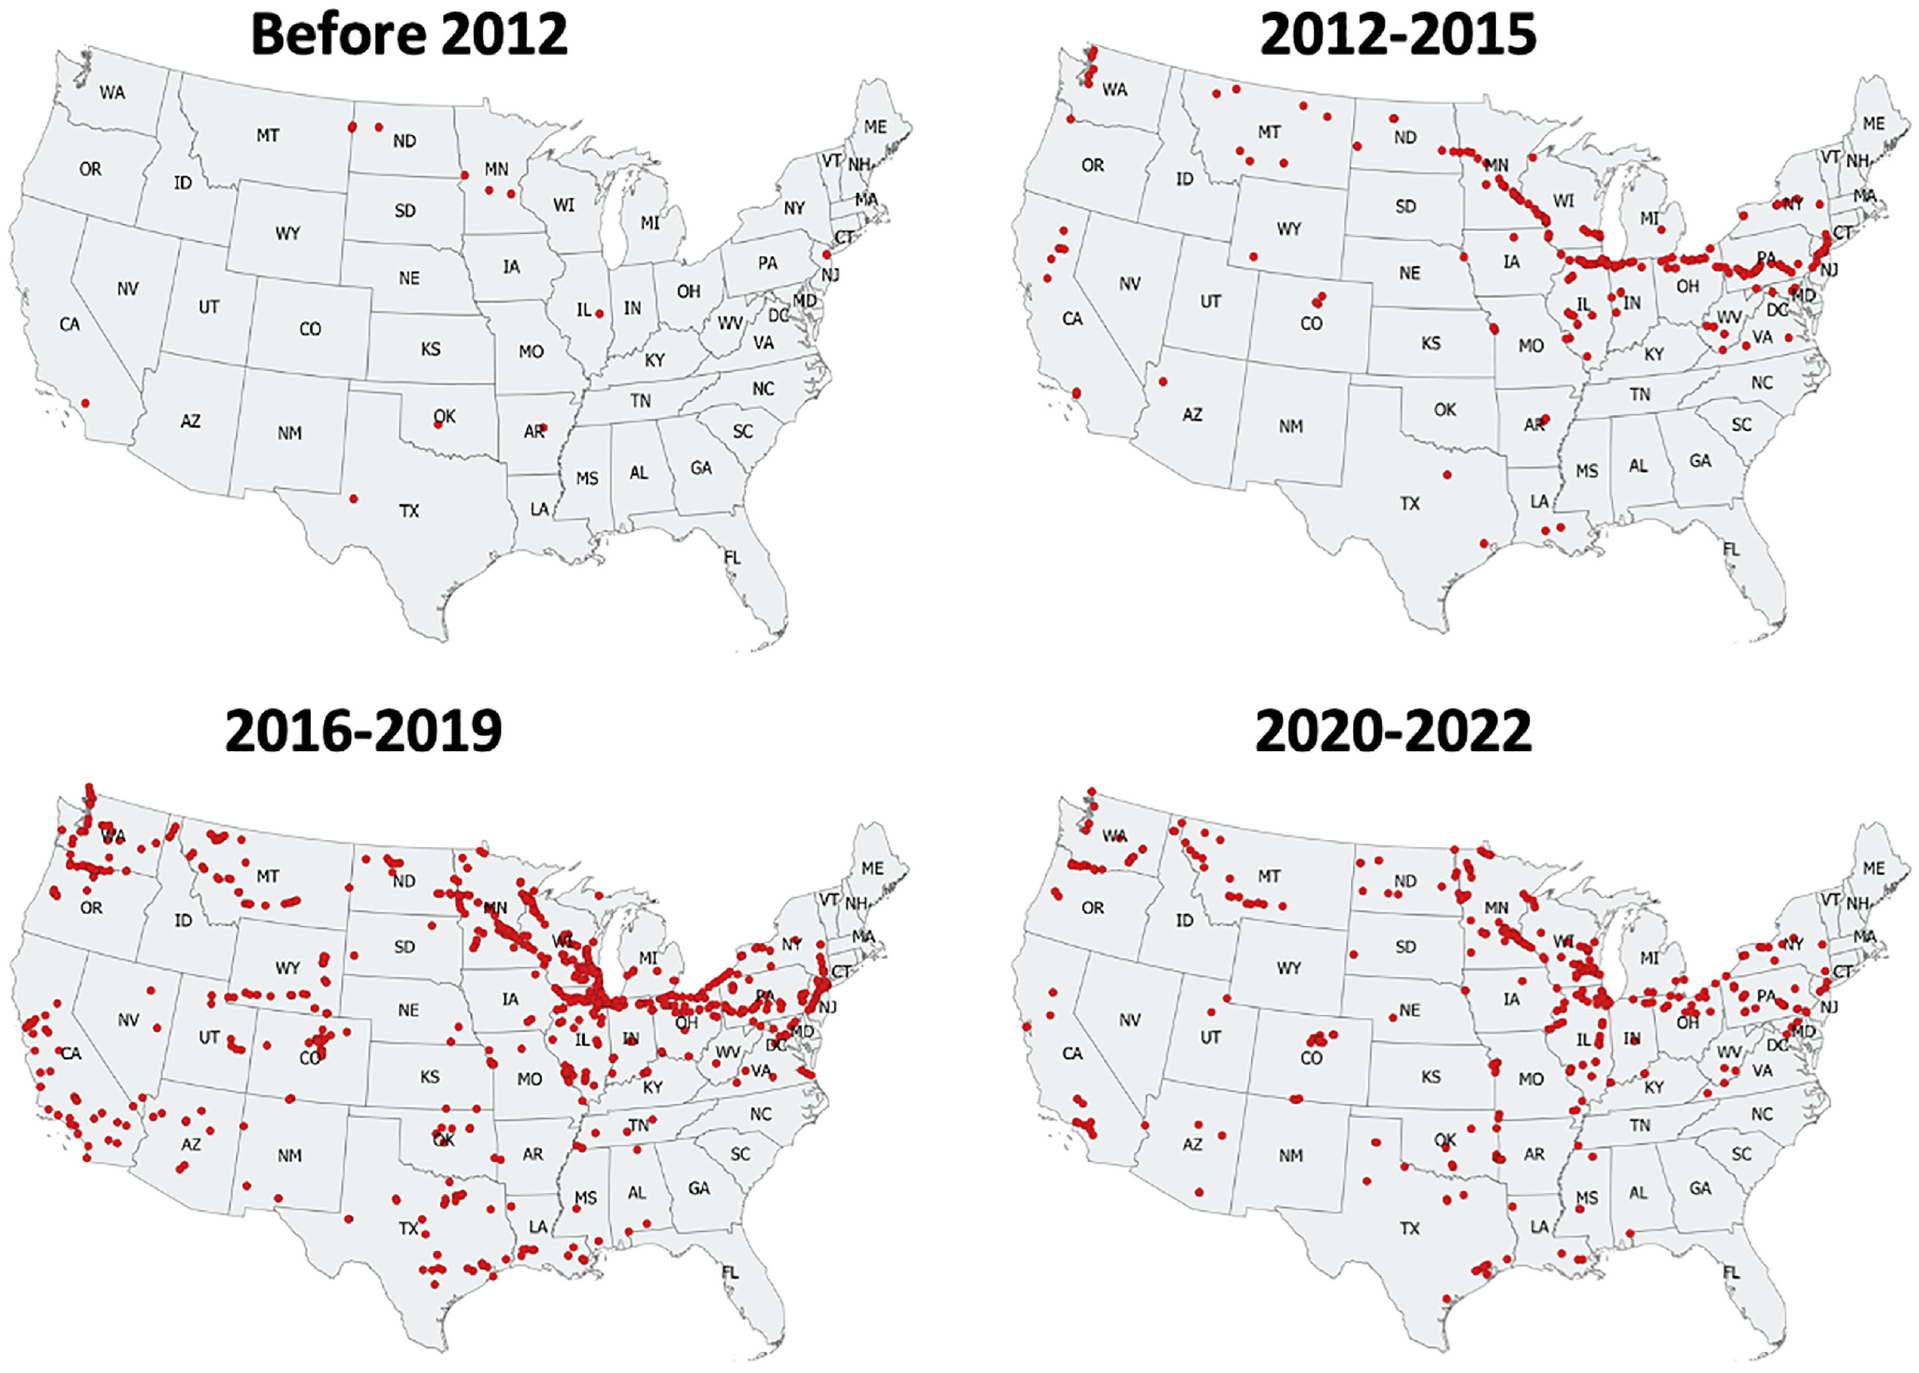
Temporal variation of crude oil train locations across the contiguous United States derived from Flickr photos.
Identifying Railroad Segments
By overlaying the locations of the 1,300+ identified crude-oil-train photos on the North American Rail Network (NARN) ( 28 ), 98% of them were found to be located within 320 ft of their nearest railroad lines, whereas around 95% were within 160 ft. This suggests that the geolocations associated with crude-oil-train photos were close to railway tracks and, therefore, reasonably reliable sources for reflecting the locations of crude oil trains. Note that railroad companies often use main lines (i.e., rail lines excluding sidings, branches, and yards; NARN contains a data field named NET to differentiate between types of rail lines) to deliver crude oil. This was evidenced in our research finding in which 88% of crude oil trains, captured by photos, were witnessed to be within 160 ft of main lines, and 96% were within 320 ft. Therefore, it was deemed reasonable and practical to use main lines to both confirm and infer routes from the geolocations of crude-oil-train photos.
In addition to crude-oil-train photos, rail terminals that handle loading and unloading of crude oil that are publicly available from EIA ( 29 ) were also evaluated. Ninety-one crude oil rail terminals with geographical coordinates were included in the crude oil rail terminal dataset; this provided origin and destination (O-D) information for crude-on-rail movements—1,400 data points were identified after combing these rail terminals with Flickr photos. The route-inferring algorithms were based on these 1,400 data points.
The nearest railroad segment for each of the Flickr photo points/crude oil rail terminals was identified as a part of the crude-on-rail route, termed the “confirmed road segment.” These confirmed road segments were then extended to the “confirmed route” by iteratively searching the neighboring links of the existing confirmed road segments. Neighboring links without any branch lines at the connection points to the previously confirmed road segment were added to the confirmed route, because this represented the only route the crude oil train could take. A simplified example is shown in Figure 3. First, Link 4 was identified as a confirmed railroad segment in Step 1. Under Step 2, its neighboring links (Links 3 and 5) are added to the confirmed route. In Step 3, the algorithm continues to search the neighboring links of Links 3 and 5. For Link 3, because it connects to both Links 1 and 2, the iteration stops for this direction. Link 6 is added, given that it connects to Link 5 and does not have any branch lines at the connection point. The iteration stops in this direction because Link 6 is connected to the other two links. Therefore, the final confirmed route includes Links 3, 4, 5, and 6.
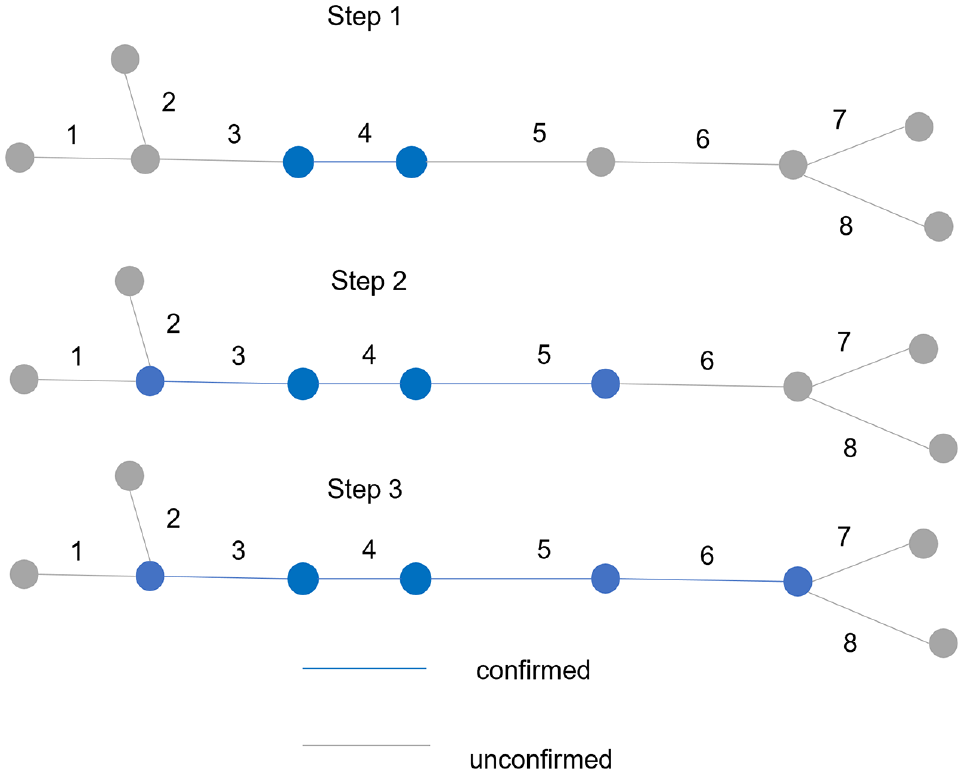
Steps to extend confirmed road segment to the confirmed route.
Figure 4 shows the results of the confirmed railroad segments based on Flickr photos/rail terminals and the extended confirmed routes. As shown in this figure, after extending the confirmed road segments to confirmed routes using the proposed method, many previously disconnected road segments are now connected. For example, one crude oil train route traversing the state of Montana (MT) can be observed in Figure 4b. This route was shown as scattered small segments in Figure 4a. However, in areas with sparse photo points, some of the confirmed routes were still not well connected, thus leaving gaps that needed to be inferred.
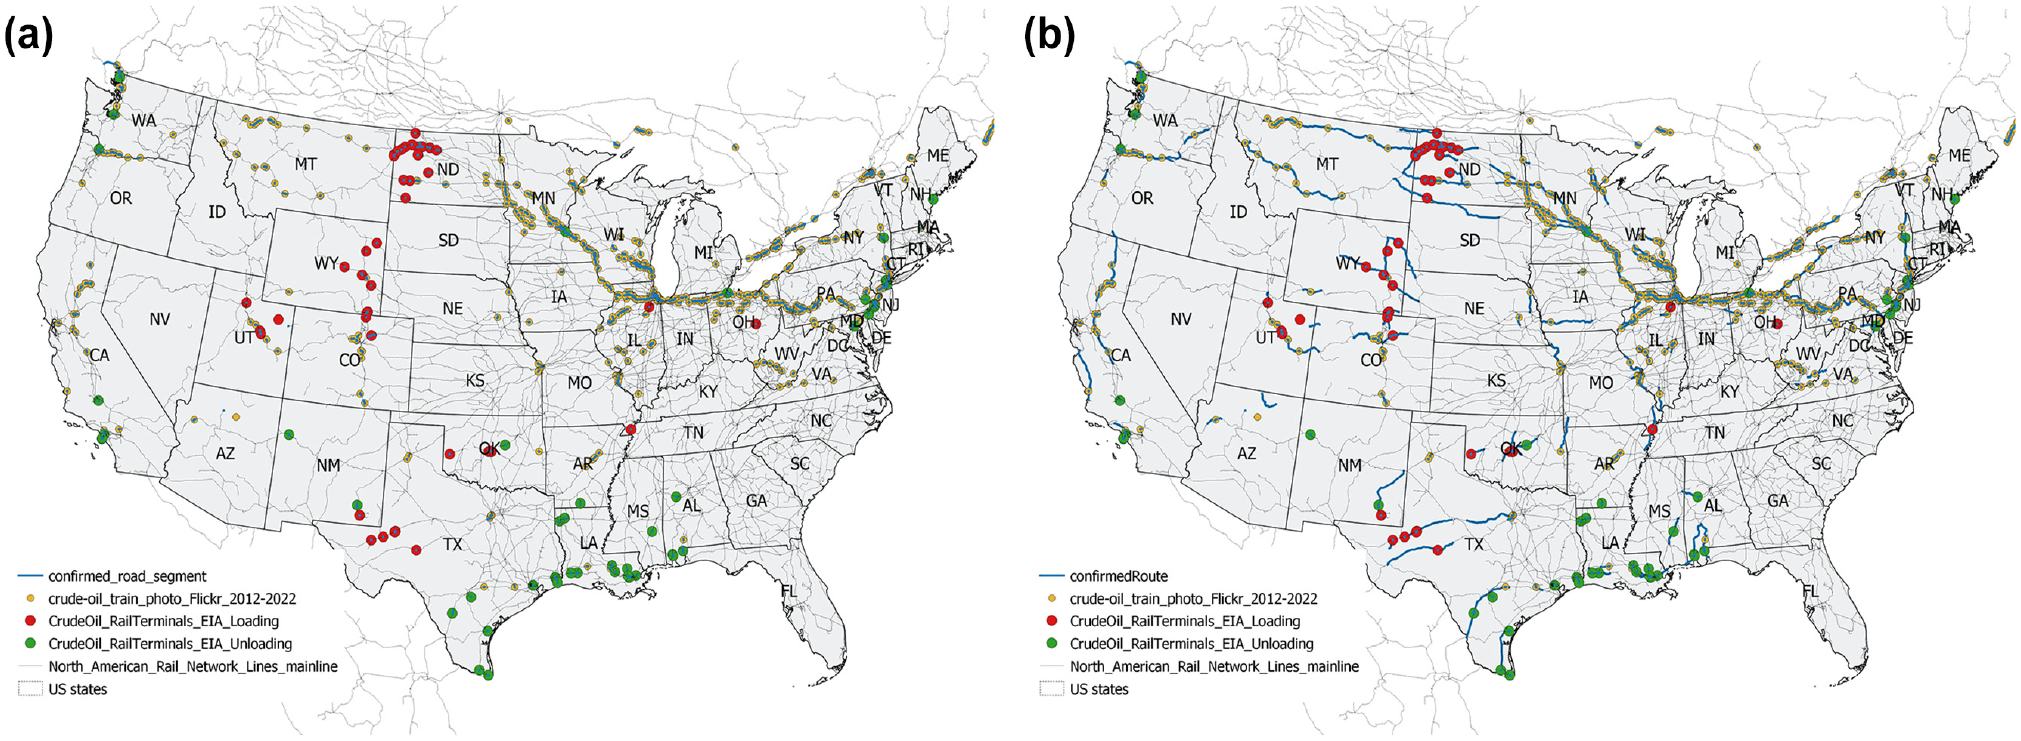
Map of the contiguous United States comprising (a) confirmed railroad segments and (b) confirmed routes.
Inferring Crude-on-Rail Routes
EIA provides statistics and maps depicting the directional movement of crude oil by rail between PADD regions ( 1 , 27 ). Table 1 summarizes the average crude oil movements among PADDs from 2010 to 2021 ( 1 ).
Annual Average Crude Oil Volumes Among PADDs from 2010 to 2021(Thousand Barrels)
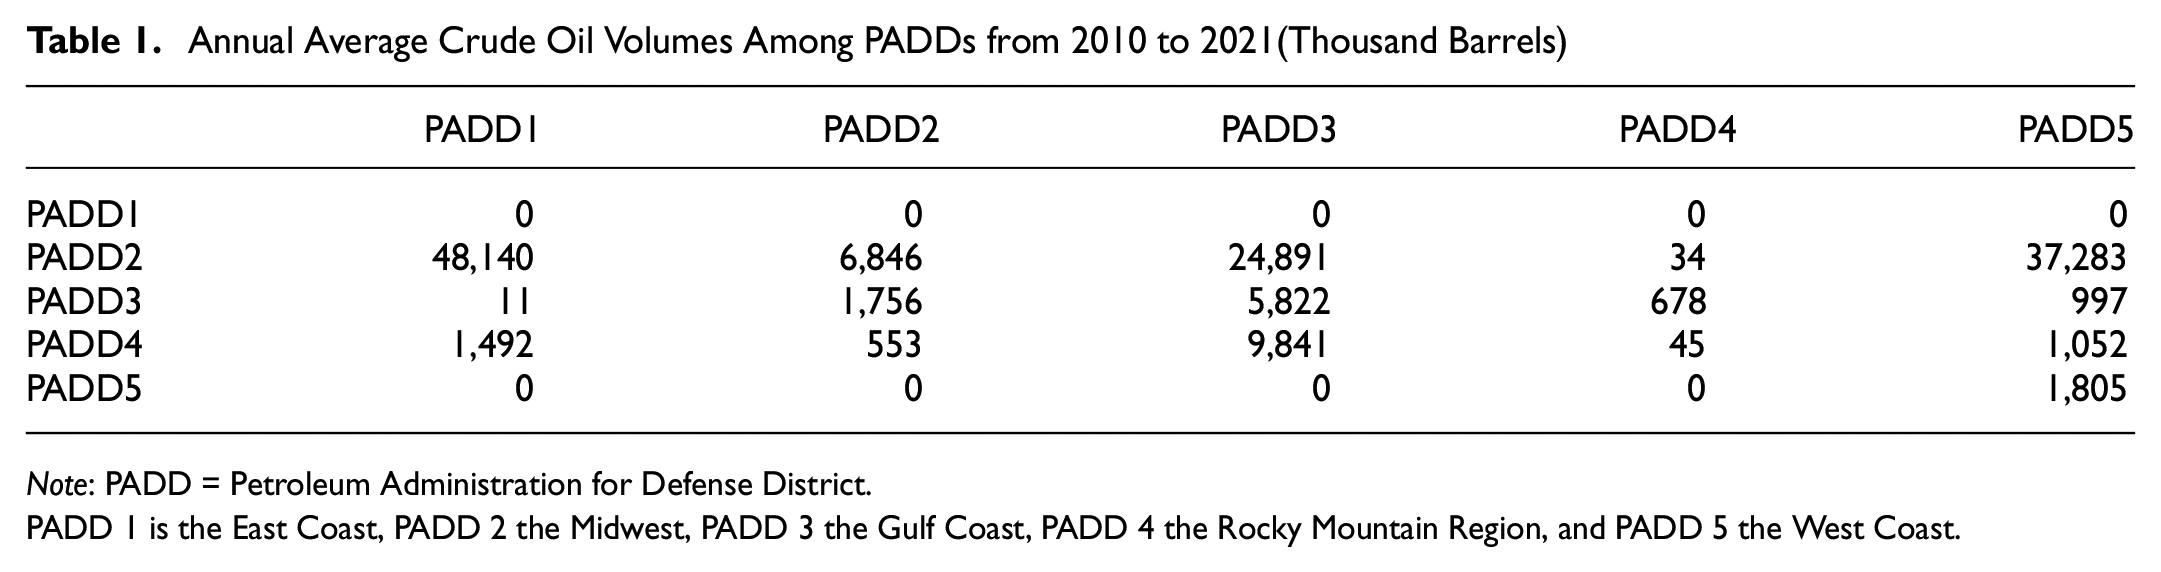
Note: PADD = Petroleum Administration for Defense District.PADD 1 is the East Coast, PADD 2 the Midwest, PADD 3 the Gulf Coast, PADD 4 the Rocky Mountain Region, and PADD 5 the West Coast.
Figure 5 shows a map of the crude oil directional movement among different PADDs. The loading and unloading crude rail terminals, as well as the refineries (destination of crude oil movement), are also shown on the map.
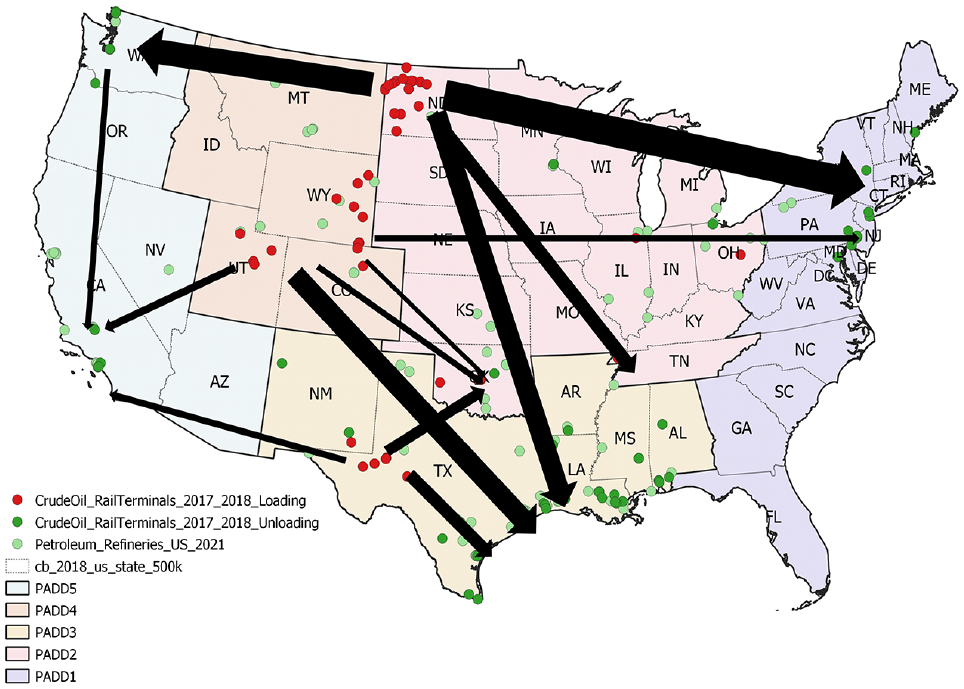
Crude-on-rail directional movement.
Utilizing these data sources together, one can infer the missing parts of routes (identified in the section above). To do this, the following rules were applied:
(a) Inferred routes that connect broken “confirmed routes” as well as rail terminals should be the shortest on the main line network;
(b) Inferred routes should consider the railroad ownership and trackage rights; and
(c) Inferred routes should be consistent with the direction of rail movements of crude oil.
Based on the above three principles, the following methodology was designed to complete the route taken by crude oil trains:
Step 1. Identify all broken confirmed routes.
Step 2. For each of the broken confirmed routes, perform the shortest path algorithm to identify all the possible missing routes connecting it to the other routes as well as to the crude oil rail loading and unloading terminals. When identifying the shortest path between two broken confirmed routes, railroad ownership and trackage rights should be considered. All railroad companies that either own or have trackage rights to the two confirmed routes are first identified. The shortest path algorithm is then performed based on the railroad network that can be accessed by these companies.
Step 3. Rank all the possible routes by distance. The shortest route is the inferred route.
Figure 6 shows the resulting crude-on-rail routes. The blue lines indicate the confirmed routes, the red lines the routes that were inferred.
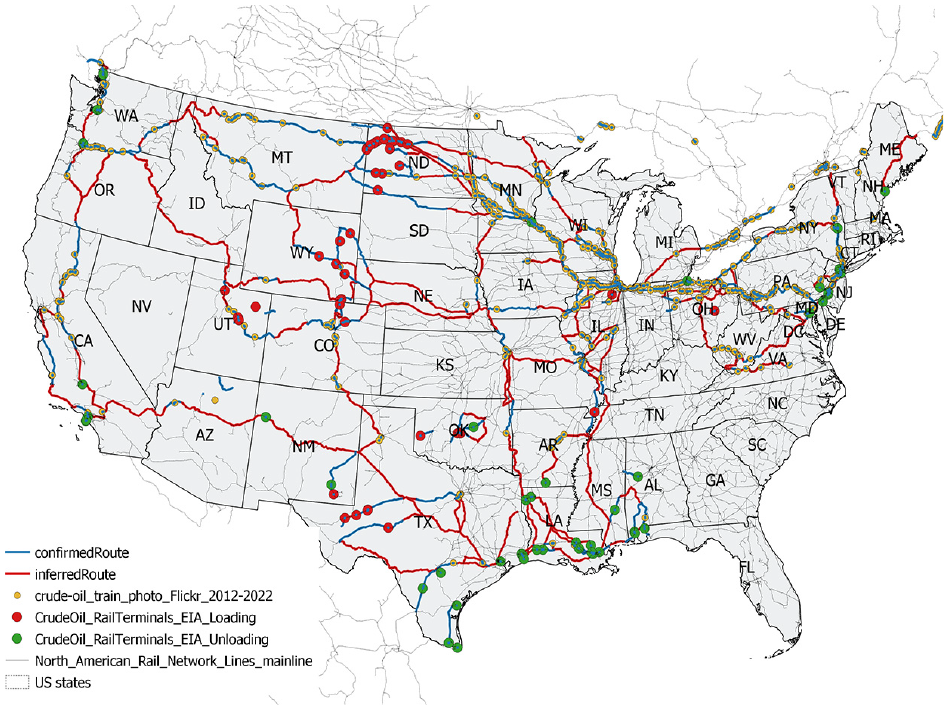
Inferred routes.
Results Validation
Crude Oil Incidents
Public access to historical incident records through the Pipeline and Hazardous Materials Safety Administration (PHMSA) website makes it possible to analyze the characteristics and consequences of crude-on-rail-related incidents. For this research, all reported incidents associated with crude oil rail transport during the period 2013 to 2021 were extracted from the Yearly Incident Summary Report ( 3 ). Table 2 presents an example of a crude oil incidents record. For each incident record, the city and state where the incident took place are available. The incident street address is generally not provided. Based on city and state information, geocoding is used to extract the associated coordinates of the city to represent the incident location on the map.
PHMSA Crude Oil Incident Records
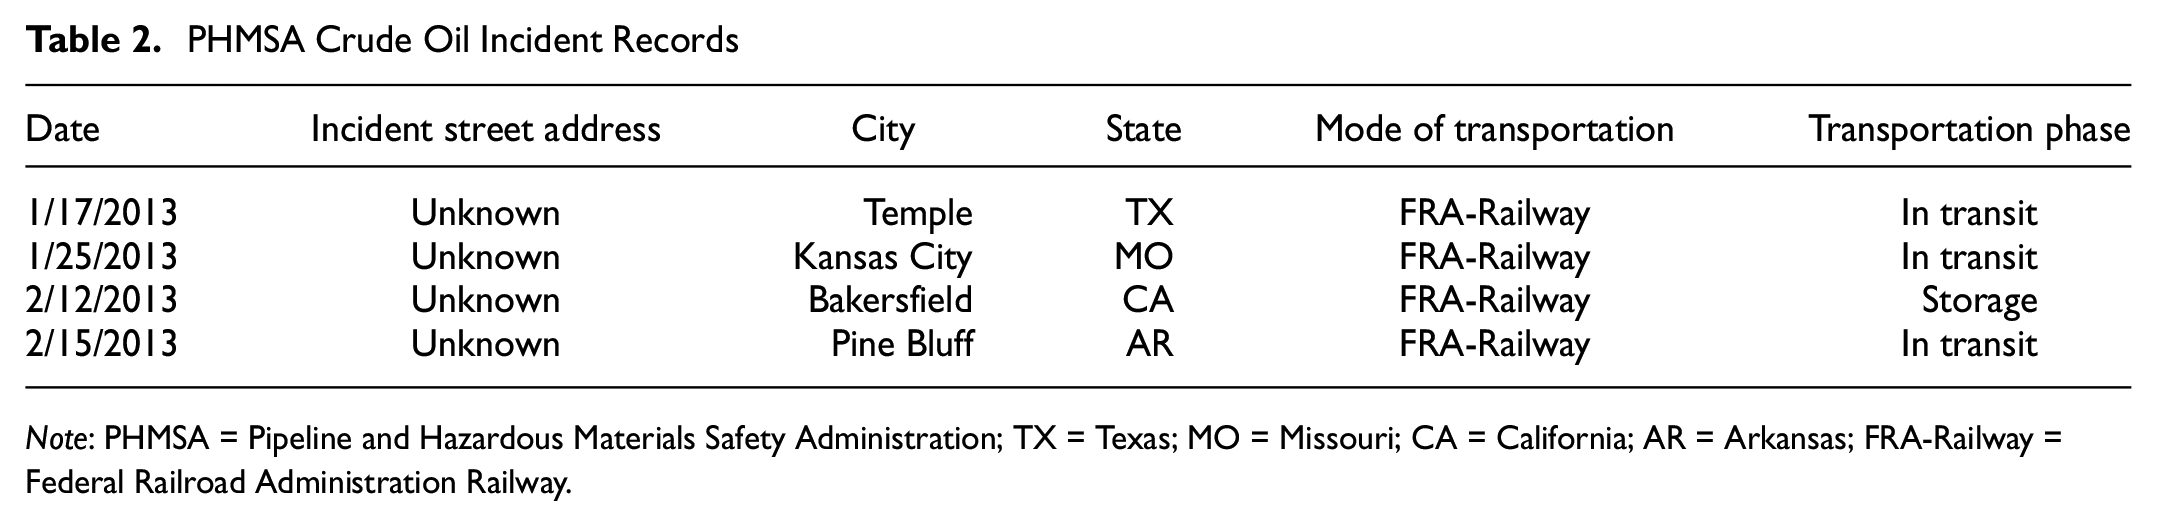
Note: PHMSA = Pipeline and Hazardous Materials Safety Administration; TX = Texas; MO = Missouri; CA = California; AR = Arkansas; FRA-Railway = Federal Railroad Administration Railway.
In total, 338 incidents occurred during the period 2013 to 2021. Figure 7 shows the locations of these incidents. Because the same coordinates were used to represent all incidents that occurred in the same city, every single point shown on the map could represent multiple incidents. Different shades of green (from light to dark) are used to indicate incident frequency in that city. As can be seen from the figure, most of the incidents aligned well with the inferred route, except those in Arkansas, Mississippi, and Alabama. Because limited Flickr photos were taken in these three states, the inferred routes were incomplete. However, according to the frequency category, these missed incidents had low frequencies. Most of incidents occurred only once on the missed oil route segments. In summary, among 338 incidents, less than 6% (19 incidents) were not in the surrounding area (i.e., the same city) of the inferred routes, indicating the potential coverage and accuracy of the crude oil routes reconstructed using Flickr photos.
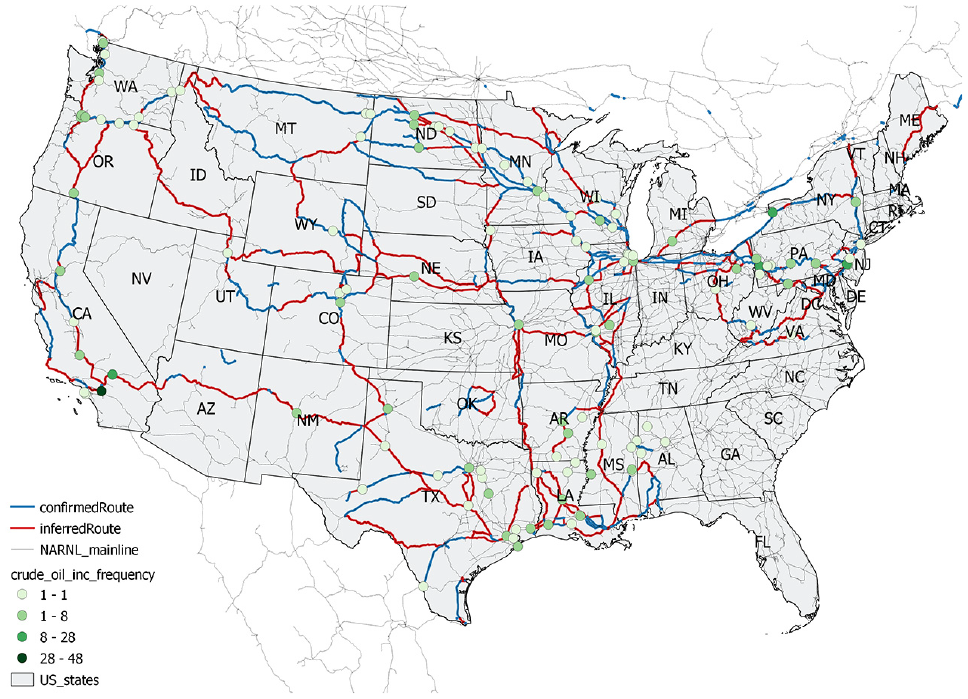
Crude oil incidents on railway.
The missing 19 incidents were mainly located in the states of Texas, Arkansas, Louisiana, Mississippi, and Alabama. Because fewer Flickr photos were taken in these states, the routes were mostly inferred based on crude oil train terminals. The current route-inferring algorithm connected the broken railroad segments that the crude oil train terminals and Flickr photos were on, which did not fully utilize the O-D information embedded in the rail terminal dataset. In future studies, we will exploit the O-D information to improve the performance of the inferring algorithm, especially in those states with fewer public photos. In addition, the crude oil accident data points were used to validate the inferred routes in this study. In future, they will be combined with the Flickr photos and crude oil terminal dataset to uncover more hidden routes.
The complete crude oil lines identified in this study traversed 183 of the 384 U.S. metropolitan areas. The crude oil trains were also found running along the Mississippi-, Susquehanna-, and Hudson Rivers, all of which are important water resources in their respective neighborhoods. With the crude oil trains passing through densely populated urban areas, concerns about community and transportation vulnerability have been raised. For instance, several Flickr photos witnessed the running of Bakken crude oil trains under a 100+ year-old tunnel in downtown Seattle ( 30 ). The businesses, urban traffic, and people who work and live in that area are therefore highly vulnerable to the volatile crude oil flowing underground. However, by combining historical incident data, population data, as well as other data sources such as crude oil movement volumes, risk analyses can be performed to assess the potential threats that crude oil trains bring to a population and its surrounding environment. This will be one of our key research directions going forward.
Public Map
Because railroad companies are unwilling to share their oil train operation information, there are limited public data sources available. In 2015, the WSJ collected data from State Emergency Response Commissions and mapped the counties that are traversed by trains carrying Bakken crude oil ( 5 ). Figure 8 gives an overview of the map.
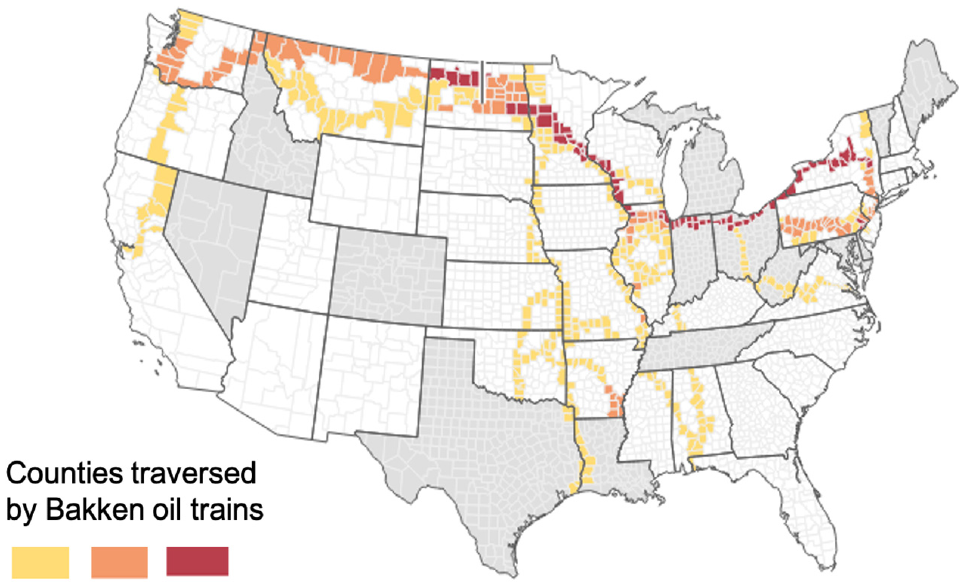
County-level routes of Bakken crude oil trains ( 5 ).
In comparing Figure 8 with Figure 6, both consistencies and inconsistencies were identified. Our observations are summarized as follows:
The complete lines of the North Dakota to the East Coast corridor and the North Dakota to Washington to California corridor were correctly identified. Based on Figure 8, these rail transportation lines have the highest Bakken crude oil train volumes (colored orange and red).
Another rail line from North Dakota to Texas was mostly well aligned with the inferred routes, except for the branch lines in Kansas, Oklahoma, Missouri, and Arkansas. Very few Flickr photos were taken in these four states, which limited the route-inferring accuracy. However, Figure 8 shows that the crude oil train volumes traversing these states were low (colored yellow). In addition, Figure 7 shows a total of 18 accidents that occurred in these four states. Among all the incidents, the six that took place at the border of Kansas and Missouri, and the 11 that occurred within Arkansas were aligned with the inferred routes. Only one incident that occurred in Arkansas was not on any of the inferred routes. This potentially indicates that these missing branch lines transport lower crude oil volumes than other busy rail lines, which results in fewer accidents.
The railway lines within the states of Mississippi and Alabama were not identified, owing to the same data limitation pointed out above. Figure 7 shows that only three incidents occurred near the rail lines in Mississippi and Alabama, indicating relatively small crude oil train volumes traversing the rail lines.
Note that the county-level route shown in Figure 8 is only a subset of the complete crude oil routes: they only contain those crude oil routes that originated from Bakken crude oil production. Therefore, some inferred rail routes, such as the rail lines connecting California and Texas (Figure 6), were not shown in Figure 8.
Conclusions
The boom in domestic shale oil production has benefited U.S. energy but it also brings challenges and vulnerabilities with regard to transportation. The safety issues involved in moving shale oil by rail has gained much attention from the public. Identifying the routes taken by crude oil trains is therefore critical to examining the potential risks and safety concerns of the public. However, this information is typically not accessible by the public. Given this situation, our research utilized an unconventional approach to identifying crude-on-rail routes with information gathered online (Flickr website). The routes were further identified with an inferring methodology developed for this study. Data sources including crude oil incidents and a public map were used to verify the inferred routes. The study results showed that over 96% of documented crude oil incidents were located in the surrounding areas of the inferred route, suggesting high coverage and the potential accuracy of the inferred routes. Moreover, crude-on-rail flows and routes are subject to change with respect to new oil fields and changes in market demands. With the proposed method, route changes could potentially be tracked and identified by leveraging the latest user reports. The network developed in this study could be a valuable source of information for transportation planners at different regional levels (e.g., city, county, and state), which could be utilized to improve their emergency management systems. The map developed could also be used to assign crude oil O-D volumes onto the network and estimate crude oil movement frequencies for better decision making.
With the inferred routes, this study has established a good foundation for several crude oil train-related studies, such as population at-risk analyses and environmental risk assessments. It was found that crude oil trains tend to pass through major cities with dense populations and areas comprising several major water resources. The identified routes traversed 184 of the 384 metropolitan areas of the United States. Therefore, one of our future research directions will be to analyze the population and environmental risks associated with oil trains by incorporating other data sources, such as historical crude oil incident-, population-, and crude oil movement data.
A key limitation of this study was that the crude-oil-train photos on the Flickr website may not cover all “the corners” of crude-on-rail routes, that is, there could be some areas where train enthusiasts rarely venture or take photos. Were no photos captured in selected areas, the inferring process applied would not have had the required information to generate associated routes. Therefore, it is possible that certain routes were not covered in this study. Future research could incorporate additional public datasets to uncover such “hidden” routes. A few relevant public datasets are listed here:
Crude oil incident data published by PHMSA ( 3 ). The incident data were used as a validation dataset in this study. It could also serve as a complementary dataset to the Flickr photos in future research.
Flickr oil train photos. Flickr contains higher numbers of photos tagged with “oil tank” than with “crude oil.” In this study, only train photos tagged “crude oil” were extracted. In future, a filtering method will be developed to extract the crude-oil-train photos from these “oil train” photos to supplement the existing datasets.
Railroad Picture Archives and other public figure archives. Railroad Picture Archives (http://www.rrpicturearchives.net/default.aspx) contain over 2,500 photos with “crude oil” in their title or description, as compared to around 1,300 photos on Flickr. Although the archive might have better coverage, it provides location information at a lower resolution (city level). How this dataset could be linked to the railroad network will be the main issue to be resolved before incorporating it into the existing dataset.
Social media data. Social media data such as Twitter (https://twitter.com) data will also be explored in the future to determine whether they contain any geotagged crude oil train information.
Despite this limitation, the findings from this study could help policy makers and transportation planners to improve situational awareness and allow better-informed decisions to be made, particularly on issues associated with confirmed crude-on-rail routes.
Footnotes
Authors’ Note
This manuscript has been authored by UT-Battelle, LLC, under contract DE-AC05-00OR22725 with the U.S. Department of Energy (DOE). The U.S. government retains and the publisher, by accepting the article for publication, acknowledges that the U.S. government retains a nonexclusive, paid-up, irrevocable, worldwide license to publish or reproduce the published form of this manuscript, or allow others to do so, for U.S. government purposes. DOE will provide public access to these results of federally sponsored research in accordance with the DOE Public Access Plan (![]() ).
).
Author Contributions
The authors confirm their contribution to the paper as follows: study conception and design: S.-M. Chin, Y. Liu, J. Chen; data collection: Y. Liu, J. Chen; analysis and interpretation of results: Y. Liu, J. Chen, M. Uddin, S.-M. Chin; draft manuscript preparation: Y. Liu, J. Chen, M. Uddin, H.-L. Hwang. All authors reviewed the results and approved the final version of the manuscript.
Declaration of Conflicting Interests
The authors declared no potential conflicts of interest with respect to the research, authorship, and/or publication of this article.
Funding
The author(s) disclosed receipt of the following financial support for the research, authorship, and/or publication of this article: This research was sponsored by the U.S. Department of Energy under contract DE-AC05-00OR22725.