
Abstract
Numerous lawsuits have been filed against Uber and Lyft for lack of disabled accessibility of the transportation service they facilitate, with some of the lawsuits focusing on wheelchair accessibility. The paper investigates accessibility from the perspective of wheelchair users and examines their perceptions, experiences, and preferences. Some of the experiences of wheelchair users have been documented in grey literature. The study investigates these in addition to dimensions that are currently unexplored: their perceptions and preferences. A survey of 341 wheelchair users in the U.S. was conducted to understand general trends and patterns. Data collected from 224 complete and 117 partial responses were analyzed using descriptive statistics and linear and logistic regressions. The findings indicate that more than 50% of respondents were satisfied with the service, but nearly 40% experienced service denial. Almost half of those without Uber or Lyft experience perceive Uber and Lyft as a viable means of transportation. The study also showed that the propensity to be an Uber or Lyft user is associated with type of wheelchair, having access to a vehicle, and level of education. The purpose of the study is to bring to the fore the lived experiences of wheelchair users by taking a larger sample than anecdotal references in media reports—where most of the current debate on this topic resides—and to gain new insights. The study fills the gap in academic literature by developing a new knowledge. It also outlines recommendations relevant for practice and policy considerations.
Keywords
In the last decade, mobility options enabled by smart technologies have entered and entrenched in the transportation landscape. These options—generally described as new mobility or emerging mobility—include transportation hailed by transportation network companies (TNCs) such as Uber and Lyft, e-scooters, and bike- and car-sharing ( 1 ). TNCs connect individuals looking for on-demand rides with drivers who are available to provide transportation service in individually sourced vehicles through smartphone apps ( 2 – 4 ). TNCs are acknowledged by some for bringing a new transportation option while criticized by others for their record on equity issues, including disability accessibility ( 4 ). (“Accessibility” in this study refers to usability by individuals with disability and the focus is on wheelchair accessibility.)
Issues related to wheelchair inaccessibility in TNC-hailed transportation have led to lawsuits against companies across the country and have been reported and documented, mostly in the media and grey literature. Uber and Lyft, the two most common ride-hailing apps, have been criticized for several reasons: lack of wheelchair-accessible vehicles (WAVs) for riders who need to remain in the wheelchair while traveling; poor service for those using non-foldable wheelchairs; unreliability of WAV service; non-equivalent service (e.g., longer wait times for WAV service); lack of assistance from drivers; and inadequate training of drivers ( 1 , 5 – 7 ).
Little academic research has investigated the firsthand experience and opinions of wheelchair users in relation to rides hailed through TNCs ( 1 , 8 ). This presents a challenge to understanding transportation experiences of the disability community about new mobility options and to overcoming barriers, where they exist, to enhance their ability to access employment, education, recreation, and so forth. The study investigates wheelchair accessibility matters in Uber and Lyft hailed service in the U.S. from the perspective of wheelchair users. This aligns with the disability community motto nothing about us without us and asserts the importance of engaging the community as an expert stakeholder in policy work pertaining to the community.
The research question that drives this study is: What are the perceptions, experiences, and preferences of wheelchair users regarding transportation service hailed through Uber and Lyft? Perceptions of persons with disabilities about new mobility options such as Uber and Lyft are hardly researched (1). Neither are their preferences. This study undertakes exploration of perceptions and preferences to expand current understanding of the transportation needs of wheelchair users beyond capturing their experiences. The unique contribution of the study is the attention given to perceptions of wheelchair users.
A survey of wheelchair users with and without experience with Uber and Lyft was conducted to understand general trends and patterns. Participants who have experience with the companies were asked questions pertaining to their experiences and preferences of using these services. Those without experience were asked questions that aim to understand their perceptions of the service and their preferences to use the service. Data was gathered from 224 fully completed and 117 partial survey responses over a period of 5 months.
More than 50% of respondents were satisfied with the service, but nearly 40% reported that they experienced service denial. Almost half of those without Uber or Lyft experience perceive transportation hailed through these companies as viable. The study also found that the propensity to be an Uber or Lyft user is associated with type of wheelchair, having access to a vehicle, and level of education. To address accessibility issues experienced and perceived, both groups of participants indicated that some of their preferred changes are training of drivers on the companies’ platforms and elimination of discriminatory practices.
The purpose of the study is to contribute to making to accessible transportation available to wheelchair users in two ways. Firstly, it helps develop evidence-based new knowledge about the experiences of wheelchair users and existing patterns in new mobility options through social-science research in contrast to what can be learned about the topic from media reports and court cases. Currently, there is limited knowledge on travel behaviors of person with disabilities and work on new mobility and disability is scarce ( 1 , 8 , 9 ). Studies in relation to wheelchair and transport are mostly specific to safety and injury ( 10 ). The study contributes to filling the literature gap as one of the first focusing on wheelchair accessibility and TNCs. Secondly, it outlines policy recommendations for how the companies, regulators, and policymakers can address problems and supports informed policy decision-making on both public-sector policymakers’ and the companies’ sides.
The study is timely. In the U.S., there are 25.5 million individuals, including those with travel-limiting disabilities, potentially facing social isolation because of lack of mobility ( 11 ). As the population ages, the prevalence of disabilities (including those requiring wheelchair use) is expected to increase because of the association between age and disability ( 12 ). This necessitates understanding current accessibility practices in contemporary transportation modes and developing policies that take into consideration the transportation needs of this under-served and growing group. Understanding is key in solving accessibility problems where they exist.
Background
The section discusses transportation accessibility issues that individuals with disabilities experience in traditional modes and TNCs. Throughout the paper, both person-first (persons or individuals with disabilities) and identity-first (disabled persons or individuals) language is used.
Transportation Equity for Persons With Disabilities
Transportation enables access to important activities in life such as employment, education, medical and social services, recreation, engagement in social activities, and more ( 13 ). Disabled people are one of the communities that are transportation disadvantaged ( 13 , 14 ). When the Americans with Disabilities Act (ADA) was instituted in 1990, it was to remove barriers in transportation (and other policy areas) that disabled individuals faced. As a result of the ADA mandate, accessibility of public transportation improved, but there are still many remaining barriers ( 15 ). The National Council on Disability in 2015 reported that the disparity of transportation access between people with disabilities and their non-disabled counterparts has grown since 1998. Even with ADA advancing accessible transportation for this community, the problem of accessibility has not been removed ( 16 ). According to Rosenbloom, “People with disabilities have consistently described how transportation barriers affect their lives in important ways” ( 9 ). Using the 2017 National Household Travel Survey, Brumbaugh found that people with disabilities travel less than their counterparts without disabilities ( 11 ).
In contemporary times, the advancement of technology is bringing changes to the transportation landscape. New mobility options such as TNC-hailed services are permeating cities ( 17 ). Despite that, Cochran and Chatman found that individuals with disabilities have lower utilization of apps such as Uber and Lyft ( 18 ). Access challenges persist, especially for wheelchair users, as the many lawsuits filed against Uber and Lyft in the U.S. indicate.
Wheelchair Users and Transportation Access
According to the American Community Survey (ACS), in 2019, people with disabilities made up 12.7% of the U.S. population, with older-age cohorts constituting a higher percentage of individuals with disabilities. Out of the total U.S. population with disability, 7% are with mobility-related disability. Among these, 68.4% are 65 years and older. While the 2019 ACS does not specify the type of ambulatory difficulty, the 2010 survey estimates wheelchair users to be 3.6 million of the U.S. population ( 19 ).
Wheelchair users are “historically under-served” in transportation ( 7 ). One of the challenges they experience is related to physical barriers in transportation facilities and vehicles ( 20 ). The U.S. Department of Justice describes a wheelchair as a device (manual or motorized) used by individuals with mobility impairment in any place where pedestrians are allowed. Grisé et al. said, “public transport network that is available for a person in a wheelchair can be significantly different from the network available to the rest of the population, because of physical barriers such as stairs in subway stations or inaccessible buses” ( 21 ). Similarly, Transport for London, U.K., found that individuals with walking impairments are the most unable to travel successfully because of long first- and last-mile journeys, stairs in transportation facilities, and challenges at interchange metro stations ( 22 ).
Rosenbloom identified some of the challenges that wheelchair users face in transportation: (1) malfunctioning of devices on transit vehicles; (2) poor training of drivers to handle accessibility features on transit vehicles; (3) drivers declining service because of fear of ability to operate accessibility features; and (4) drivers declining service fearing missing deadlines because of the length of time it takes for some disabled individuals to board a vehicle ( 9 ). In relation to privately operated public transportation, the author also pointed out problems related to taxis. One of them is a lack of availability of accessible taxis either because of unavailability of taxis in a particular community in general, the unavailability of accessible vehicles, or because in some communities the collaboration of accessible taxis with government-subsidized ADA paratransit limits their availability for on-demand service. (ADA-complementary paratransit is a service provided by public transit agencies to persons with disabilities who cannot use the fixed route system.)
Accessibility Issues in TNCs Facing Wheelchair Users
Currently, there is not an extensive academic literature about accessible transportation for persons with disabilities in relation to TNCs, much less on wheelchair accessibility. Most of the debate pertaining to disability and Uber and Lyft is taking place on platforms outside academic literature, in the media and grey literature. Some of the problems highlighted as experienced by wheelchair users include: lack of WAV service in some cities; inequivalent service compared with non-WAV options (e.g., longer wait times for wheelchair users compared with non-wheelchair users); unreliable service; lack of assistance from drivers; and inadequate training of drivers ( 5 – 7 ). In alignment with what is reported in the media, Cochran and Chatman highlighted that, based on their analysis of the NHTS 2017 data, wheelchair users were among those who used Uber and Lyft apps at a lower rate even within the disability community ( 18 ).
Wheelchair-accessible services through TNCs are not available in most places ( 7 ). When the service is available, it is scarce. For instance, in 2018, there were only 554 WAVs out of 118,000 combined vehicles on Uber, Lyft, Juno, and other TNC platforms ( 23 ). TNCs have faced lawsuits in recent years across the U.S. filed by wheelchair users or disability advocates for lack of accessibility to wheelchair users ( 2 , 23 – 26 ). Disability advocates have sued Uber demanding that it comply with ADA ( 27 ). A lawsuit filed in Pittsburgh against Uber alleges that it discriminated against disabled people because of a lack of WAVs in the city and has violated ADA ( 21 ). In cities where this service is not available, TNCs redirect riders to taxi services, leading some individuals to initiate lawsuits against Uber for providing a different type of service to those who use wheelchairs ( 23 ). In 2018, in six of its largest North American markets, Uber started collaborating with a private company, MV Transportation, to provide WAVs service ( 28 ). Similarly, Lyft began a partnership with First Transit in 2019 to provide accessible service for fixed-frame or motorized wheelchair users in San Francisco and LA counties ( 29 ). And yet, since the beginning of the Uber WAV, there has not been any proof whether accessible service has improved ( 7 ).
Other problems experienced by wheelchair users include service denial and driver refusal to assist with stowing wheelchairs or to help passengers transfer from wheelchair to vehicle ( 2 , 7 , 30 ). While manual wheelchairs can be stowed in four-door sedans and those with foldable wheelchairs can ride in UberX or Lyft options, there have been accounts where manual-wheelchair users have been denied service ( 2 , 7 , 19 ). Issues have been raised in relation to driver assistance to disabled individuals, including wheelchair users. Drivers on TNC platform do not receive the training that is mandatory for taxi drivers ( 7 ). Lyft offers online video tutorials on its website, while Uber provides general guidelines on its website about assisting riders with disabilities.
Research Methods
The interest in this study was in understanding general patterns and trends in the perceptions, experiences, and preferences of wheelchair users in relation to travel using TNCs. To accomplish this, the research followed what was done in studies on TNC use in relation to the general public (e.g., Grahn et al. [ 31 ] and Conway et al. [ 32 ]) employing a cross-sectional survey. Creswell and Creswell pointed out that a survey is an economical and time-efficient means of capturing patterns ( 33 ). As mentioned previously, the study aimed to add scientific rigor as well as include a larger number of participants compared with anecdotal accounts in media reports and lawsuits to document the perspective of wheelchair users.
The author surveyed 341 wheelchair users living in the U.S. with purposive and convenience sampling. Employing random sampling techniques would be unaffordable and costly for an exploratory study such as this. The survey was distributed through organizations that serve wheelchair users and others in the disability community and using the author’s professional connections in the transportation industry and social media (Twitter, Facebook, Reddit). Recruitment criteria was as follows. Participants
- must be 18 years and older
- must live in the U.S.
- must be wheelchair users, consistently or sometimes
- must be able to consent to participate in the research
- must travel outside the home using any transportation mode, and
- can be with or without TNC experience.
The author consulted with wheelchair users when developing the survey instrument of structured questionnaire. This honors the motto in the disability community: Nothing about us without us. The consultations with several wheelchair users helped with the use of appropriate language, understanding types of wheelchairs, and learning about wheelchair users’ interaction with the transportation systems, including ridesharing.
The survey consisted primarily of closed-ended questions, complemented by open-ended questions to allow for reflection of individual experiences and to increase the overall validity of the survey. Open-ended questions also helped identify themes not yet discussed in the nascent literature on the topic. To further ensure validity, a pre-test survey of 17 participants was conducted. The focus of the survey was pre-COVID-19 experiences, perceptions, and preferences. This was explicitly mentioned in questions as appropriate.
The sections of the survey reported in the study are the following.
1)
2)
Studies on TNCs in relation to the general public focus on socioeconomic factors, demographic, usage of other transport means, and built environment features. This research uses the above as background and focuses on the qualitative aspect of experience, perception, and preference of wheelchair users concerning rideshare hailed through TNCs. Lawsuits filed against Uber and Lyft around the country and media accounts point to an experience that is not reported to have been encountered by non-wheelchair users. This necessitated the inclusion of other variables—captured in the sections below—to help gain a deeper understanding of underlying issues.
3)
4)
5)
The survey questionnaire was administered online via Qualtrics. A raffle draw was used to incentivize participation. In addition to collecting information for the raffle, the “Prevent Ballot Box Stuffing” feature in Qualtrics was used to prevent repeat responses by the same individuals.
Findings
A total of 344 responses, 224 fully completed and 120 partially completed, were collected between September 29, 2020, and February 15, 2021. Initially, the survey was limited to the Washington, DC, area. Because of low response rate, on October 21, the survey was opened to respondents who live anywhere in the U.S., as can be seen in Figure 1. In total, three responses were eliminated—two duplicate answers and one that did not meet the age requirement to participate. Outliers such as average wait time responses exceeding 300 min were recoded as “missing” in a small number of analyses. The responses of 341 individuals were included in analysis work, and these include: wheelchair users with and without Uber and Lyft experience and those who use manual wheelchairs, powered wheelchairs, or scooters, as can be seen in Table 1, along with other sociodemgraphic data. Stata software was used for analysis work, and the unit of analysis was an individual wheelchair user.
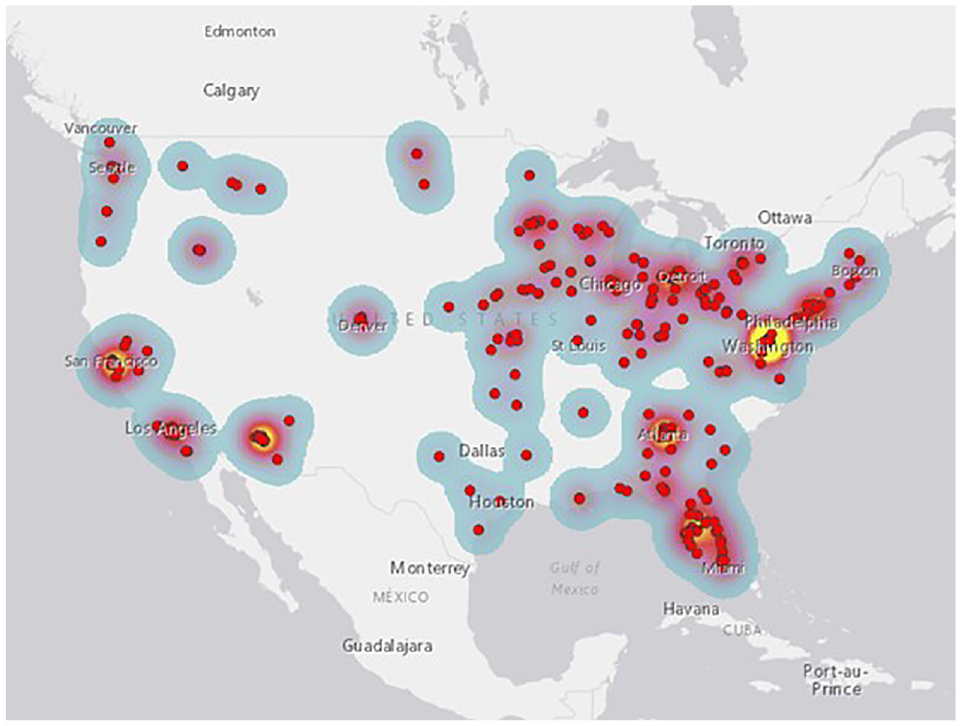
Heat map showing location of respondents.
Socio-Demographic and Travel Characteristics of Survey Respondents
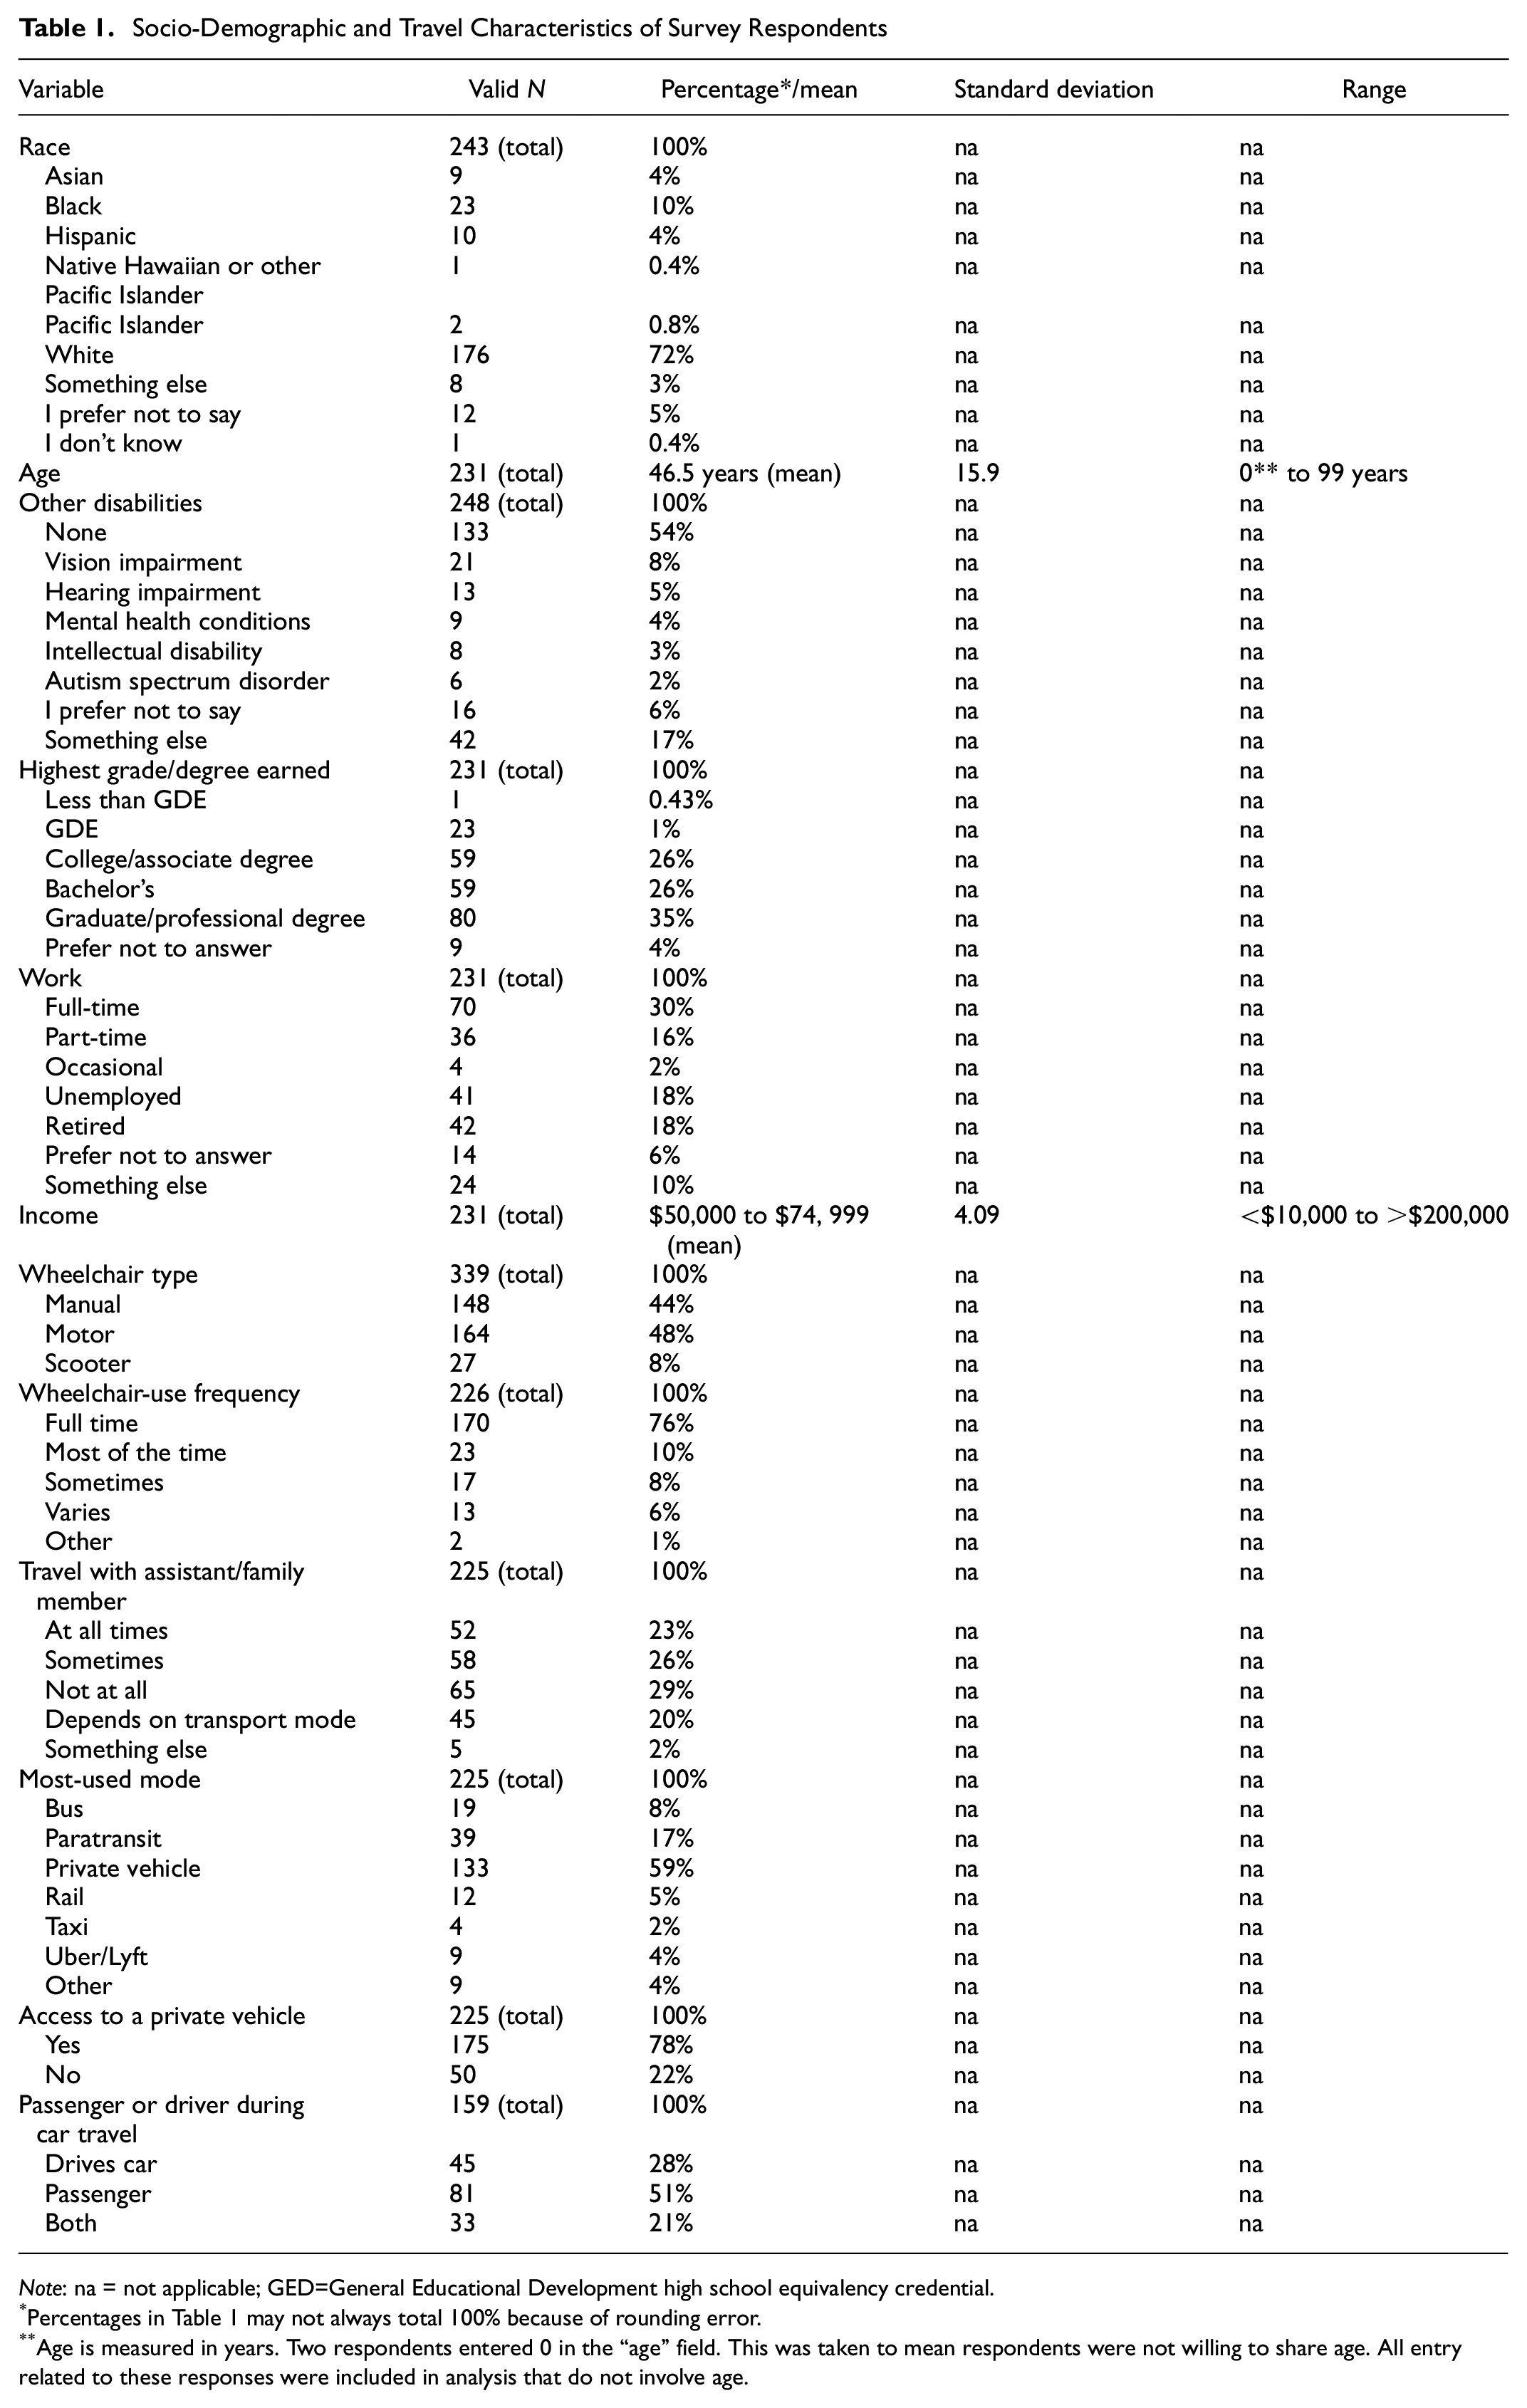
Note: na = not applicable; GED=General Educational Development high school equivalency credential.
Percentages in Table 1 may not always total 100% because of rounding error.
Age is measured in years. Two respondents entered 0 in the “age” field. This was taken to mean respondents were not willing to share age. All entry related to these responses were included in analysis that do not involve age.
As shown in Table 1, majority of the respondents identify as white and female, the average age of the respondents is 46.6 years, the average income of respondents is in the range of $50,000 to $74, 999, 40% of the respondents have other disabilities in addition to disability associated with wheelchair use, 35% have a graduate or professional degree, only 30% work full time, and 76% of the respondents use a wheelchair full time. (The sample is not representative of the U.S. population of wheelchair users. For instance, according to the ACS estimates, disabled individuals in 2019 made $25,270 per year on average. It is important to note that this data was not specific to wheelchair users. The data pertains to individuals with disabilities in general.). Wheelchair users’ commonly used mode is similar to the rest of the population. The majority (59%) use private car for transportation, 23% travel with others at all times, and when traveling in a private car, 51% travel as passengers.
What is Associated With Wheelchair Users’ TNC Utilization?
Most respondents are full-time wheelchair users, and the most common mode of transportation is private vehicle, as can be seen in Table 1. Only 4% of the respondents identified Uber or Lyft as their most common mode of transportation. More than half of the survey respondents are customers of Uber or Lyft, with 69% of these using Uber and 31% using Lyft. Of those who do not use Uber or Lyft, 70% remain in a wheelchair when traveling in a vehicle, while only 33% of those who use Uber or Lyft remain in a wheelchair. In comparison, the number of those using TNCs and transferring into the vehicle is 77% (See Figure 2). This makes sense, as there are more non-WAV cars on the app that can take those who transfer into vehicle instead of remaining in the wheelchair. It also shows the large disparity between users of manual wheelchairs and motorized wheelchairs in TNC utilization that Cochran and Chatman highlighted ( 18 ). Motorized wheelchair users are at a disadvantage because they are unable to take non-WAV options. Non-WAV options can only carry foldable, manual wheelchairs.
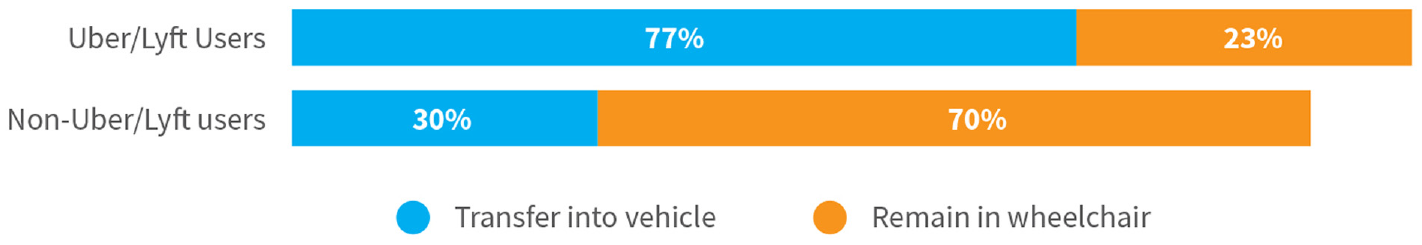
Proportion of respondents who can transfer into vehicle compared with those who remain in a wheelchair during car travel.
In further exploring what is associated with Uber or Lyft utilization, a binomial-regression was conducted using Uber or Lyft usage as a dependent variable and type of wheelchair, age, gender, income, level of education, having other disabilities, and access to a car as independent variables. Motorized wheelchair usage and access to a car are negatively associated with Uber or Lyft utilization while education is positively associated, as Table 2 demonstrates.
Demographic and Travel Characteristics Associated With Uber or Lyft Usage
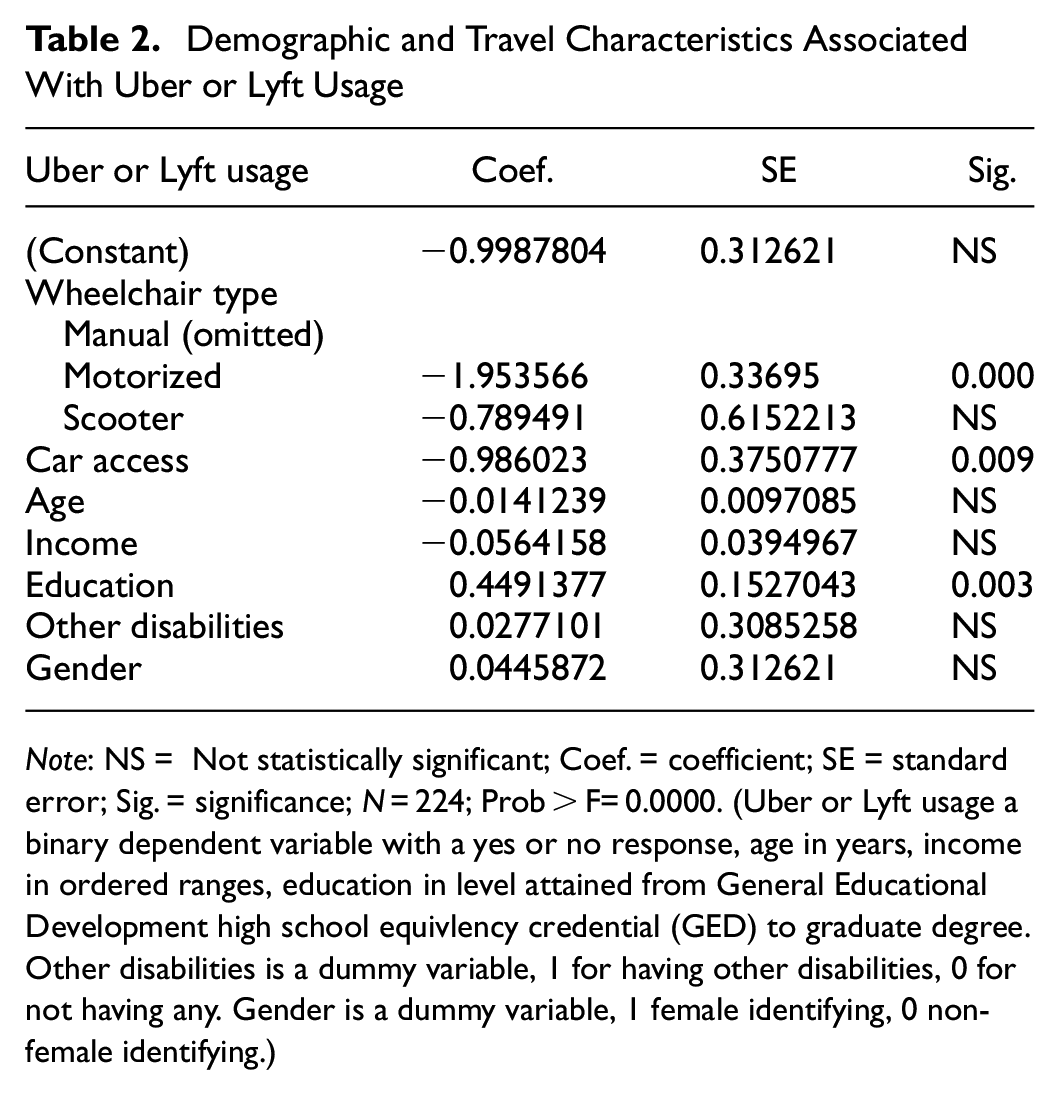
Note: NS = Not statistically significant; Coef. = coefficient; SE = standard error; Sig. = significance; N = 224; Prob > F= 0.0000. (Uber or Lyft usage a binary dependent variable with a yes or no response, age in years, income in ordered ranges, education in level attained from General Educational Development high school equivlency credential (GED) to graduate degree. Other disabilities is a dummy variable, 1 for having other disabilities, 0 for not having any. Gender is a dummy variable, 1 female identifying, 0 non-female identifying.)
How do Non-TNC Users Perceive the Service?
Information About Service, Feelings Toward Service, and Perceptions of Viability
This section focused on respondents who use wheelchairs but are not TNC customers. It examines their perception of the services—a topic which has not been researched in previous studies. While most are motorized wheelchair users for whom a WAV service would be necessary, some are manual wheelchair users. For manual users, not using TNC may be because of having access to other modes of transportation and lack of Uber and Lyft service in their areas. Perception was measured in terms information about the service this group possessed, feelings toward the service, and opinions of viability.
As shown in the Figure 3, majority of respondents (73%) have heard at least one favorable piece of information about the companies’ services. A slightly higher number of respondents (85%) have heard at least one unfavorable piece of information about Uber or Lyft. Respondents were asked how their knowledge of the service affected their propensity to use the service. As shown in Figure 4, based on what they heard, 36% of respondents felt discouraged while only 6% felt encouraged, potentially indicating a stronger influence of unfavorable information compared with favorable information. It is important to note that respondents’ perceptions are to be taken with the understanding that several factors can be at play. These include: personal choices; availability of other means of accessible transportation, including ADA-paratransit; availability of Uber- and Lyft-hailed transportation; provision of Uber and Lyft partnership programs as part of paratransit; and other contextual and individual variables.

Percentage comparison between favorable and unfavorable information about Uber or Lyft that non-transportation network companies (TNC) customer wheelchair users have.
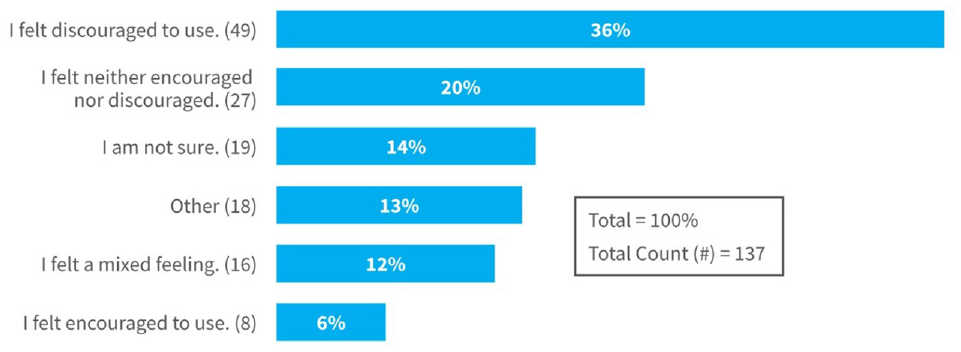
Percentage of responses showing the impact of perception of Uber and Lyft service on propensity to use for non-transportation network companies (TNC) customers.
Contradictory to the above, almost half of non-TNC users in this survey perceive Uber and Lyft service to be a viable transportation option (Figure 5). This may be an indication of the promise that people with disabilities see in services like Uber and Lyft as highlighted by Ruvolo despite existing accessibility challenges ( 1 ).
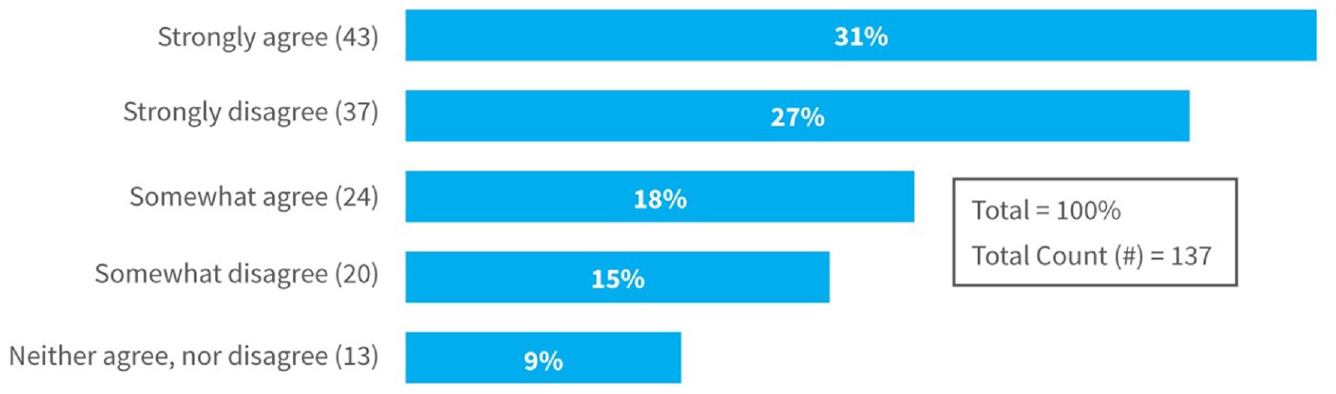
Perception of viability of transportation network companies (TNC)-hailed service as transportation means.
What are the Experiences of Wheelchair Users With Uber and Lyft?
Service Likes, Challenges, Satisfaction, and Wait Times
This section focuses on those who are current Uber and Lyft users. It captures wheelchair users’ interaction with Uber and Lyft by examining their experiences. The study found that the top three traits that respondents like about Uber and Lyft service are availability of price information before booking a ride, door-to-door service, and convenience. Lack of accessible rides is the most common challenge identified by wheelchair users, followed by driver cancellation, and very long wait times. Figure 6 demonstrates that over 50% respondents are either extremely satisfied or somewhat satisfied. Those that are extremely dissatisfied make up the smallest proportion at 9% as can be seen in Figure 6. A linear regression was conducted to further understand associations with service satisfaction of age, income, education, gender, traveling with assistant, and wheelchair type. The overall regression model did not significantly predict the outcome (F (8,101) = 1.65, p = 0.1190). A chi-squared test conducted to see whether there is any difference among the three wheelchair types in relation to satisfaction with the service showed no statistical significance (chi-squared(8) = 6.158, p = 0.630).
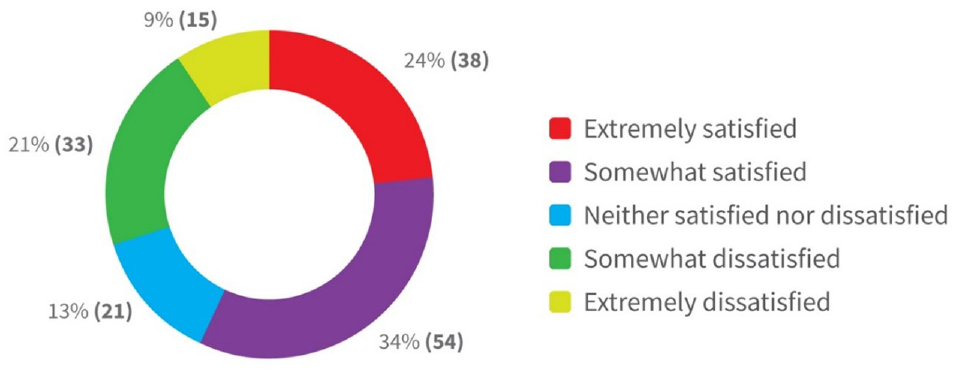
Percentage of response rating level of satisfaction.
Survey respondents identified long wait times as the third most common challenge they experience. Long wait times for riders in a motorized wheelchair who need WAVs is a challenge, as indicated by the San Francisco Municipal Transportation Agency Taxis and Accessible Services Division ( 7 ). In Toronto, Young and Farber found wait time for Uber WAV is longer than other Uber options ( 35 ). Similarly, Hassanpour et al. found longer wait time for Uber WAV in Oregon ( 36 ). This survey found, on average, those in motorized wheelchair experienced twice longer wait time than those in manual wheelchairs who can rides in sedans. A mean wait time for foldable wheelchair users is 17 min (n = 76, R [1,60]). Mean wait time for motorized wheelchair users is 33 min (n = 42, R [5,300]). Wait times in this study are nationwide, while in Young and Farber, and Hassanpour et al., they are citywide ( 35 , 36 ). Two-tailed T-test showed the significance of the difference (t = −2.6968, df = 126, p = 0.0080).
Service denial by drivers is another challenge wheelchair users encounter ( 7 ). This study found that 37% of respondents experienced service decline or denial at least sometimes while 63% never experienced any service decline, as Figure 7 demonstrates. Service denial is reported by users of all wheelchair types.
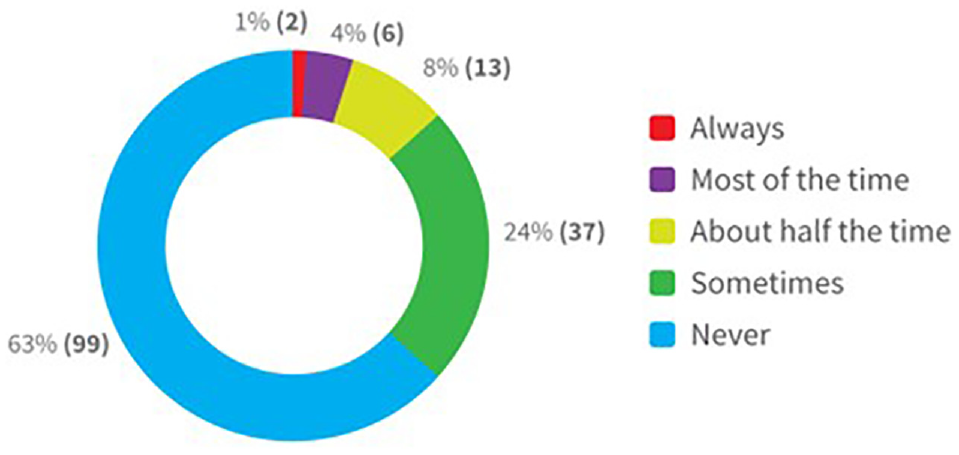
Service decline by drivers.
What are Wheelchair Users’ Preferences?
Driver Traits and Driving WAVs on Uber and Lyft
The section applies to wheelchair users with or without Uber or Lyft experience. Questions that aimed at understanding preferences were presented as open-ended questions. Respondents were asked to identify what driver traits they prefer based on what they experienced or heard. The responses entered in the text-entry fields were recoded into six values shown in Figure 8. Responses categorized in “sensitivity” include patience, non-discriminatory attitude, understanding the needs of wheelchair users, and not asking intrusive questions. The “soft skills” category includes traits such as being polite, friendly, and courteous. Traits categorized in “hard skills” include the ability to use accessibility devices in the van, knowledge of wheelchairs, and the ability to operate vehicle ramp. The category “other traits” includes preferences for background check and ability to speak English. “Sensitivity” category is the largest proportion of responses at 25%. The category “more than one trait” is the second most common response at 23%, pointing to the multitude of preferences that would improve experiences for wheelchair users.
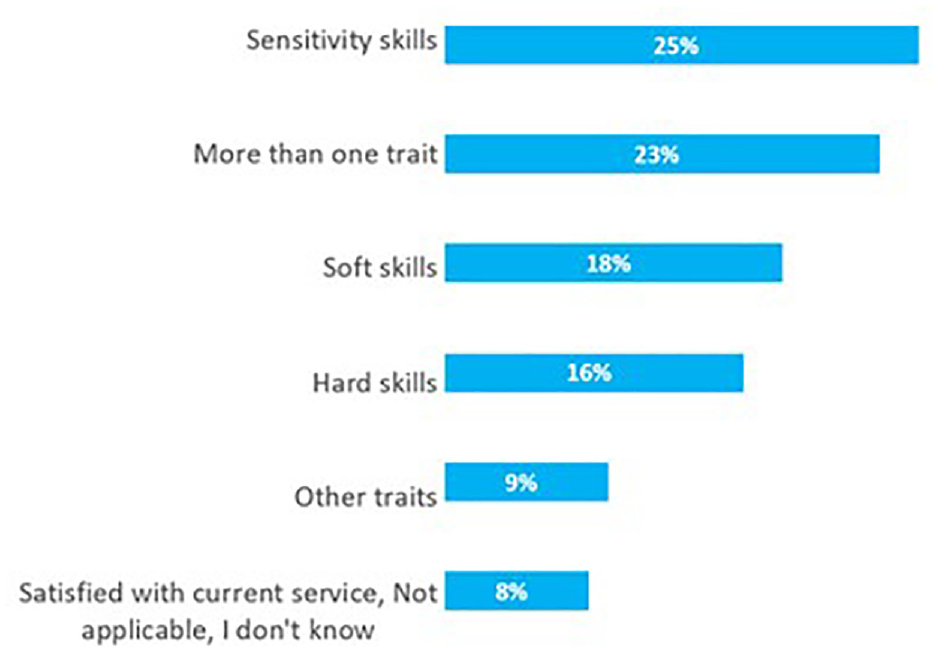
Preferred driver traits compared with existing conditions.
WAVs are in short supply on the Uber and Lyft apps. One of the reasons the companies mention to explain the shortage is lack of availability of WAVs in the community from which to recruit ( 7 ). A question in the survey asked whether participants (TNC users and non-users) would drive on the Uber or Lyft platform, if they had a WAV, to increase availability of WAVs on the apps. Figure 9 illustrates that more than half of respondents said they would not drive on the Uber or Lyft platform. Those who responded “no” received a follow-up open-ended question asking for their reasons.
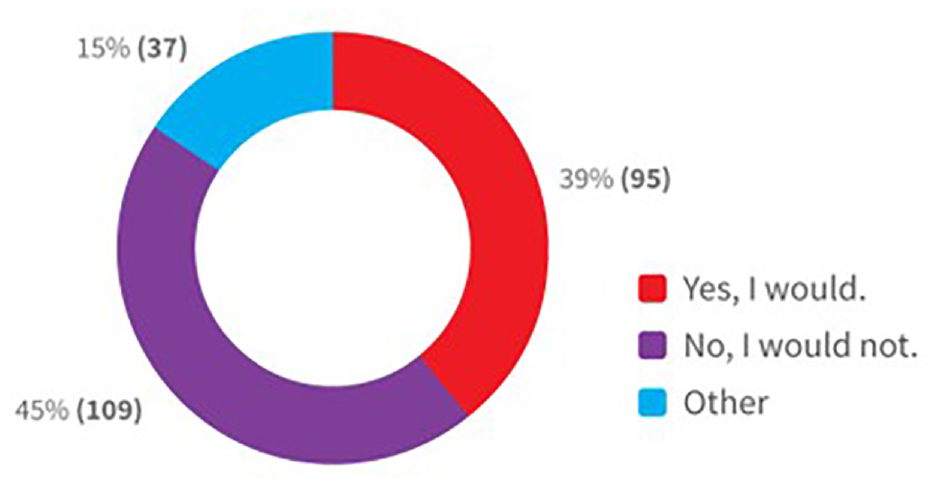
Willingness to drive on the Uber or Lyft given ownership of wheelchair-accessible vehicle (WAV).
The responses were coded into five categories, as shown in Figure 10. The most common reason (33%) for preferring not to drive on the Uber or Lyft platform is inability to drive or not having a driver’s license. The second most identified reason included miscellaneous reasons such as concern for liability, not wanting to have strangers in a personal vehicle, and lack of time.
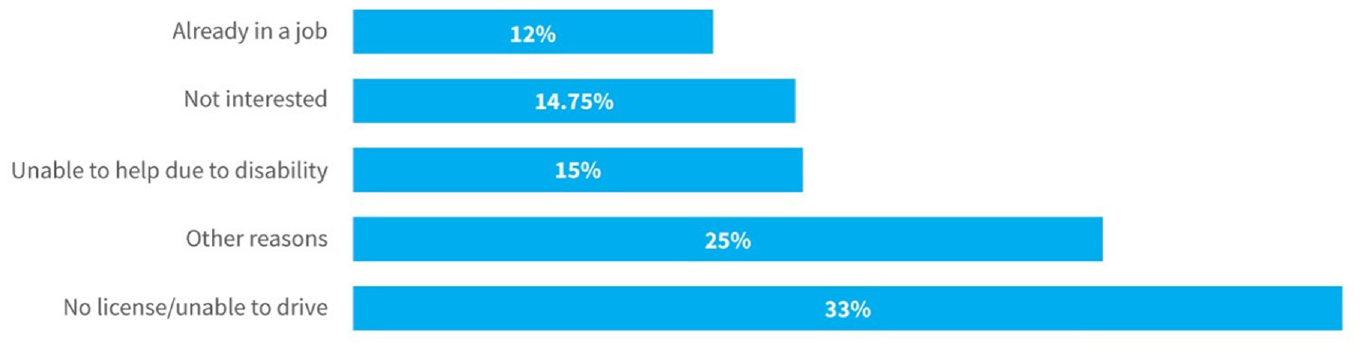
Reason for not preferring to drive on Uber and Lyft.
Discussion
The findings provide information on general travel patterns, document experiences of wheelchair users in relation to TNCs, and help create a better understanding of accessibility challenges. The research question that framed the study was: What are the perceptions, experiences, and preferences of wheelchair users regarding transportation service hailed through Uber and Lyft? While existing literature does not discuss perceptions and preferences, some of the study’s findings concerning experience confirm existing literature while others provide new insight.
TNC Utilization
A majority (77%) of those who currently utilize these services are manual wheelchair users. The study also found that TNC usage is negatively associated with motorized wheelchair use. Taken together, these findings confirm what is reported in the literature that WAV service has limited availability and that motorized wheelchair users are under-served (e.g., Reed [ 2 ], San Francisco Municipal Transportation Agency Taxis and Accessible Services Division [ 7 ], Brault [ 19 ], and Velho [ 20 ]). Some manual wheelchair users in this survey indicated that they are not Uber or Lyft users. Given that they can ride non-WAV vehicles, one explanation for why they are not current customers of the companies could be either they own their own vehicles, have access to a car, or live in an area where Uber or Lyft services are unavailable.
Perceptions
Most respondents who are not currently using Uber or Lyft have heard favorable and unfavorable information about these services, with slightly more respondents having heard at least one piece of negative information. This strongly implies that wheelchair users who do not use Uber or Lyft currently are familiar with these services. Respondents also said they felt discouraged from using the service based on the information they have. The most plausible explanation for this finding is having negative information about the service, despite possessing positive information as well, could discourage service utilization. Despite that, almost half of wheelchair users perceive the service to be a viable transportation option. These two seemingly contradictory findings may be explained by the idea that, while wheelchair users have knowledge of aspects of the service that make it inaccessible to them, they perceive the concept of on-demand mobility through Uber or Lyft as viable. As highlighted in Ruvolo, persons with disabilities see the promise in the service ( 1 ).
Experience
Almost 40% of respondents in the study experienced ride declines despite wheelchair type, at least sometimes. This confirms existing literature (e.g., Reed [ 2 ], San Francisco Municipal Transportation Agency Taxis and Accessible Services Division [ 7 ], and Independent Living Research Utilization [ 30 ]). WAVs are fitted with accessibility features—that there is service denial for riders requesting WAV service strongly implies the accessibility of rides does not end with providing a WAV. Unsuccessful rides can be the result of malfunctioning of accessibility features for a particular ride and interaction between driver and rider. For rides in non-WAVs, as opposed to those that take place in WAVs, the chances of decline can be explained because of discretionary decisions involved in the interaction between a manual-wheelchair user and a driver. Some reasons could be drivers unable to lift or fold chair, no room for a wheelchair, and deliberately “failing to find rider.” Unless the rider specifies, drivers find out about the rider’s wheelchair use only during the face-to-face interaction. The shortage of WAVs reported in San Francisco Municipal Transportation Agency Taxis and Accessible Services Division, Brault, and Taft is reflected in the study as the most common challenge riders who use wheelchair experienced ( 7 , 19 , 23 ). It also confirms what San Francisco Municipal Transportation Agency Taxis and Accessible Services Division, Brault, and Taft highlighted that those that require WAVs wait longer compared with those who use manual wheelchair and can request rides in four-door sedans ( 7 , 19 , 23 ).
Respondents identified the availability of price information before confirming rides to be the most popular reason why they like the service. Given the average income of persons with disabilities is lower than the general public ($25,270 for disabled individuals and $37,262 for non-disabled individuals, according to the ACS 2019 estimates), this finding reflects the effect of income on transportation consumption. This study obtained evidence that, while there are accessibility issues, more than half of respondents are satisfied with the service—part of wheelchair users’ experience not highlighted in literature, to which this study uniquely contributes.
Preferences
Given the discretionary element involved in the service, interaction with drivers is an important dimension to understand. Wheelchair users identified improved sensitivity training for drivers to be the most important change they prefer to see. This strongly suggests that successful accessible rides are a function of accessibility of service and proper training of drivers for skills and, moreover, sensitivity.
Uber and Lyft have stated that one of their problems is recruiting private owners of WAVs to drive on their platforms. San Francisco Municipal Transportation Agency Taxis and Accessible Services Division found that wheelchair users who own WAVs are disinclined to drive on the apps for fear of damaging their vehicles, which are customized to fit their disability needs ( 7 ). The findings in this study highlight that there are more reasons for the lack of success in the companies’ recruitment. The lack of wheelchair users’ ability to drive or inability to assist another wheelchair are some of them as this study found. (It is important to note the varying degree of disability among wheelchair users and whether or how they can assist another wheelchair user.) The lack of ability to drive strongly indicates, despite private vehicles being the common mode of transportation, wheelchair users travel as passengers and that there is demand for on-demand service like TNCs. Moreover, the inability to drive or assist indicates the limited pool of WAV drivers available for Uber and Lyft recruitment.
Limitations and Future Research
There are several limitations in this study. The sample is not representative: the findings cannot be inferred to the entire population of wheelchair users in the U.S. The COVID-19 pandemic had an impact on the data-collection process. Disabled people are a hard-to-reach participant group made more unreachable due the pandemic that limited avenues to recruit for research. Recruitment of participants took place through online means only—excluding recruitment at events and through other means. During the pandemic, congregate activities such as wheelchair sports were discontinued. In addition, people with disabilities were heavily affected by COVID-19 with implications for their availability to participate. This limited the sample size, which in turn limited the type of analyses conducted.
Future research examining this topic can benefit from including a larger sample size by using paid services that recruit research participants, such as Qualtrics and Mechanical Turk. Making the survey available in other languages in addition to English and utilizing diverse methods of recruiting to include participants from disadvantaged communities within the disability community is recommended. Future studies also would benefit from having the survey available in physical copies as well: as Anderson and Perrin indicated, people with disabilities may have low technology utilization ( 37 ). The focus of the study has been solely on wheelchair users. A future research direction for this topic is a comparative study between wheelchair users and non-wheelchair users’ perceptions, experiences, and preferences in relation to TNCs.
Conclusion
Wheelchair users who are not customers of Uber and Lyft are familiar with these companies’ services and perceive them to be a viable transportation option. This indicates acceptance of the service as well as demand for it. With more than half of the respondents satisfied with the services, Uber and Lyft seem to be filling a transportation gap for some wheelchair users. Long wait times, service denial by drivers, and lack of WAVs are some of the realities wheelchair users encounter in utilizing these services. They prefer properly trained drivers to use the service. Although promising, in their current state, TNCs provide a tiered system even among wheelchair users; motorized-wheelchair users are at a disadvantage with how TNCs are currently configured and understood.
The study identified several issues surrounding wheelchair accessibility in transportation service hailed through TNCs. It highlighted elements of the service that are working for some. It identified that, for others, TNCs offer limited and unequal transportation opportunity while, for some others, their service is unavailable. It is important to note that the inequity wheelchair users experience in new mobility options is not new in the transportation landscape. It simply is an extension of the challenges wheelchair users had been experiencing before the arrival of Uber and Lyft. The paper documents their experiences, perceptions, and preferences concerning TNCs to contribute to how challenges identified can be addressed through the policy recommendations outlined below.
Policy and Practice Recommendations
Cities and transit agencies often provide service to persons with disabilities through ADA paratransit, which is often more expensive to operate than other non-rail transit modes. These agencies have begun collaborating with Uber and Lyft to supplement ADA partransit as alternative services, as cities such as Boston are currently doing. The study demonstrated that, among wheelchair users in the U.S., there is some level of satisfaction with the service and the perception of its viability even among those who are not current users of Uber and Lyft. There is an opportunity to diversify public transportation offerings by using different partnership models with these comapnies to suit the needs of users. Given the inaccessibility challenges motorized wheelchair users face, it is important to ensure the availability of enough WAVs on partnership programs. Some municipalities have included accessible taxi programs in TNC partnership programs to fill that gap. When doing so, comparability of these taxi programs with TNCs is an important element to consider. This necessitates understanding TNC features that wheelchair users appreciate and the challenges they experience when using their services.
City governments can play a role in training drivers on the Uber and Lyft platforms for appropriate skills, or regulate requirements for these companies to offer training. Cities offer training for taxi drivers but not drivers on the Uber and Lyft apps. As noted by survey respondents, lack of training of drivers is a concern for wheelchair users. In addition to empowering drivers with appropriate hard and soft skills and sensitivity training, both government regulators and TNCs need to put in place stronger anti-discrimination policies to eliminate service declines and other discriminatory behaviors that keep disabled people from using available service. Current anti-discrimination policies seem to have fallen short, as wheelchair users continue to experience discrimination as this study highlighted.
There is an undeniable shortage of WAVs on the Uber and Lyft platforms. It is important for the companies to recognize that recruiting drivers who use their own WAVs is not a viable option, as this study found. Many wheelchair users—even if they have access to or own WAVs—travel as passengers in private vehicles, travel with an assistant, have disabilities that prevent them from helping passengers in wheelchairs, or do not drive or have a driver’s license. Given these realities, focusing on other alternatives that these companies are purusing to source WAVs, for example, partnering with transportation companies with WAV fleet or with WAV taxis would be a more realistic approach, instead of exploring an avenue that does not promise likelihood ( 28 , 29 , 35 ). It creates a better opportunity to solve the WAV shortage.
Finally, cities can make publicly available TNC data such as WAV requests and completion of rides, WAV wait times, and WAV declines, along with comparable trip information for non-WAV trips in all jursidictions. Currently, the City of New York and Toronto are two of the cities that provide WAV-related data available publicly, while Washington, DC, an important TNC market, does not publish TNC data ( 38 , 39 , 40 ). Cities can benefit from transparency around TNC data for understanding and accountability of any disparity in service to wheelchair users compared with non-wheelchair users.
Footnotes
Acknowledgements
I would like to thank my doctoral research committee, Dr. Tom Sanchez, Dr. Ralph Buehler, Dr. Ashley Shew, Dr. David Bieri, and Dr. Aaron Steinfeld for their support of my work and their invaluable feedback. I would also like to thank the individuals and organizations that helped me distribute my survey during the pandemic.
Author Contributions
The author confirms sole responsibility for the following: study conception and design, data collection, analysis and interpretation of results, and draft manuscript preparation.
Declaration of Conflicting Interests
The author declared no potential conflicts of interest with respect to the research, authorship, and/or publication of this article.
Funding
The author received no financial support for the research, authorship, and/or publication of this article.