
Abstract
The purpose of this study is to optimize the fleet size range of demand responsive transit (DRT) services for a given population density and service area in suburban regions. With the aim to reduce the use of private vehicles in the northern suburbs of Munich, specifically in the counties of Munich, Dachau, and Freising, over 400,000 origin–destination relationships were narrowed down to 349 high car demand inter-zonal relationships in Munich’s northern counties. A survey conducted among residents highlighted distinct mobility patterns and mode choices, revealing longer travel times to public transport services and higher car ownership in suburban areas compared to the city. DRT simulations were conducted at 1%, 2%, and 5% of car demand levels across multiple service areas categorized by area and population density, ensuring that each service area had a connection to a train station. Key performance metrics such as trips served, average detour factor, and average origin wait time were analyzed. Findings revealed that appropriate fleet sizing based on demand and population density is crucial for maintaining high service performance, with smaller areas requiring fewer vehicles and larger, densely populated regions requiring more. The results highlight the effectiveness of DRT in addressing last-mile connectivity and the drawbacks of infrequent bus services, enhancing public transport use, and reducing car dependency in suburban regions. Recommended optimum fleet size ranges for various combinations of service areas and population densities provides a framework for transport planners and authorities for the potential introduction of DRT services in suburban regions.
Keywords
Urbanized cities often reap the benefits of having a better transportation infrastructure compared to suburban areas. The reasons for this disparity include the population density being higher in cities, the presence of greater economic activity, available job activities, and a more comprehensive public transport networks in cities. The public transport system in cities like Munich is characterized by multi-modal integrated transport, consisting of underground trains and radial suburban trains, buses, and trams, followed by last-mile options in the form of micro-mobility—ride sharing e-scooters and bicycles. In contrast, the city’s northern suburbs, namely the counties of Munich, Freising, and Dachau, as shown in Figure 1, face difficulties in achieving the same level of public transport performance. While these counties benefit from their vicinity to Munich, they are often hindered with less frequent public transport services, poor first- and last-mile connectivity, reduced accessibility, and longer travel times in comparison with private transport.
The S1 suburban line, running through Munich Central Station to Freising via Neufahrn, and the S2 suburban line, which connects Munich Central Station to two destinations—Petershausen and Altomünster—both via Dachau, operate with varying frequencies depending on the route segment, time of day, and whether it is a weekday or weekend. On weekdays, S1 runs every 20 min at both peak and off-peak times between Freising–Neufahrn and Neufahrn–Munich Central Station, while S2 maintains a 10-min interval during peak hours between Dachau and Central Station, transitioning to 15–20 min off-peak. On weekends, S1 trains maintain a 20-min interval for most sections but this increases to 30 min between Freising and Neufahrn, while S2 decreases to 30 min for Petershausen–Dachau and 60 min for Altomünster–Dachau during all periods. These suburbs rely on private transport to tackle these deficiencies in public transport services. As per the latest statistics, S1 ranks as the least punctual suburban line in Munich, followed closely by S2 ( 1 ). These two lines have the lowest punctuality rates among all suburban lines in the city, highlighting consistent delays and unreliability compared with the rest of the network.
Figure 1 shows the railway network present in the northern part of Munich and its northern counties. Visible gaps exist between the radial suburban train lines, which are shown in green. In addition, the population spread in the northern counties follows a pattern of being along the locations of the suburban railway lines. While it has been attempted to bridge public transport accessibility in the regions between the suburban lines by using buses that provide feeder services to the nearest train station(s), they are not as frequent, especially in off-peak hours and at weekends. Residents in these suburban regions are therefore prompted to look at alternatives and more reliable means of transport, thus opting to use private cars. Demand responsive transit (DRT) is a flexible and efficient solution that caters to diverse passenger travel needs ( 2 ). It emerges as a promising solution to address these challenges. DRT services operate flexibly and provide transport on demand rather than following fixed routes and schedules. This flexibility makes DRT also particularly suitable for addressing the first-mile and last-mile connectivity issues that are prevalent in suburban areas. By enhancing accessibility to public transport stops and by providing a more reliable means of transport, thereby reducing the reliance on private cars, DRT can play a vital role in promoting sustainable urban mobility.
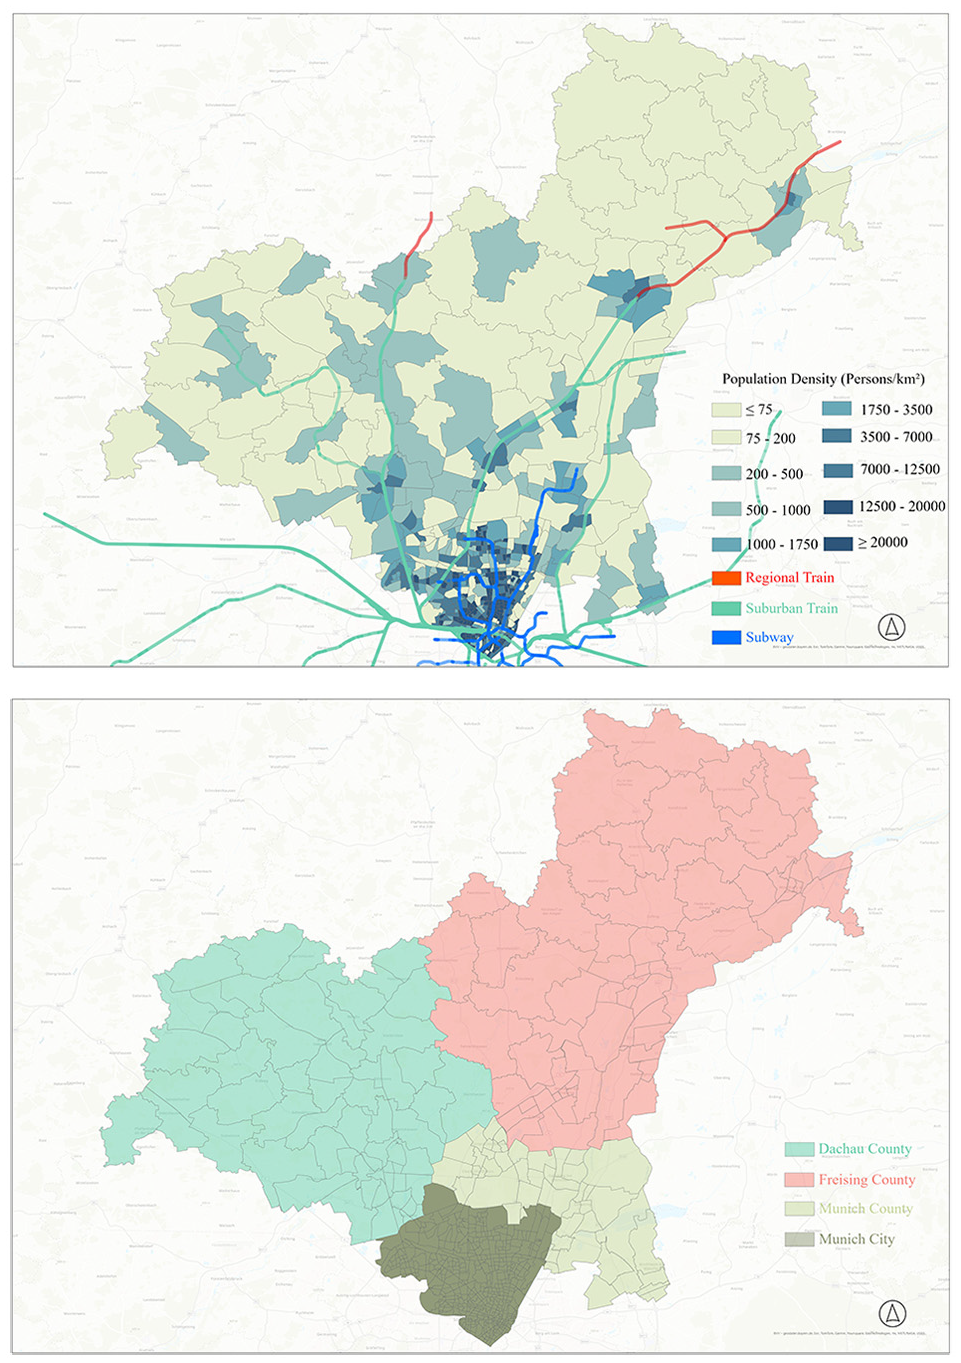
Population density spread and the regions present in the MoveRegioM region.
DRT is a concept that combines the practicality of public transportation, mainly buses, which run on set routes, with private transportation, such as taxis or private cars. Particularly beneficial in low-density areas, DRT can address accessibility shortcomings of public transport systems ( 3 ). The development and the implementation of DRT services, especially for vulnerable users, involves a holistic approach among stakeholders, resulting in effective and useful mobility solutions ( 4 ). Integrating DRT within a multi-modal transport system can enhance accessibility by serving users in previously inaccessible areas ( 5 ). Identifying the shortcomings of the existing public transport and addressing these drawbacks can transform urban mobility by providing tailored and efficient transportation services to a wide range of passengers.
By implementing DRT services to address last-mile connectivity problems and promoting a shift away from the use of private cars and toward more environmentally friendly public transportation choices, this research aims to improve the public transportation accessibility in Munich’s northern suburbs with the potential introduction of DRT services. The study aims to identify the issues faced by residents with respect to public transport, analyze their mobility behavior, and address the shortcomings of the current public transport situation with the help of DRT services. The study then looks at simulating multiple scenarios by varying various parameters that affect the implementation of a DRT service. Finally, the study proposes strategies for the effective implementation of DRT services, considering factors such as the service area, population density, fleet size, and its potential integration with existing public transport networks.
This study utilizes a two-way approach by combining quantitative and qualitative data collection and analysis. A detailed survey was conducted to obtain insights into the travel patterns and mobility behavior of residents in Munich and its northern suburbs. The survey focused on various aspects such as car ownership, frequency of public transport usage, travel times to public transport stops, and residents’ attitudes toward DRT services. This data was then analyzed and incorporated in simulating DRT services in the suburban regions. Simulations were performed to model the potential impact of DRT services. The simulations employed fixed percentages of car demand between zones with the idea of a potential modal shift from using private cars to using DRT services. Multiple potential service areas with varying parameters, namely the service area and population density, were defined. Key metrics such as the percentage of trips served (indicating service performance), fleet size, maximum walking time, and average origin waiting time were analyzed to provide detailed insights. This was done to determine the optimal range of fleet sizes suitable for various combinations of population density and service area size for efficient and effective implementation of DRT services.
The findings of this study are expected to provide valuable insights for urban planners and policymakers in suburban areas. The study’s recommendations for implementing DRT services can serve as a model for other suburban regions facing similar challenges. Improving public transport in suburban areas is crucial for achieving sustainable urban development. The introduction of DRT services in the northern suburbs of Munich presents a viable solution to last-mile connectivity issues and can significantly enhance the overall public transport scenario. This research aims to provide a detailed insight into the fleet size range for a potential service area and the population density of the service area for the potential introduction of DRT services in suburban areas.
Literature Review
DRT services have emerged as a promising solution to address the transportation needs in suburban and low-density urban areas. These services offer a flexible and adaptive alternative to traditional fixed-route public transport, particularly in regions where population density does not justify frequent bus or rail services. Several studies have evaluated the impact of DRT services in various urban and suburban settings. For instance, a study conducted in Hanover, Germany, highlighted the significant demand for flexible public transportation in suburban areas characterized by long distances and inadequate public transport coverage. This demand underscores the potential of DRT services to fill the mobility gaps in such regions ( 6 ). A comprehensive survey of DRT systems reviewed various dial-a-ride problems and recent developments, indicating that DRT can effectively cater to low-density populations by providing tailored transit solutions ( 7 ). This flexibility is crucial for suburban areas where fixed-route systems are often underutilized or economically unfeasible.
The optimization of DRT service areas and operational efficiency has been a focus of recent research. A DBSCAN k-means clustering algorithm was proposed to optimize DRT services between urban and rural areas ( 8 ). This approach effectively reduced operating costs and running times, demonstrating the feasibility of integrating such algorithms into DRT service planning to enhance efficiency. Similarly, another study introduced a data-driven framework for DRT, leveraging mobile data analytics to design optimized services ( 9 ). The case study in Porto, Portugal, showed significant reductions in stop frequency and travel distance, emphasizing the potential for DRT to improve public transport efficiency and sustainability in urban contexts.
Optimizing fleet size is a critical aspect of DRT systems, as it directly influences service efficiency, operational costs, and user satisfaction. Recent studies have employed various methodologies to address this challenge. For instance, a two-stage stochastic programming model was developed to determine optimal fleet sizes for point-to-point shared DRT services, considering uncertain passenger demands and aiming to balance investment with operational revenue ( 10 ). Similarly, a mixed-integer stochastic programming approach to optimize fleet size and allocation in bus transit systems was proposed in another study, integrating autonomous vehicles and accounting for demand uncertainty ( 11 ). In addition, another study investigated fleet sizing and allocation for on-demand last-mile transportation systems, utilizing stochastic and distributionally robust optimization models to handle unpredictable passenger demand ( 12 ). These studies underscore the importance of adaptive fleet sizing strategies that respond to varying demand patterns, thereby enhancing the effectiveness and sustainability of DRT services.
The potential for DRT services to induce a modal shift from private car usage to public transport has been explored extensively. It was found that demographic and trip characteristics significantly influence the susceptibility of residents to adopt DRT services ( 13 ). A study in Zurich observed that while public transport growth potential in the city center is minimal because of high availability and low densification opportunities, outer areas and secondary centers offer significant potential for densification and above-average public transport growth, especially in links with surrounding areas ( 14 ). Addressing last-mile connectivity issues is a primary advantage of DRT services. Research indicates that DRT can significantly enhance the accessibility of public transport by providing convenient connections from transport hubs to final destinations. This is particularly relevant for suburban areas where residents often face challenges in reaching the nearest public transport stops. Studies have shown that DRT can effectively bridge this gap, making public transport a more viable option for daily commutes ( 15 , 16 ). Effective implementation strategies for DRT services involves a seamless integration with existing public transport networks. The importance of improving accessibility in lower-density areas by integrating DRT with traditional public transport was also highlighted ( 17 ). A study in Berlin also performed simulations and observed that the modal shift from private car users to DRT was expected to be around 4% ( 18 ).
In summary, while the literature highlights the significant potential of DRT services to enhance public transport accessibility and address last-mile connectivity issues, most studies focus on urban contexts or generalized frameworks that do not fully address the specific challenges of suburban regions. Existing research often emphasizes theoretical modeling, fleet optimization, and algorithmic approaches in urban environments, with limited attention to the distinct characteristics of suburban areas, such as lower population density, higher car dependency, and unique mobility patterns. This study aims to bridge this gap by integrating insights from a region-specific mobility survey into detailed simulations that account for suburban-specific dynamics. By providing optimized fleet size ranges tailored to various service area configurations and population densities, the study offers practical guidance to transport planners. This dual-method approach not only advances theoretical understanding but also offers an initial framework for transport planners for implementing DRT systems in suburban contexts, where the potential to reduce car dependency and enhance public transport accessibility is often underutilized.
Methodology
The study targeted the northern suburban areas of Munich, specifically the counties of Munich (Landkreis München), Dachau, and Freising. A PTV Visum model named Gesamtverkehrsmodell (GVM) that covers Munich and its surrounding counties was utilized for this study. This model, which is provided by Landeshaupstadt München, Münchner Verkehrs- und Tarifverbund GmbH (MVV GmbH) and Münchner Verkehrsgesellschaft mbH (MVG mbH), was part of the MoveRegioM project, which aims to develop spatially integrated mobility solutions between northern Munich and the counties of Munich, Dachau, and Freising. Consequently, only zones within the MoveRegioM region were considered, reducing the number of zones in the model from 2859 to 639. From these zones, over 400,000 origin–destination (OD) relations for private car trips were generated. The 99th percentile of these OD relations that formed the highest car demand were selected. The OD relations were now narrowed down to approximately 3800. Intra-zonal trips were then excluded to focus on inter-zonal travel. A boxplot was plotted to obtain insights about the OD relations with the highest demand. This is shown in Figure 2, where the median and the interquartile range values of 63.84, 30.25, and 248.6 are shown respectively. The values that were classified as outliers in the boxplot were selected for further analysis because of their significantly high magnitude. Consequently, all values above the maximum whisker’s demand value (248.6) were established as the OD relations with the highest travel demand between the zones. Some 349 such relations were obtained and are plotted as shown in Figure 2.
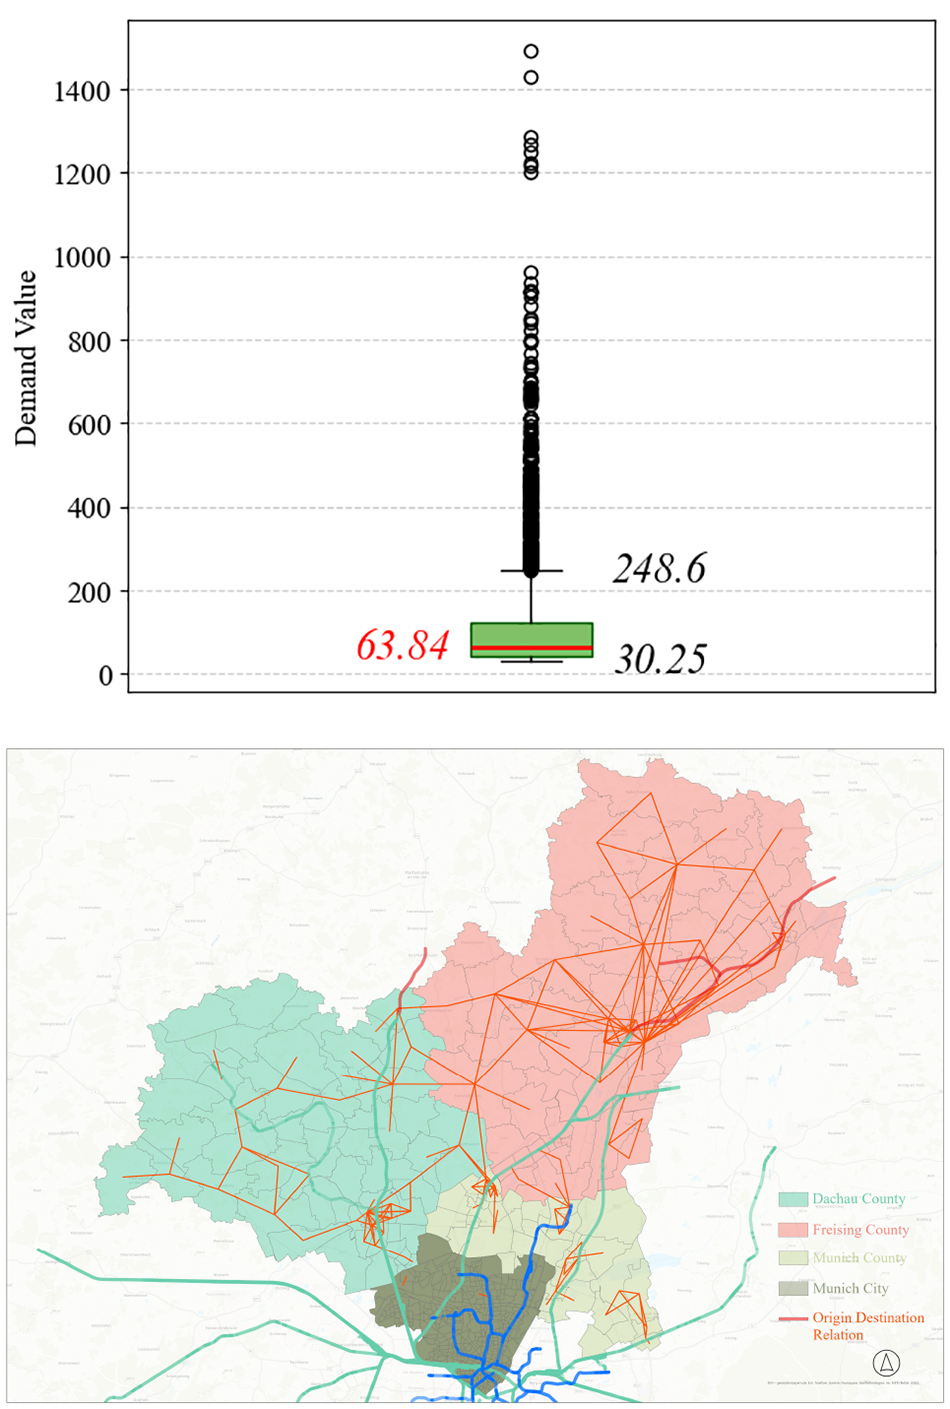
Boxplot of the 99th percentile car demand origin–destination (OD) data and high-demand OD relations in the MoveRegioM region.
In addition, a survey was conducted to gather data on the mobility behavior of residents in Munich and the northern suburban counties. This survey aimed to identify the limitations of the current transportation system in the region and to obtain insights on the response to the potential introduction of DRT services. Since DRT had not yet been introduced in the region, there was a lack of DRT usage data. To simulate demand for the model, it was assumed that the introduction of on-demand services would potentially shift private car users toward using public transport. For simulation analysis, 1%, 2%, and 5% of car demand was allocated as the DRT demand. This range of modal shift from private car users toward using DRT was introduced considering the realistic to optimistic modal shift that is expected with the potential introduction of DRT. The concept of fare was not explicitly addressed in this study, as the proposed DRT service would adopt the existing fare structure used by FLEX DRT services that operate in the southern part of Munich ( 19 ). Passengers are assumed to utilize MVV tickets, which remain valid within their respective tariff zones, ensuring there are no additional charges for the DRT service. This approach simplifies integration with the current public transport system and aligns with the existing fare policies. Furthermore, season tickets and the Germany-wide valid Deutschland Ticket, which is used by almost 19% of the total population in Germany, would also be valid to use the potential DRT service ( 20 ).
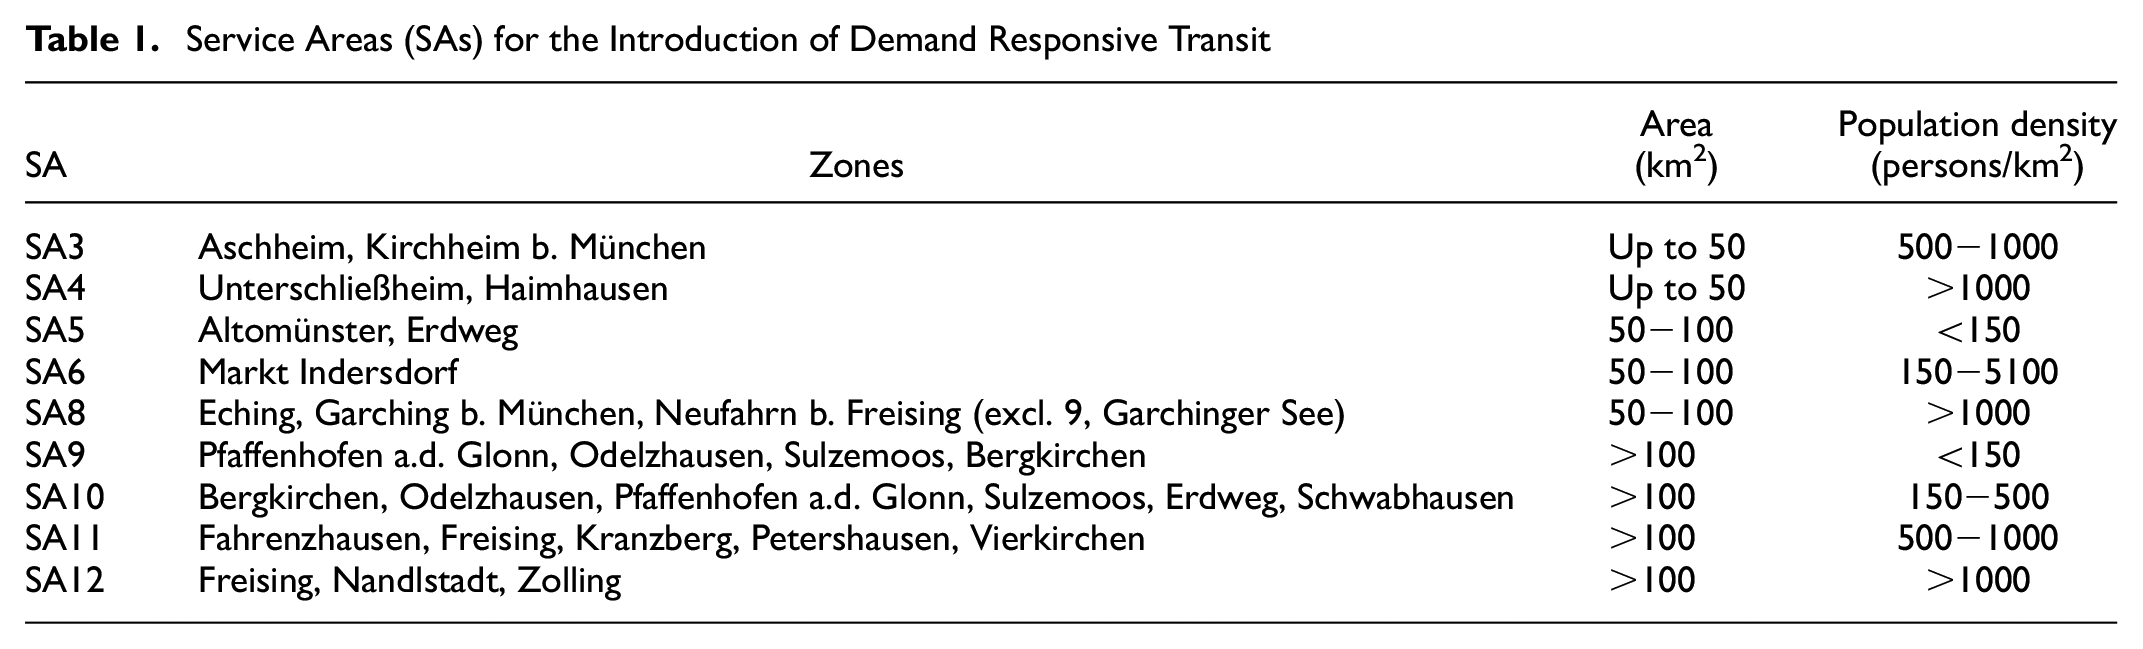
DRT was introduced in areas with significant gaps between suburban railway lines and in zones where the private car demand was high. Each proposed potential service area was guaranteed to have at least one train station, with the aim of introducing DRT services to improve first- and last-mile connectivity. It was also ensured that the zones that were selected encompassed all variations of the existing high demand of cars between the zones, proximity to a train station, service area, and the population density of the service area. Twelve different service areas (SA1–SA12) were proposed for this reason, each representing varied combinations of area and population density. Three service areas were, however, not formed since no suitable service area was formed with at least one connection to a train station. The service areas across the MoveRegioM region are shown in Figure 3. The primary objective was to determine the optimal range of fleet sizes for DRT services, focusing on metrics such as the detour factor and service performance. The zones present in each service area are summarized in Table 1.
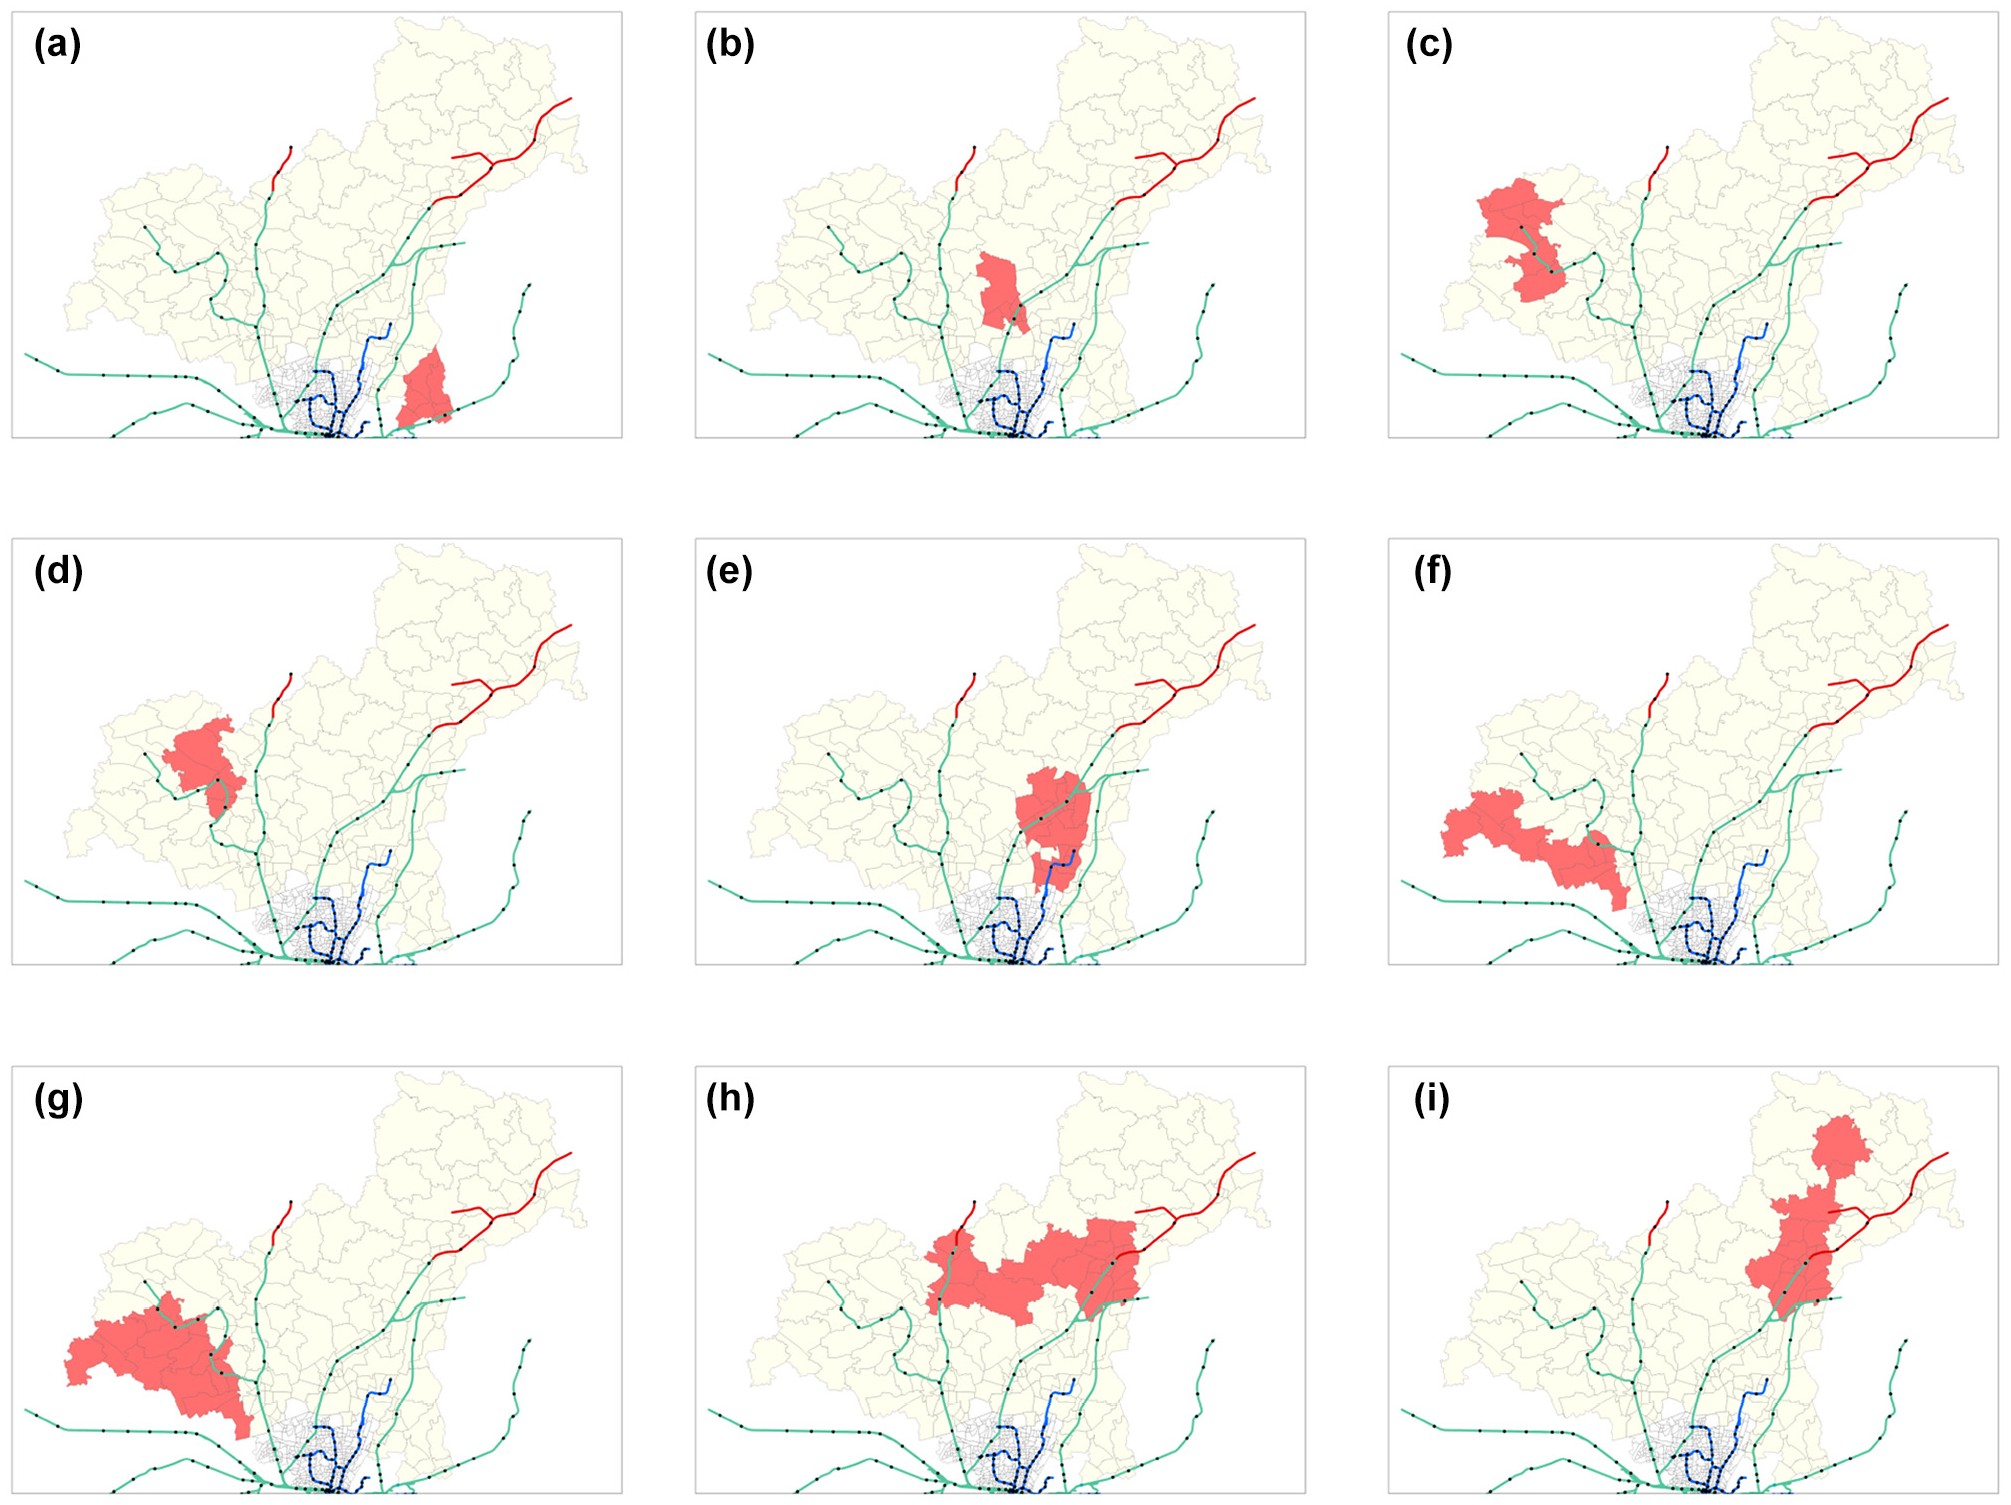
Demand responsive transit service areas across the MoveRegioM region (marked in red); (a) SA3, (b) SA4, (c) SA5, (d) SA6, (e) SA8, (f) SA9, (g) SA10, (h) SA11, and (i) SA12.
Service Areas (SAs) for the Introduction of Demand Responsive Transit
The DRT simulations were conducted across three demand levels—1%, 2%, and 5% of the car demand to account for varying potential usage scenarios. The trips generated with this percentage of car demand formed the trips of the DRT service in the simulations. The service areas were categorized based on the following population density ranges: less than 150, 150–500, 500–1000, and more than 1000 persons/km2. Furthermore, the areas were grouped into three size categories: up to 50, 50–100, and more than 100 km2. This comprehensive categorization allowed for a detailed analysis of the impact of service area size and population density on the performance and efficiency of DRT services. Pick up and drop off points (PUDOs) were placed within each service area. The placement of these PUDOs was assisted by the existing bus stop locations and demographic characteristics to ensure maximum accessibility for users—densely populated areas had a higher density of PUDOs while scarcely populated areas had a comparatively lower density of PUDOs. However, it was ensured that PUDOs were present in every location of a settlement. In addition, holding areas were located accordingly to minimize vehicle inactivity periods. These holding areas were primarily placed centrally within the service areas, thereby enabling vehicles to be readily available for subsequent trip requests. The service area metrics and characteristics are summarized in Table 2.
Service Area (SA) Characteristics and Metrics
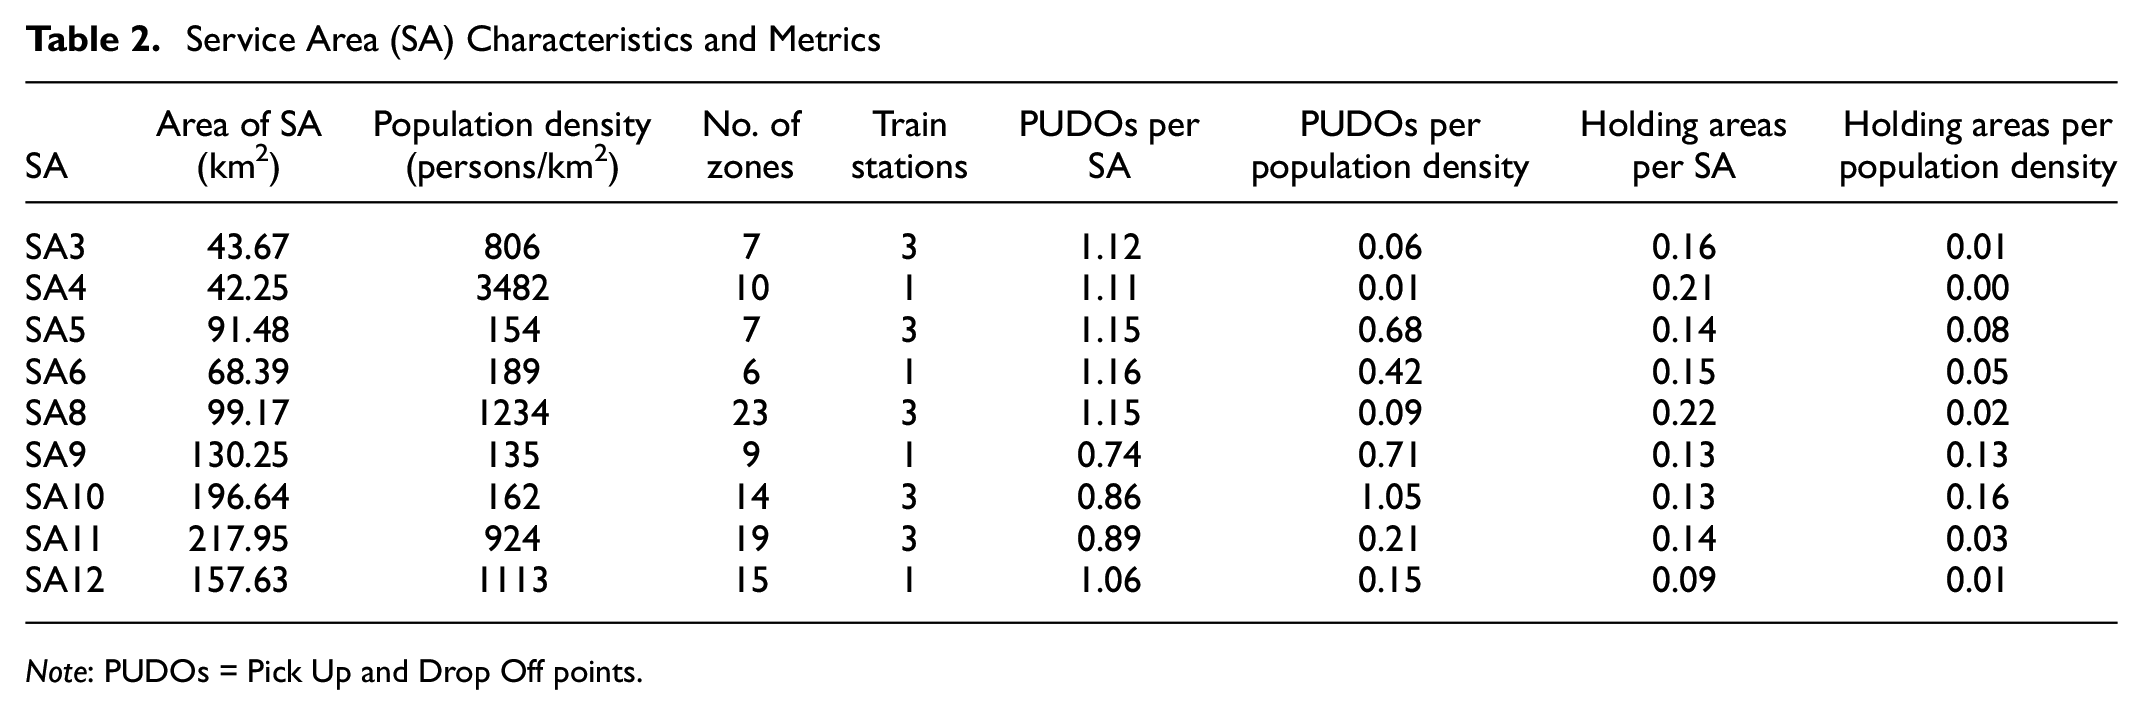
Note: PUDOs = Pick Up and Drop Off points.
Multiple simulation runs were performed for each service area, varying the combinations of demand allocated, fleet size, population density, and service area. The simulations aimed to assess key outputs, including the percentage of trips served, the average detour factor, and the average origin wait time. Assigned demand refers to the total demand allocated to the DRT service based on the simulation parameters. The average detour factor measures the deviation from the direct route, indicating the DRT service’s efficiency. The average origin wait time indicates the waiting time that was experienced by all DRT users on average. The origin wait time was determined as the difference between the actual departure time and the expected or desired departure time of a trip. The variation of these metrics with the variation in DRT demand, service area, and population density was then analyzed and summarized.
Results and Discussion
Survey Analysis
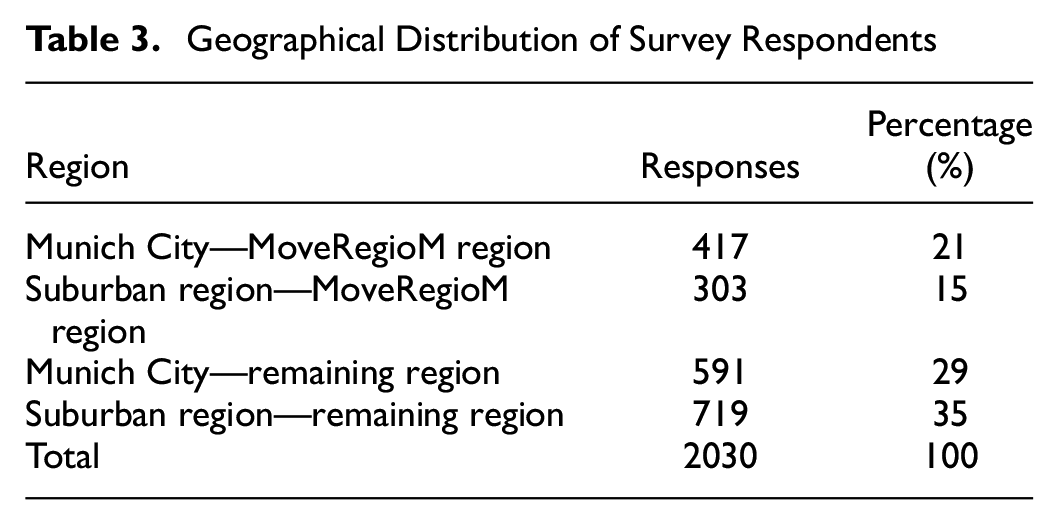
A survey, which was commissioned by the University of the Bundeswehr Munich and the MVV, was conducted to gain insights into the travel and mobility behavior of residents in Munich and its northern counties. Out of 2030 responses, 417 valid responses were from residents of Munich city district within the MoveRegioM region and 303 valid responses were from the northern suburban region of Munich within the MoveRegioM region. The geographical distribution of survey respondents is shown in Table 3.
Geographical Distribution of Survey Respondents
Survey demographics
Figure 4 summarizes the demographic characteristics of respondents from various regions within the MoveRegioM area and other regions of Munich, focusing on sex, age, and educational qualifications. In the Suburban Region—MoveRegioM, the suburban part of the MoveRegioM region, there were 144 female and 159 male respondents. In Munich City—MoveRegioM, the city part of the MoveRegioM region, there were 224 female and 192 male respondents. The age distribution across regions shows that the highest numbers of respondents were in the 30–39 and 50–59 age groups. A significant number of respondents from both MoveRegioM regions hold university degrees, with the city residents showing a notably high number (204) compared to suburban residents. The city has a higher proportion of younger respondents and a more balanced gender distribution compared to the suburban region. Notably, the higher proportion of younger individuals residing in the city region compared to the suburban region indicates a youthful urban population, potentially influenced by factors such as educational institutions, job opportunities, and lifestyle preferences. In addition, the relatively high number of older respondents in the suburban region may indicate a need for transportation solutions that cater to an aging population.
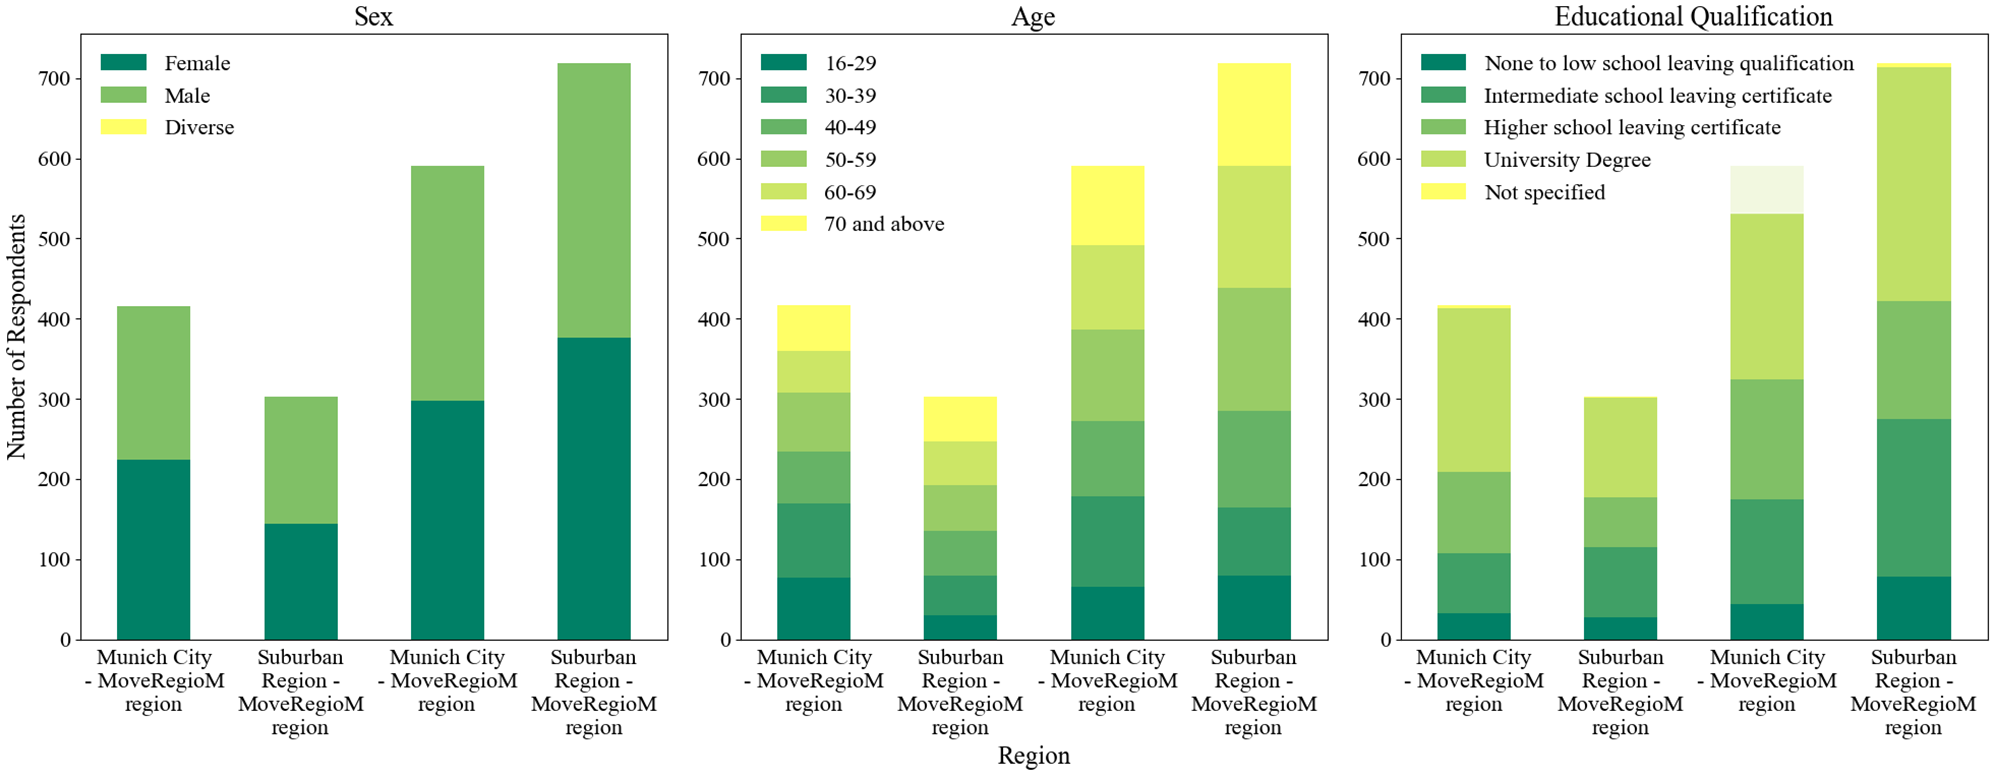
Demographic distribution of survey respondents by sex, age, and educational qualification in various regions of Munich.
For further analysis, only the responses from residents within the MoveRegioM region were considered, encompassing both the Munich City—MoveRegioM region and the Suburban Region—MoveRegioM region. This focused approach aimed to provide more specific insights into the transportation patterns and needs of residents within the targeted MoveRegioM area.
Private car ownership data
The analysis of car ownership and usage reveals key differences between the city and the suburban regions. The ratio of frequent car users to seldom car users for the residents of the suburban region is observed to be higher than for the residents of the city. A greater percentage of suburban region residents have a higher travel time to the nearest public transport service than city residents. In the city, it was observed that single-person households predominantly do not own cars, likely because of better public transport access. Conversely, the suburban region shows higher car ownership, especially two-car households, indicating greater reliance on personal vehicles because of less accessible public transport. Examining car usage frequency in Figure 5, it is evident that longer travel times to public transport (over 10 min) correlate with higher daily car usage in the suburban region. This dependency suggests a need to improve public transport accessibility to encourage a shift away from car usage. Conversely, city residents exhibit a more balanced car usage pattern, reflecting the resilience and convenience of the city’s public transport system.
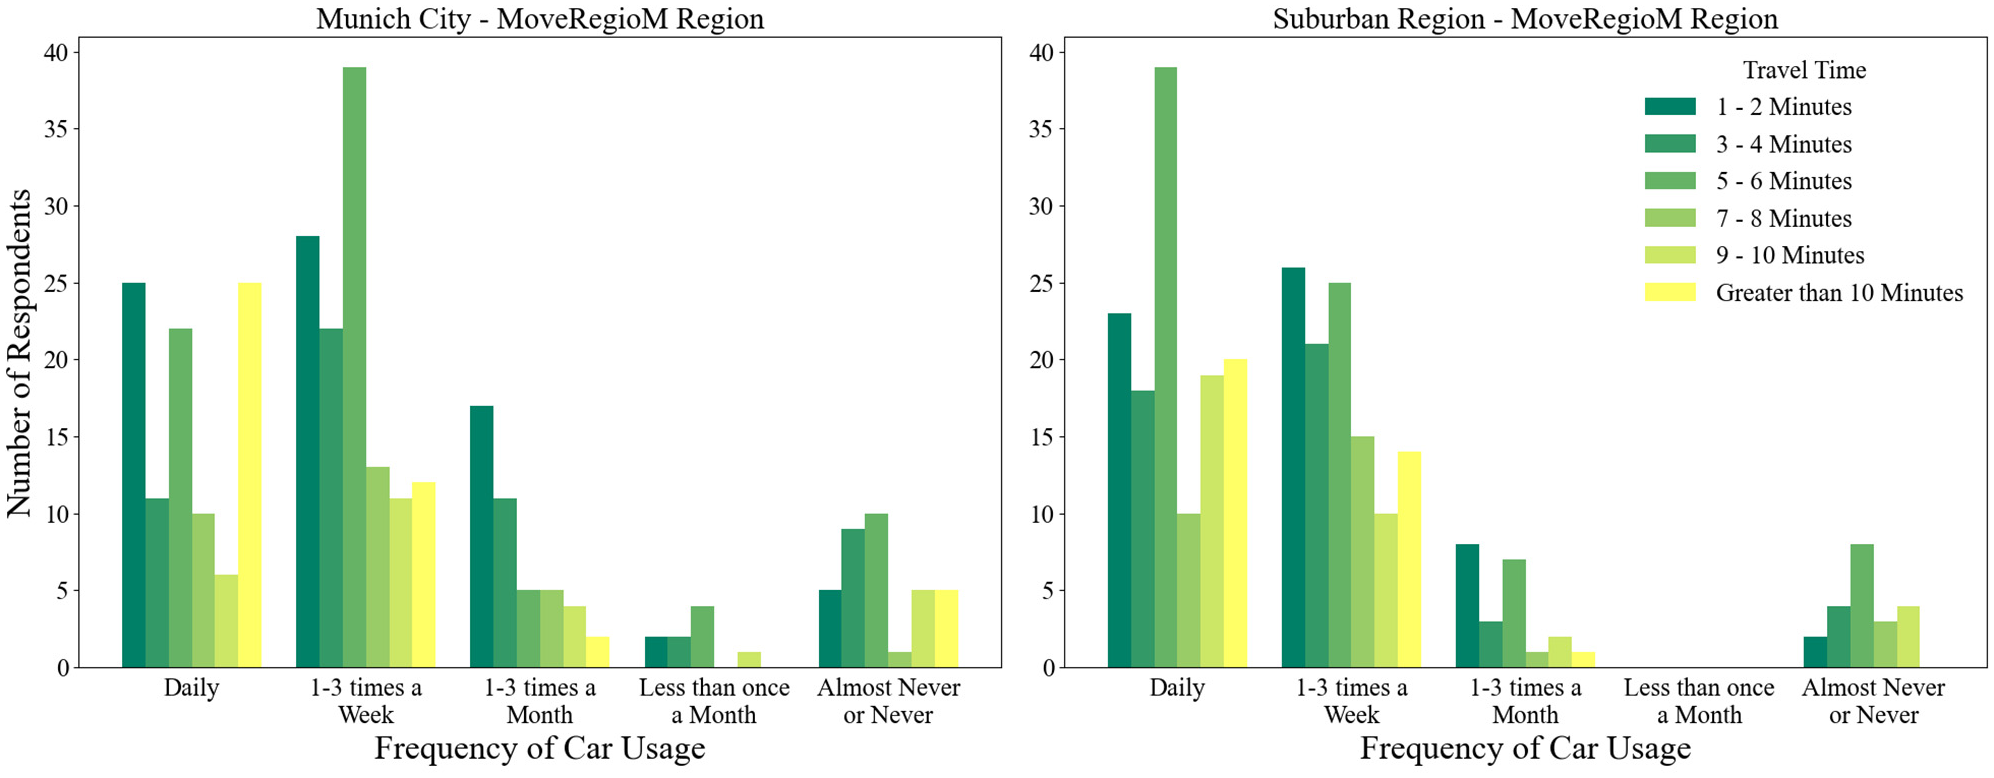
Travel time to the nearest public transport service versus frequency of car usage.
Public transport data
The frequency of public transport usage and the public transport customer type distribution is shown in Figure 6. The analysis of public transport customer types reveals that the city has a significantly higher number of respondents with yearly subscription tickets compared to suburban residents, thereby indicating a stronger reliance on public transport in the city. Conversely, the suburban region has a higher number of non-users of public transport and those using day tickets, or other tickets, reflecting limited public transport accessibility or preference for occasional usage. With respect to public transport usage frequency, city respondents report higher daily and weekly usage rates, underscoring the efficiency and convenience of the city’s public transport system. In contrast, suburban residents exhibit higher rates of infrequent usage and non-usage, particularly among those with longer travel times to public transport services. This suggests a dependency on personal vehicles in areas with less accessible public transport, highlighting the need for improved transport connectivity in the surrounding suburban regions.
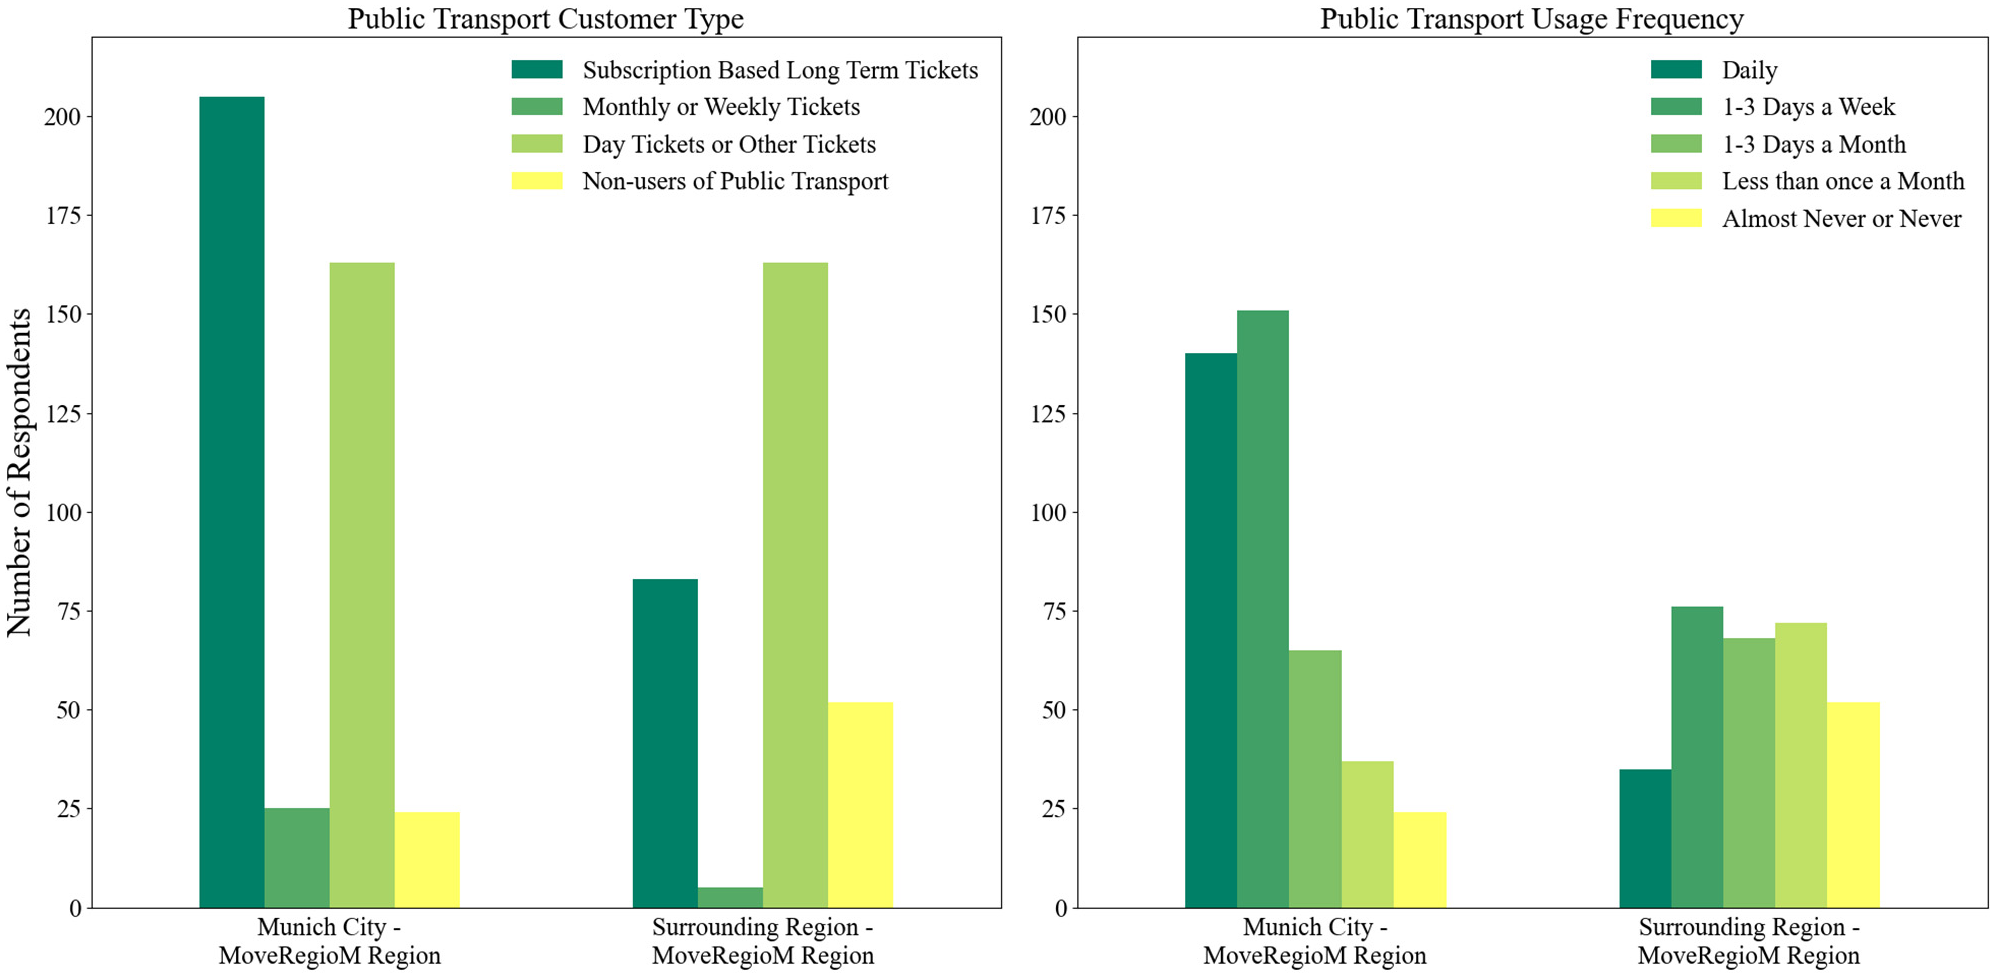
Survey analysis: public transport customer type and usage frequency by region.
DRT usage data
Figure 7 summarizes the survey data, which reveal a nuanced understanding of respondents’ attitudes toward DRT services, their trip purposes, and if potentially introduced, their preferred booking methods across different age groups and regions. Younger individuals (16–39 years) showed a higher willingness to use DRT services, while older individuals exhibited more reluctance. The primary purpose of trips varied significantly by region. In the suburban region, trips were more evenly distributed across purposes, with a notable proportion for commuting to public transport stops. In contrast, trips within the city were predominantly for intra-city travel. With respect to booking methods, younger respondents predominantly favored smartphone applications, while older individuals showed a preference for traditional phone calls, highlighting a digital divide. The survey insights reveal a strong potential for introducing DRT services in suburban regions, particularly for last-mile connectivity. A significant share of respondents from suburban areas indicated a high usage of public transport for travel from a stop to home, demonstrating a clear demand for efficient last-mile solutions.
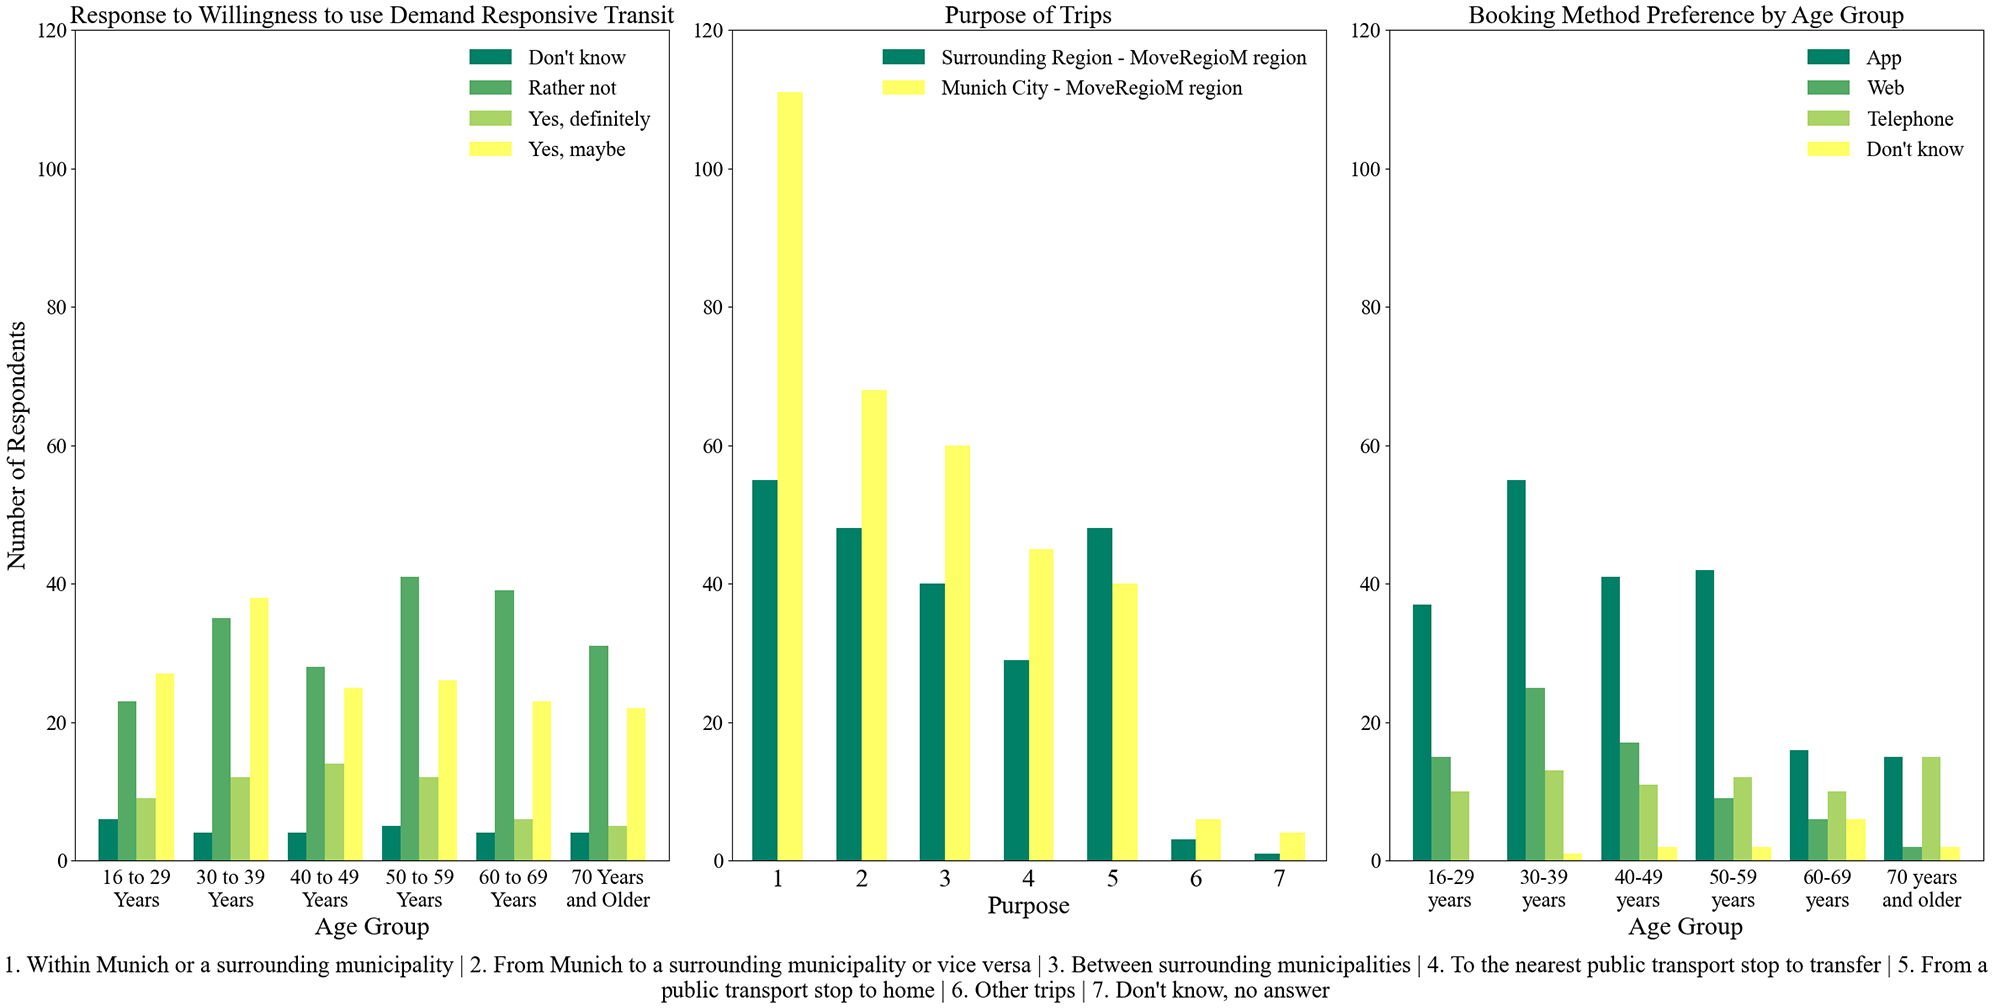
Demand responsive transit survey analysis: willingness to use demand responsive transit, trip purposes, and booking preferences by age group and region.
Targeted outreach and education on DRT benefits, along with multi-channel booking options, can address the reluctance of older individuals and those residing in less urbanized areas. By leveraging these preferences, DRT can enhance overall public transport accessibility and satisfaction in suburban regions. The survey data highlights the higher car dependency in suburban areas and infrequent usage of public transport. Younger respondents showed more willingness to use DRT services, particularly for last-mile connectivity, while older residents preferred traditional booking methods. This indicates a strong potential for introducing DRT in suburban regions to enhance public transport accessibility and reduce car usage.
Simulation Analysis
An initial analysis was conducted to obtain insights about the zones where DRT services could potentially be introduced. It was observed that the zonal relations with the highest car demand are almost absent within the city boundaries and are predominantly present in the northern suburbs. Out of the 349 zonal relations with the highest usage of cars, Freising generated the highest share of car usage zonal relations, amounting to 74.1%, which was followed by Munich County at 19.4% and Dachau at 4.5%.
Following the filtering of the zones to just the zones that were present in the MoveRegioM region, further modifications were made to the model. For each simulation, the number of seats per vehicle was set to seven for realistic operational feasibility, considering that FLEX DRT services that operate in the southern part of Munich operate with vehicles with seven seats ( 19 ). The maximum walk time to the nearest PUDO was set to 10 min based on survey responses, since respondents tend to rely on private car usage when the walk time to the nearest public transport service exceeds 10 min. With a greater portion of potential DRT trip purposes of suburban residents being commuting to public transport stops, it was ensured that every service area that was defined and analyzed had at least one train station. Furthermore, PUDOs were also placed where there were bus stops for the ease of potential introduction of DRT operations. The distribution of the number of passengers traveling together per trip request was set as follows: 65% of the trip requests were for single passengers, 25% for two passengers traveling together, and 10% for groups of three passengers to provide a variety of trip requests.
Fleet size range
Tables 4–6 show the fleet size range recommendations and different performance metrics for different service areas for 1%, 2%, and 5% demand, respectively. The lower and upper limit of the fleet size range shows the lower and upper limit of the percentage of trips served: 85%–95%. For a 1% demand scenario, smaller fleet sizes, such as one or two vehicles, are generally sufficient to achieve a high service performance of 85%–95% of trips served in most areas, such as SA3 and SA4. This indicates that low-density demand can be efficiently managed with minimal fleet resources. As the demand increases to 2% and 5%, the required fleet sizes naturally expand, exemplified by SA8, where the fleet size range jumps from three or four to seven to nine to maintain service levels. Furthermore, the “trips per fleet size range” metric highlights the effective management of trips relative to fleet size, offering a clear indication of operational efficiency. For instance, in SA3 with 1% demand, 109 trips are efficiently managed by a fleet of one or two vehicles, whereas in SA8, a higher demand scenario necessitates a fleet size of three or four vehicles for 231 trips. This metric helps in understanding the point at which increasing fleet size yields diminishing returns. This trend underscores the necessity of scaling fleet sizes proportionally with demand to sustain service efficiency.
Fleet Size Range Recommendations for 1% Demand and Performance Metrics for Different Service Areas (SAs)
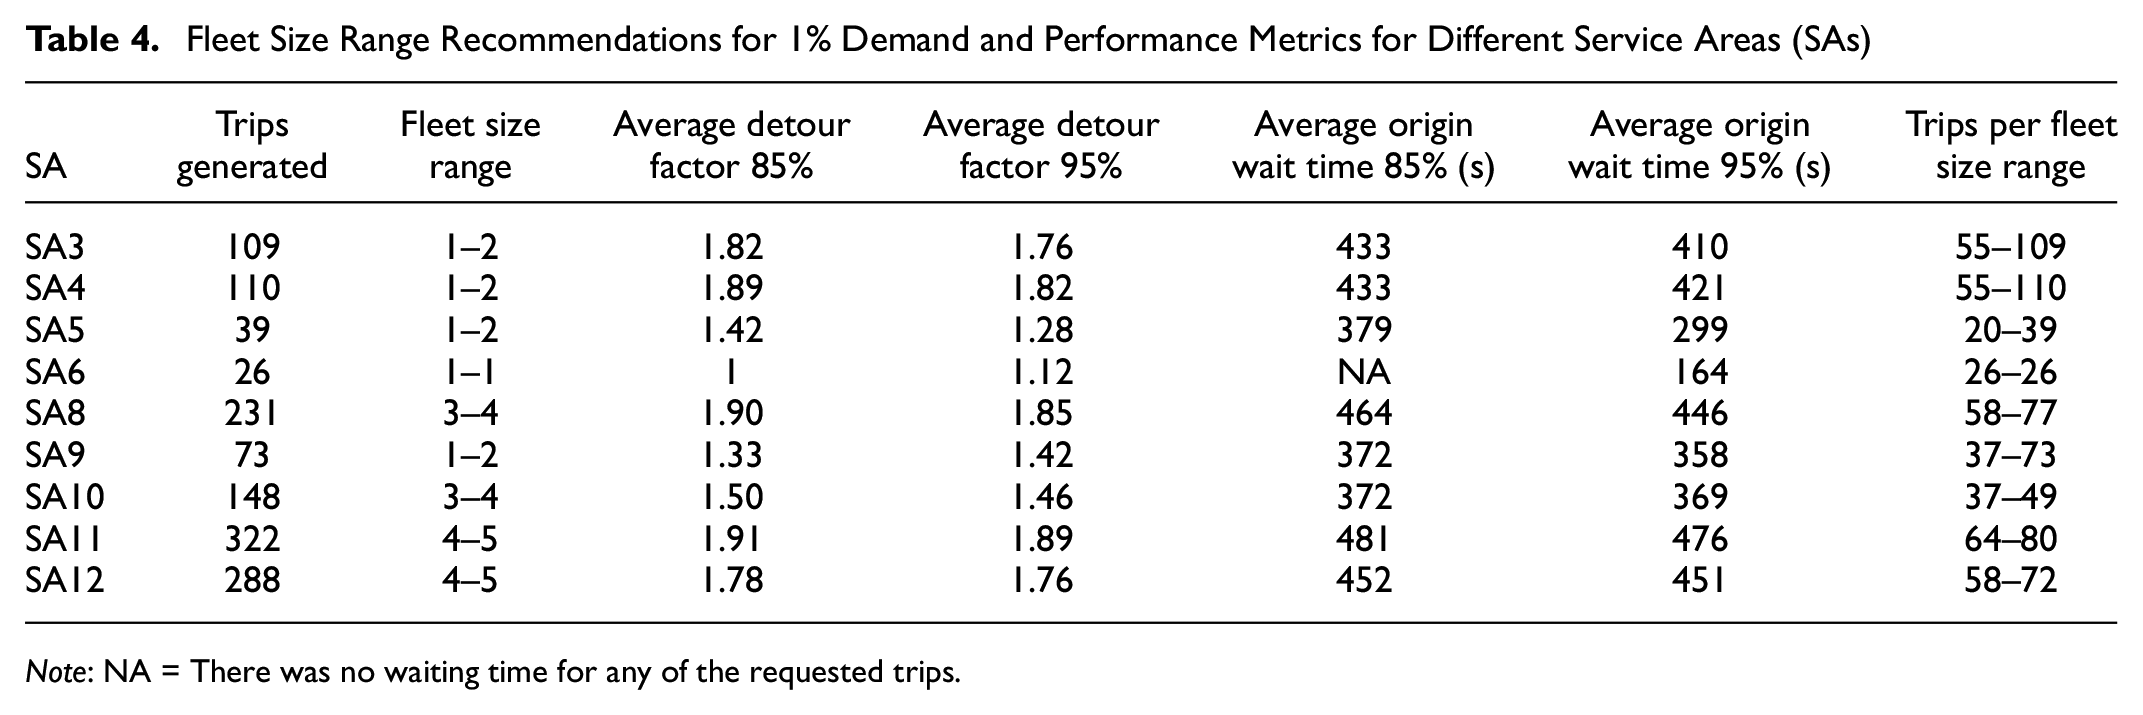
Note: NA = There was no waiting time for any of the requested trips.
Fleet Size Range Recommendations for 2% Demand and Performance Metrics for Different Service Areas (SAs)
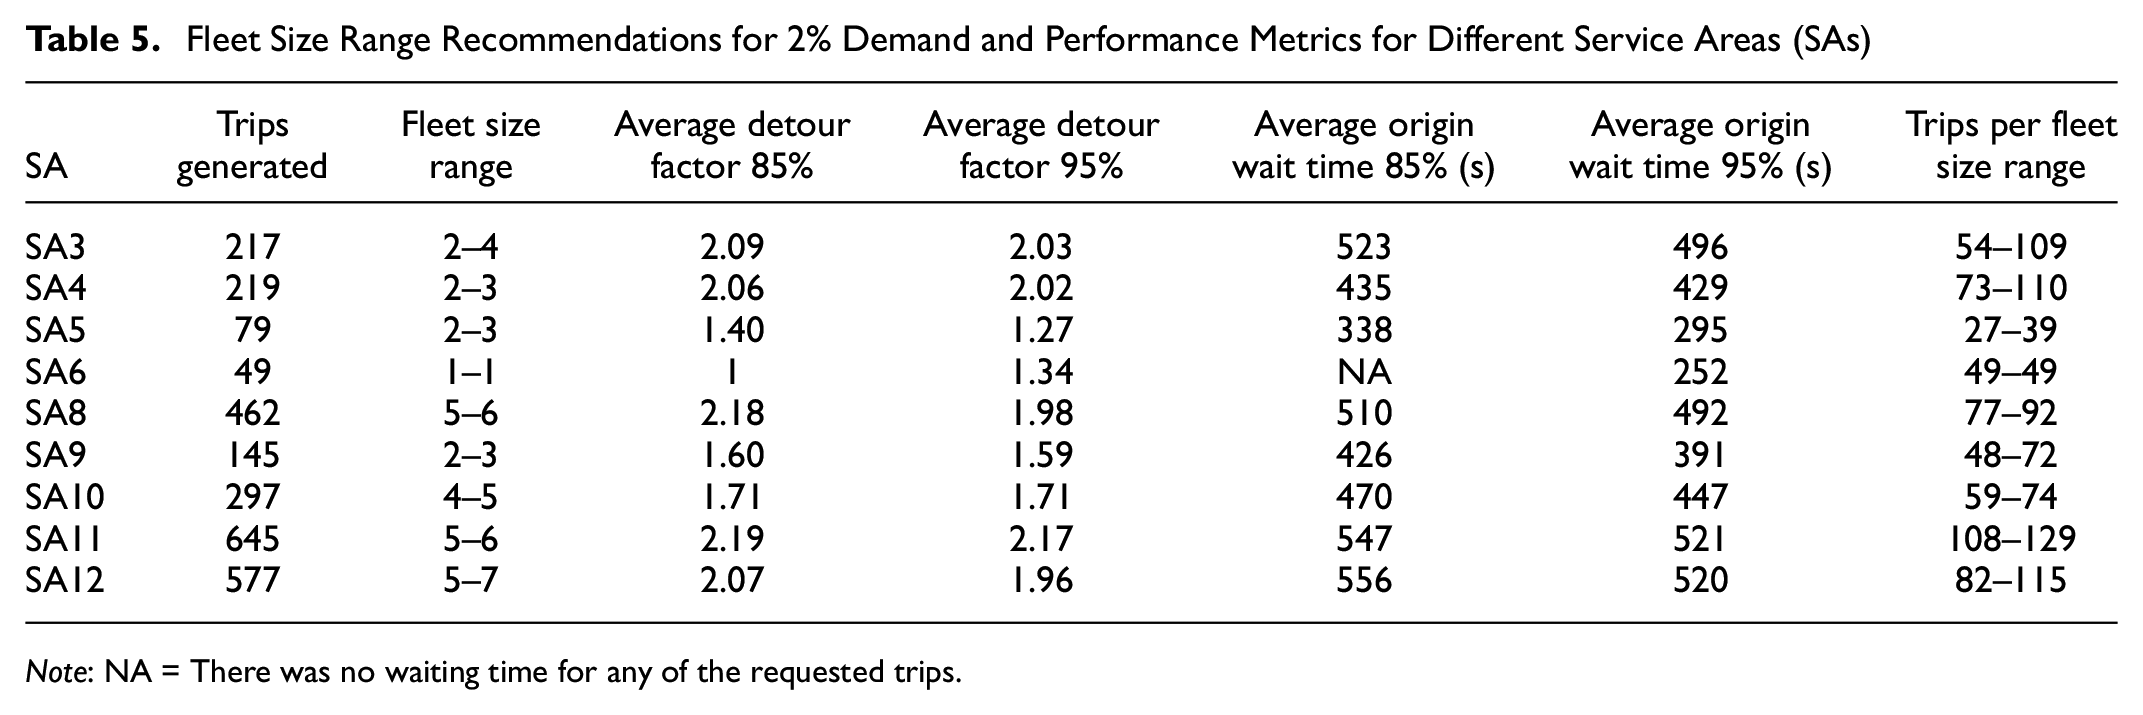
Note: NA = There was no waiting time for any of the requested trips.
Fleet Size Range Recommendations for 5% Demand and Performance Metrics for Different Service Areas (SAs)
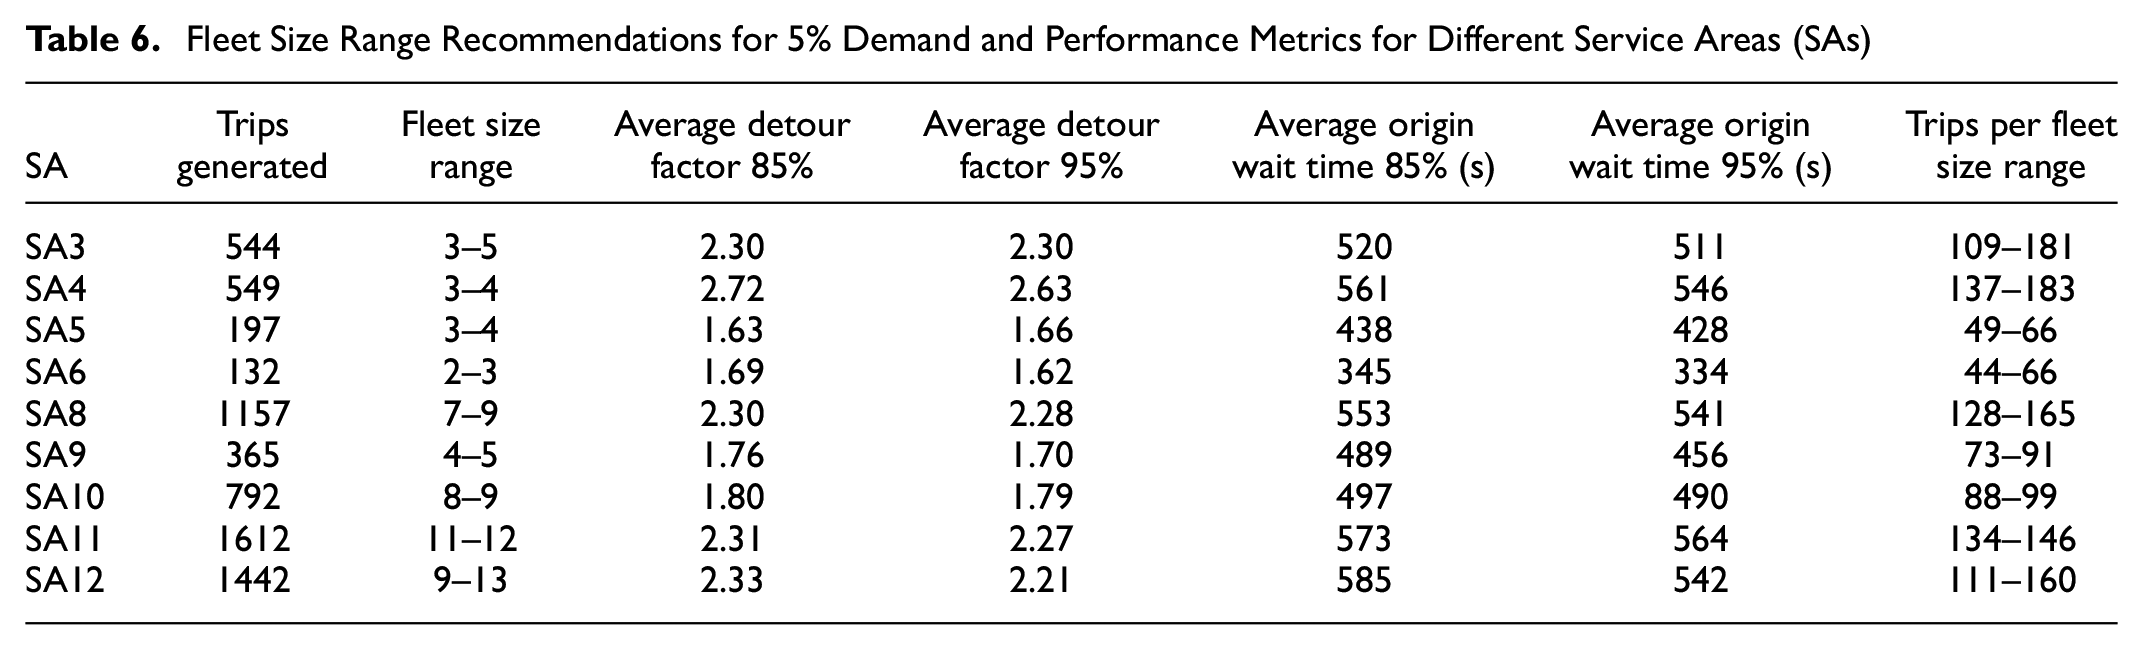
Average detour factor
The analysis of the average detour factor across different fleet sizes and demand scenarios provides significant insights into the efficiency of the DRT services. For the 1% demand scenario, the average detour factor generally stays below or around 2.0 for most service areas, indicating a relatively direct routing for passengers with minimal detours. This trend holds for areas such as SA3 and SA4, where detour factors range from 1.82 to 1.89. However, as demand increases to 2% and 5%, there is a noticeable rise in the detour factors, particularly in densely populated areas such as SA8 and SA11. In these high-demand scenarios, the detour factor ranges increase significantly, approaching or exceeding 2.3, which suggests longer, less direct routes likely because of higher vehicle occupancy and more complex routing requirements. The increasing detour factors with higher demand levels highlight the challenges in maintaining direct and efficient routes as fleet utilization intensifies. For instance, SA8 shows a detour factor of 2.30–2.28 under 5% demand, indicating the need for more sophisticated routing algorithms or additional fleet resources to manage efficiency.
Further analysis reveals a nuanced relationship among the average detour factor, service area, and population density. Higher population densities tend to result in higher detour factors because of increased routing complexity, as observed in areas such as SA4 and SA8. Conversely, lower-density areas, such as SA9, exhibit lower detour factors with more direct routes. While larger service areas alone do not necessarily lead to higher detour factors, a combination of large service areas and high population densities, like in SA11, significantly increases detour factors. In addition, higher demand levels across all areas correlate with increased detour factors, highlighting the complexity added by more trip requests.
Average origin wait time
The analysis of average origin wait time reveals that across all scenarios, the average wait time is maintained within 10 min, ensuring a reasonable service level for users. In lower population density areas, such as SA5 and SA6, the average wait times are shorter, reflecting the lesser demand and simpler routing. Conversely, higher density zones such as SA4 and SA8 show slightly increased wait times, attributed to the higher volume of requests and routing complexity. Interestingly, larger service areas with moderate population densities, such as SA10 and SA11, manage to keep wait times well within the acceptable range. Overall, despite variations in fleet size, demand levels, and geographic characteristics, the average origin wait time remains effectively controlled.
Among the various factors influencing DRT performance, the most critical appears to be the number of trips, which is derived from the allocated DRT demand. Higher demand directly affects fleet requirements, average detour factor, and origin wait times. While service area and population density are also significant, they primarily influence how infrastructure such as PUDOs and holding areas are deployed. For example, SA11 with a high demand (1612 trips) and a significant number of PUDOs and holding areas highlights the importance of matching infrastructure with demand to maintain service quality. In summary, while all factors are important, the number of trips seems to be the most critical across all scenarios. This is because the demand directly influences the required fleet size, service efficiency, and user satisfaction metrics, such as detour factor and wait times. An effective DRT service implementation thus requires a balanced consideration of demand, population density, and strategic infrastructure deployment.
The analysis of fleet size recommendations for DRT services across varying levels of demand, service area sizes, and population densities reveals a clear pattern of increasing fleet size requirements in tandem with rising demand and population density, as shown in Table 7. In low-density areas (less than 150 persons/km2), fleet sizes remain modest, with one or two vehicles generally sufficient for service areas up to 100 km2 under a 1% demand scenario. However, as demand increases to 2% and 5%, the fleet size needs escalate to two or three and four or five vehicles, respectively, for larger service areas. For moderately dense regions (150–500 persons/km2), fleet size requirements also remain low under 1% demand but increase significantly under higher demand scenarios, reaching up to nine vehicles for larger service areas. In regions with densities between 500–1000 persons/km2, fleet sizes range from one or two vehicles for small areas under 1% demand to as high as 11 or 12 vehicles for larger areas under 5% demand, highlighting the need for a stronger fleet to cater to higher populations. In the highest density areas (more than 1000 persons/km2), the fleet size starts at one or two vehicles for smaller areas under low demand but can rise dramatically to 9–13 vehicles for extensive areas under a 5% demand scenario. This comprehensive assessment underscores the importance of scaling fleet size proportionately to the specific demand and density conditions to ensure efficient and responsive DRT services.
Fleet Size Range Recommendations for Different Demands and Population Densities
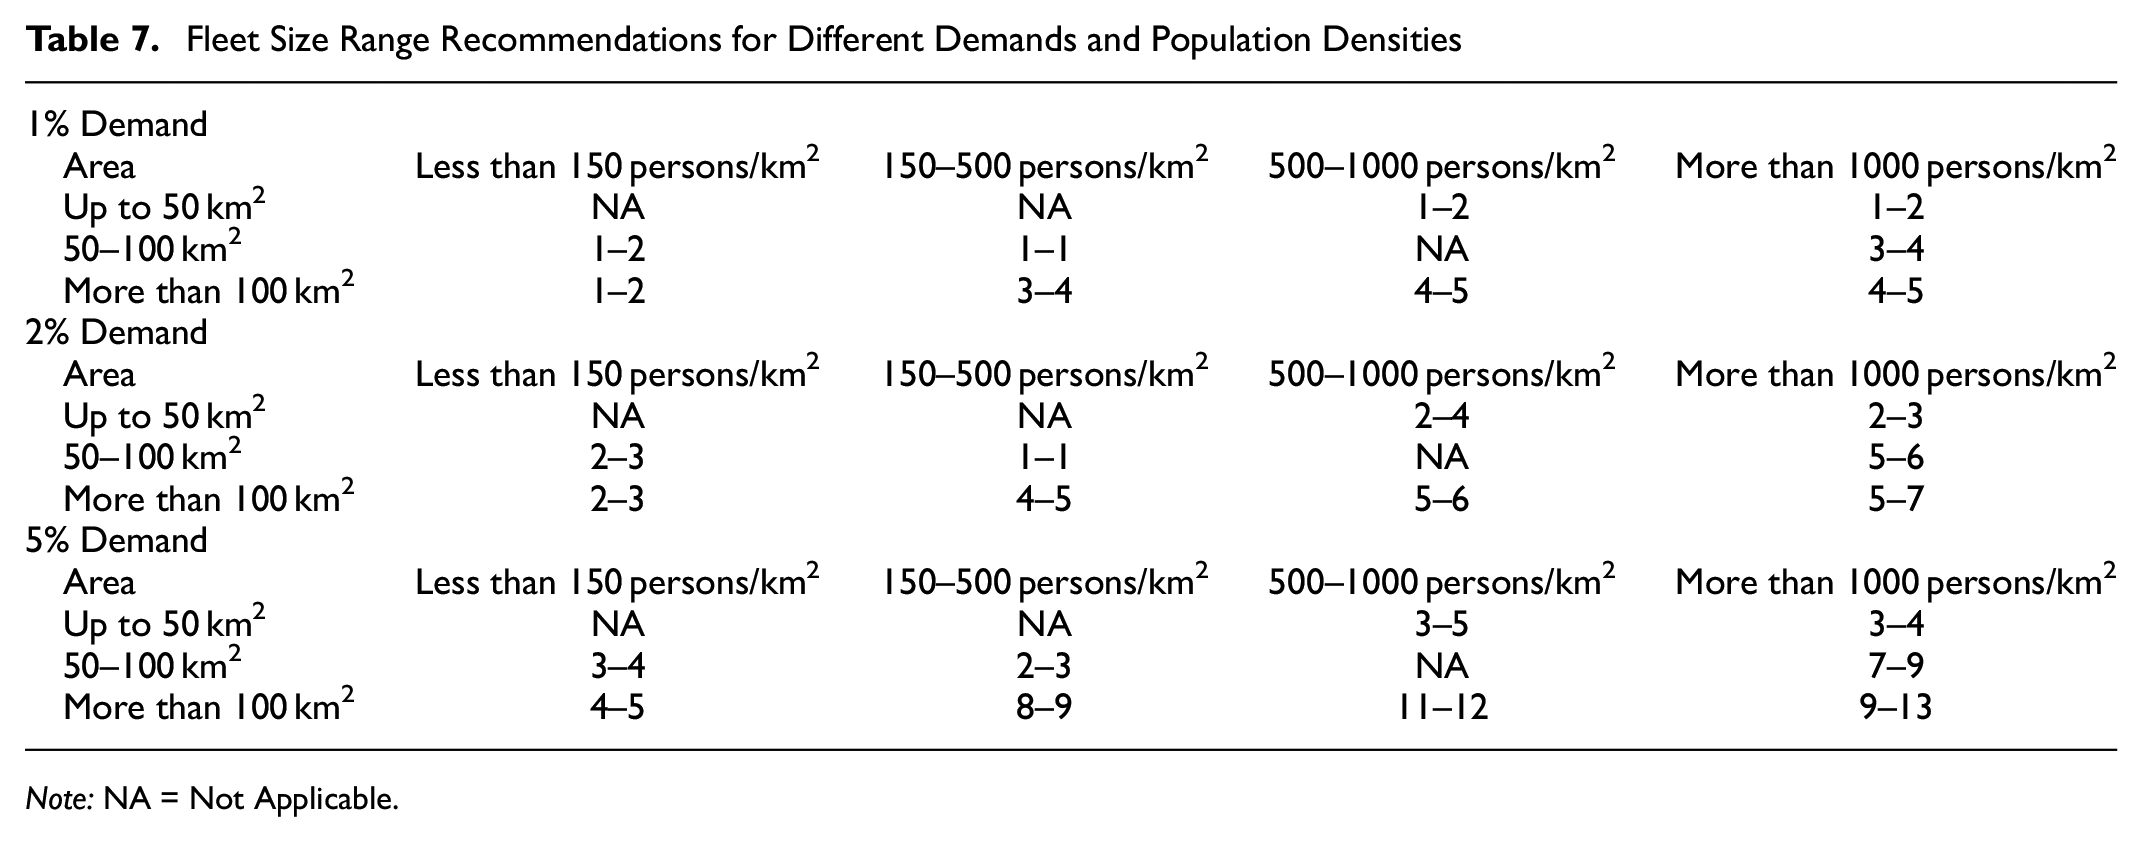
Note: NA = Not Applicable.
Conclusion
The study aimed to evaluate the potential of DRT services to enhance public transport accessibility and reduce private car usage in the northern suburban areas of Munich, particularly in the counties of Munich, Dachau, and Freising. The study focused on zones within the MoveRegioM region, analyzing over 400,000 OD relations for private car trips. Through a detailed methodology, zones with the highest private car demand were selected, leading to the formation of multiple potential service areas based on variations in area and population density. Survey results indicated distinct differences in mobility behavior between Munich City and its northern suburbs, revealing a higher reliance on private cars in the suburbs because of longer travel times to public transport services. The survey also highlighted a significant interest in DRT services among younger residents, with a notable demand for efficient last-mile connectivity solutions.
The analysis demonstrated that DRT services could effectively address the first- and last-mile connectivity issues, particularly in suburban regions with high private car usage. The strategic placement of PUDOs and holding areas based on demographic characteristics and existing bus stop locations was crucial for maximizing accessibility and minimizing vehicle inactivity. The results underscored the importance of considering both service area size and population density when planning DRT services, highlighting the potential of these services to significantly enhance public transport accessibility and reduce private car dependency in suburban areas.
In conclusion, the study provides insights into optimizing DRT services, offering a framework for implementing these services in suburban regions. Further research is intended to be performed to determine the optimal placement and number of PUDOs and holding areas for a given service area. This includes examining the number of PUDOs and holding areas within each zone in relation to population density, and their overall coverage (service area). The interplay between vehicle capacity and fleet size and determining their effects on service performance in DRT services can also be of vital importance. This analysis would consider different combinations of service areas and population densities to determine the most efficient setup; for instance, assessing whether a high-capacity, low-fleet size arrangement is more effective than a low-capacity, high-fleet size configuration and for which location—in a relatively smaller area with a higher population density or a larger service area with a lower population density. Such an analysis will reveal which factors are more critical in optimizing DRT services.
Footnotes
Acknowledgements
The authors would like to thank the Landeshaupstadt München, Münchner Verkehrs- und Tarifverbund GmbH (MVV GmbH) and Münchner Verkehrsgesellschaft mbH (MVG mbH) for providing the Gesamtverkehrsmodell (GVM). Artificial intelligence (AI) tool Chat GPT has been used to improve the legibility of the text.
Author Contributions
The authors confirm contribution to the paper as follows: study conception and design: M. Zubair, R. Bock, S. Hoffmann; data collection: M. Zubair, R. Bock; analysis and interpretation of results: M. Zubair; draft manuscript preparation: M. Zubair, R. Bock, S. Hoffmann. All authors reviewed the results and approved the final version of the manuscript.
Declaration of Conflicting Interests
The author(s) declared no potential conflicts of interest with respect to the research, authorship, and/or publication of this article.
Funding
The author(s) disclosed receipt of the following financial support for the research, authorship, and/or publication of this article: The authors would like to thank the Bundesministerium für Bildung und Forschung (BMBF) for funding the project MoveRegioM. The pilot project is part of the “MobilitätsWerkStadt2025” funding program of the BMBF.