
Abstract
Infrastructures such as roadways, power lines, and communications networks play a critical role in our society. However, they are also susceptible to failures, especially those caused by extreme events, quickly affecting large geographical areas. Predicting where and when these failures will occur with high confidence is very difficult because of the stochastic nature of such events. Nevertheless, it is possible to know in advance which areas are more vulnerable and plan accordingly. This paper aims to use remote sensing techniques based on satellite images to detect roadways’ vulnerabilities to hurricanes. Each road is assigned a vulnerability score based on the information retrieved from the satellite image and other geographic information system (GIS) data, which can be used to create a vulnerability map of the area. Both vegetation exposure along the roads and the consequences of the closures are considered in the vulnerability assessment. The study area has been selected in Tallahassee, Florida, U.S., where a high-resolution satellite image was acquired in September 2018, 2 weeks before Hurricane Michael. The findings of this work can help management teams and city responders to identify the most vulnerable regions at risk of disruption and organize resources before the event.
Keywords
Our modern society relies on critical infrastructures to support all its operations, functionalities, and enterprises. Such infrastructures are composed of public and private physical structures such as roads, railways, bridges, tunnels, water supply, sewers, electrical grids, and telecommunications networks ( 1 ). They are considered so vital because their incapacitation or destruction would have a debilitating effect on security, national economic security, national public health or safety, or any combination thereof ( 2 ). Such fundamental elements are often exposed to failures and disruptions, dramatically affecting citizens’ lives and causing society stress. Thus, it is fundamental to understand and monitor the vulnerability of such infrastructures to ease or limit outages’ consequences. Disruptions can be caused by various events, from technical failures (electric outages, traffic incidents) to natural disasters (floods, landslides, hurricanes, wildfires, earthquakes, etc.). While accidents and technical failures may have limited effects, disruptions caused by nature may cover large areas. Among the different infrastructures, the road network is critical for transportation and all services’ accessibility, and it is often severely affected by natural disasters like hurricanes.
Hurricanes and the damage they cause have gained attention recently, with disaster management analysis spanning two different directions. Post-disaster assessment deals with the consequences of a natural disaster, detecting and estimating damages, recovery optimization, resource allocations, and so forth. On the other hand, pre-disaster assessment copes with analyzing the area before the event for vulnerability analysis to achieve better prevention and resilience. Traditionally, such evaluations are performed by manual or visual inspection, which is a time-consuming and risky operation, especially in the proximity of collapsed buildings or fallen trees. However, remote sensing technologies are growing in use. Aerial images are a valuable source of data for hurricane damage assessment ( 3 ). Still, the high operating costs of helicopters and limited coverage of drones are a limitation to large-scale applications. In recent years, the dramatic drop in the launching cost of satellites and the growing number of satellites in orbit has significantly reduced the cost of high-resolution satellite imagery ( 4 ). Commercial satellite providers can offer high-resolution images (0.3–0.5 m/pixel) with a high revisiting frequency for most parts of the globe. Furthermore, single snapshots can cover large areas at once. Therefore, the combination of coverage, frequency, and cost-efficiency of satellite imagery, in addition to advancements in machine learning, creates a paradigm change for cities enhancing situational awareness for infrastructure networks ( 5 ).
Concerning post-disaster assessment, recently, in two studies by Gazzea et al., the authors developed a framework to automatically detect fallen trees at roadway-level after a hurricane using high-resolution satellite images ( 6 , 7 ). Similarly, in Kaur et al., a deep-learning technique for detecting damaged buildings in post-hurricane satellite images is proposed ( 8 ). In two studies by Karaer et al., the authors introduce a remote-sensing-based approach that can rapidly analyze the damage caused by catastrophic storms at a city scale ( 9 , 10 ).
Concerning pre-disaster assessment, the current works are focused on statistical analyses to identify spatial patterns of outages and their relationship with demographic and socioeconomic variables, such as in two studies by Ghorbanzadeh et al. ( 11 , 12 ). While these studies can provide valuable information for city officials to better prepare emergency policies for potential hurricanes, these analyses are done a posteriori. Furthermore, vegetation, one of the primary causes of roadway outages during extreme weather events, is often either not considered or not taken into account with simple metrics, for example, computing vegetation indexes like the Normalized Difference Vegetation Index (NDVI) ( 13 ).
Some studies, such as Gullick et al. and Çiftçi et al., tried to quantify single tree failure probability resulting from extreme weather events by proposing empirical mechanical models to estimate the possibility of trees failures ( 14 , 15 ). Such works take into account tree characteristics (e.g., tree canopy, stem mass, tree mass, and diameter at breast height), soil strength, and wind-induced bending moment on each tree, and combine them with wind data ( 16 ). However, because of the complexity and limitations of measuring such characteristics, which are required information for mechanistic models, it is often impossible to obtain accurate estimations of the failure probability for trees. Statistical models are another approach for predicting the probability of wind-related tree failure, as shown in Kabir et al. but they still require data from surveys and inventories ( 17 ).
In this paper, we propose a framework for rapid, scalable, and low-cost vulnerability assessment along roadways using high-resolution satellite images. We implemented our framework in a portion of the City of Tallahassee, the capital of Florida, U.S., in September 2018, before Hurricane Michael.
The contributions of our approach are as follows:
We calculate the vegetation exposure of roadways based on tree parameters estimated via satellite imagery, such as height, distance to the roadway, health, and density.
We propose a vulnerability index which combines the vegetation exposure with road importance, calculated based on the consequences that such closures have on the transportation network, such as mobility and number of buildings affected.
Study Area and Data Description
Hurricane Michael was one of the strongest storms that hit the U.S. southeast coast. It made landfall as a Category 5 hurricane in Florida’s Panhandle region with maximum sustained wind speeds of 140 knots (161 mph), bringing a catastrophic storm surge to the State of Florida and Big Bend areas (especially Mexico Beach and Panama City) ( 18 ). It hit Florida on October 10, 2018, and the related power outages, at their greatest extent, affected nearly 400,000 electricity customers in Florida, representing about 4% of the state ( 19 ). Furthermore, damage to over 2.8 million acres (1.1 million hectares) of forested land caused an estimated $1.29 billion in damage to the timber industry. The 12% of damaged forest area was classified as “catastrophic” by the Florida Forest Service ( 20 ). Estimated damage from Hurricane Michael throughout the U.S. reached $25 billion ( 21 ).
To develop our framework, we acquired data from both satellite images and the municipality. Figure 1 summarizes the data used.
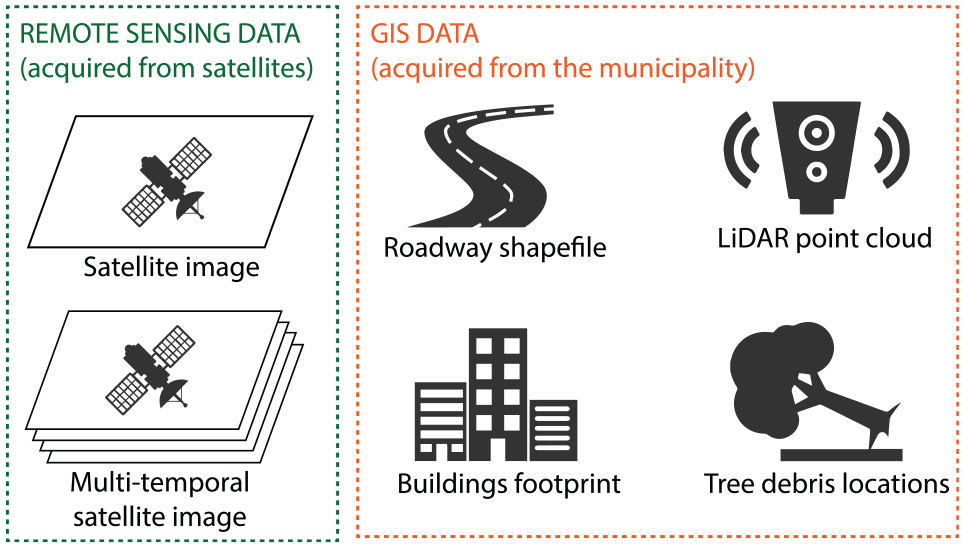
Summary of the data used for the study.
We acquired one high-resolution multi-spectral satellite image for a 6.5 km2 (2.5 mi 2 ) portion of Tallahassee, the capital of Florida. The image, provided by Maxar WorldView-2 satellite, is composed of four channels: red (R), green (G), blue (B), and near-infrared (NIR) with a spatial resolution of 0.5 m/pixel. The given resolution allows for recognizing trees, buildings, and other infrastructure. The image is encoded as a GeoTIFF file so that each pixel can be precisely located in a geographical reference system. The picture was taken in September 2018, two weeks before Hurricane Michael. In addition, to estimate tree health, we acquired multi-temporal satellite images spanning equal intervals within the period 2017–2018, from a five satellites constellation operated by Planet company with a resolution of 3 m/pixel and composed of four bands (RGB-NIR) ( 22 ).
We acquired the buildings’ footprints and the locations of roads from publicly available databases of the municipality of Tallahassee. Laser imaging detection and ranging (LiDAR) point clouds, freely available from the city, have been used to train the height estimation algorithm and to extract building height. LiDAR is a reliable tool that maps an environment and provides the corresponding 3D point cloud representation. Still, it is also costly and generates a massive amount of data to be processed. The idea of our approach is to use available LiDAR data to train a suitable deep-learning model. Finally, we use the geo-locations of stacked piles of tree debris collected by the authorities after the hurricane and provided by the City of Tallahassee municipality to justify and discuss the proposed vegetation exposure scores.
Methodology
This paper aims to assess vulnerabilities along roadways using satellite images. In our study, we identify the vulnerability
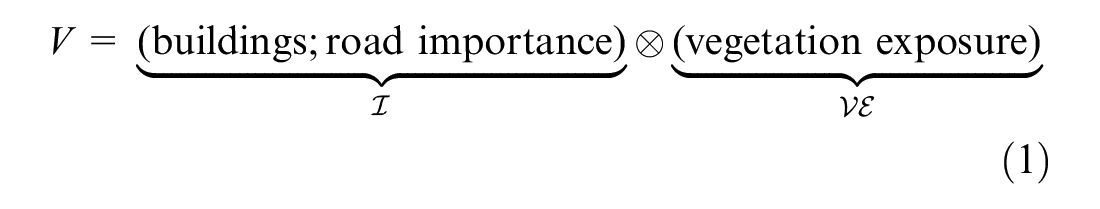
Equation 1 claims that, even if a road has high vegetation exposure, the associated vulnerability can still be low if nobody lives in the surroundings or if the road is not critical for the mobility network, reinforcing what is also expected from common sense. Therefore, our framework is composed of two parts. The first part assesses the vegetation along roadways using satellite images, assigning each road a vegetation exposure score based on the quantity, health, and height of trees, and their distance to the road. The second part integrates data from the municipality, specifically the volume of buildings along the road and roadways locations. Topological analysis is also performed to detect more critical roads in relation to mobility. Finally, vegetation exposure, road importance, and building volume are combined into a vulnerability score per road. The output is a vulnerability map of the road network of the area. The overall pipeline is shown in Figure 2, and each part is further described.
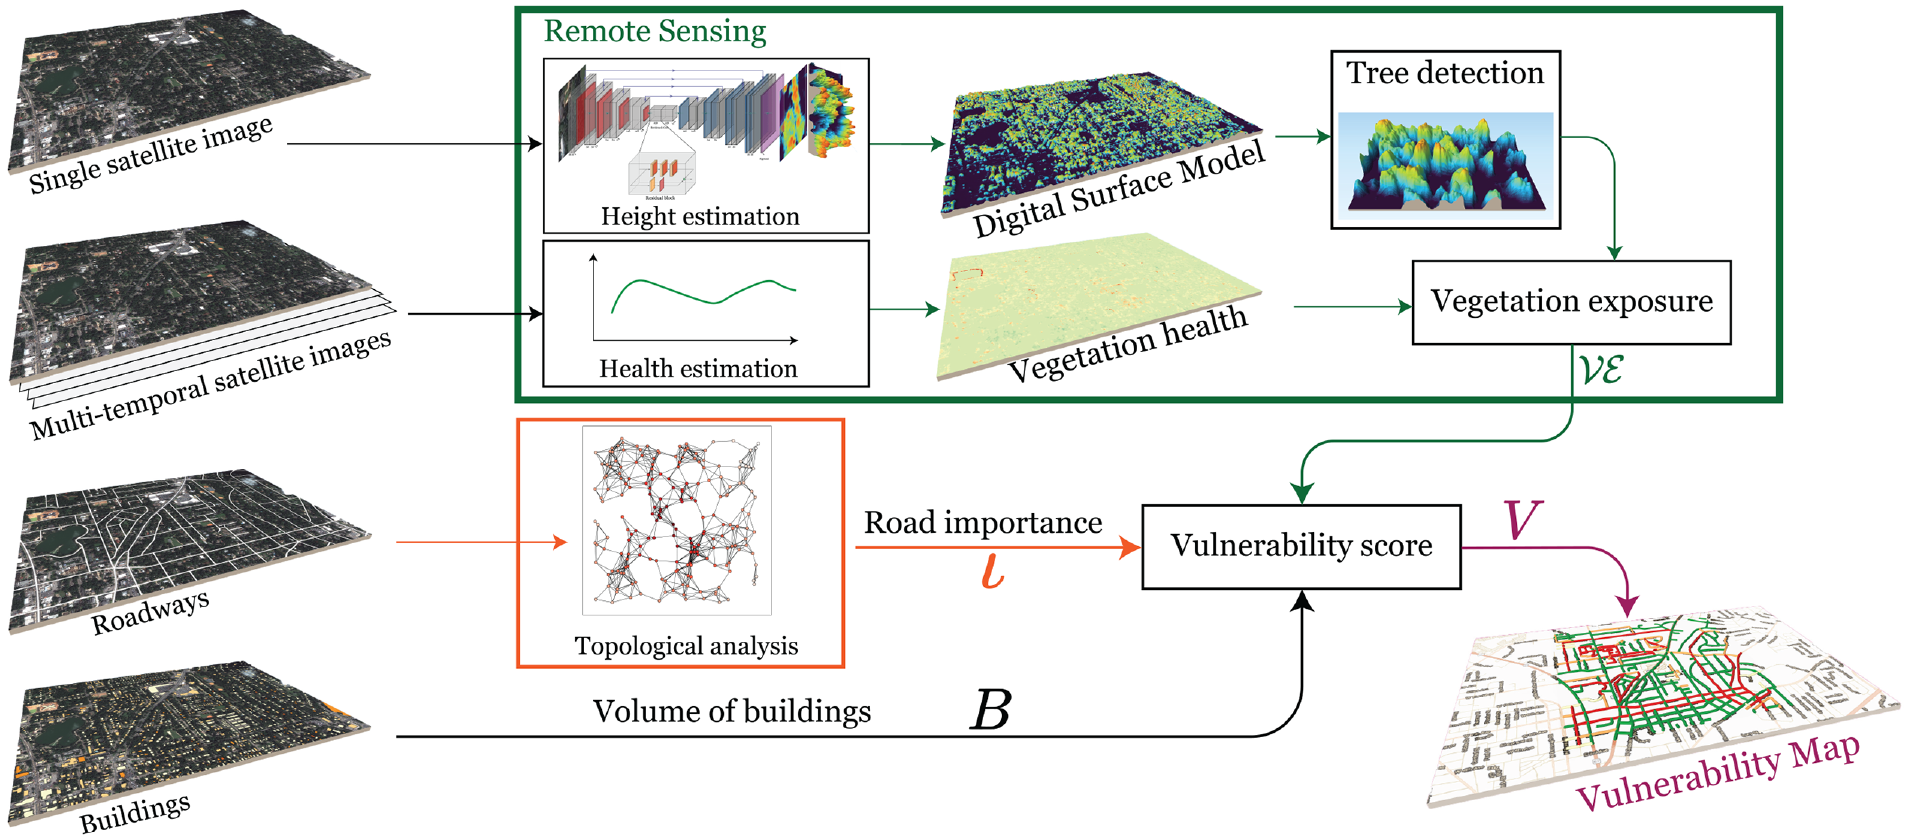
Overall pipeline of the approach.
Remote Sensing Module
The first module deals with vegetation, which is the main cause of roadway closures after hurricanes. Tall trees pose a significant threat, as strong winds can easily cause them to fall on the road corridor. Furthermore, locations with an increased number of trees are also dangerous as, from a probabilistic point of view, it is more likely that some of them may fall. Therefore, the density and height of trees, and distance from the road are essential factors to consider for vulnerability analysis. All the parameters above can be estimated using one satellite image.
Height Estimation
This module estimates the tree canopy height from the satellite image. Measuring tree canopy height accurately from single images is, in general, an ill-posed task because optical images taken from above clearly do not contain height information and there are intrinsic ambiguities in mapping a color measurement into a height value (
24
). Usually, the most common techniques for 3D generation include stereo images, multi-angular photogrammetry, synthetic-aperture radar (SAR) interferometry, and LiDAR (
25
–
28
). Nevertheless, some papers addressed the issue by resorting to machine learning for 3D reconstruction using single optical images. Fully convolutional-deconvolutional network architectures are a useful tool that has been proven to be capable of guiding the model through the process of learning this ambiguous mapping with considerable accuracy (
29
). The main idea is to use satellite images and LiDAR data to train a model to learn the complex relationship between contextual information (texture, color, shading, etc.) and height, to regress a digital surface model (DSM). Mathematically, we denote with
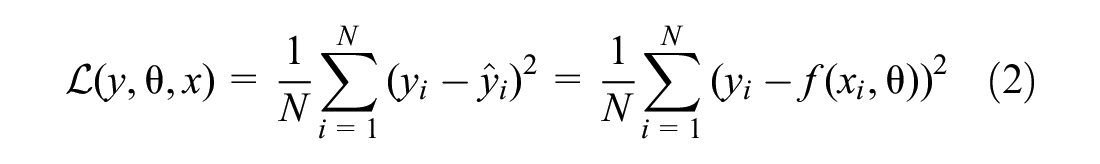
The model should minimize this loss function. Therefore, given a training dataset
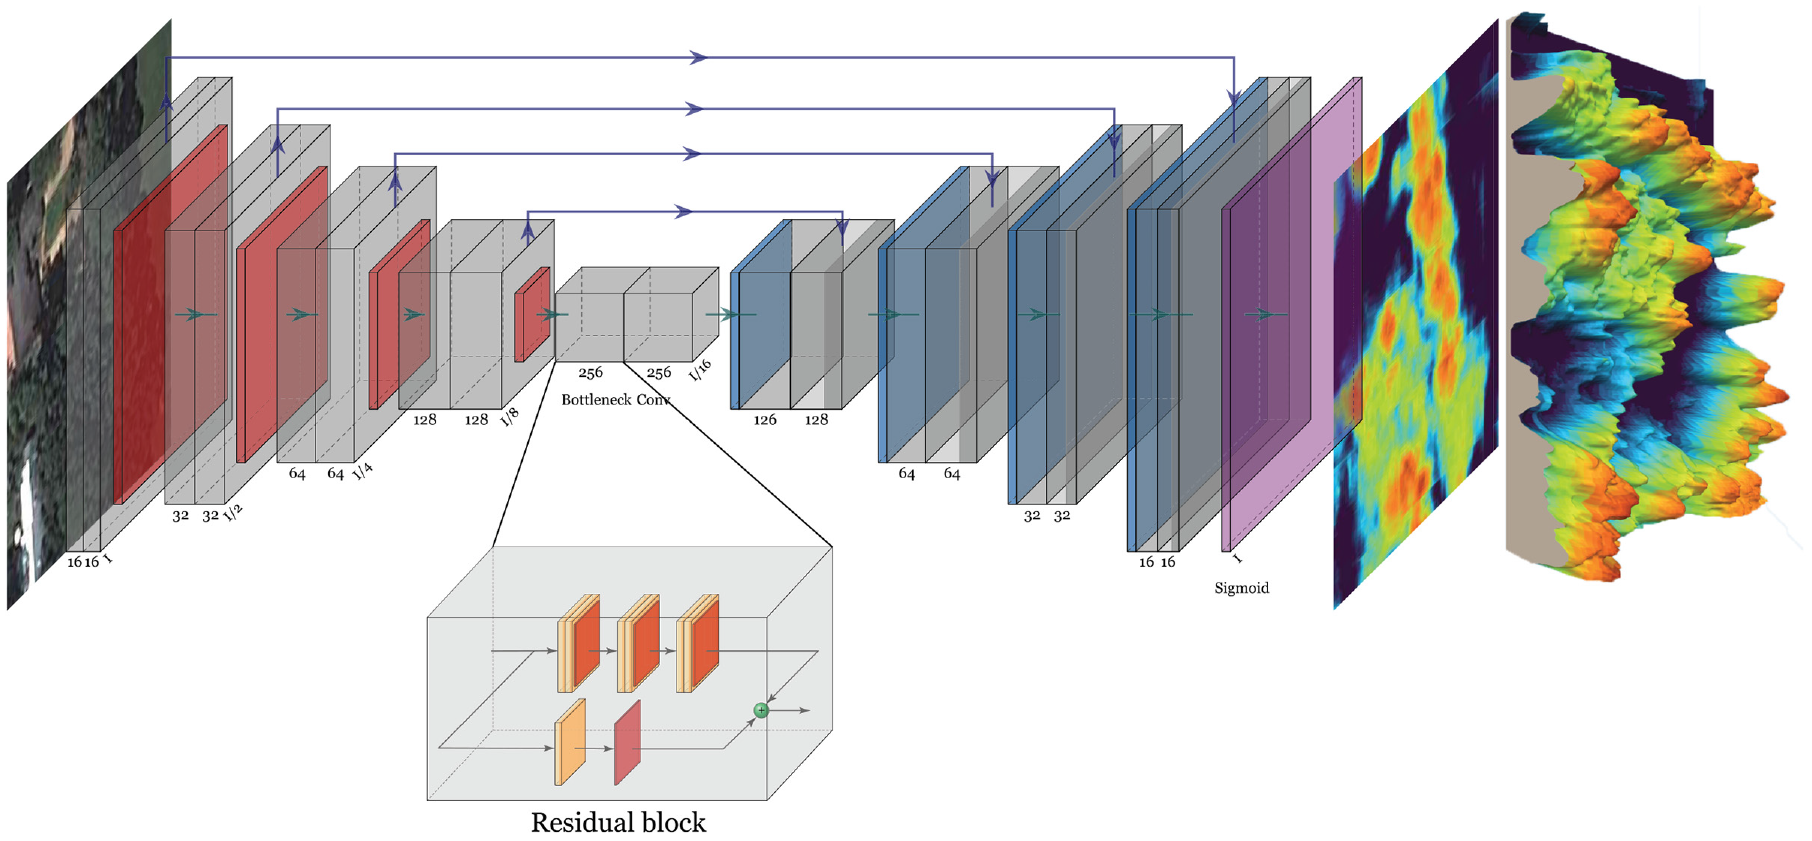
Deep-leaning model architecture used to regress the digital surface model (DSM) from a single satellite image.
Tree Detection
The output of the height estimation model is a DSM, which represents the height of the pixel. Trees are then detected using a local maxima filter running on the predicted DSM to estimate the position of the tree stem. The filter finds the peaks on the image corresponding to the highest values. A minimum distance between peaks is set to 6 m, and the minimum intensity of peaks set to 4 m to prevent oversampling the DSM with spurious peaks (caused by, for example, noise), (Figure 4).
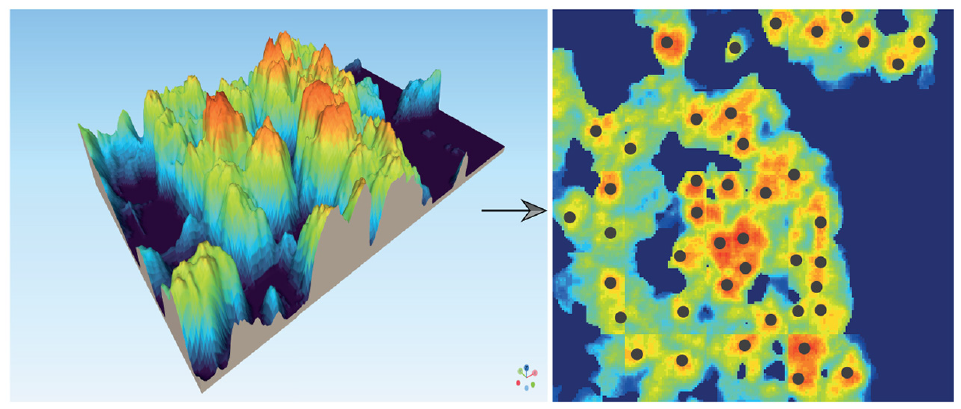
Digital surface model (DSM) represented as 3D surface.
Health Estimation
Furthermore, inspired by the work done in De Petris et al., we estimate the health of the vegetation in the considered area by analyzing the trend of vegetation index over the acquired multi-temporal images ( 31 ). An anomalous negative vegetation index trend can be caused by transitory problems, for example, insect attacks or gradual biomass decrease resulting from plant pathologies/tree aging. An unhealthy tree shows characteristics suggesting that rapid development in pathogenic wood-induced decay is ongoing and, consequently, its general propensity to fail is higher ( 32 ). We used the NDVI, defined as:

where
Green living plants look brighter in the NIR band because of chlorophyll NIR high reflectance. We compute the NDVI value in the study area for each of the five satellite images acquired during the years 2017 and 2018. To filter out spurious changes resulting from seasonality, we computed the average value of the index per each year and calculate the difference:

We assign the corresponding value from
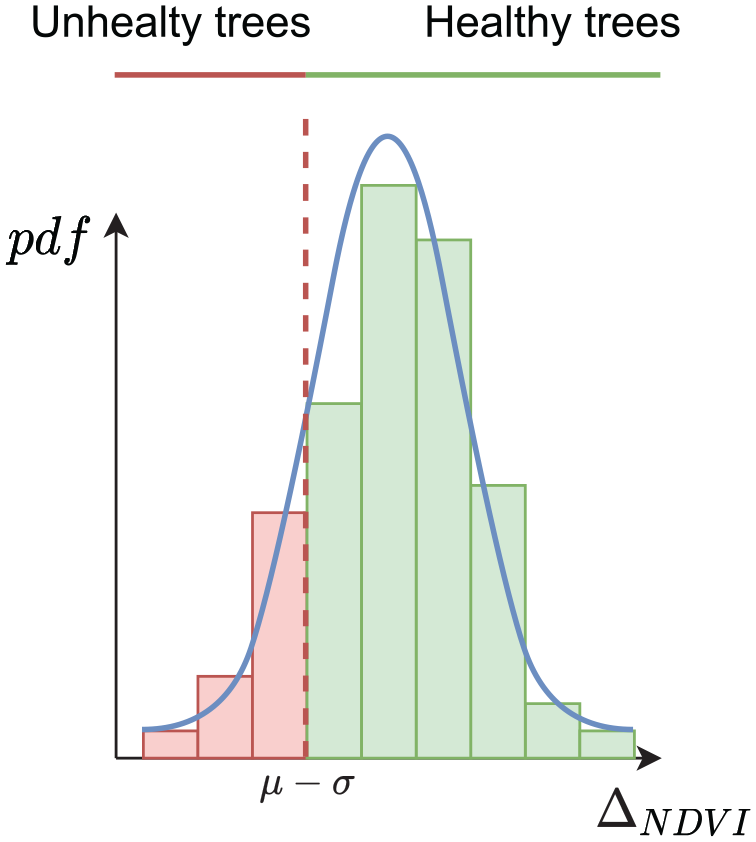
Based on the histogram of
Vegetation Exposure
The previous part estimates trees’ height, location, and health status. The number and distance of trees from the roadway can be derived from their location using the Euclidean distance. All these parameters are essential factors to consider and should be combined to assess the vegetation exposure to hurricanes for a given road. We extract equally distributed points every 20 m along the road. For each point, we compute the vegetation exposure

where
H = the height of the tree,
He = the health of the tree, and
D = the distance of the tree.
Figure 6 illustrates the process graphically.
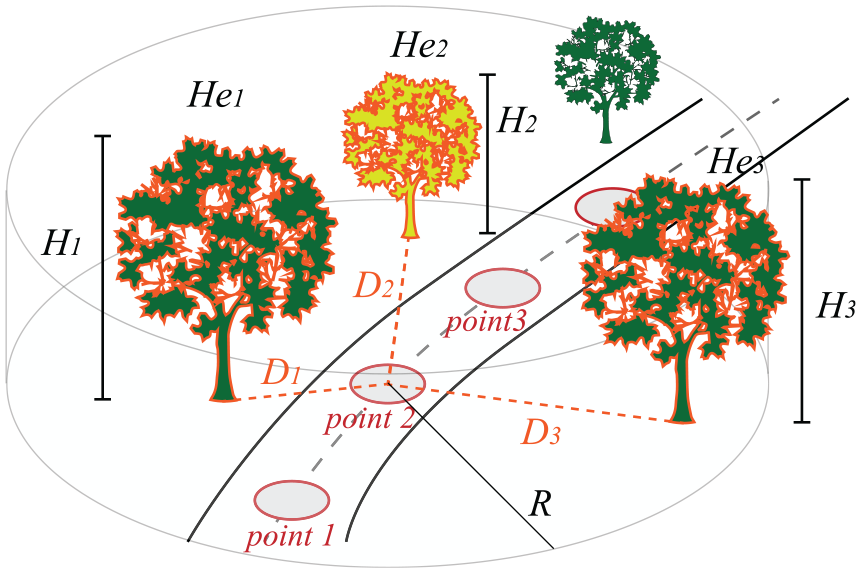
Vegetation exposure for a road.
Finally, the vegetation exposure for the entire road is defined as the maximum value among all the vegetation exposure calculated at the different points, Equation 6:

Topological Analysis
The previous part computes a value related to how exposed a road is, based on vegetation. However, as presented in Equation 1, the consequences of the closure should also be considered. Specifically, some roads are more important than others if we consider how they are connected. For instance, if a road has many connections, there exist several routes to bypass it in case of a blockage. On the other hand, a closure can potentially disconnect the network if the road has low redundancy. The set of all roads naturally forms a complex network that can be studied within graph theory. We first translate the roadway shape-file locations into a graph. We first remove the “dummy” nodes in the original file. Roads are usually composed of piece-wise linear segments and include nodes that exist only as points to help streets bend around curves, but they are not nodes in a topological sense. Topological nodes consist of all the intersections between roads. Figure 7 shows the process of converting the road shape-file into a graph structure visually. Note that we are only interested in the relation between nodes and edges in the graph analysis. Thus, the geographical shape of the road is irrelevant.
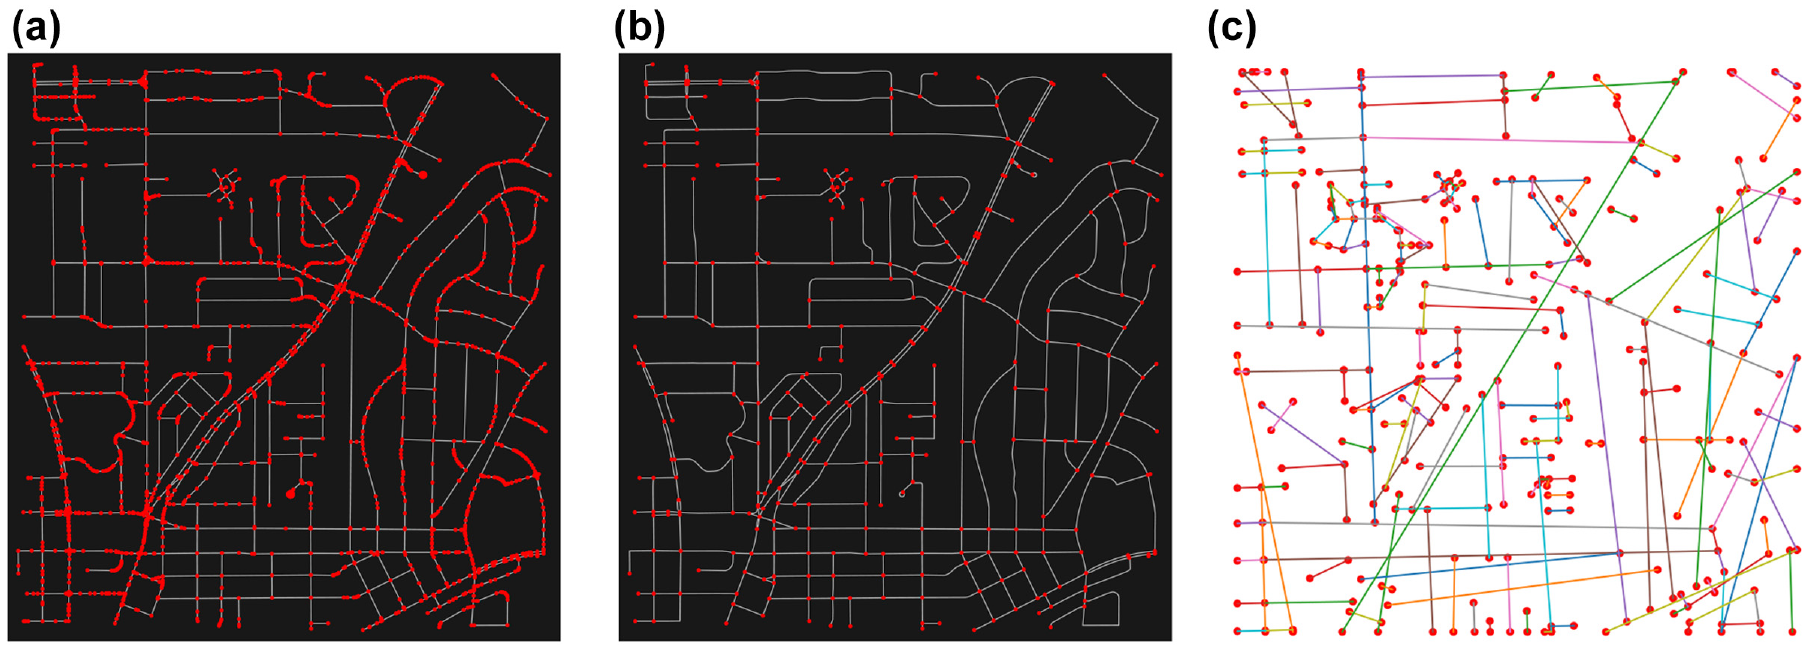
A roadway network shape-file (a) is converted into a graph structure (c) by removing the non-topological nodes (b): (a) Roadway network, (b) Roadway network where only the topological nodes are maintained, and (c) Roadway network as graph.
In this paper, we use the centrality indicator to rank the importance of edges in the graph network ( 33 ). In particular, we use the betweenness centrality of edges. Betweenness centrality measures the importance of an edge over the flow of information (i.e., traffic flow) between a pair of vertices in the graph under the assumption that information primarily flows over the shortest paths between them. From a transportation point of view, the betweenness centrality of a road (edge) is computed as the percentage of all shortest paths between two intersections (nodes) in the network that passes through the considered road (edge). Thus, a road with high betweenness centrality may have considerable influence over the information passing between other roads. So, they represent a critical part of the network, since removing them will disrupt the information flow in the network.
Betweenness centrality

where
Furthermore, we further classify the roads into two different groups, assigning a multiplier of
Vulnerability Score
Keeping in mind Equation 1, we calculate the vulnerability of a road

Results and Discussion
The framework has been developed in Python, using the Tensorflow/Keras libraries for the deep-learning modules, scikit-image for the image processing parts, and networkx library for the topology analysis (
34
–
36
). QGIS has been used to visualize and integrate all the different data (
37
). We first trained and tested the height estimator module. We trained the model described in Figure 3 using an Nvidia RTX 2080 Super as GPU. We used the Adam optimizer with a learning rate of
We calculate the distribution of the absolute error between the ground truth (derived from LiDAR) and the estimated height (from the model) as
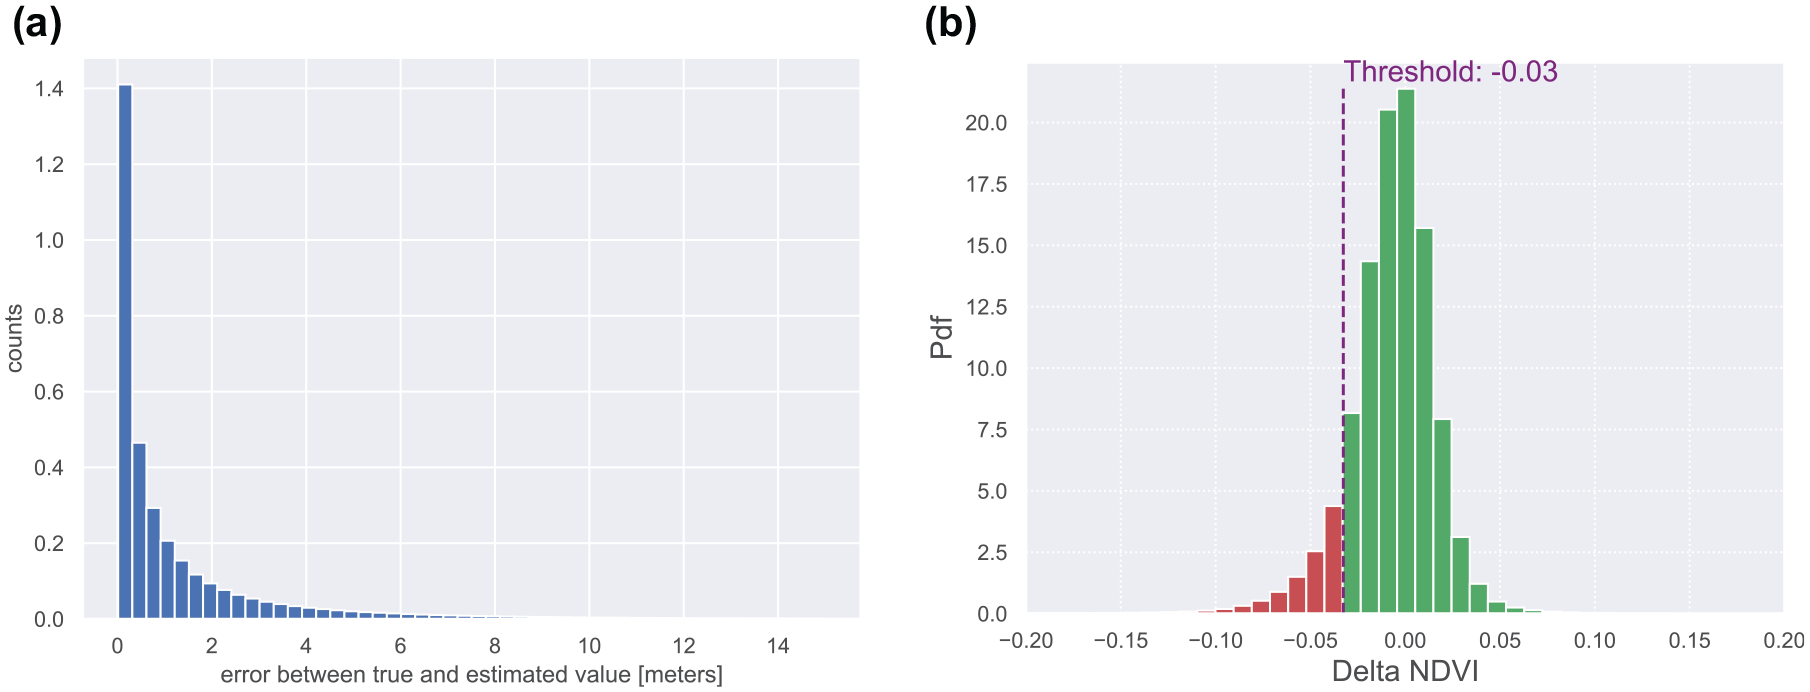
(a) Distribution of the height error between the estimated digital surface model (DSM) and the ground-truth, (b) Distribution of
Figure 9 shows a visual example of the estimated digital surface model (DSM) and the detected tree positions.
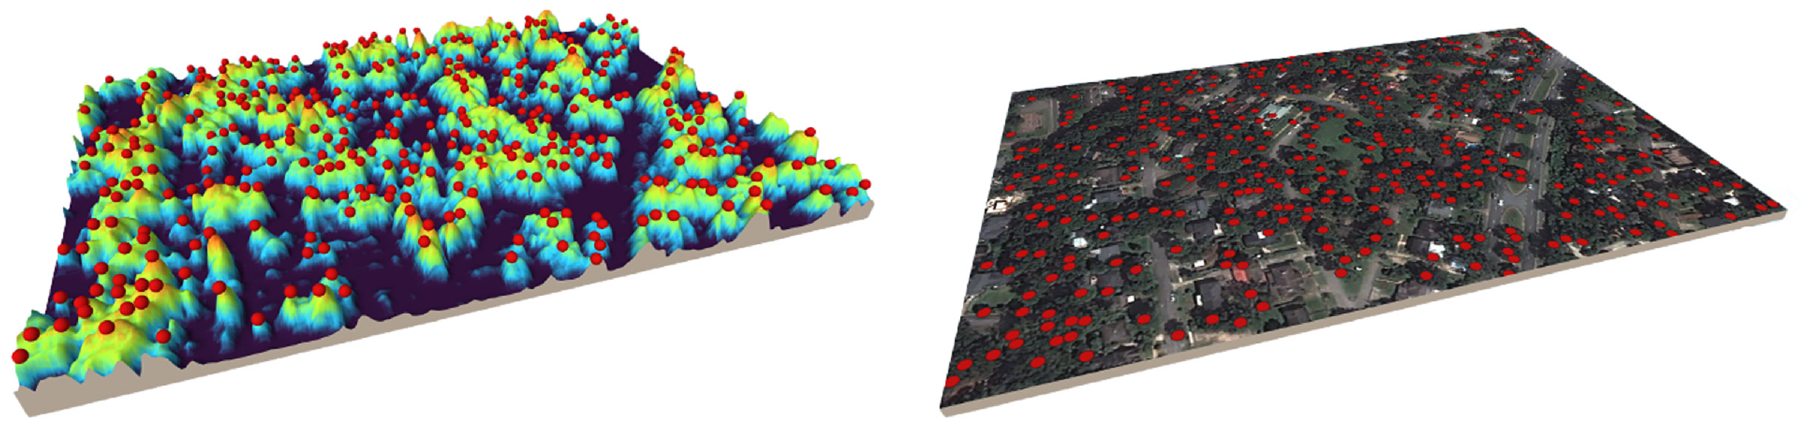
Digital surface model generated from the satellite image—trees are detected as the local maxima on the surface: (Left) Digital surface model generated from the satellite image, (Right) Trees are detected as the local maxima on the surface.
A tree catalog is built to store the information about each detected tree’s position, height, and health, as estimated in the previous steps. Once the tree catalog has been created, we compute vegetation exposure for each road. First, we sample a road every 20 m and use Equation 5 to compute the vegetation exposure per each location. The radius
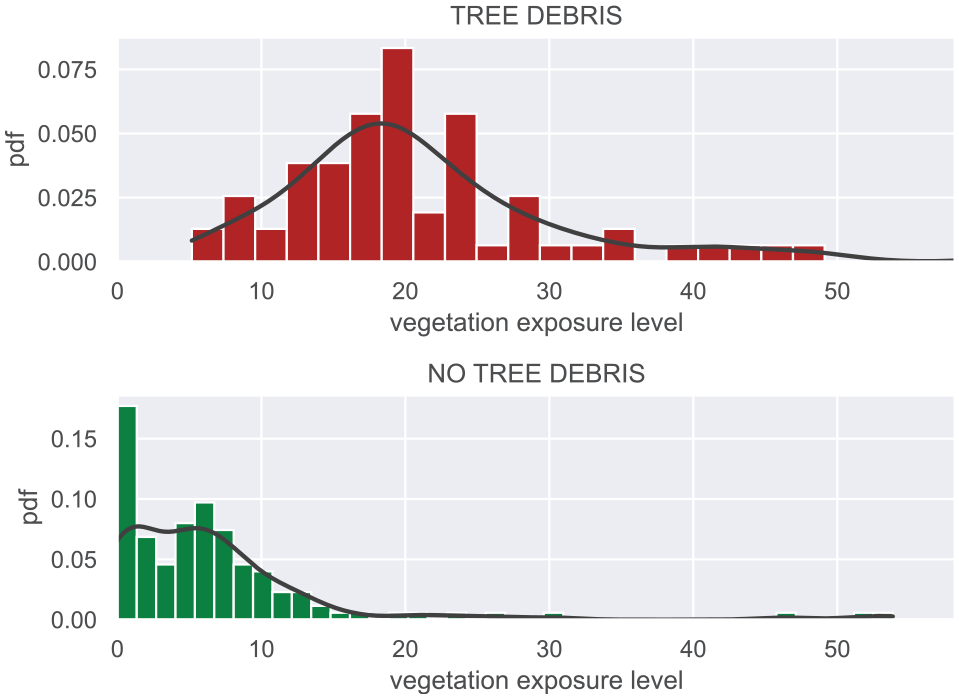
Vegetation exposure level for all the roads that had tree debris after the hurricane (top). Vegetation exposure level for all the roads that did not have tree debris after the hurricane (bottom).
We observe that roads that did not have tree debris in the proximity have, statistically, a lower vegetation exposure level. On the other hand, roads with tree debris have a higher vegetation exposure level. Nevertheless, because of the stochastic nature of the hurricane, there is a slight overlap between the two distributions. In other words, some roads with relatively significant vegetation exposure levels did not have fallen trees.
Before using Equation 8, we normalized the values within the range
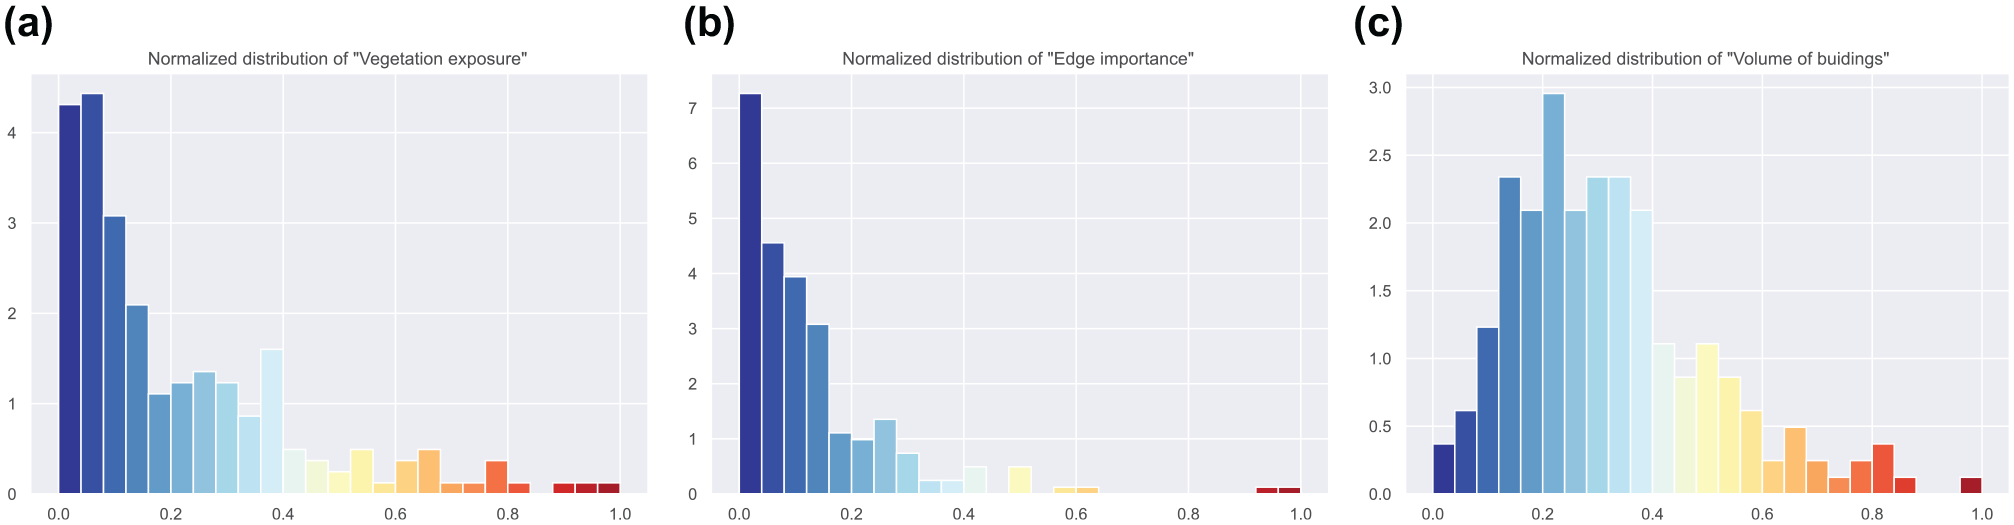
Normalized distributions for the three elements considered in Equation 2: (a) Normalized distribution of the vegetation exposure, (b) Normalized distribution of the road importance, (c) Normalized distribution of the buildings volume.
Finally, we can use Equation 8 to assign a vulnerability score to each road. Figure 12 shows the vulnerability map geographically displayed over the study area.
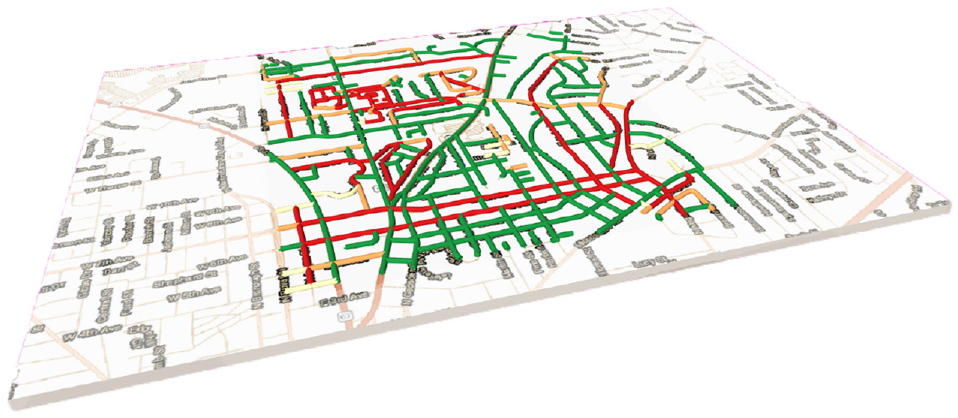
Vulnerability map of the study area generated using our remote sensing approach.
It is possible to automatically highlight the most vulnerable locations at the city scale. This can help the management teams and city responders to organize and allocate resources at specific points in the city.
Practicalities
We trained a deep-learning model to regress the DSM using LiDAR data from the municipality in the proposed framework. However, it is not always possible to have a DSM training dataset for the specific study area, especially when the ground truth comes from expensive sources such as LiDAR or time-consuming surveys. If LiDAR data or any height information is not available, training a model using a manually created dataset is impossible. Nevertheless, the model shown in Figure 3 can still be used to segment vegetation. Although the height cannot be retrieved this way, the distance and the number of trees can still be estimated from the segmentation map. A similar vegetation exposure function can then be modified to remove the height from the calculation. The advantage is that training datasets are generally easier to acquire in segmentation tasks than complete 3D point clouds. For example, free data can be used to train a segmentation model. If a model has been properly trained, it can still achieve sub-optimal yet accurate results.
To illustrate this concept, we trained our model using both our data from Tallahassee and data from the Potsdam dataset. The dataset, from a portion of the German city of Potsdam, is downloadable at the International Society for Photogrammetry and Remote Sensing (ISPRS) (
38
). The output of the model, in this case, is a binary map where “1” is if a pixel is part of a tree and “0” otherwise. Instead of the regression loss presented in Equation 2, binary cross-entropy

where
The output of the model is a probability value between 0 and 1. Cross-entropy loss increases as the predicted probability diverges from the actual label.
Accuracy score metrics is defined as:
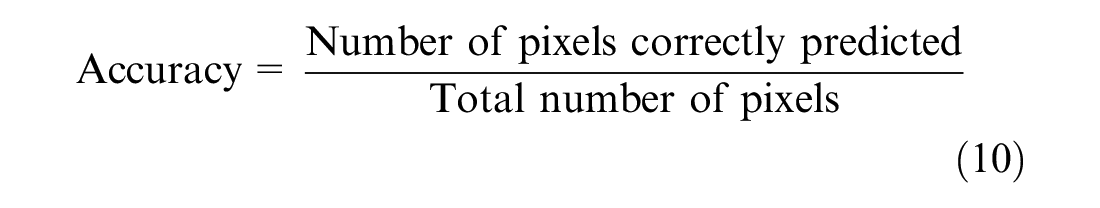
and results are shown in Table 1.
Comparison Between the Tree Segmentation Model Using the Potsdam or Tallahassee Dataset as Training. The Testing Area is Tallahassee for Both Cases
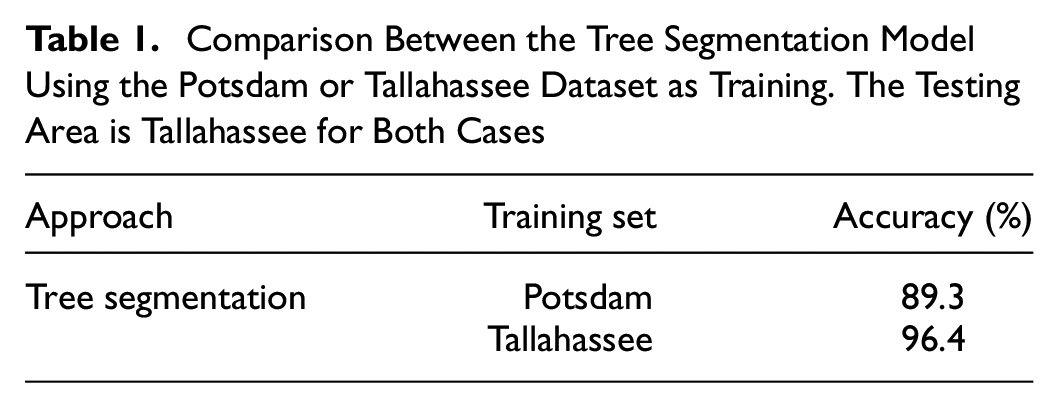
Figure 13 shows an example of vegetation segmentation for a portion of the area using our model.
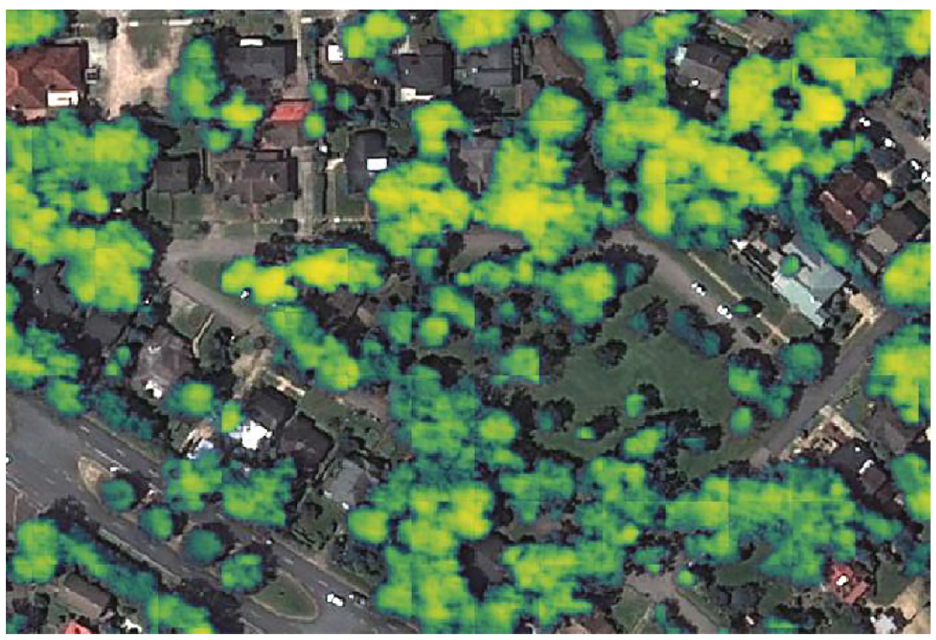
Output of the model in Figure 3, trained to perform vegetation segmentation instead of height regression.
There is a drop in the performances when we use the model trained in a completely different area. However, this is not very limiting from a practical point of view as the model can be fine-tuned using the new area, with less data.
Finally, it is worth mentioning that the proposed vulnerability function (Equation 8) is not unique and local authorities might implement different functions. Furthermore, other data can be included, depending on their availability. Nevertheless, in this paper, the scope is to show the capabilities of remote sensing to retrieve helpful information that can be used for vulnerability assessment.
Conclusions
This paper developed an automated framework to detect vulnerabilities at the roadway level using satellite imagery. We used high-resolution satellite images of a portion of Tallahassee (Florida) acquired before Hurricane Michael in September 2018. The framework calculates the vegetation exposure of roads based on tree parameters estimated from satellite images, such as height, health, proximity to roads, and density. Additionally, it integrates the vegetation exposure with the number of buildings and the road importance and assigns each road a vulnerability score. A vulnerability map can be generated road-wise for the whole roadway network. It can be quickly generated before the event and can improve the planning procedures conducted by city and state agencies. Compared with visual or manual surveys, it is also cheap and practical to implement. The proposed methodology can be applied to other cities prone to hurricanes, given the data availability. Especially for small and medium coastal towns with limited resources prone to storms in Florida, the proposed approach can help quickly identify highly vulnerable locations on roadways without the need for sophisticated technology. Finally, local authorities could implement customized or adapted functions based on additional data and their prior knowledge and experience. We believe our method can serve as a complementary source to the other existing approaches (e.g., manual surveys, drones), providing a high potential for added satellite-based observability with minimal costs and high availability, and attaining traction as our industry becomes better at storing and sharing datasets.
Footnotes
Acknowledgements
Our involvement in the ITU/WMO/UNEP Focus Group on AI for Natural Disaster Management (FG-AI4NDM) activities and leading a use case on AI for hurricanes’ impact inspired this paper ( 40 ). We greatly appreciate the FG-AI4NDM team and chair (Dr. Monique Kuglitsch) for creating a collaborative learning and knowledge exchange environment. Finally, the authors want to thank the City of Tallahassee for their support and for providing data.
Author Contributions
The authors confirm contribution to the paper as follows: study conception and design: M. Gazzea, A. Karaer, M. Ghorbanzadeh, E. E. Ozguven, R. Arghandeh; Data collection: M. Gazzea, A.Karaer, M.Ghorbanzadeh, E.E.Ozguven and R. Arghandeh; analysis and interpretation of results: M.Gazzea, A. Karaer, M. Ghorbanzadeh, R. Arghandeh; draft manuscript preparation: M. Gazzea, A. Karaer, M. Ghorbanzadeh, E. E. Ozguven, R. Arghandeh. All authors reviewed the results and approved the final version of the manuscript.
Declaration of Conflicting Interests
The author(s) declared no potential conflicts of interest with respect to the research, authorship, and/or publication of this article.
Funding
The author(s) received no financial support for the research, authorship, and/or publication of this article.
The views expressed in this paper are of the authors and do not necessarily reflect the opinions or policies of the City of Tallahassee.