
Abstract
Transport plays a major role in spreading contagious diseases such as COVID-19 by facilitating social contacts. The standard response to fighting COVID-19 in most countries has been imposing a lockdown—including on the transport sector—to slow down the spread. Though the Government of Bangladesh also imposed a lockdown quite early, it was forced to relax the lockdown for economic reasons. This motivates this study to assess the interaction between various non-pharmaceutical intervention (NPI) policies and transport sector outcomes, such as mobility and accidents, in Bangladesh. The study explores the effect of NPIs on both intra- and inter-regional mobility. Intra-regional mobility is captured using Google mobility reports which provide information about the number of visitors at different activity locations. Inter-regional, or long-distance, mobility is captured using vehicle count information from toll booths on a major bridge. Modeling shows that, in most cases, the policy interventions had the desired impact on people’s mobility patterns. Closure of education institutes, offices, public transport, and shopping malls reduced mobility at most locations. The closure of garment factories reduced mobility for work and at transit stations only. Mobility was increased at all places except at residential locations, after the wearing of masks was made mandatory. Reduced traffic because of policy interventions resulted in a lower number of accidents (crashes) and related fatalities. However, mobility-normalized crashes and fatalities increased nationally. The outcomes of the study are especially useful in understanding the differential impacts of various policy measures on transport, and thus would help future evidence-based decision-making.
The increasingly interconnected transport system plays a major role in spreading contagious diseases such as the pandemic of Coronavirus 2019 (COVID-19), and, previously, regional epidemics of severe acute respiratory syndrome (SARS) and Middle East respiratory syndrome (MERS) ( 1 ). The standard response to COVID-19 in most countries was to impose a complete lockdown or severe restrictions on the transport sector—along with the rest of the economy—to reduce population exposure by limiting social contacts and slow down the spread of the virus ( 2 ). Consequently, various countries of the world saw unparalleled changes in mobility pertaining to different sectors ( 3 , 4 ). The substantial reduction in mobility also affected the accident and fatality rates ( 5 ). It can be noted that the non-pharmaceutical intervention (NPI) policies varied widely across different countries, ranging from restrictions on international and domestic travel to the curtailment of public and private gatherings ( 2 ). Many countries decided to completely shut down several institutions, such as schools, offices, and public transportation, to control the rate of COVID-19 infection and reduce the burden on health care systems. This presented a unique opportunity for investigating the impacts of different NPIs on traffic, mobility, accidents, and fatalities.
Such exploration is important for understanding the efficacy of NPIs for controlling the global health crisis. Moreover, the lessons learned from the crisis would be instrumental in devising policies for combating future health emergencies. Therefore, many countries across the world have been analyzing the impact of the interventions on the transportation system and on the spread of the virus ( 6 ). However, most of the studies are limited to the European and North American regions, with a growing number of studies being from China—where the virus originated ( 7 ). It can be noted that the multi-country analysis conducted in the literature could not address the impact of local events (such as religious festivals) on the traffic and mobility indicators. Moreover, many of the studies did not quantify the distinctive impact of various interventions, but rather focused on before-and-after comparison of the intervention impacts ( 4 , 8 , 9 ). Also, most quantitative studies to date have mainly focused on the impact of containment-and-closure-type interventions. Quantitative explorations of the impact of health regulations, such as face coverings, on mobility vis-à-vis physical distancing are quite scarce ( 10 ).
Also, there is a dearth of literature from South Asian countries where the COVID-19 case tally (at the time of writing) has surpassed 30 million ( 11 ). Consequently, many of the interventions in countries like Bangladesh—one of the most densely populated countries of the world—were taken on a trial-and-error basis without any prior evidence of efficacy ( 12 ). This article addresses this research gap by employing a case-study-based approach to explore the efficacy (and lack thereof) of different NPIs such as containment-and-closure-type interventions, and health regulations on the traffic, mobility, and accidents in Bangladesh. The paper investigates the effect of NPIs on both intra- and inter-regional mobility. Intra-regional mobility is measured using Google mobility data that provides information about the number of visitors at different activity locations such as retail and recreation, grocery and pharmacy, public transportation stations, and so on ( 13 ). Inter-regional mobility is measured using vehicle count information from toll booths on a major highway in Bangladesh. The specific research questions that this study aims to address are:
What are the distinct impacts of specific policy and business decisions on various transport outcome such as intra- and inter-regional mobility or stay-at-home durations?
What are the road crash and fatality impacts of these interventions?
The rest of the paper is organized as follows. The next section describes the various literature on the effect of NPI policies on mobility and accidents. The data and methods section introduces the various policies undertaken by the government of Bangladesh to tackle the previous wave of COVID-19 spread. This section also introduces various mobility and crash data and describes the statistical methods adopted in the study. The results section presents the descriptive analysis of the mobility and accident data as well as the statistical analysis conducted to quantify the differential impacts of different policy interventions on mobility. This section also highlights the changes in mobility normalized crashes and fatalities. The conclusion section summarizes the policy recommendations and concludes the paper.
Literature Review
Changes in Mobility because of Non-Pharmaceutical Intervention (NPI) Policies
Researchers adopted various methods to quantify the change in mobility during the COVID-19 disruption. The methods used for analysis ranged from descriptive analysis to multiple linear regression and time series analysis.
Descriptive Analysis
The studies that primarily relied on descriptive analysis could report the percentage reduction in mobility; however, they could not quantify the differential impact of various interventions. For example, Spain observed a 76% reduction in overall mobility with public transportation reducing by 93% during the imposed confinement in the city of Santander ( 3 ). In the same vein, Budapest observed a dramatic decrease in the public transit share—an 80% drop—while the share for cycling and bike sharing decreased the least, by 23% and 2%, respectively, during lockdown ( 4 ). Qatar observed 30% reduction in overall traffic during the period of preventive measures Muley (14).
Praharaj et al. conducted a multi-city descriptive analysis to identify the differential impact of policy interventions across countries using data from Phoenix, Arizona; Sydney, Australia; London, UK; and Pune, India ( 15 ). The study found similar responses to the lockdown policies across the four cities compared with the pre-lockdown period. However, the cities did respond differently to the release of the lockdown measures. The authors noticed a faster recovery of the mobility in the cities of Phoenix and Sydney while the mobility in London and Pune took longer to reach the pre-lockdown level. Yabe et al. identified that, in Tokyo, Japan, non-compulsory measures were enough to reduce human mobility by 50% resulting in 70% decrease in social contacts ( 16 ).
Regression and Time Series Analysis
While many of the studies in this realm were conducted in the context of a single country (mostly for the U.S.), a few did investigate the multi-country response to similar intervention policies. This section presents the single-country investigations first, followed by those conducted for multiple countries.
Li et al. explored the changes in mobility across various states in the U.S. using data from Google mobility reports ( 17 ). According to their research, the closure of public transportation had the largest impact in reducing human mobility. The efficacy of stay-at-home orders, cancellation of public events, and office closures was only significant until the third week of the policy initiation. They did not find any significant impact of school closures and national/international travel restrictions in their study.
Hu et al. applied autoregressive time series models to measure the changes in person trips, person miles traveled, and stay-at-home duration in various counties across the U.S. ( 18 ). The study controlled for different confounding factors such as socio-demography, political party, industry, and weather. However, only two policy variables were investigated, pertaining to stay-at-home orders and reopening.
In a recent article, change in average daily journey speed in Dhaka—the capital of Bangladesh—was used to study the effect of different COVID-19-related policy interventions ( 19 ). According to the study, only the closing of educational institutions and declaration of general holidays affected the traffic speed. They did not find any significant effect of closure of garment factories and shopping malls. It can be noted that the study grouped multiple interventions such as office and public transportation closure under the hood of general holiday. Also, the study employed multiple linear regression analysis which did not capture the temporal correlation of the speed across the days.
Armstrong et al. applied dynamic time series techniques to investigate the impact of policy interventions across 75 Canadian and American cities ( 20 ). They formed a latent variable called “aggressiveness” to capture the effect of 11 provincial and state policies including the state emergency and shelter-in-place declaration, and closing of schools, day-care, non-essential business, restaurants, and recreation centers. Therefore, though they were able to notice significant impact of the overall policy interventions on mobility across the 75 cities, the differential impact of different policies was not captured in their analysis.
Askitas et al. used Google mobility data to investigate the impact of policy interventions in 175 countries ( 6 ). They tested both the anticipation effect—that is, whether the mobility started to change in anticipation of an intervention—as well as the change in the intervention effect with time. The anticipation effect was not significant, according to the study. However, they noticed that the effect of some of the policy interventions weakened over time.
Summan and Nandi conducted yet another multi-country study to investigate the impact of three NPIs—national school closure, country-wide lockdown, and global travel ban ( 21 ). According to their study, school closure did not have any significant impact on mobility reduction.
Limitations of the Previous Studies
Most of the studies exploring the impact of NPIs conducted multi-country analysis, which had the advantage of controlling for confounding factors such as demography and weather. However, in many cases, they had to group the NPIs into a few aggregate categories (such as policy aggressiveness, or stay-at-home order) which limited their ability to delineate the differential impacts of various policies. Also, none of the above studies could demarcate the effect of local events which played a crucial role in COVID-19 spread in South Asian countries ( 22 ).
Moreover, the majority of the studies considered the impact of mobility containment-and-closure-type interventions, such as stay-at-home orders, cancellation of public events, and closure of school, work, and non-essential businesses. Seldom have these studies considered the efficacy of health measures such as mandatory or suggested face covering. Even in cases where the health regulations like face covering are considered, it is grouped with other containment-and-closure measures—such as in Armstrong et al. ( 20 ). As a result, the effect of face covering on mobility or social distancing could not be deduced. The studies that explicitly investigated the impact of face covering on social distancing often relied on stated preference data ( 10 ). In case of revealed preference explorations, only the impact of very few other containment-and-closure measures are considered ( 23 ).
Changes in Accidents because of Non-Pharmaceutical Interventions (NPIs)
The studies conducted in this domain mostly relied on descriptive statistics. It can be noted that, because of the reduction in mobility during COVID-19 disruption, accidents were expected to go down. Therefore, investigating the changes in the mobility normalized crashes should provide better evidence of the traffic condition during the disruption. However, not all studies controlled for the changes in mobility while reporting the changes in the accident count. This section starts with the studies that only looked at non-normalized accident measures followed by those that reported the changes in mobility normalized crashes.
During the COVID-19-related lockdown in Spain, traffic accidents went down by 67% compared with the pre-lockdown period (8).Turkey noticed a 60% drop in traffic accidents with 40% reduction in fatalities and 64% reduction in injuries during the stay-at-home order ( 24 ). Qatar observed 73% drop in traffic violations and 37% drop in traffic accidents during the period of COVID-19-related preventive measures ( 14 ). Somewhat similar percentage reductions were reported for Louisiana, U.S., by Barnes et al. who found 46% reduction in traffic accidents involving injuries ( 5 ). Katrakazas et al. explored driving behavior in Greece and the Kingdom of Saudi Arabia (KSA) using data collected through mobile phone applications ( 25 ). They found 6% to 11% increase in traffic speed and up to 12% increase in harsh driving maneuvers (e.g., harsh acceleration and harsh breaking) during the peak of COVID-19 infection in the respective countries. This period was also associated with up to 42% increase in mobile phone use during driving. The study reported 41% reduction in accidents in Greece during this period. These metrics were not normalized for the reduction in traffic.
Doucette et al., in a study conducted for Connecticut, U.S., noted that though the vehicle miles traveled (VMT) decreased by 43% during the stay-at-home order, single-vehicle crashes and single-vehicle fatal crashes increased by two and four times, respectively, after controlling for the reduction in VMT ( 9 ). Qureshi et al. observed a reduction in accidents resulting in minor or no injuries during the state-mandated lockdown in the state of Missouri, U.S. ( 26 ). However, accidents resulting in fatal injuries did not plunge statistically significantly during the same period. On the other hand, Saladié et al. reported a higher percentage reduction in accidents than the reduction in mobility in Tarragona, Spain, during the COVID-19-related lockdown ( 8 ). According to their study, mobility reduced by 63% while the number of accidents dropped by ∼75%.
In summary, the change in accidents during COVID-19 disruption was not uniform across countries. While the U.S. reported a rise in VMT normalized accidents, some countries in Europe did notice a reduction during the same period.
Data
NPIs Undertaken in Bangladesh During the First Wave of COVID-19 Spread
In response to the COVID-19 pandemic, the government of Bangladesh adopted several NPIs to control the spread of the virus. The key policy interventions undertaken in Bangladesh are shown in Figure 1. Figure 1 also includes other events that could have affected COVID-19 spread or disrupted normal travel patterns, for example, the two major religious festivals that fell within the analysis period. The COVID-19 interventions encompassed all aspects of day-to-day life. At the onset of COVID-19 infection, the interventions began with the closing of educational institutions, all government and private offices, garment factories and other factories, and shopping malls (except pharmacies and grocery stores). The withdrawal of the NPIs started with the opening of garment factories—manufacturers of the topmost export product in Bangladesh. The workplace and public transportation resumed pre-lockdown capacity gradually. Initially, they were resumed at limited capacity which returned to the pre-lockdown operation after a period of observation by the law enforcement authorities.
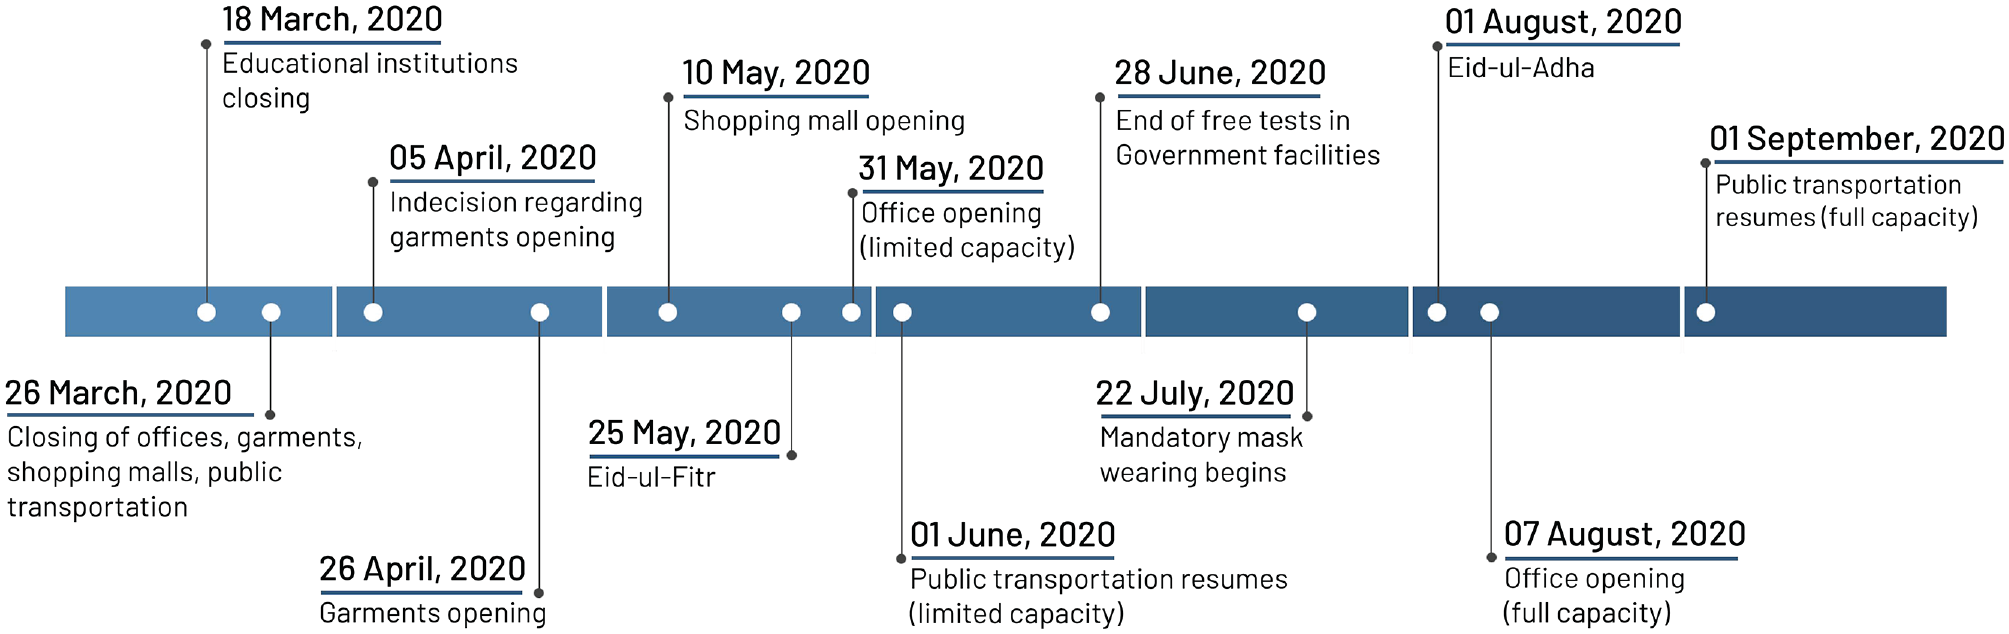
Non-pharmaceutical intervention (NPI) policies in Bangladesh in response to COVID-19 first wave.
It can be noted that garment factory owners decided to open the garment factories on April 5, 2020, which led to a substantial mobilization of garment workers from rural areas to the municipalities. However, eventually garment factory owners backtracked on their decisions—leading to the return journey of the workers to their homes. This was one of the most disputed policy decisions made in the context of COVID-19 regulation.
The government ordered mandatory mask use on July 22, 2020, to contain the spread of the virus amid the regular operation of offices and services. It can be noted that, at the time of writing, only educational institutions had not got back to the pre-lockdown physical operation phase since their closure.
Traffic and Mobility Data
Mobility Trends from Google Mobility Reports
Daily mobility information is collected from the publicly available Google community mobility reports ( 13 ). Google provided nationwide mobility trends for Bangladesh. The report provides mobility trends from February 15 to October 31, 2020, related to different sectors including retail and recreation, grocery and pharmacy, parks, public transport, work, and residents. The mobility values are calculated as the percentage change in the number of visitors compared with the baseline for all sectors except for residents. The residential values are calculated as the percentage changes in the number of hours spent at home. The baseline in the Google mobility data is a median value, for the corresponding day of the week from January 3 to February 6, 2020.
Classified Vehicle Count from Toll Booths
The data were collected from a private toll collection operator on the Meghna-Gomoti bridge system connecting Dhaka and Chattogram. This is a system of two bridges on the most important highway in Bangladesh, connecting the capital and the largest city to the largest port and second-largest city. Attempts to collect further data on inter-city traffic via other important bridges were not successful because of the commercial sensitivity of the data. As such, our results cover long-distance travel within a specific region of the country, albeit the most important economic corridor. The toll operator provided us daily classified vehicle counts during the period from January 2019 to October 2020. We normalized the vehicle counts through dividing by the maximum count of the respective vehicle category and direction and then multiplying by 100.
Road Traffic Accidents
The official source for recent crash statistics in Bangladesh is the police-reported First Information Record (FIR). This data contains the aggregate statistics in relation to crashes, fatalities, and injuries by major police range office and metropolitan areas. It can be noted that in this study we define a crash as the collision between vehicles. Fatalities refer to the number of mortalities resulting from a crash and injuries do not include fatalities.
The FIR contains the count of accidents by some major vehicle categories such as buses, trucks, motorcycles, and so forth. This data were available in monthly frequency for the whole country from October 2018, and data from January 2019 to December 2020 were utilized for the visualization and analysis presented later.
In addition to the FIR data, we also collected accident data from the Accident Research Institute (ARI) of Bangladesh University of Engineering and Technology (BUET). This was done to cross-check the validity of the FIR data. Like the FIR data, ARI data also contain crashes, fatalities, and injuries information at monthly frequencies, but ARI collects this information from newspaper articles. This data were collected in monthly frequency for the whole country and for Dhaka city from January 2019 to December 2020.
Methods
Impact of NPIs on Mobility
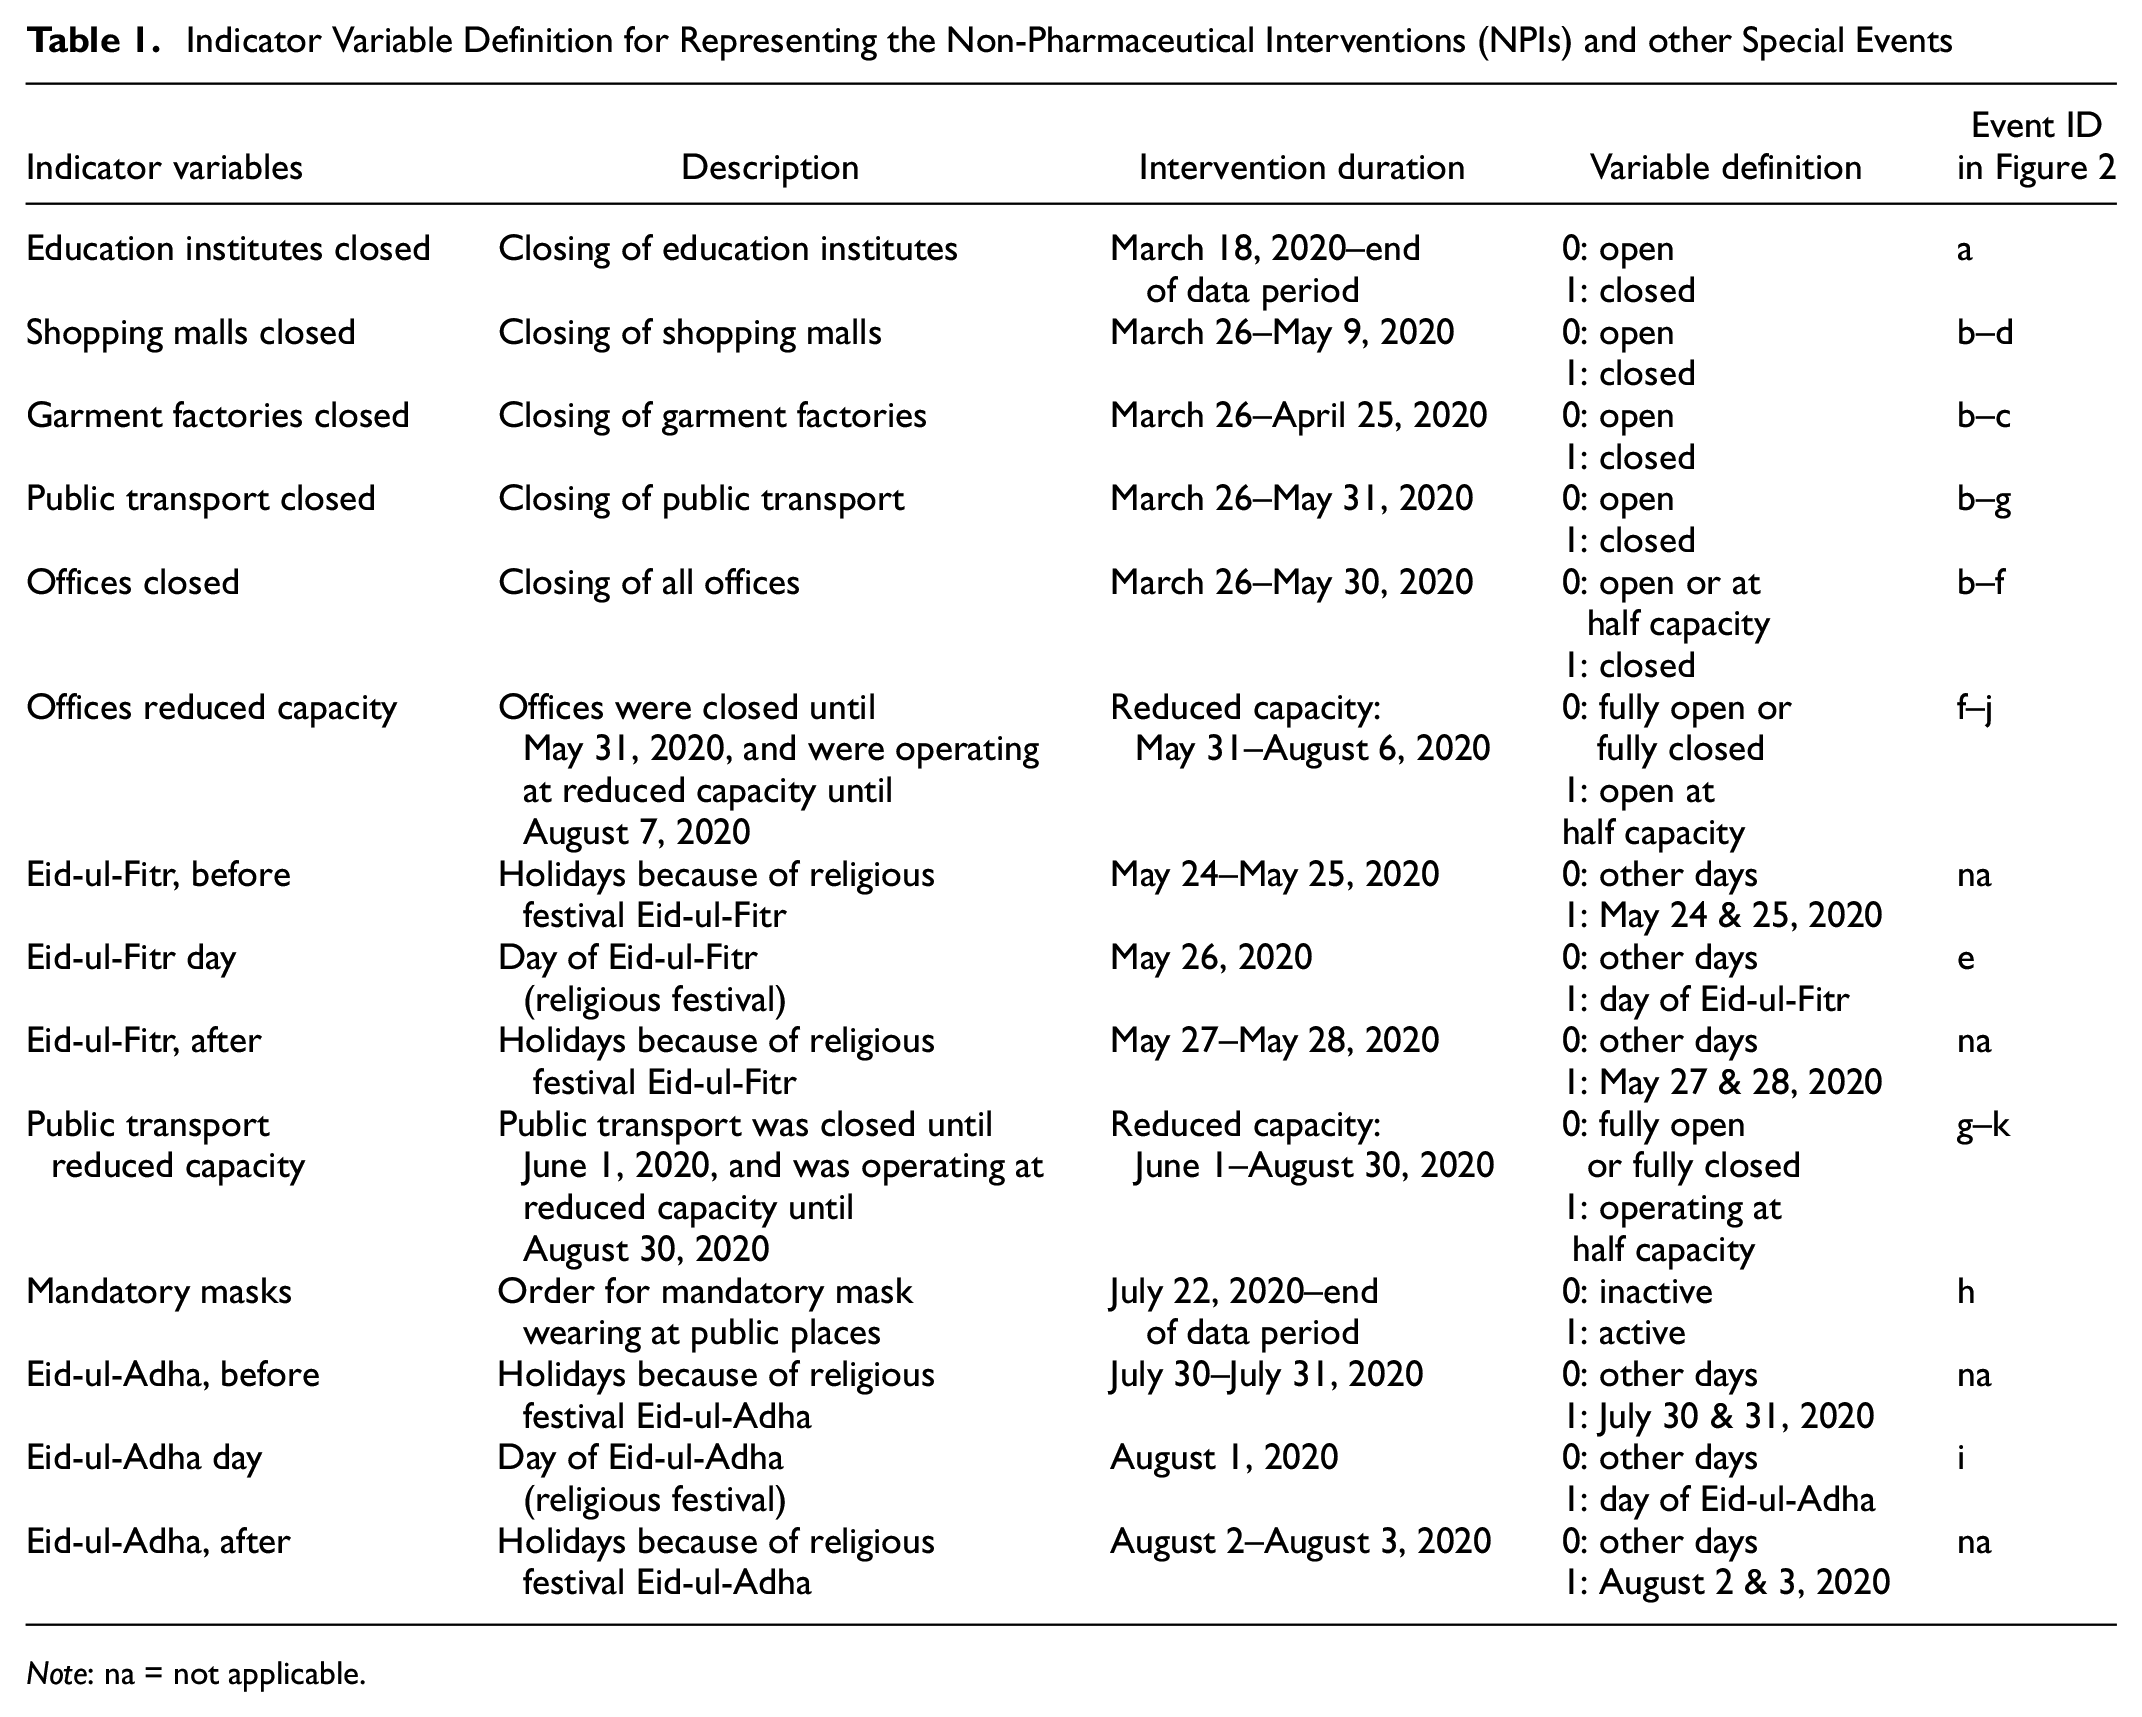
We adopted autoregressive time-series techniques to explore the relative contribution of the various NPI policies on six mobility indicators ( 27 ). Various NPIs were converted into indicator variables where the active period of a policy was represented by 1. Three separate indicator variables were developed around each of the two religious festivals to capture the differential impact of the pre-, during, and post-festival periods on the mobility of various sectors. Various indicator variables used in the model are presented in Table 1. We also included weekend or day of week indicators to capture the inherent difference in mobility patterns across weekdays and weekends.
Indicator Variable Definition for Representing the Non-Pharmaceutical Interventions (NPIs) and other Special Events
Note: na = not applicable.
Six separate models are estimated to capture the mobility trend in the retail and recreation, grocery, park, transit, work, and residential sectors. Equation 1 presents the generic model formulation.
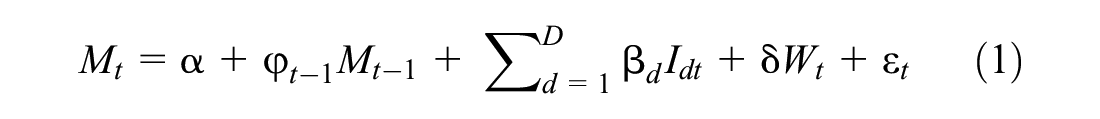
where
M = one of the six mobility trends,
The constant
We also explored the impact of NPIs on inter-regional mobility with the vehicle count data collected from the toll booths as the dependent variables. Specifically, the dependent variables used in the models are the percentage changes in the vehicle count with respect to median of the respective vehicle type where the median is calculated for the period of January 1 to February 14, 2020. The model form used for the inter-regional mobility is quite similar to the one presented in Equation 1. However, for clarity, the generic model form used for different vehicle types is presented in Equation 2 below.
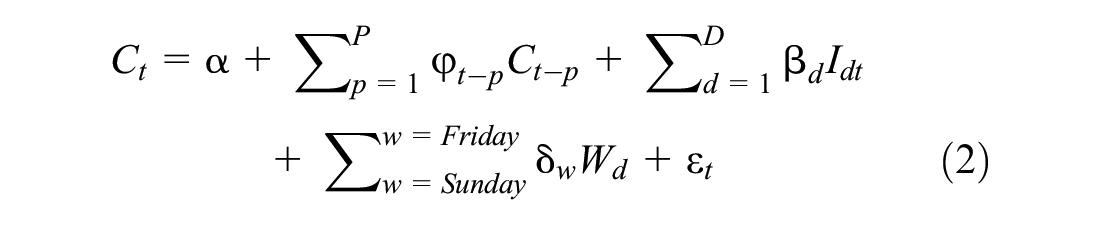
where
C = the percentage change in different vehicle types, that is, motorcycle, car, and microbus (referred to as car group from this point forward), and bus and minibus (referred to as bus group),
P = the order of the autoregressive model,
The model sets represented by Equations 1 and 2 were estimated in the statistical package Stata. The lag of the dependent variable was determined based on the auto-correlation factor and partial auto-correlation factor plots. We used the Breusch-Godfrey test statistics to investigate the presence of serial correlation in the residuals. We presented robust standard errors in cases where the null hypothesis of no serial correlation had to be rejected.
Impact of Mobility Reduction on Accidents
We used descriptive statistics, such as two-sample t-stats with unequal variance, to compare the accidents and fatalities across normal and intervened periods. We compared both the un-normalized and normalized accident and fatalities for Dhaka and Bangladesh in this study. It can be noted that crash or fatality counts are often normalized with respect to VMT. However, in the absence of such information, the absolute monthly crashes and fatalities for Dhaka and Bangladesh were normalized in the following ways.
First, the monthly crash and fatality data were normalized to 30-day months to even out monthly differences in the number of days. Second, Google community mobility report data were used to infer average monthly reductions in traffic. Given that Google mobility reports do not exactly measure traffic count or flow, three separate metrics from these reports were used to normalize crash data to ensure a consistent finding. The three normalizing variables were the mobility in work, retail and recreation, and transit stations.
Results
Descriptive Analysis
Variation in Traffic and Mobility
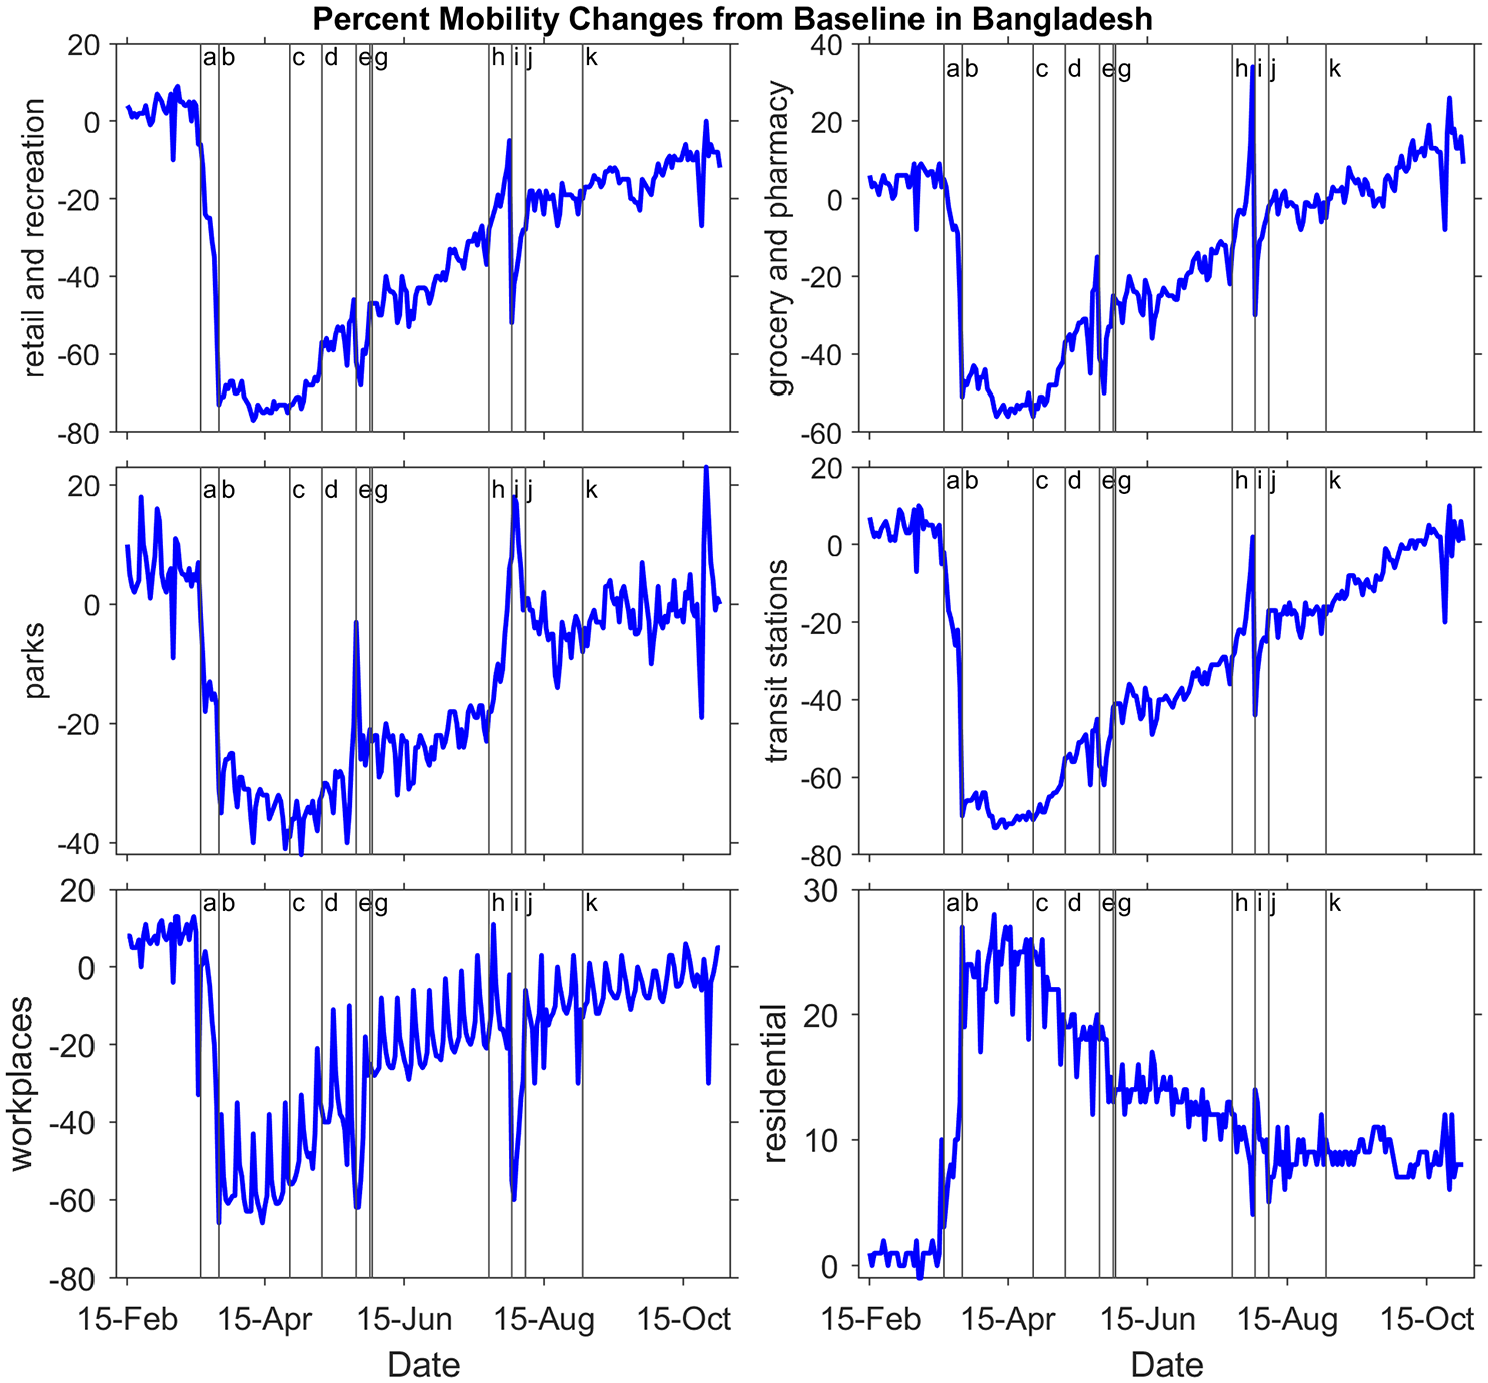
Percentage change in mobility from baseline in Bangladesh from February 15 to October 31, 2020. The alphabets refer to interventions or events, as described in Table 1.
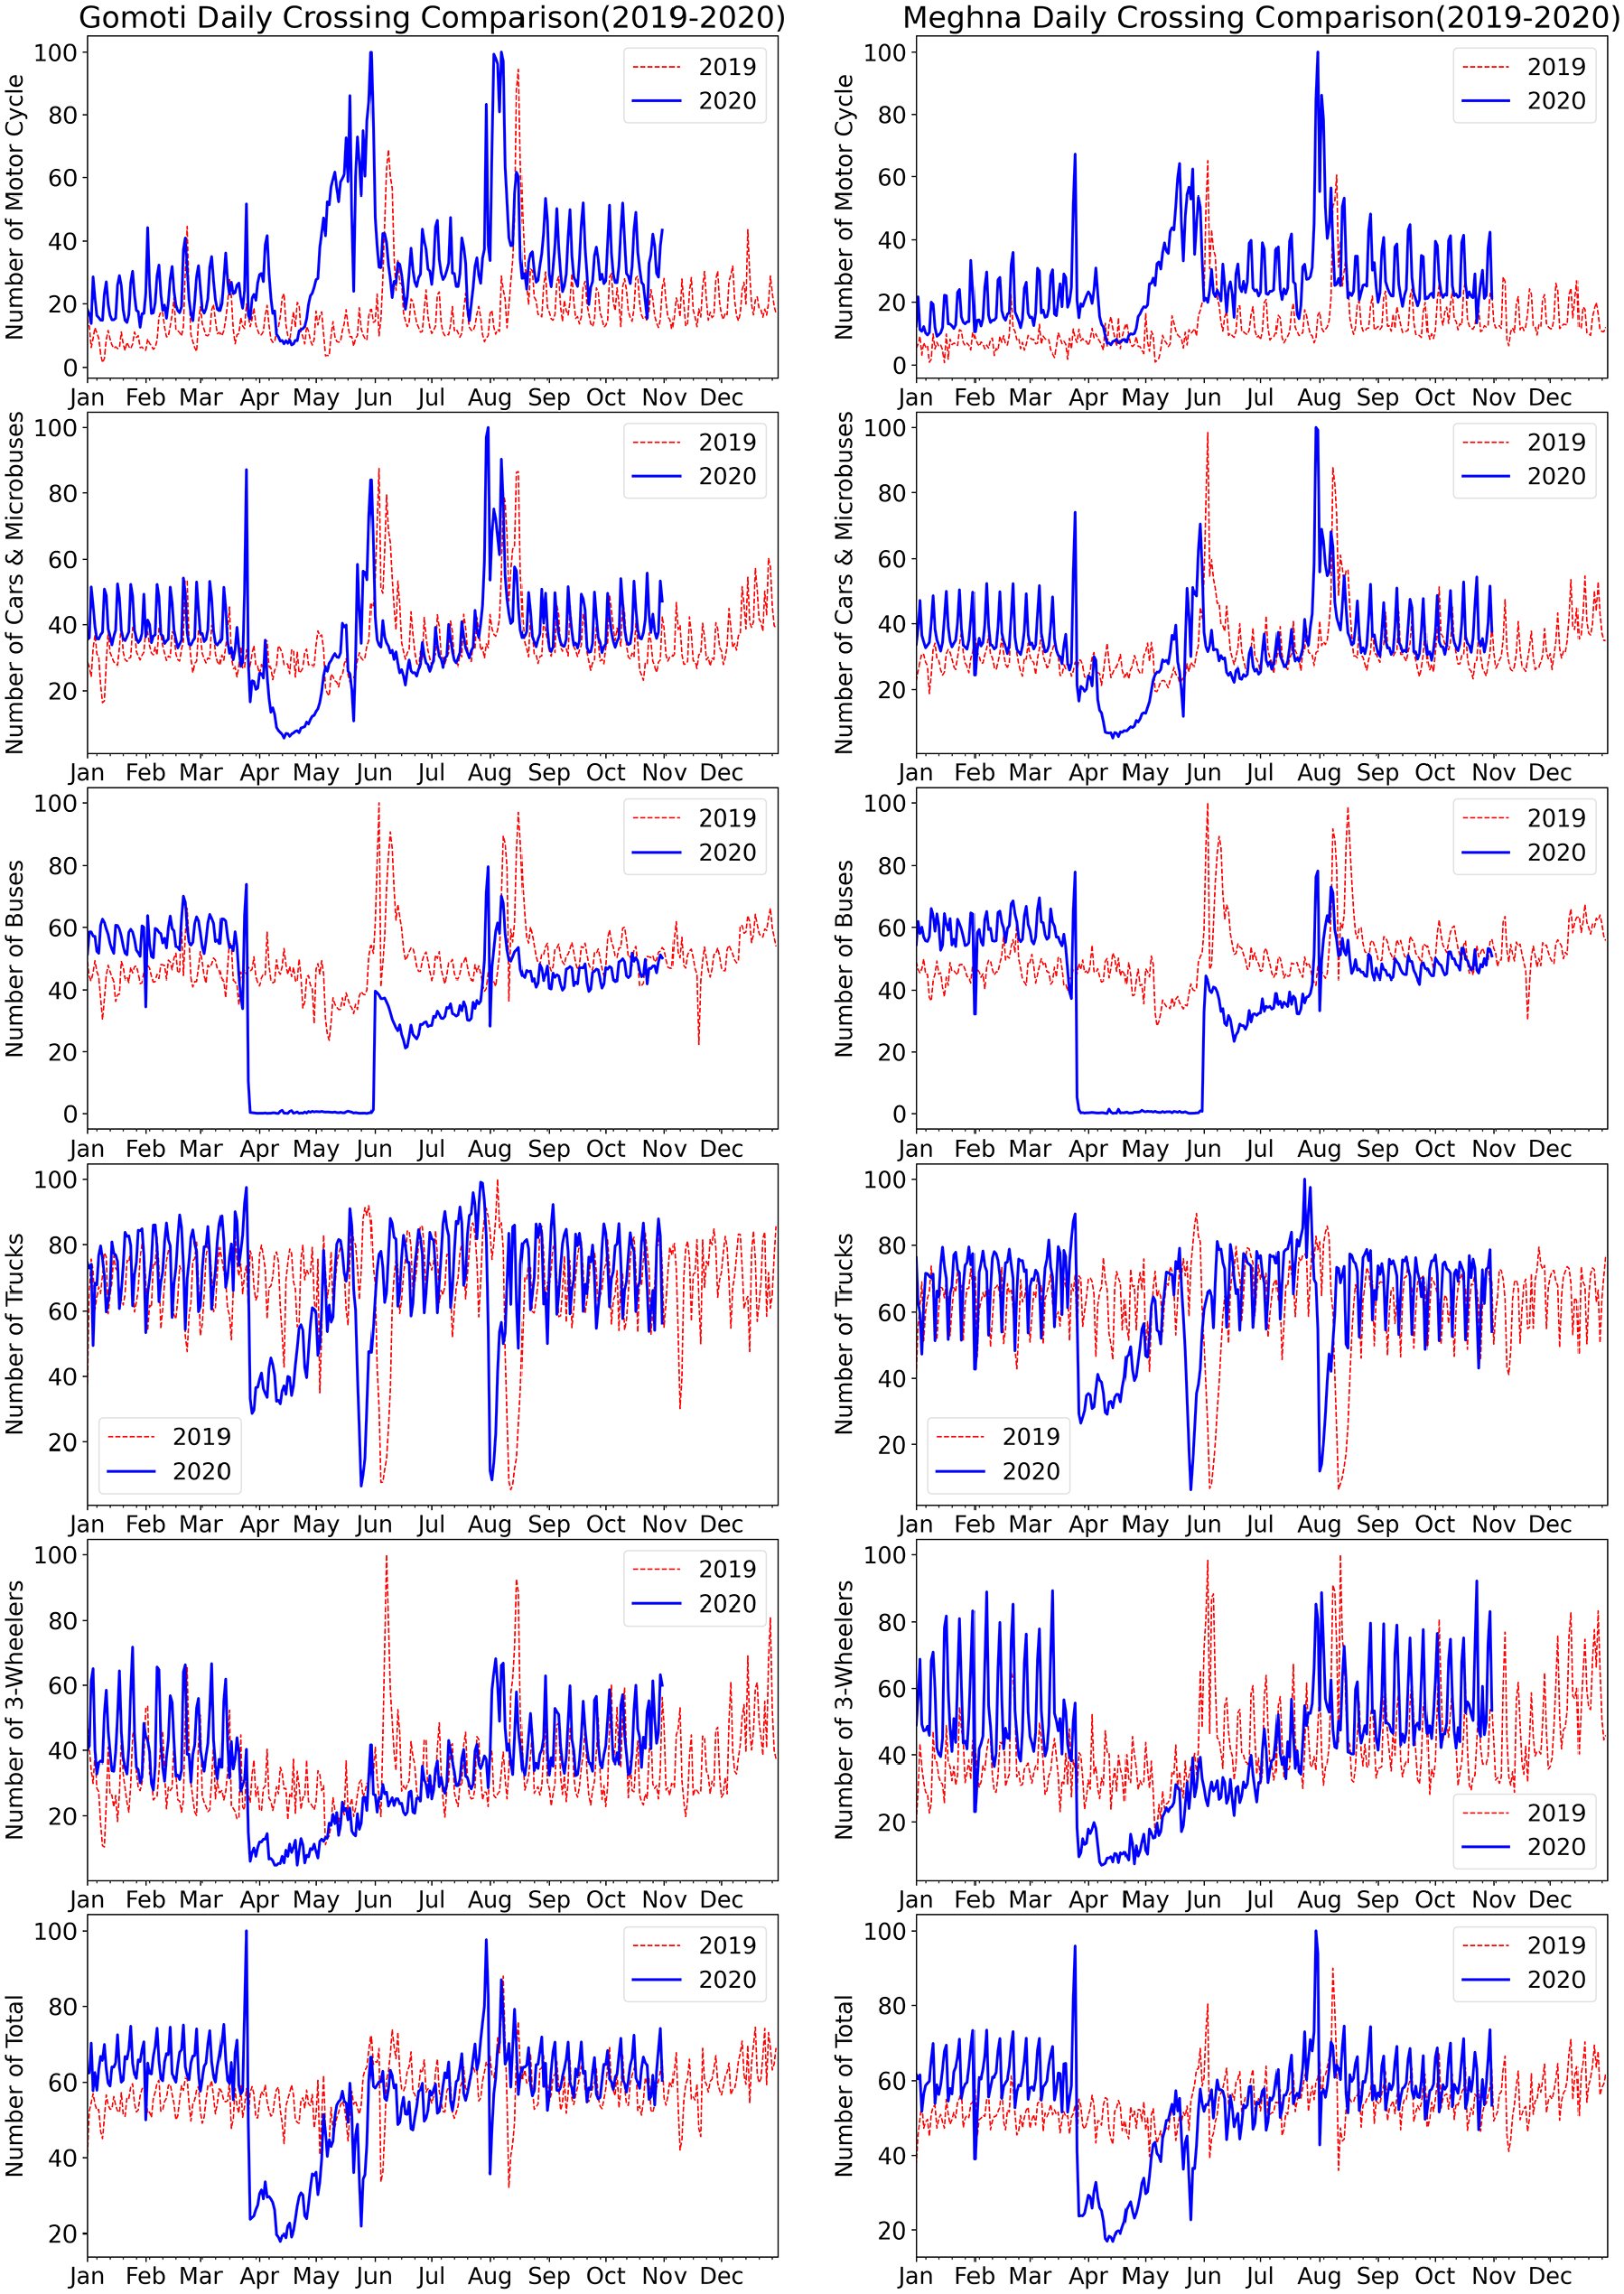
Normalized daily classified vehicle count at the Meghna bridge (southbound traffic) and Gomoti bridge (northbound traffic) toll booths on Dhaka-Chittagong Highway in 2019 and 2020.
Intercity public transportation was completely shut down between March 26 and June 1, 2020, resulting in almost zero bus count. It can be noted that motorcycle flow recovered faster than any other vehicle category, followed by car and microbus. We hypothesize that, during the shutdown of public transportation, many people relied on motorcycles for long-distance inter-regional travel. The trend continued during June to September, 2020 when public transportation could operate only at 50% capacity.
Both motorcycle and car and microbus observed two distinctive peaks during late May and early August, 2020—around the time of two major religious festivals. We can see these two peaks for motorcycle, car, microbus, bus, and 3-wheelers (e.g., ride sharing services such as CNG and scooter) in 2019 as well (shifted by around 10 days). However, the Eid-ul-Fitr peak was missing and the Eid-ul-Adha peak was much more subdued for bus and 3-wheelers in 2020 than in 2019 because of the shutdown measures. A mild peak is noticed, especially in the motorcycle, car, and microbus count in early April, 2020. This was likely because of the indecision about the opening of garment factories on April 5, 2020 (Figure 1).
Variation in Road Traffic Accidents
This section compares the crash, injury, and fatality information obtained from FIR (police) and ARI (BUET) for Bangladesh (Figure 4), and for Dhaka—the capital alone (Figure 5). As can be noted from Figure 4, there were some agreements in the pattern of crashes and fatalities among these two sources across the years 2019 and 2020, although the numbers did not precisely match.
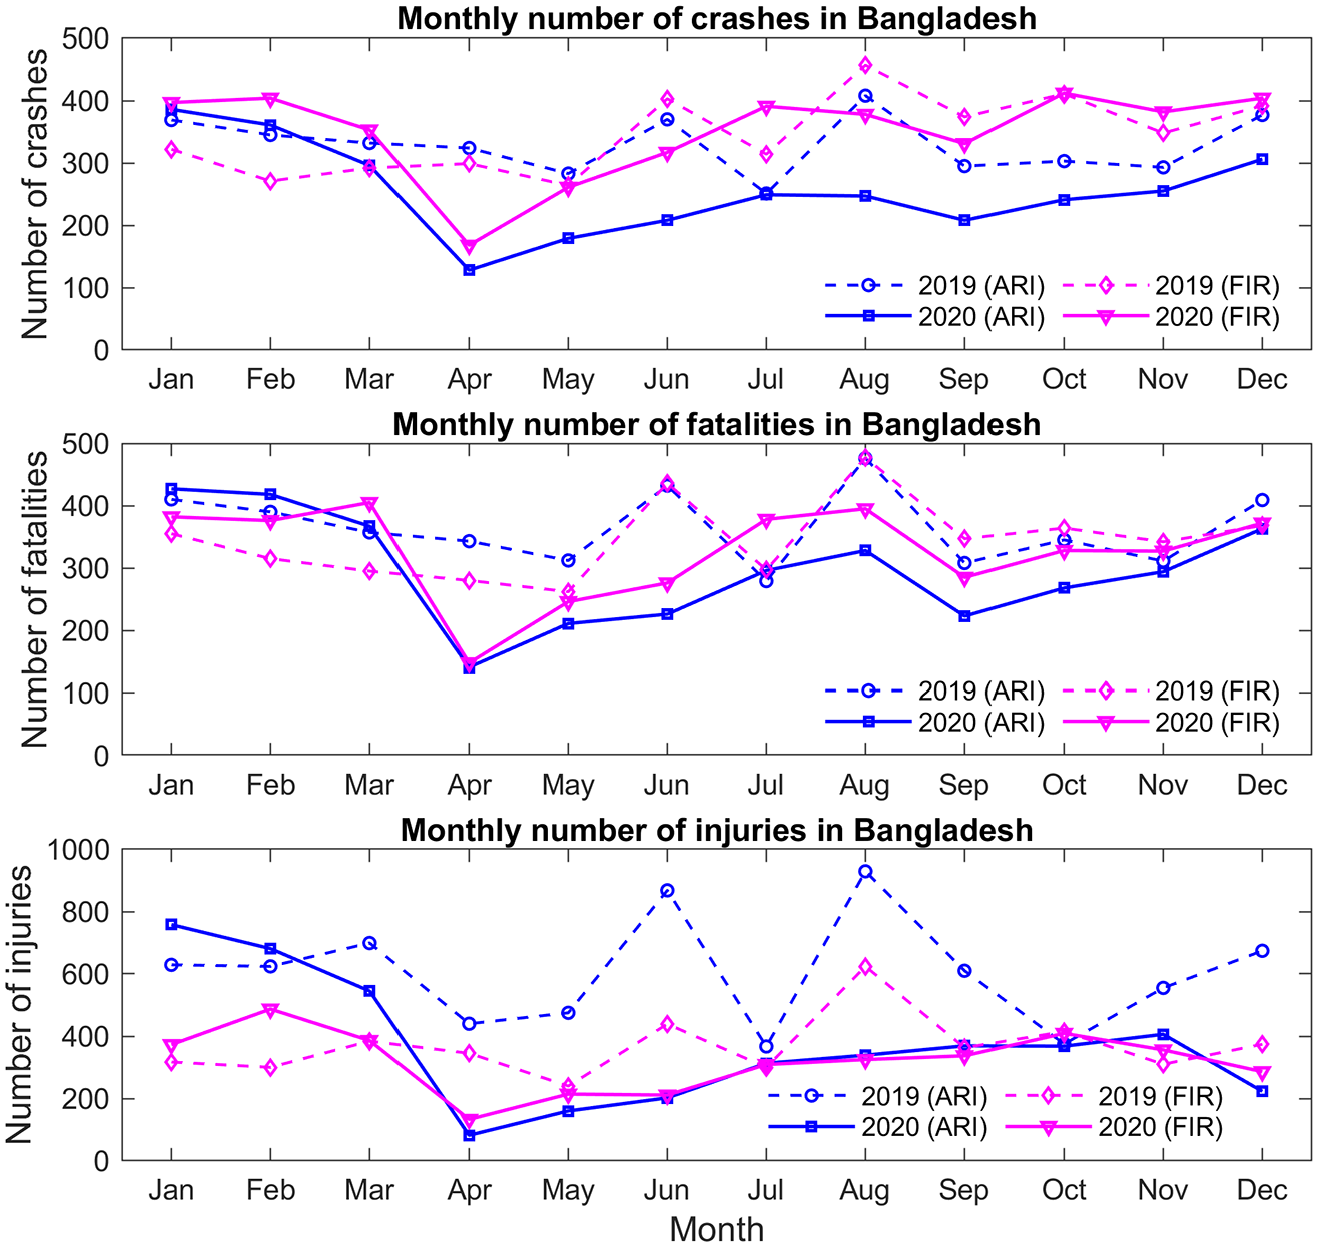
Monthly number of crashes, fatalities, and injuries in Bangladesh from January 2019 to December 2020.
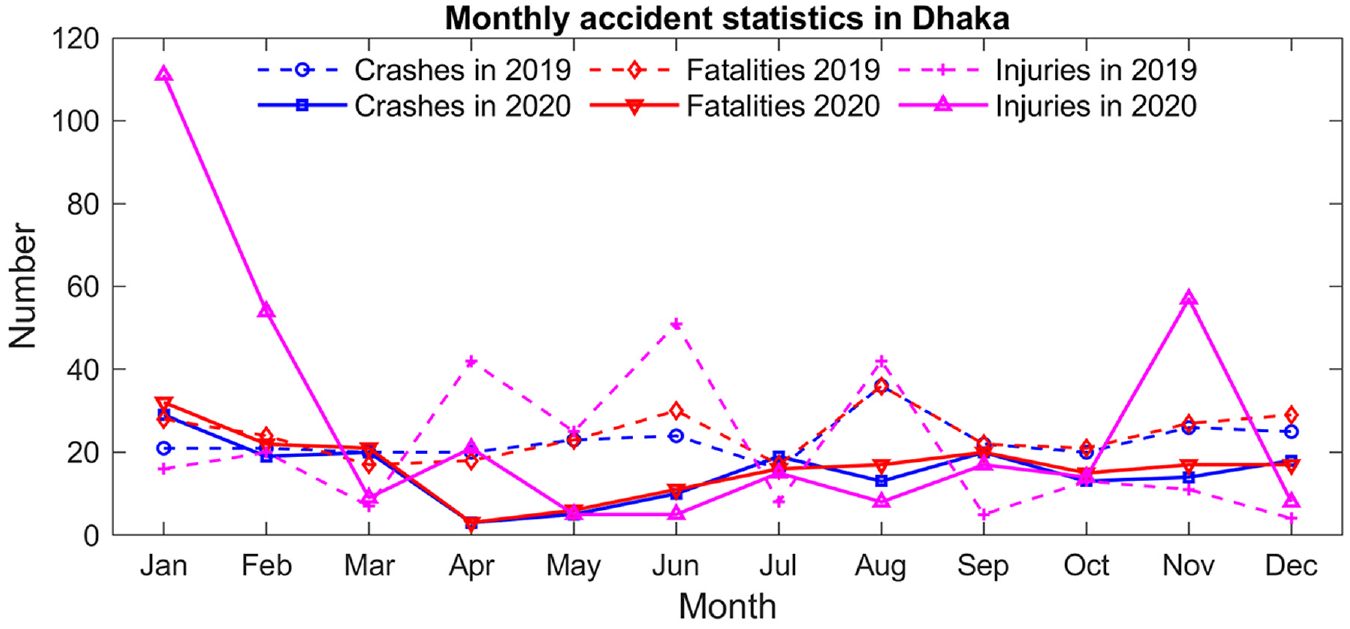
Monthly number of crashes, fatalities, and injuries in Dhaka from January 2019 to December 2020.
The figures show little agreement in the injuries data across the two datasets. As such, injuries data were not used for further analysis. Both the crashes and fatalities data for Dhaka and Bangladesh showed a clear dip in April, 2020 certainly a result of the nationwide closure of offices, garment factories, shopping malls, and public transportation from March 26, 2020. As traffic increased over time because of relaxation of the shutdown and other intervention measures, both crashes and fatalities started to increase.
Modeling Results
Impact of NPIs on Intra-regional Mobility
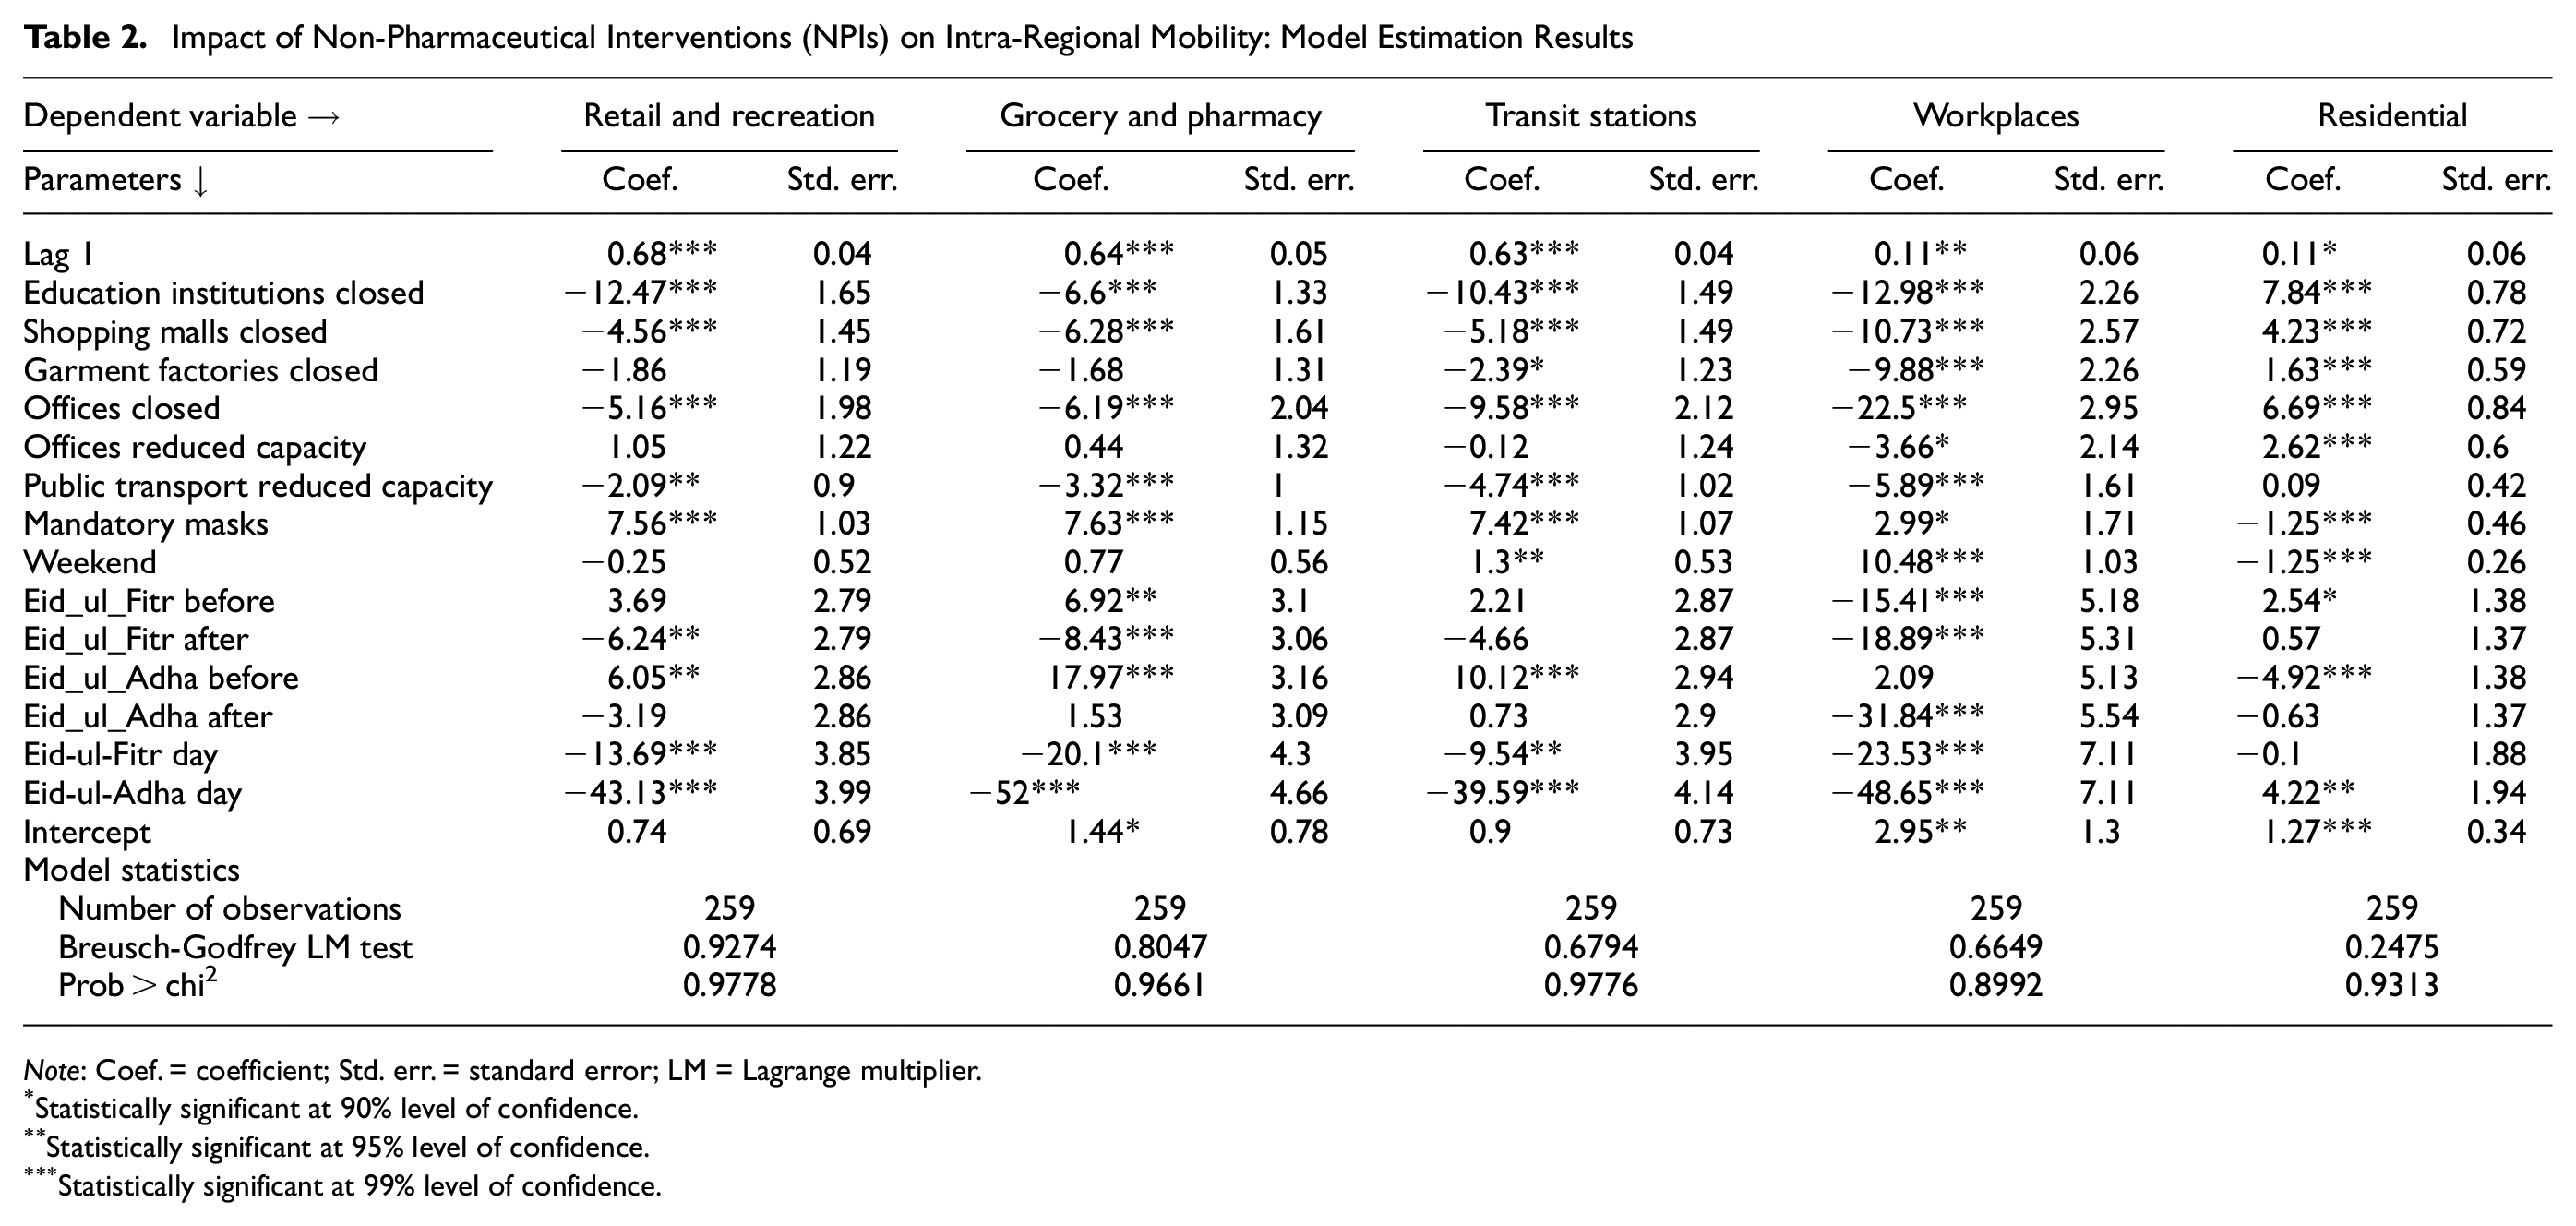
The model estimation results pertaining to five mobility indicators—retail and recreation, grocery and pharmacy, transit stations, work, and residential—are presented in Table 2. Estimates for parks are available in Table SM1 in the supplementary material.
Impact of Non-Pharmaceutical Interventions (NPIs) on Intra-Regional Mobility: Model Estimation Results
Note: Coef. = coefficient; Std. err. = standard error; LM = Lagrange multiplier.
Statistically significant at 90% level of confidence.
Statistically significant at 95% level of confidence.
Statistically significant at 99% level of confidence.
In summary, office and school shutdown were identified as the most effective policies for controlling mobility. Garment factories closure had considerable influence only on transit, work mobility, and stay-at-home duration. Though the impact of public transportation capacity reduction was significant in almost all cases, the same was not true for the office capacity reduction—it only had observable impact on work mobility reduction and on the increase in stay-at-home duration.
It is pertinent to mention that mobility change information was drawn from the Google mobility report that relied on the smart phone users of the country for their data. According to GSMA 2021, the percentage of unique mobile subscribers in the country was 54% in 2020 and, of them, 41% were smart phone users ( 30 ). Therefore, 22% of Bangladesh’s population had access to smart phones in 2020. Though this is a reasonable sample size, there could be some concerns related to the demographic and geographic distribution of the 22% smart phone users in relation to gender, age, and educational qualification, as young, educated, urban men are primary internet users ( 31 ). Therefore, the mobility change information depicted in the current study is mostly relevant for the mobility in and around metropolitan areas such as the capital Dhaka and other large cities.
Impact of NPIs on Inter-regional Mobility
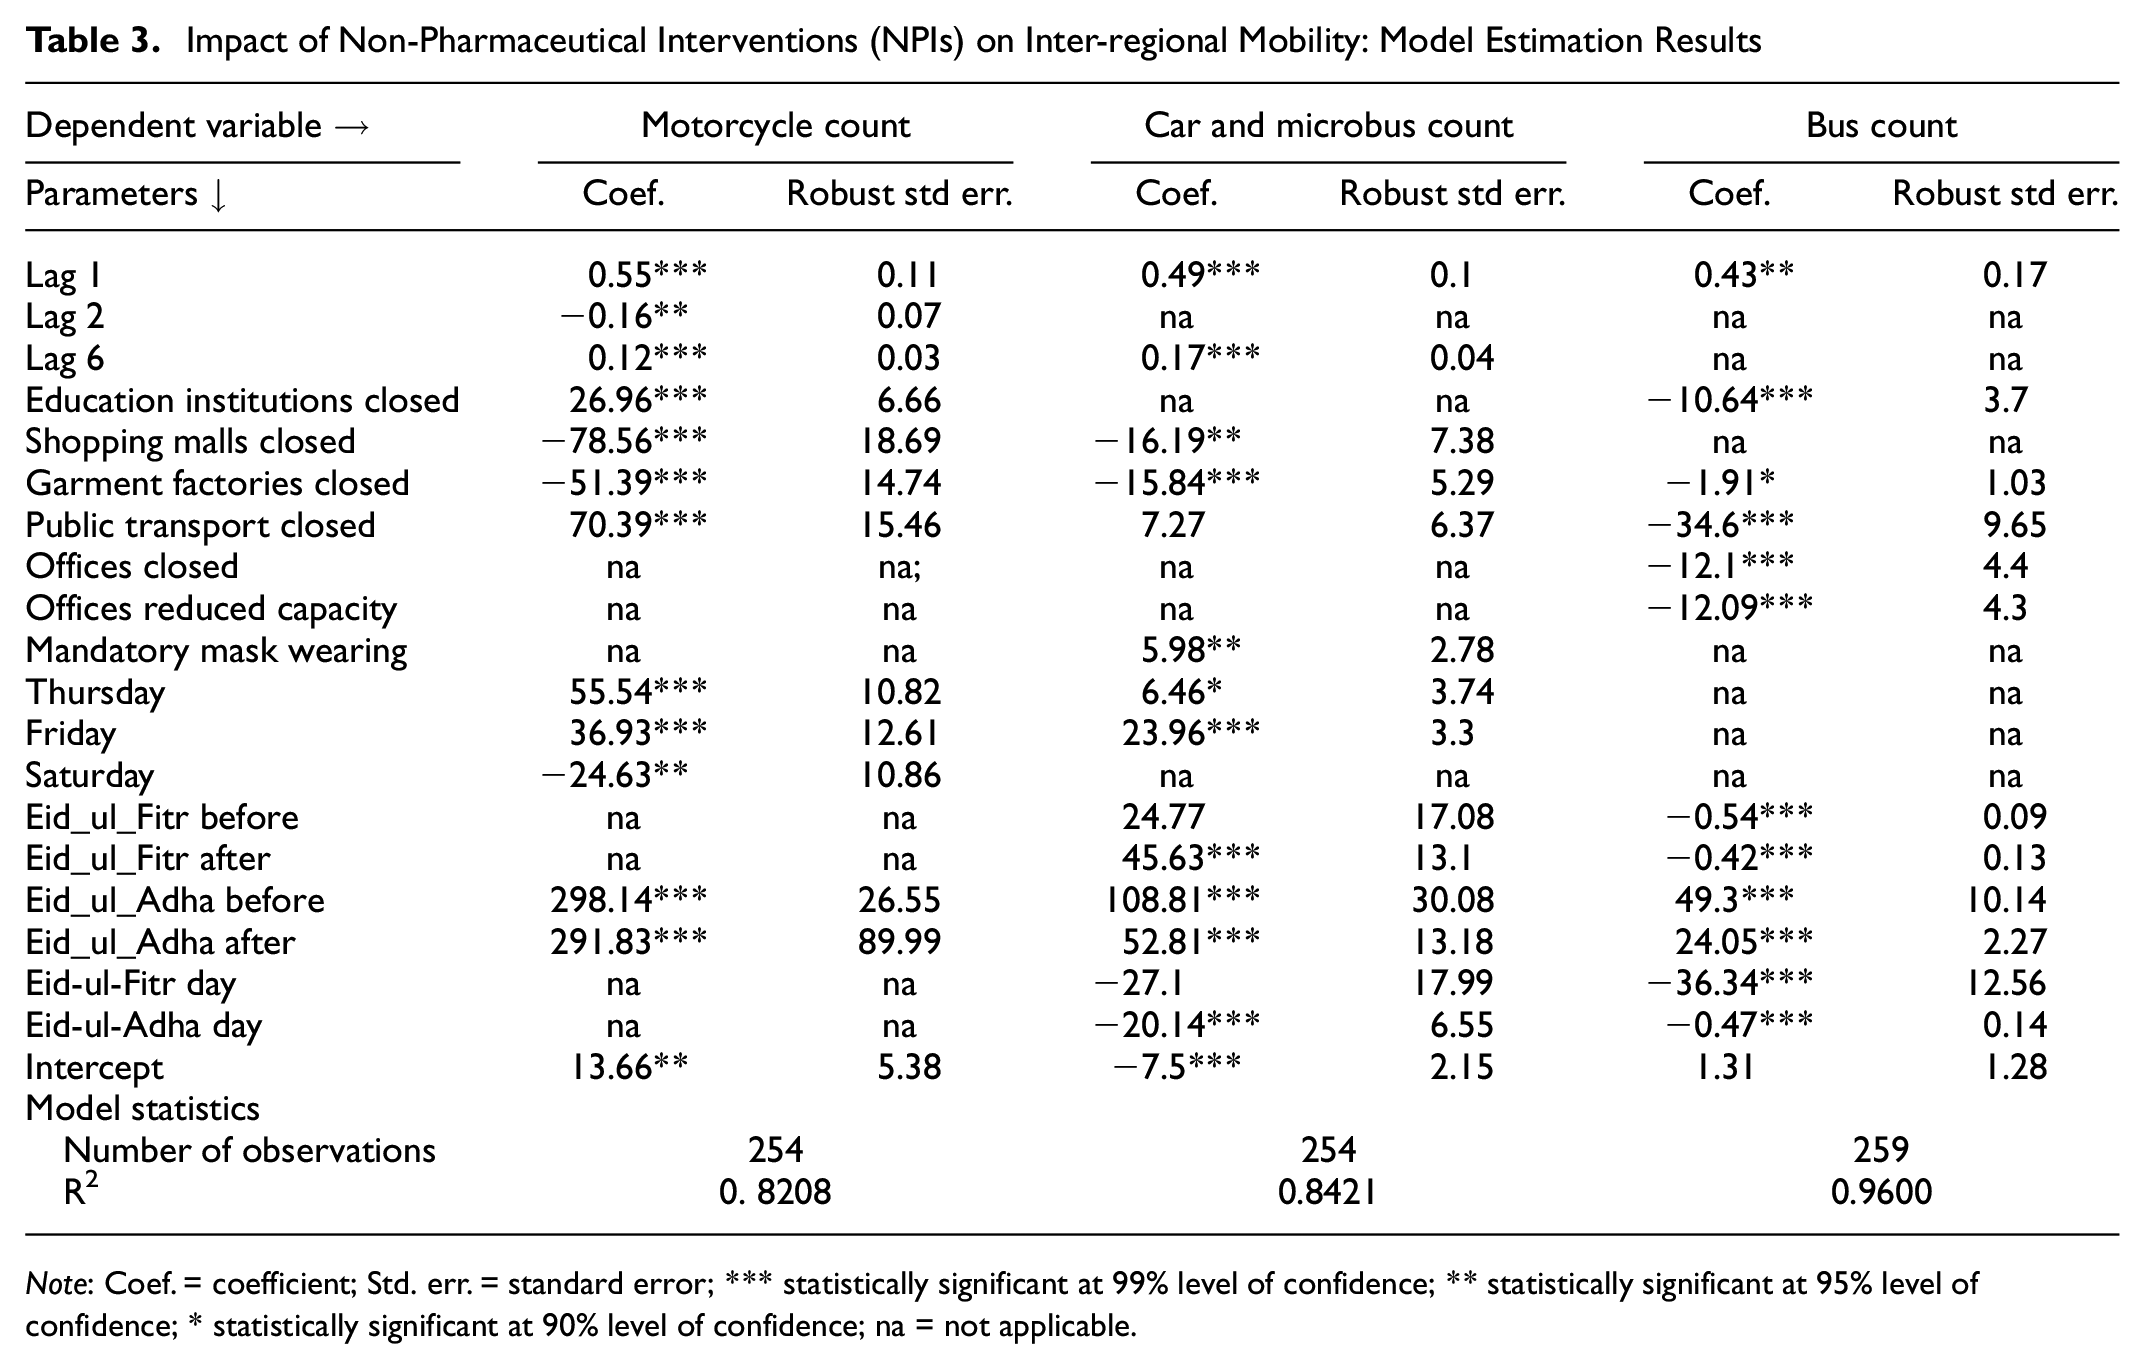
The result of the inter-regional mobility models pertaining to the three vehicle groups—motorcycle, car group (which includes both private cars and microbuses), and bus—are presented in Table 3. Only the result for Meghna bridge, that is, Dhaka to Chottogram (southbound) direction are presented. The results of the Gomoti bridge were very similar and omitted because of space constraints.
Impact of Non-Pharmaceutical Interventions (NPIs) on Inter-regional Mobility: Model Estimation Results
Note: Coef. = coefficient; Std. err. = standard error; *** statistically significant at 99% level of confidence; ** statistically significant at 95% level of confidence; * statistically significant at 90% level of confidence; na = not applicable.
In summary, we observed interesting differences in relation to the effect of the NPIs on inter-regional mobility compared with on intra-regional mobility as presented in the previous section, especially concerning the closure of public transportation. The public transportation closure decreased the bus count while increasing the count of motorcycles, cars, and microbuses. Consequently, this NPI did not have any significant net impact on the overall vehicle count. The overall vehicle count regression results and autocorrelation plots are available in the supplementary material.
Impact of Mobility Reduction on Accidents
The average monthly crashes in Bangladesh during the 5 months perturbed period (April to August 2020) was 303, which is substantially lower than the average during the rest of 2019 to 2020, which was 359.8. Similarly, average monthly fatalities were 288.6 and 348 during the disrupted and normal periods of traffic, respectively. However, despite the seemingly large reductions during the COVID-19 period, the average reductions were not statistically significant (t-stat for accidents mean comparison was 1.319 and for fatalities mean comparison was 1.264 with a p-value >0.1 for both cases), because of the large variability in monthly crashes and fatalities.
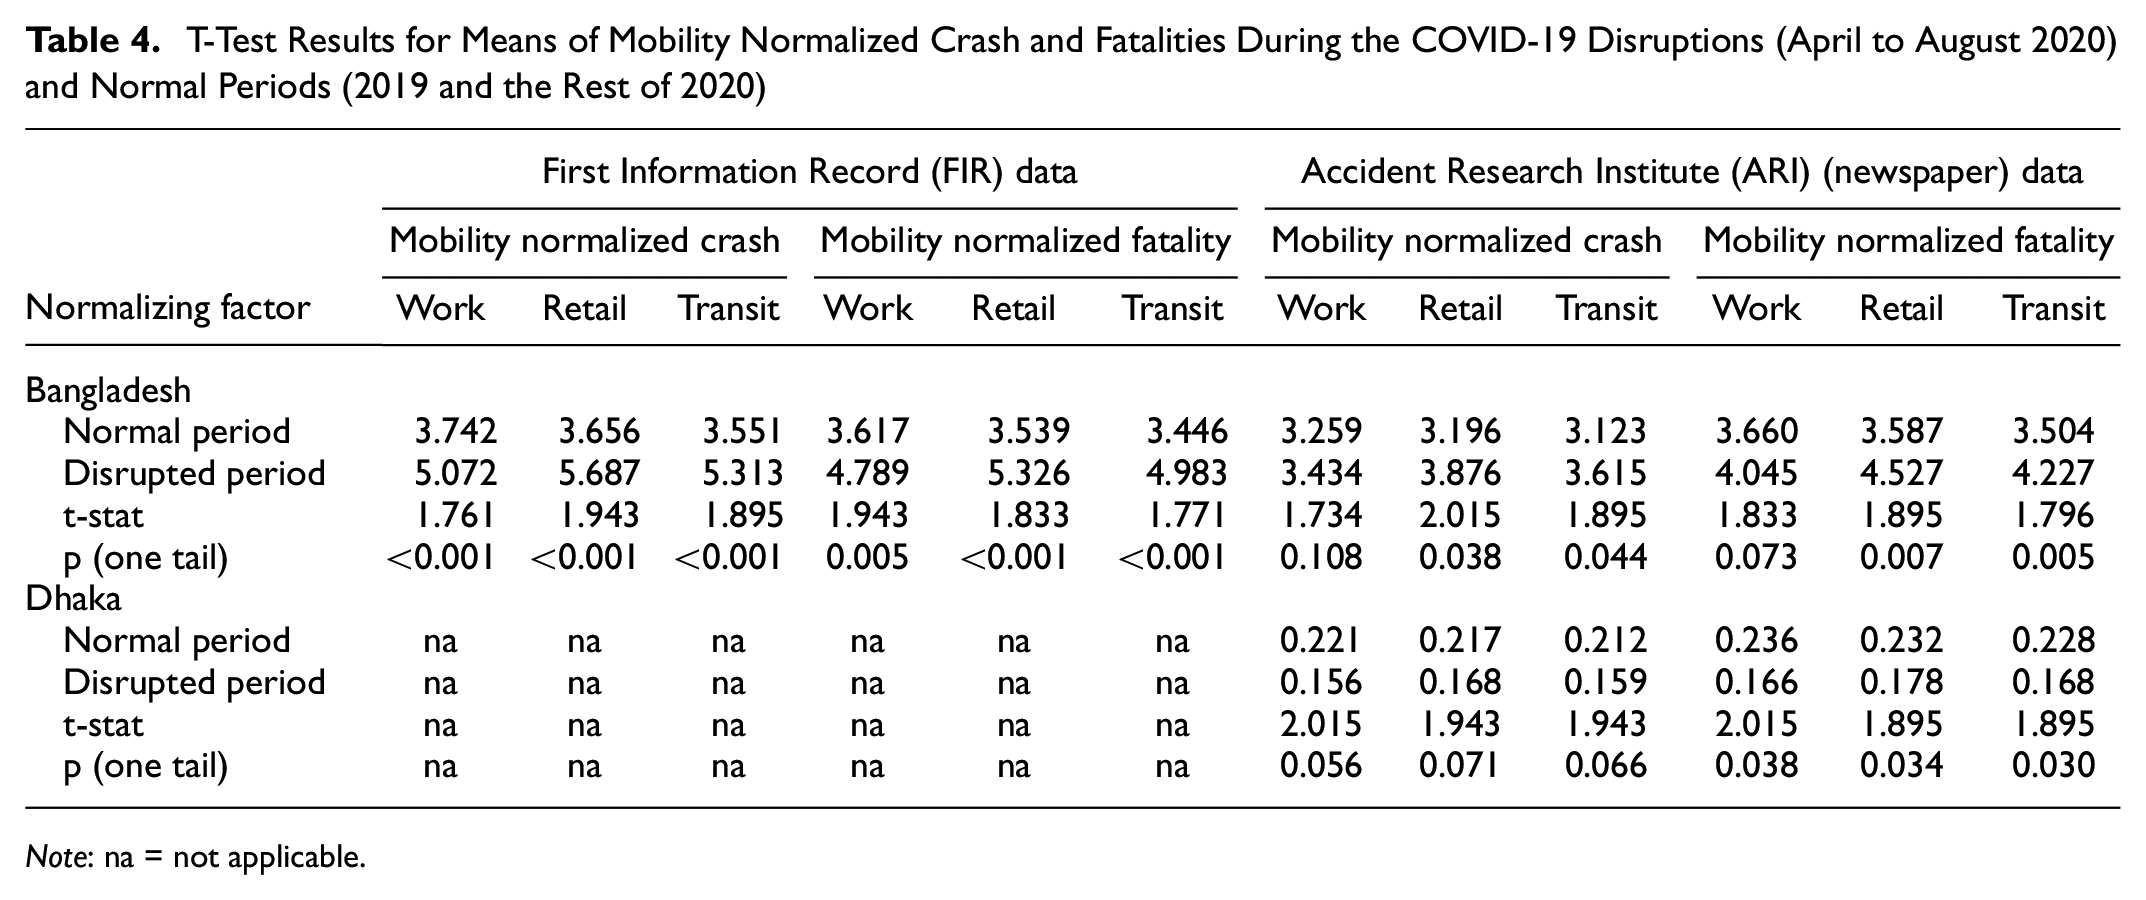
It can be noted that the vehicle speed increased during the disruption period ( 19 ). This raises an interesting question whether normalized crash and fatality—after controlling for the reduction in traffic—changed substantially because of the NPIs. Given that traffic data is not available for Dhaka, we assumed that the reductions were in the same proportion as the rest of the country so that we can use the Google mobility data for normalization. Given the uncertainty that it imparts, we used three metrics for normalization (work, retail, and transit) and test for consistency of the results. Table 4 presents the two-sample t-test with unequal variance for the normalized crash and fatality during and outside COVID-19 disruption periods. These results are for both Bangladesh Police FIR and ARI (BUET). Normalized crash and fatality in Bangladesh have increased during the COVID-19 disruption in a statistically significant way—this finding is consistent for all three normalizing mobility measures, that is, work, retail, and transit, and using both FIR and ARI data. This tends to support the hypothesis that higher speed and possibly COVID-19-related driving stress during COVID-19 have made road travel less safe than before, as seen in the U.S. ( 9 , 35 ).
T-Test Results for Means of Mobility Normalized Crash and Fatalities During the COVID-19 Disruptions (April to August 2020) and Normal Periods (2019 and the Rest of 2020)
Note: na = not applicable.
Interestingly, a reverse pattern is observed in Dhaka using the ARI data—both normalized crash and fatality were statistically lower during the COVID-19 disruption. This finding is consistent for normalized fatalities for all three mobility metrics, and slightly less consistent for normalized crashes. There are several potential explanations for this intriguing finding in Dhaka. Firstly, motorcycle ride-hailing services, which form a larger share of motorcycles in the capital than in the rest of the country and which had increased rapidly in number in Dhaka, were banned for an extended period—affecting their operations in Dhaka substantially more than in the rest of the country (despite some increases because of e-commerce-related delivery services) ( 36 , 37 ). Secondly, the mobility of vulnerable pedestrians (children, women) was likely reduced substantially more in the capital compared with other places. Thirdly, footpaths in Dhaka are often encroached by street vendors, forcing pedestrians to walk on roads, which is very risky. The footpaths were substantially free from any such encroachment during the disruption period, making pedestrian travel safer. Fourthly, given the original hyper-congested situation in Dhaka, increase in speed during the whole of the disrupted period was possibly not enough to increase accident and fatality risks substantially.
Conclusions
The primary objective of the research was to conduct a comparative, quantitative analysis of the effect of various COVID-19-related NPIs on mobility and accident in Bangladesh.
In general, the findings suggested that the containment and closure interventions were successful in reducing mobility at different locations in Bangladesh. Specifically, we noticed that the closure of educational institutions, offices, public transport, and shopping malls were the most influential in controlling mobility around almost all activity locations. However, the closure of garment factories reduced mobility only at work and transit stations. It can be noted that the garment industry is the largest contributor to export earning in Bangladesh ( 38 ). As a result, there was much tension among industry owners and policymakers about the closing of this industry, leading to a chaos on April 5, 2020 (Figure 1, indecision about garments opening). This finding would be useful in reducing arguments among decision-makers and would be beneficial for guiding future policies concerning the operations of this industry.
The effect of partial office closure was 50% less impactful than full closure in case of work mobility reduction. Therefore, it is recommended to shut-down offices completely to restrain the spread of the virus in dire situations. In case offices need to be operated at limited capacities, additional planning and regulation would be necessary to produce beneficial results. Additionally, it would be prudent for policymakers to emphasize the effectiveness of work-from-home culture whenever possible so that the ongoing surges of infections could be better handled with lesser economic fallout than the last waves ( 39 ).
We noticed the closure of public transportation reduced intra-regional mobility in all sectors significantly—however, it did not increase the stay-at-home time (Table 2). On the other hand, the drop in inter-regional travel by public transportation during this period was picked up to a substantial extent by motorcycle, car, and microbus (Table 3). Therefore, stricter regulations are advisable to successfully limit population exposure across regions. This is especially important in case of zone-wise lockdowns where the capital is cut off from the surrounding areas to control the spread ( 40 ). Poor control over these vehicles might adversely affect the effectiveness of zonal lockdown policies.
Mandatory use of masks increased mobility at all places (except in residences where stay-at-home duration dropped as expected). However, media reporting repeatedly pointed to the lax implementation of this health measure ( 41 ). Therefore, it can be conjectured that this policy was effective in creating a sense of security among the population. However, lax implementation possibly adversely affected the containment of the rate of infection ( 42 ). Therefore, proper regulation of such orders is as important as the order itself for the interventions to produce desirable impact in curbing the spread of the virus.
We noticed substantial increase in mobility (except work) around the time of two major festivals—Eid-ul-Fitr and Eid-ul-Adha—especially during the days leading to the festivals. Though the effective duration of the festivals was much smaller compared with the duration of the NPIs such as office, school, and shopping mall closure, the magnitude of the two festivals’ impacts were very much comparable, but undesirable in relation to their impact on social distancing. This observation is very much in line with the impact of religious gatherings observed in the neighboring country, India, where “Kumbha Mela” was identified as a super spreader event by the world media ( 22 ). Therefore, policymakers need to take extra precautions during days leading to festivals to limit public and private gatherings and control the rate of infection.
As expected, the total crash and fatality counts dropped in the country during the time of stricter interventions, that is, between April to August, 2020. However, this change in total number was not found to be statistically significant. This is because of the large variability in the monthly crash data. More importantly, once the effects of the reduction in mobility are considered, normalized crashes and fatalities increased in Bangladesh in a statistically significant manner during the travel disruptions. Increases in speed resulting from reduced traffic on the road is the likely cause of this increase. However, in Dhaka, normalized crashes and fatalities fell, and roads became safer during the disruptions. This was likely driven by a lower number of pedestrians and vulnerable road users in Dhaka during the disruption period and stricter implementation of the policies. This indicates that safer travel options for vulnerable road users play a significant role in improving road safety.
Supplemental Material
sj-docx-1-trr-10.1177_03611981221118532 – Supplemental material for Impacts of COVID-19-Related Non-Pharmaceutical Interventions on Mobility and Accidents in Bangladesh
Supplemental material, sj-docx-1-trr-10.1177_03611981221118532 for Impacts of COVID-19-Related Non-Pharmaceutical Interventions on Mobility and Accidents in Bangladesh by Annesha Enam, Sheikh Mokhlesur Rahman, S. M. Sohel Mahmud and Zia Wadud in Transportation Research Record
Footnotes
Acknowledgements
The authors thank the two anonymous reviewers whose feedback helped improve the final paper.
Author Contributions
The authors confirm contribution to the paper as follows: study conception and design: Z. Wadud, A. Enam, S. Rahman; data collection: S. Rahman, S. Mahmud, Z. Wadud; analysis and interpretation of results: A. Enam, S. Rahman, Z. Wadud; draft manuscript preparation: A. Enam. All authors reviewed the results and approved the final version of the manuscript.
Declaration of Conflicting Interests
The author(s) declared no potential conflicts of interest with respect to the research, authorship, and/or publication of this article.
Funding
The author(s) disclosed receipt of the following financial support for the research, authorship, and/or publication of this article: This research was funded via UK AID through the Foreign, Commonwealth & Development Office (FCDO) under the High-Volume Transport (HVT) Applied Research Programme, managed by IMC Worldwide (Reference No.: HVT029.L1L094).
Supplementary Material
Supplementary material for this article is available online.
The views expressed in this paper are authors’ own and do not necessarily reflect the UK and Bangladesh government’s official policies.
References
Supplementary Material
Please find the following supplemental material available below.
For Open Access articles published under a Creative Commons License, all supplemental material carries the same license as the article it is associated with.
For non-Open Access articles published, all supplemental material carries a non-exclusive license, and permission requests for re-use of supplemental material or any part of supplemental material shall be sent directly to the copyright owner as specified in the copyright notice associated with the article.