
Abstract
Autonomous truck platoon (ATP) deployment on road networks has recently attracted significant interest for its potential economic and environmental benefits. However, the impact of platooning on bridges is a concern because of the differences in their live load characteristics compared with those in the existing bridge design specifications. One of the primary aspects in the safe deployment of ATP is to evaluate the reliability of bridge designed using the existing provisions for live loads from potential configurations of ATP. An analysis procedure is proposed and demonstrated for a simple span steel composite bridge designed according to the existing design provisions. Given that many characteristics of the live load distribution such as the bias factor, coefficient of variation (CoV), and the dynamic amplification factor are presently not known for ATP, a parametric approach is used. The bias factor, dynamic amplification, and CoV are parametrized to calculate the live load distribution and quantify its impact on the reliability index. A two-truck platoon with different headway spacings constituted by different trucks in a single lane scenario is considered. The results indicate that the two single lane bridges designed according to existing design specifications are generally reliable (i.e., achieved the target reliability for which the bridge was initially designed) for the range of ATP live loads investigated when the CoV is less than 0.07, bias close to one and headway distances are above 17 ft. Future studies are suggested to include bridges with multiple spans, other bridge types, and a larger number of trucks in the platoons. The main contribution of this paper is to quantify the reliability indices of selected steel composite bridges designed using the existing specifications but subjected to various configurations of ATP loads and the influence of different components of the live load model attributed to the latter.
The novel driving technology of cooperative adaptive cruise control enables trucks to drive very close together in the form of platoons. The trucks participating in a platoon communicate wirelessly and the actions of the leading truck are continuously transmitted to the following truck(s) in the platoon ( 1 ). There is consensus on the implementation of this technology from the trucking industry and other stakeholders considering the potential savings in fuel and reduction of greenhouse gas emissions. Computational fluid dynamic studies show that driving at close intervals significantly reduces drag forces on trucks behind the leading truck ( 2 ) and reduces fuel consumption for the leading and trailing trucks ( 3 ). Depending on the platoon parameters, the fuel consumption economy can vary between 7% to 28% for a two-truck platoon ( 3 ). The trucking industry accounted for 71.5% of freight transportation in the United States in 2017, which implies that significant economic and environmental benefits can be harnessed by the introduction of platooning ( 4 ). Furthermore, given the close spacing between the trucks, platooning reduces the frequency of traffic congestion ( 5 ) and increases traffic throughput ( 6 ). Concerns about platooning have been raised, however, because of negative impacts on traffic safety from visual obstruction of signage ( 7 ), influence on lateral traffic safety ( 8 ), and increased pavement distress ( 9 ).
To fully realize benefits from the autonomous truck platoon (ATP), sophisticated fleet planning and platoon operation have to be formulated and implemented by the trucking industry ( 1 ). Besides operational issues, the adequacy of the existing infrastructure, and in particular bridges, to accommodate the loads from ATP has to be investigated.
Relevant Literature
The effects of ATPs on the safety, serviceability, and the remaining service life of bridges need to be investigated before their potential deployment. Sayed et al. ( 10 ) proposed models and procedures for the assessment of the impact of truck platooning on existing beam bridges and stressed the need for policies, regulations, and standards for truck platooning on existing and new bridges. Yarnold and Weidner ( 11 ) performed a parametric study on the distribution of shear force and bending moment from truck platoon consisting of C5 standardized trucks of Florida Department of Transportation (FDOT). A line girder analysis for simply supported and continuous beam systems were performed. Bending moments and shear forces were obtained as a function of span length and headway distance between trucks in the platoon and compared with American Association of State Highway and Transportation Officials (AASHTO) Load and Resistance Factor Design (LFRD) live loads. Concerns were raised for loads on long span bridges with closely spaced truck platoons. Tohme and Yarnold ( 12 ) performed analytical and parametric load rating studies for steel bridges subjected to truck platoons. They used a benchmark bridge from the Manual of Bridge Evaluation ( 13 ) and performed parametric studies to evaluate the ratio of load ratings from platoons to design load ratings and legal load ratings. The authors reported that allowable stress ratings (ASRs) may be reduced in the positive bending moment region for all the combinations of platoon headways (19.7–39.4 ft) and span lengths (105–223.1 ft) considered in the study. Likewise, the ratings may be reduced in the negative moment regions for most span lengths ( 12 ). Similarly, the load factor ratings (LFRs) were adequate for truck platoons in the positive moment region and less so in the negative moment regions for all span lengths. Couto Braguim et al. ( 14 ) studied the possibility of reducing fatigue damage in steel girder bridges by allowing truck platooning. They performed line girder analyses for sets of truck platoons on simple and continuous span bridges. The stress range and number of cycles were recorded using rainflow counting, and Miner’s rule was used to quantify the fatigue damage. The fatigue damage for different platoon configurations is normalized relative to the AASHTO LRFD fatigue loads for comparison. Although load effects were increased by platooning, the number of stress cycles was reduced because of synchronized movement of trucks, which in some cases contributed to decreased fatigue damage. Thulaseedharan and Yarnold ( 15 ) performed a study for the prioritization of prestressed concrete bridges in Texas for the deployment of platooning. Truck platoon load ratings were used as well as National Bridge Inventory structural evaluation condition ratings to prioritize each bridge for detailed evaluations before authorization for truck platoons. Tohme and Yarnold ( 12 ), in a study for span lengths ranging from 20 ft to 300 ft reported that span length close to 300 ft may be of concern for spacings between trucks in the range from 20 to 40 ft. Wassef ( 16 ) reported on the potential candidate trucks for platooning in a comprehensive study, which included most of the trucks used by Yang et al. ( 17 ) in their study. However, the FDOT C5 trucks were not included by Wassef ( 16 ) as a potential candidate truck, although they were reported in earlier studies on platooning ( 11 , 12 ). Yang et al. performed a parametric study on the influence of variability (the coefficient of variation) of platoon loads, the headway spacing, the span length, and the load amplification factor on the safety of selected bridges (simple and two span continuous each with six different span lengths ranging from 30 ft to 200 ft) designed using the AASHTO LRFD bridge design specifications ( 17 ). However, the influence of bias factor, and the dynamic amplification factor for live loads was not considered in that study. Furthermore, the bridges studied were limited to those designed using the AASHTO LRFD provisions.
In this study, the safe deployment of ATP on bridges is evaluated relative to both the AASHTO LRFD and Load Factor Design (LFD) bridge design guidelines ( 18 ). Reliability indices of the bridges designed according to both guidelines are evaluated for different scenarios of ATP live loads by parameterizing the factors (bias, coefficient of variation, and dynamic amplification) not taken into account by previous studies ( 19 ).
Methodology and Assumptions
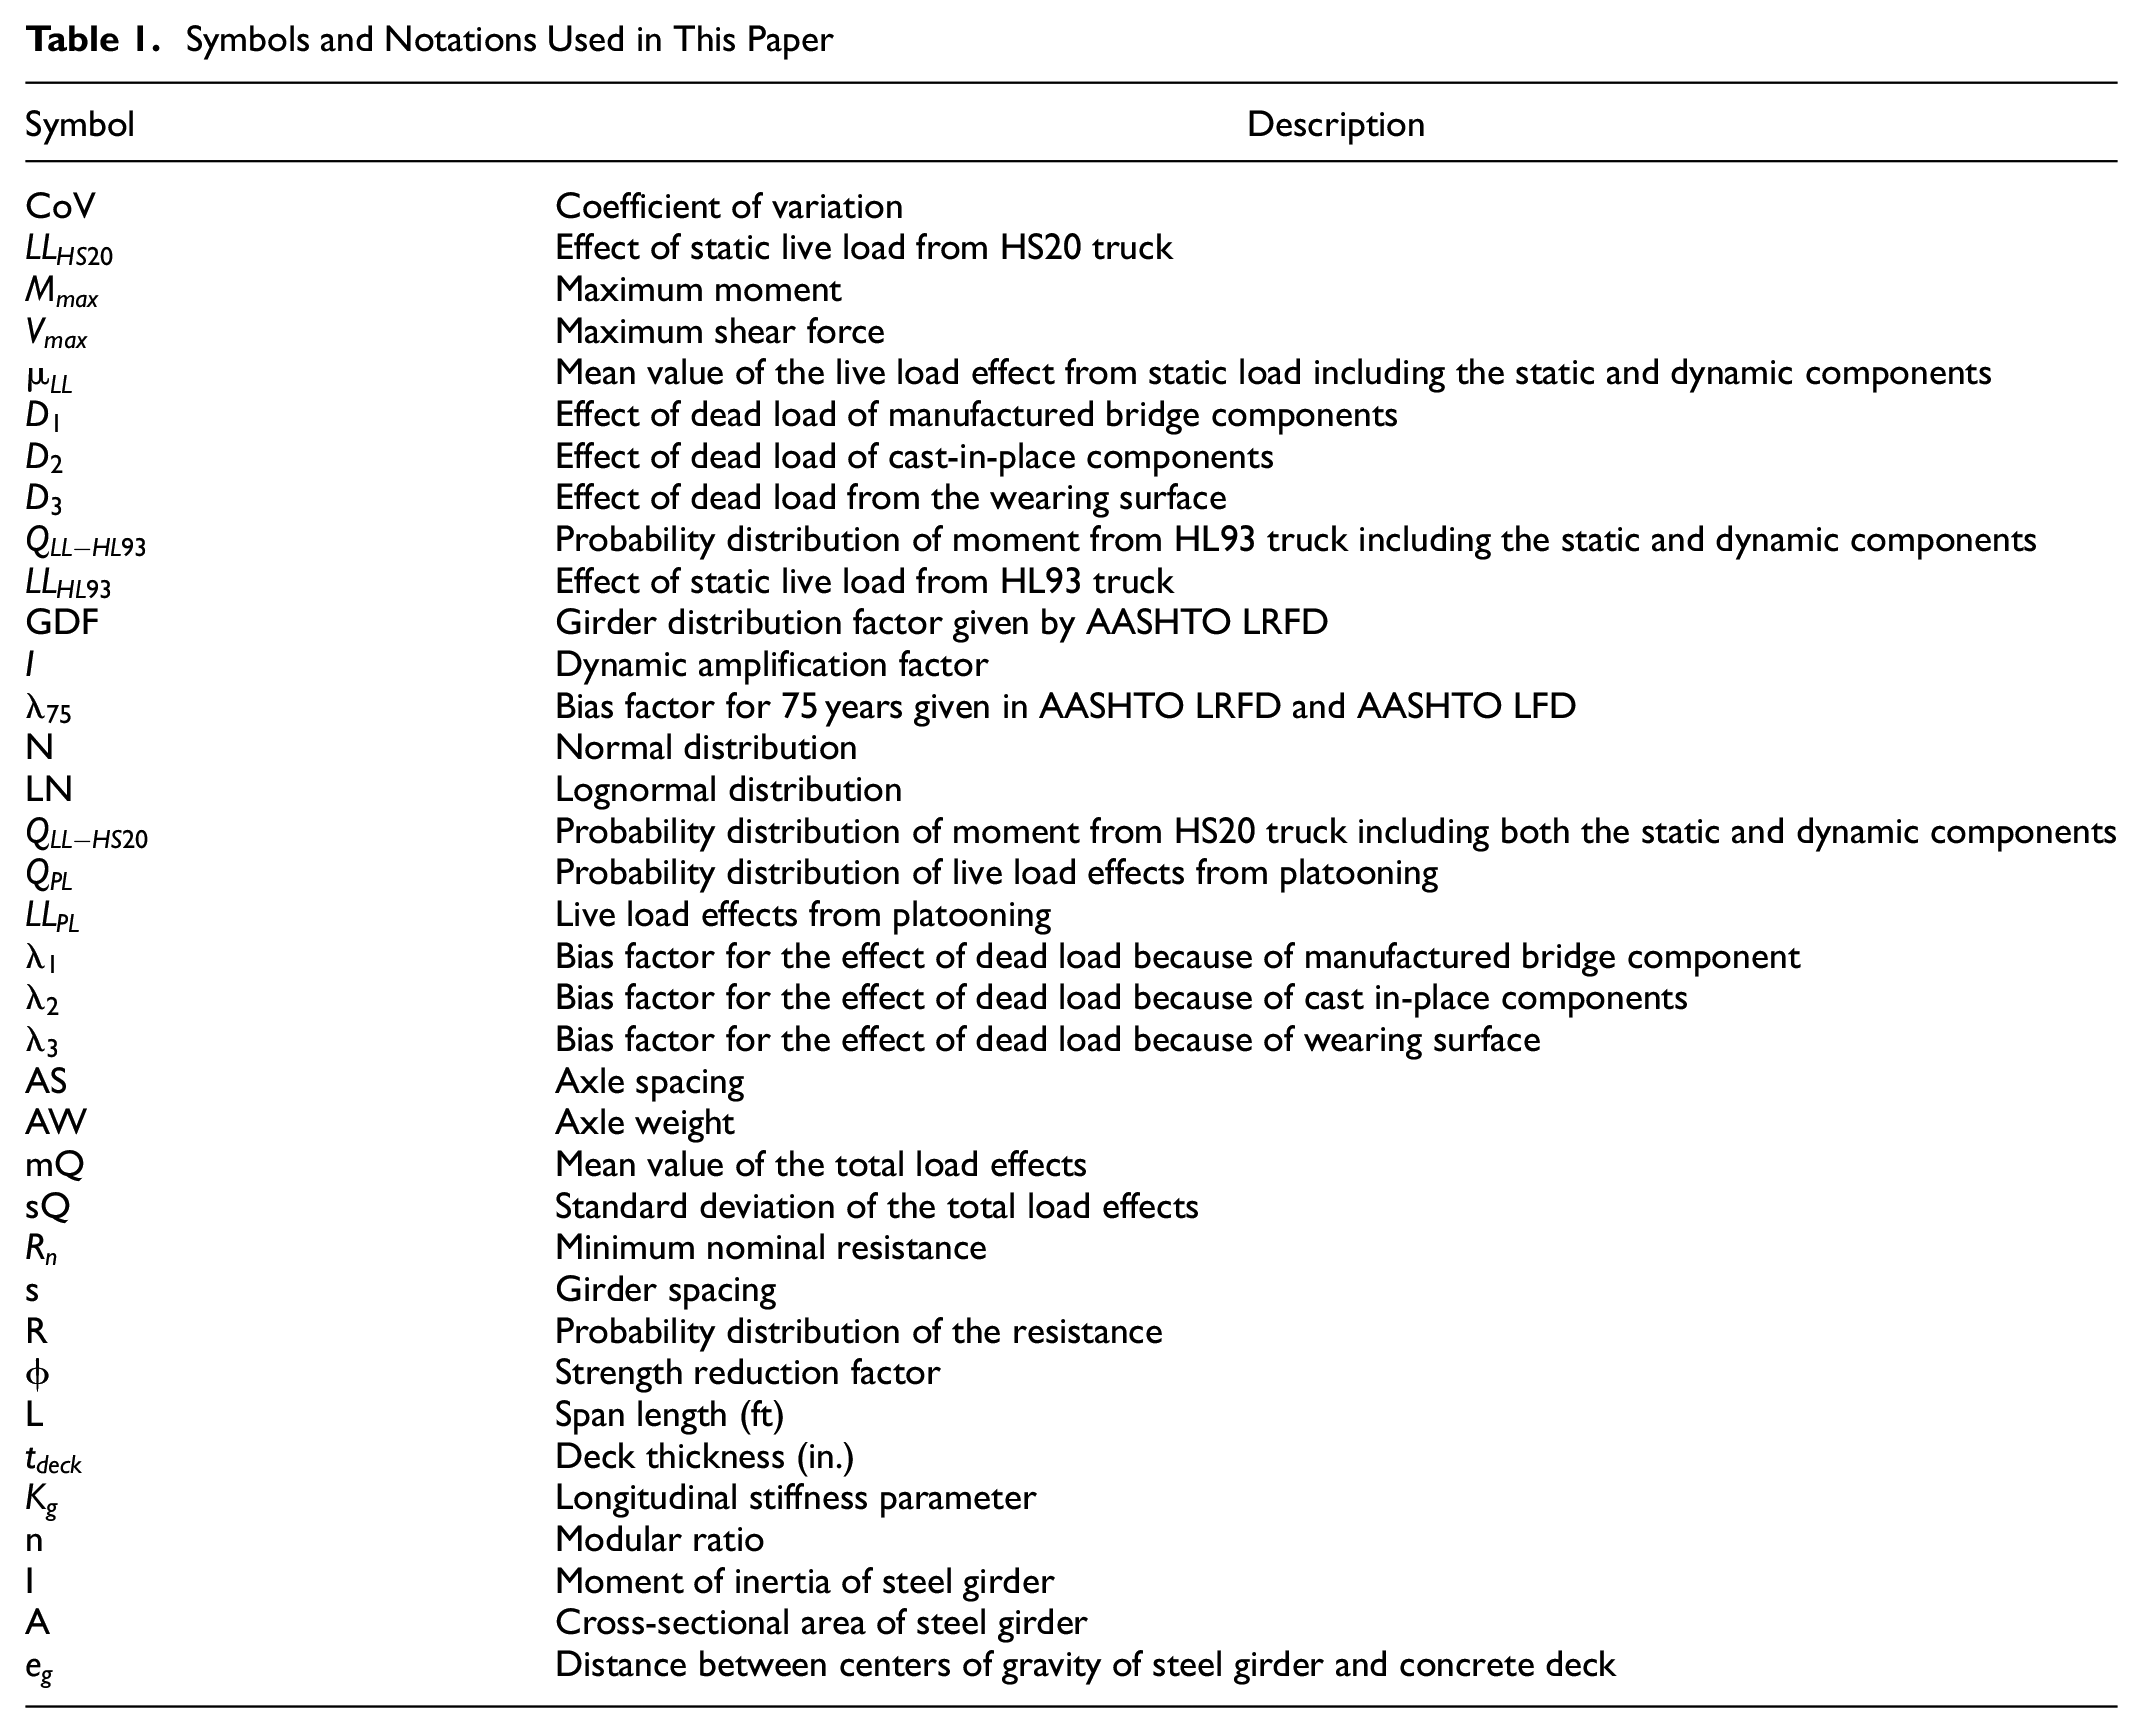
Given the limited state of knowledge on platooning, a parametric approach is used to account for the uncertainty on platooning parameters. Two representative bridges are selected from the literature, which are respectively designed using AASHTO LFD (NCHRP 368) ( 20 ) and AASHTO LRFD ( 19 ). Both bridges are designed on the basis of the minimum nominal resistance criteria. Dead load effects are calculated using the design parameters from the respective references for the selected bridges and live load effects are obtained for each ATP scenario considered. The nominal resistance for the selected bridges is based on the design without platooning. Finally, the probability of failure and reliability indices are estimated for different combinations of geometrical or load parameters for platoons by Monte Carlo simulation. The reliability indices obtained for the ATP are compared with the target reliability indices of the AASHTO LFD and AASHTO LRFD of the original design. The procedures to simulate live load effects from ATP and to perform the reliability analysis are provided in Figures 1 and 2 respectively. The notations used in this paper are listed in Table 1 along with their description. The study is limited to simple span steel girder composite bridges and a platoon of two constituent trucks but will be extended to other types of bridges and longer platoons in future studies.
Symbols and Notations Used in This Paper
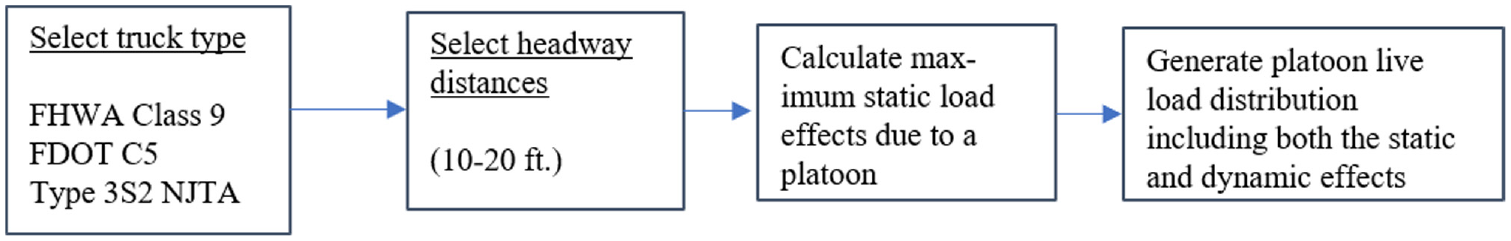
Flow chart to derive live load distributions for autonomous truck platoons (ATPs).
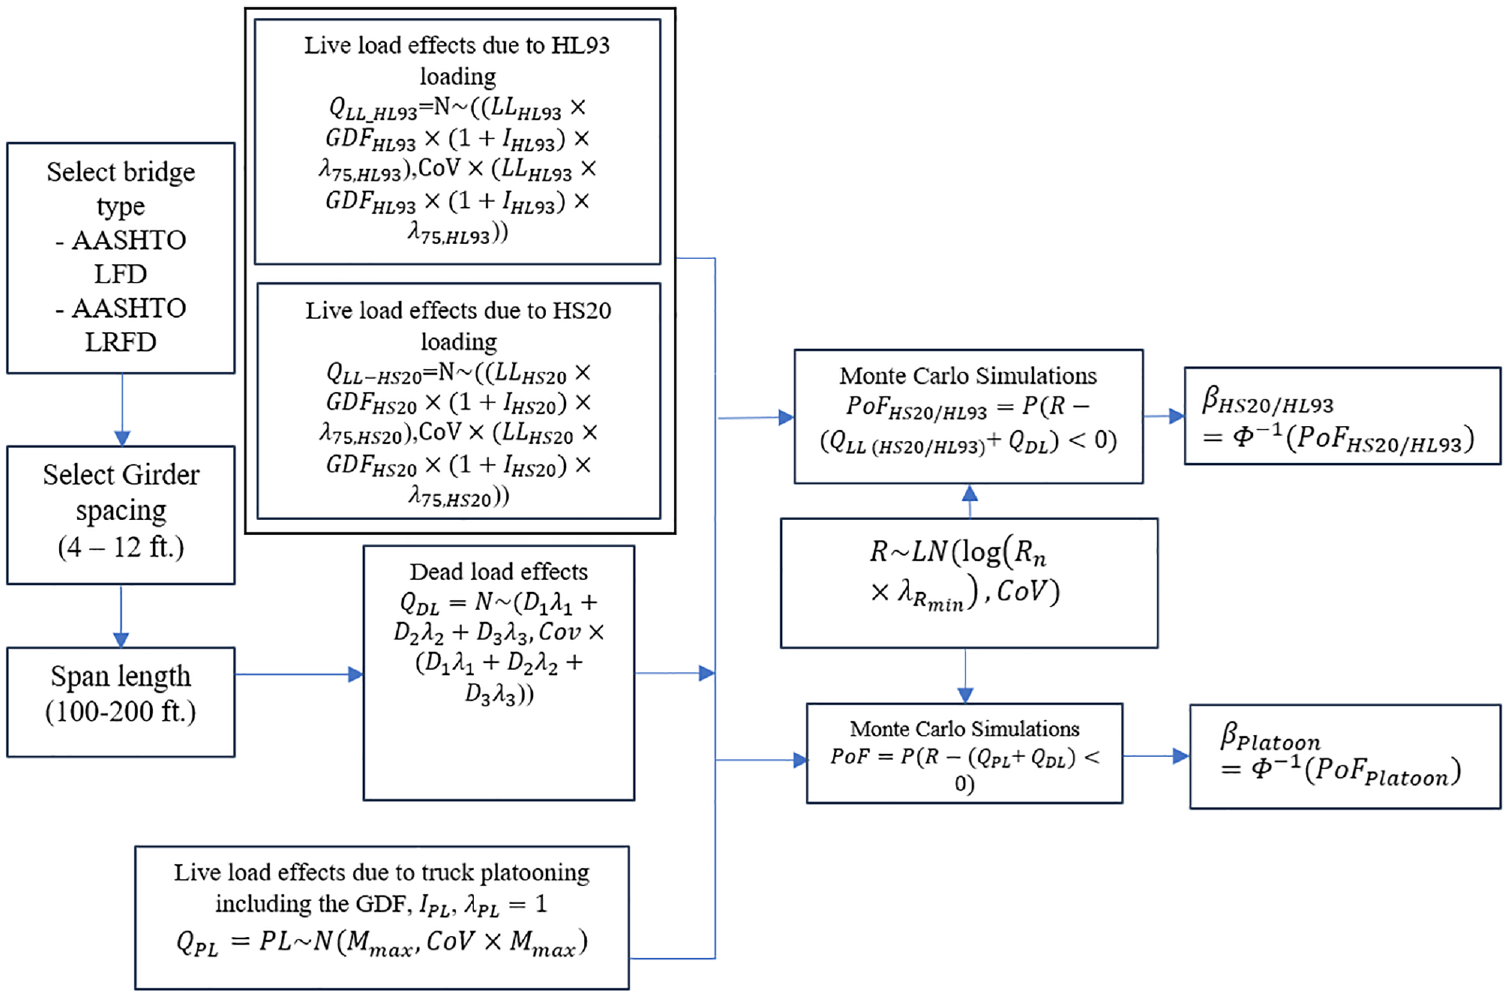
Flow chart to estimate the reliability indices.
The steps outlined in the flowchart in Figures 1 and 2 are briefly described. First, a constituent truck is selected out of the three types considered in the study. Next, a headway distance (or truck spacing) is set, defined as the distance between the rear axle of the leading truck and the front axle of the trailing truck. Next, the maximum static live load effects, the maximum positive moments
Figure 2 describes the procedure for performing the reliability analysis. The process starts by selecting a bridge designed according to either AASHTO LFD or AASHTO LRFD provisions with the given girder spacing and span length. This provides the dead load components (
Candidate Trucks
Given that ATPs are yet to be deployed, assumptions are made on load parameters of constituent trucks such as the number of trucks, headway spacing, and the characteristics of trucks. Previous studies have used weigh-in-motion (WIM) data to define weight distributions for trucks in platoons. The U.S. Federal Highway Administration (FHWA) reports that the FHWA class 9 truck is the most common in the WIM data sets and has been considered as a potential candidate for ATP in previous studies ( 21 ).
Previous studies for ATPs on steel bridges are based on deterministic analyses with the FDOT C5 truck ( 11 , 12 , 14 ). In the present study, FHWA class 9, FDOT C5, and New Jersey Turnpike Authority (NJTA) Type 352 ( 22 ) trucks are used to constitute the ATPs. These trucks are also identified as potential candidates for platooning with the exception of the FDOT C5 in a recent study ( 16 ). Each of these trucks satisfy the Federal Bridge Formula (FBF) B requirement of gross vehicle weight of 80 kips. The configuration of the selected trucks is shown in Figure 3 with the values of each parameter listed in Table 2.
Selected Candidate Truck Parameters
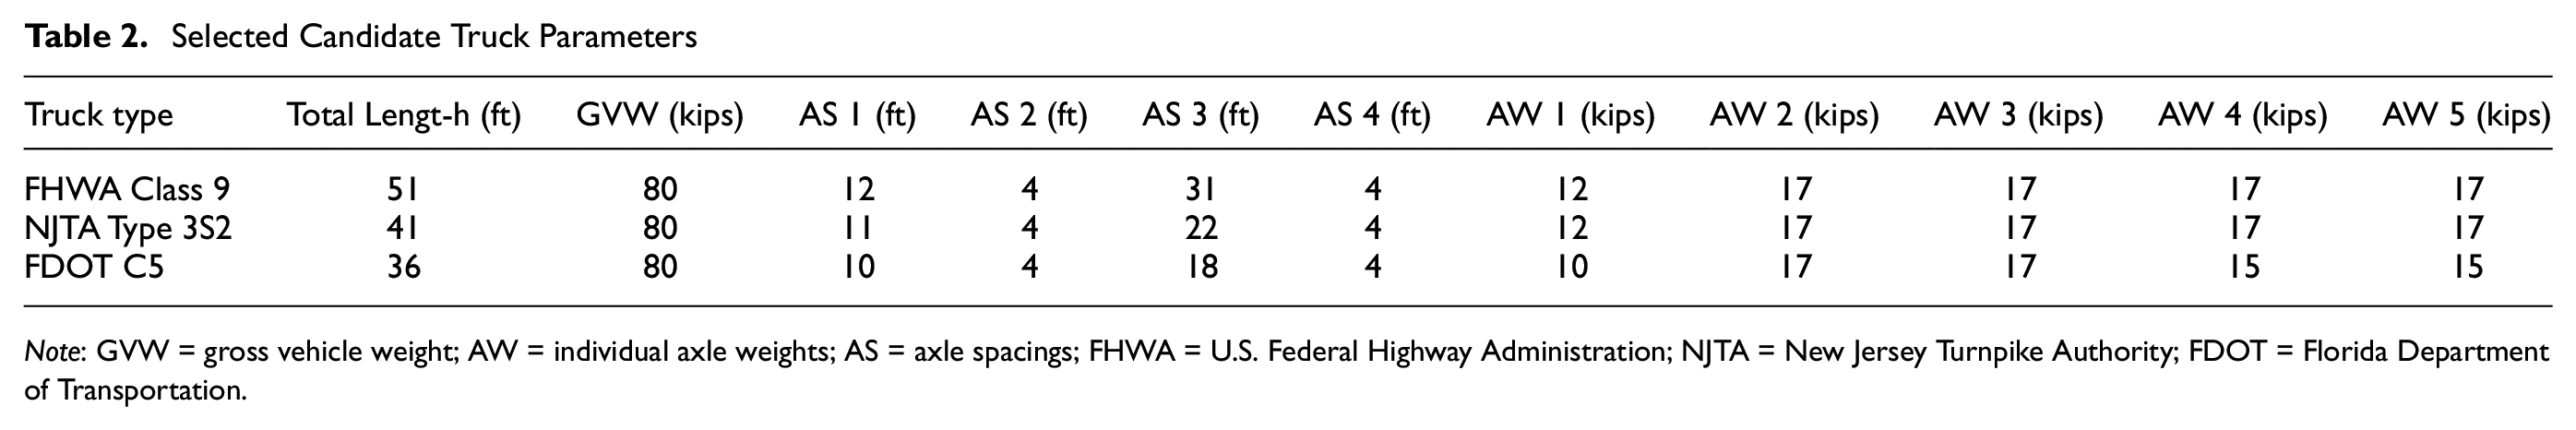
Note: GVW = gross vehicle weight; AW = individual axle weights; AS = axle spacings; FHWA = U.S. Federal Highway Administration; NJTA = New Jersey Turnpike Authority; FDOT = Florida Department of Transportation.
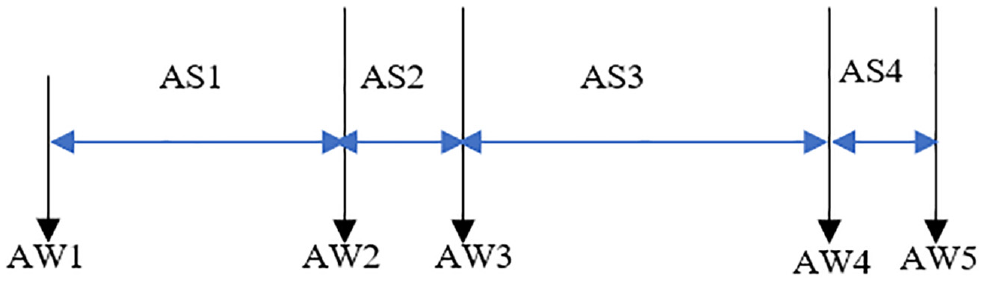
Candidate trucks configuration for autonomous truck platoon (ATP).
Static Live Load Effects From ATPs
Live loads as a function of span lengths and configuration of ATPs are evaluated and compared with loads of current design provisions. A MATLAB code is used to perform the moving loads analysis and obtain the maximum values of shear force and bending moments.
Figures 4 and 5 respectively show the maximum values for the bending moment and the shear force. The headway spacings are set at 10 ft, 15 ft, and 20 ft and correspond to distances considered in previous studies on fuel savings for platoons of two trucks ( 3 ).
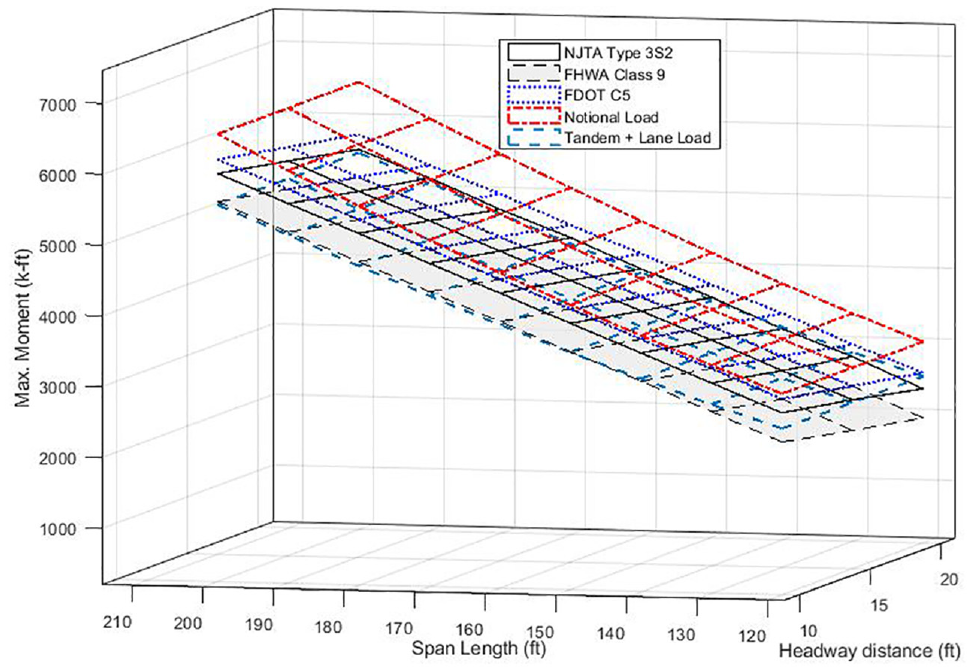
Maximum flexure effects for different autonomous truck platoon (ATP) arrangements as a function of the bridge span length.
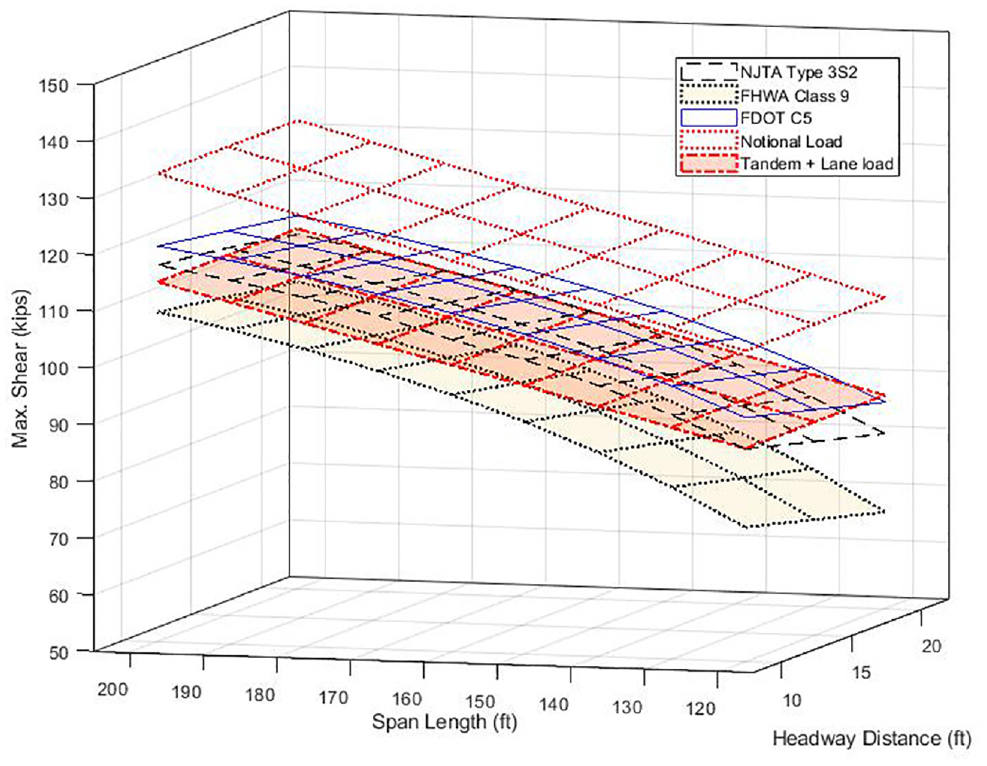
Maximum shear force from different autonomous truck platoon (ATP) arrangements as a function of bridge span length.
In Figures 4 and 5, the notional static live load represents the HL93 truck in conjunction with lane loads. It can be seen that static live load effects of platoons are below the notional load for all configurations. Nevertheless, the FDOT C5 truck may be of concern for small spacing of adjacent trucks.
Next, standard bridges using AASHSTO LFD and LRFD designs are analyzed to determine the effect of platooning on their respective reliability indices.
AASHTO LFD Bridge
A steel composite bridge was selected from Table E-4 of the NCHRP 368 report (
20
) (Table 3). In Table 3,
Dead and Live Loads of the Selected Bridges From NCHRP 368 Table E-4
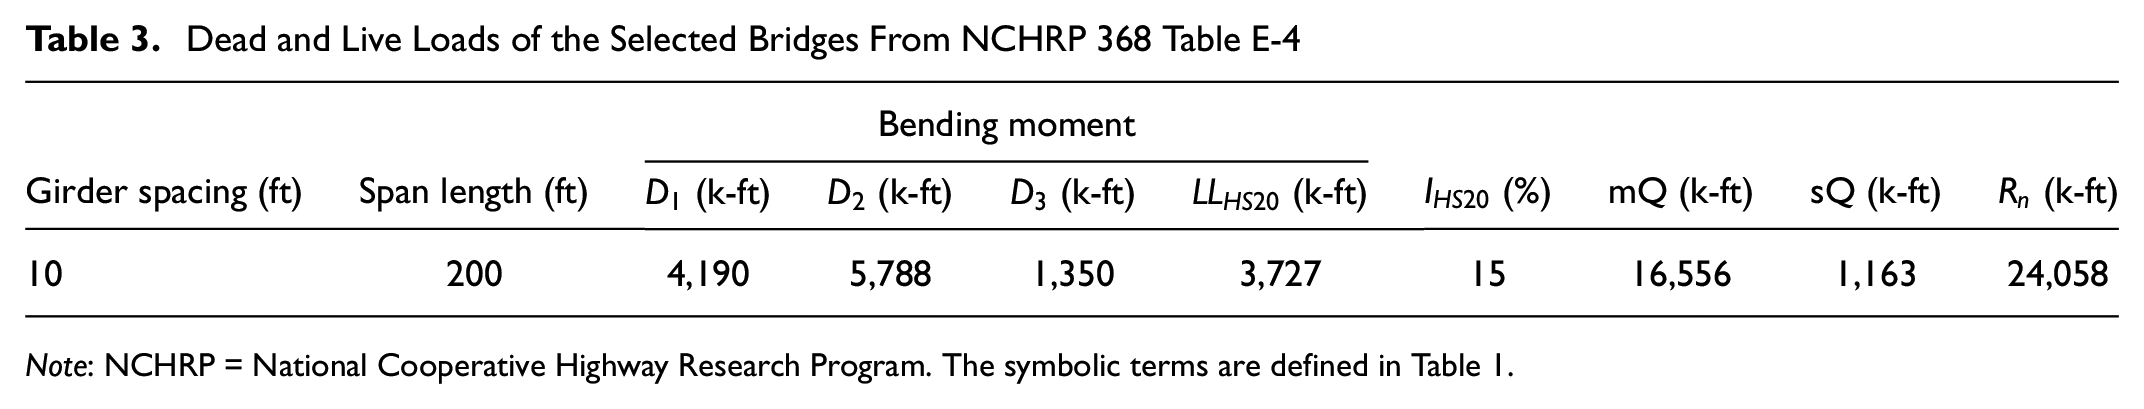
Note: NCHRP = National Cooperative Highway Research Program. The symbolic terms are defined in Table 1.
The dead load bias factors (

where

The required nominal resistance is calculated according to AASHTO LFD as:

The strength reduction factor

Statistical Parameters for the Load and Resistance Distributions According to AASHTO LFD Provisions
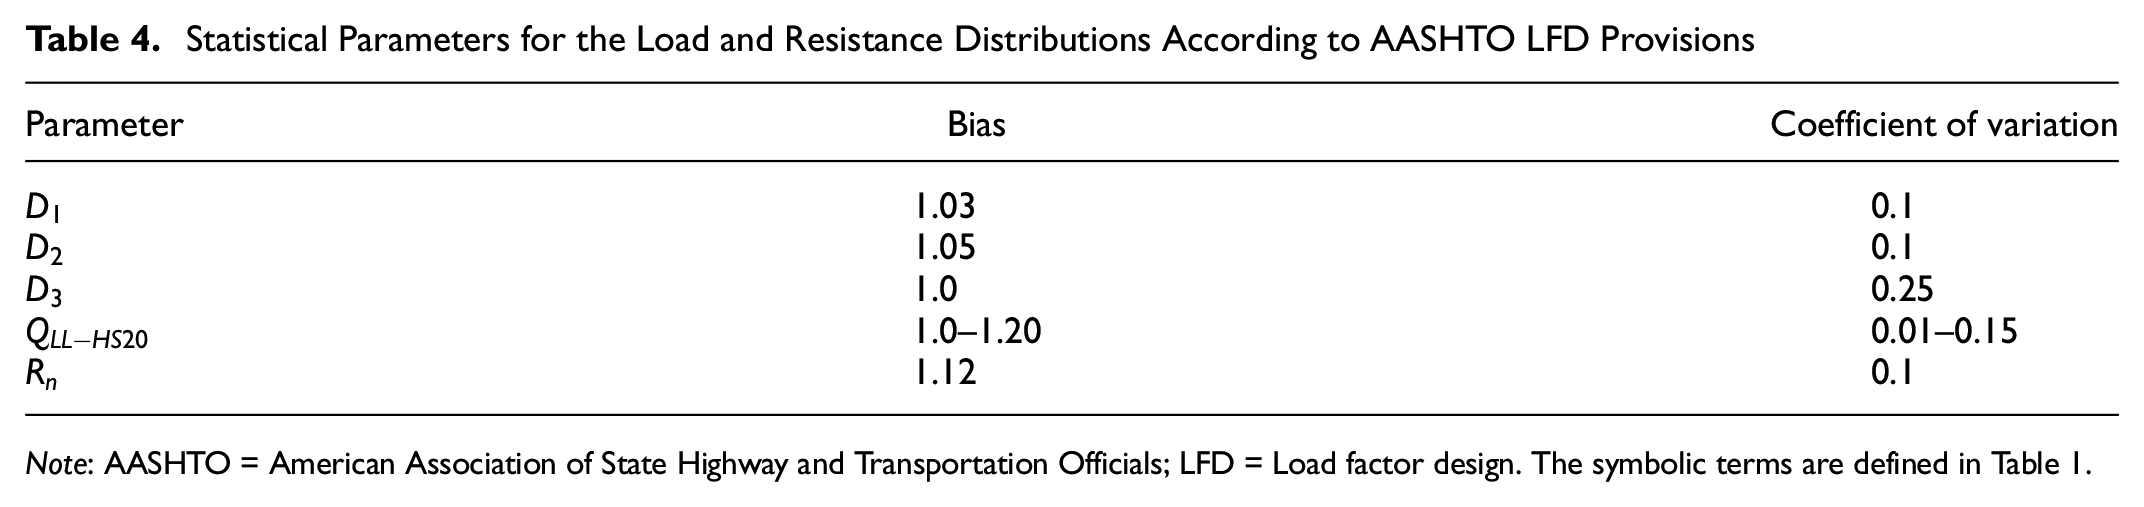
Note: AASHTO = American Association of State Highway and Transportation Officials; LFD = Load factor design. The symbolic terms are defined in Table 1.
Design Parameters for the Selected Bridge for the AASHTO LRFD Provisions
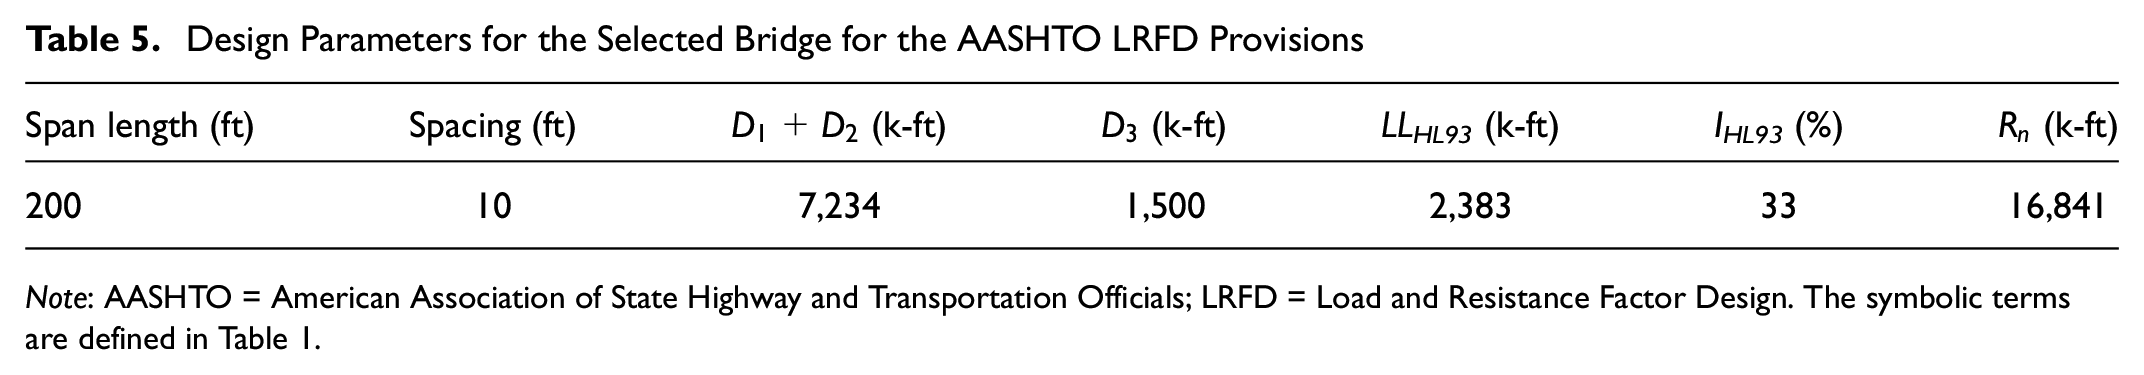
Note: AASHTO = American Association of State Highway and Transportation Officials; LRFD = Load and Resistance Factor Design. The symbolic terms are defined in Table 1.
To obtain the live load distribution for platooning trucks, the statistical parameters given in Table 4 are used. While the bias and the CoV for the dead load components and the resistance are obtained from the NCHRP 368 (
20
), the same for the live load is not available for the load distributions specific to ATP. Assumptions are made for the statistical parameters of the static live load distribution for ATP. The bias factor represents the ratio of the mean maximum moment (or shear) of the cumulative distribution function extrapolated over the design period and the moment (or shear) from truck loading of AASHTO LRFD or AASHTO LFD. It incorporates the variations of loads in time for which the bridge is designed. It is represented by Equation 5, in which

The reliability indices as a function of headway distance and span length for each platoon configuration are shown in Figure 6. The bridges considered in this study have a reliability index of 3.5 using current design loads.
Reliability indices for different types of autonomous truck platoon (ATP) constituted by different candidate trucks.
The reliability indices in Figure 6 as a function of headway distance are obtained for a 200 ft simple span composite steel bridge using a CoV of 0.07 and a bias factor of 1, and with a girder distribution factor for girder spacing of 10 ft and dynamic amplification of 15%. The simulations performed in NCRHP 368 suggest that the dynamic amplification factor values are lower for two trucks than for one truck and are reduced for larger number of axles. This indicates that the 15% value given in NCHRP 368 may be slightly conservative for the ATP. However, to avoid too many assumptions, the value of 15% is finally selected. The values of the CoV and bias on live loads for the parametric study (Figure 6) are considered conservative since it can be assumed that the weight of platoon trucks will be more regulated and controlled than current trucks ( 19 ). The reliability indices for platoons of FHWA class 9 trucks are greater than 3.5 in all cases, while platoons of NJTA Type 3S2 and FDOT C5 trucks have reliability indices below 3.5 for headway distances below 15 ft and 17 ft respectively, which may be difficult to attain operationally.
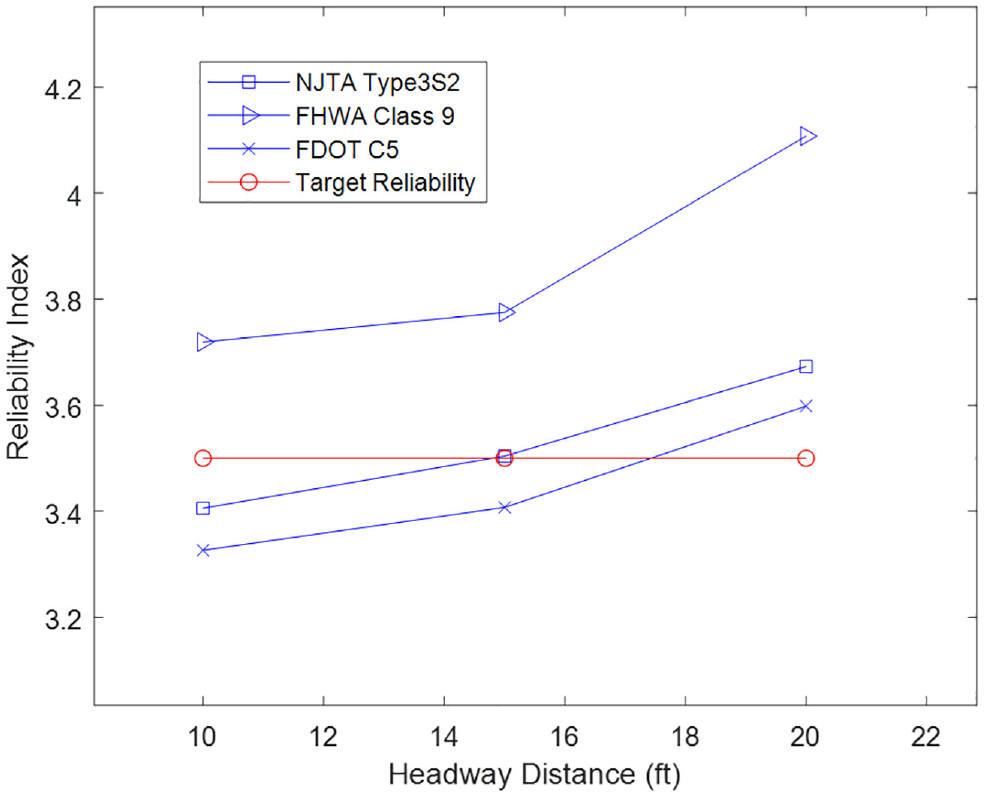
The effect of headway distances and statistical parameters (CoV and bias factor) on the reliability indices are shown in Figures 7 and 8, respectively. For the parametric study on the CoV, the bias factor is set at 1.0. As expected, increasing the CoV from 0.01 to 0.15 reduces the reliability index below 3.5 for all truck platoon configurations constituted by NJTA Type 3S2 and FDOT C5 for a CoV of 0.15. However, at 0.15 CoV, the headway spacings above 15 ft have reliability index above 3.5, as shown in Figure 7. There seems to be not much effect on the reliability indices for the CoV of 0.01 and 0.07 for smaller headway spacings (Figure 7).
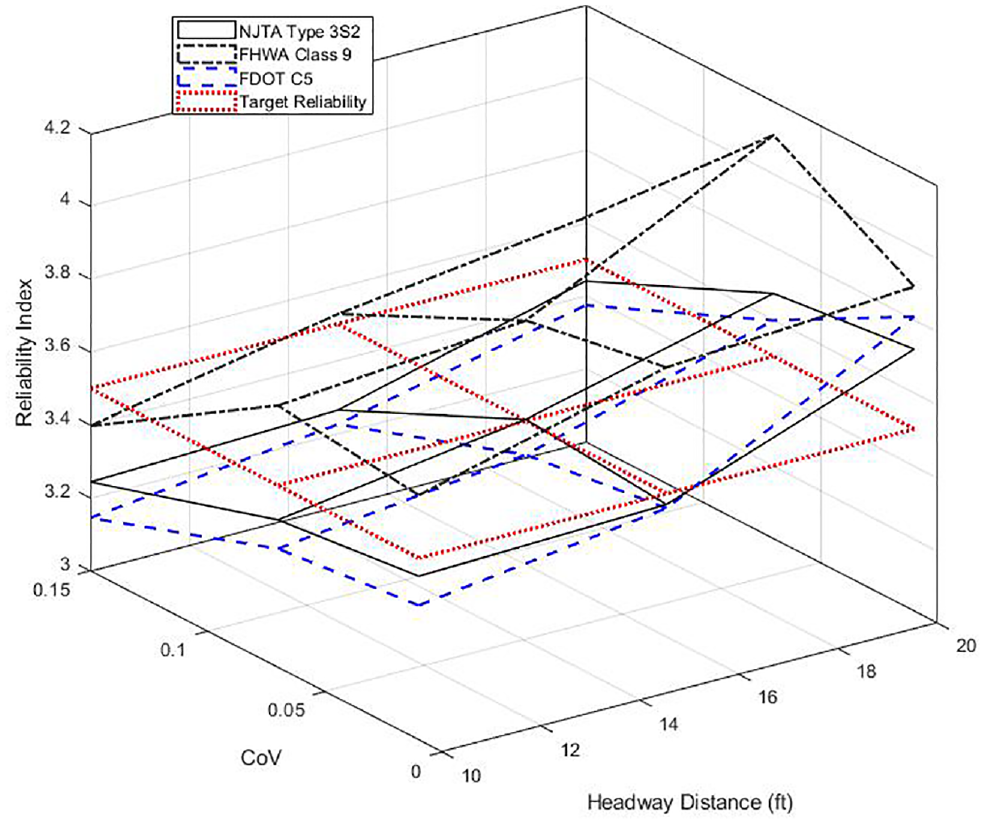
Reliability analysis of different platooned trucks: effect of coefficient of variation (CoV).
Reliability analysis of different platooned trucks: effect of bias factor.
Next, the effect of the bias factor on the reliability index is evaluated for a CoV of 0.07. The CoV of 0.07 is selected for parametrization of the bias factor for consistency with the results in Figure 6 as well as for being conservative. It can be seen that the bias factor has a much higher influence than the CoV. Increasing the bias factor from unity to 1.10 makes the bridge unable to sustain loads from the NJTA Type 3S2 and FDOT C5 platoons for all the headway distances. It is worth mentioning that the mean maximum moment in the cumulative distribution function for the designed period of the bridge and the moment (or shear) from the platoon trucks configuration studied in this research are assumed to be closely comparable, which thereby provides a basis for the value of one or close to one. Further research is required to obtain more accurate estimates of the bias factor for platooning.
AASHTO LRFD Based Designed Bridge
The process described in the preceding section is repeated for a bridge designed according to AASHTO LRFD ( 18 ) provisions for minimum nominal resistance. The parameters of this bridge are provided in Table 5 and all the symbolic terms defined in Table 1.
The nominal resistance is calculated according to:
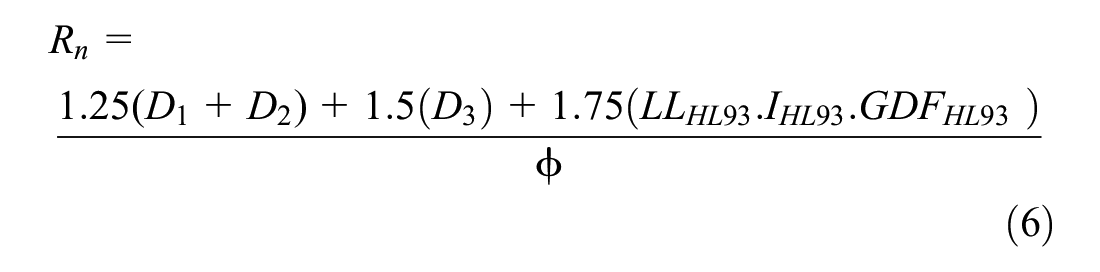
The moment from static live load calculated for the given span length is 6,520 k-ft from the HL93 truck and lane loading. The dynamic amplification factor for HL93 truck loading (

The last term in Equation 7 is usually taken as unity for preliminary design for which the guidance is provided in section 4.6.2.2.1-1 and Table 4.6.2.2.1-3 of AASHTO LRFD ( 18 ). It is worth mentioning that the GDF in Equation 7 includes the multi-presence factor effect. In other words, for single lane loaded case, which is the assumption in this paper, the value obtained from Equation 7 has to be normalized by the multiple presence factor of 1.20.
On the other hand, the parameters for the statistical distributions of the platoon live load and dead load components of the bridge are given in Table 6.
Statistical Parameters of the Resistance and Loads for the Bridge Designed According to AASHTO LRFD
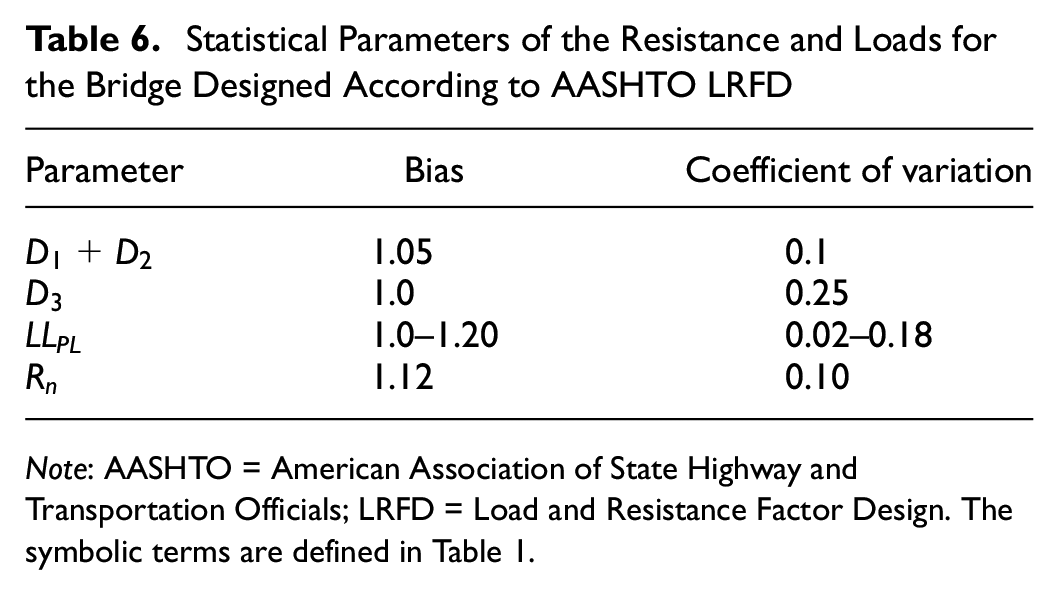
Note: AASHTO = American Association of State Highway and Transportation Officials; LRFD = Load and Resistance Factor Design. The symbolic terms are defined in Table 1.
The CoV, IHL93, and bias factor are taken as 0.18, 33%, and 1.14 respectively, consistent with the AASHTO LRFD provisions for the HL93 loading. The bridge given in Table 5 is designed for a target reliability of 3.15 ( 19 ). The reliability indices for the platoons constituted by each truck are larger than the target reliability for which the bridge is designed for all the arrangements considered in this study (Figure 9).
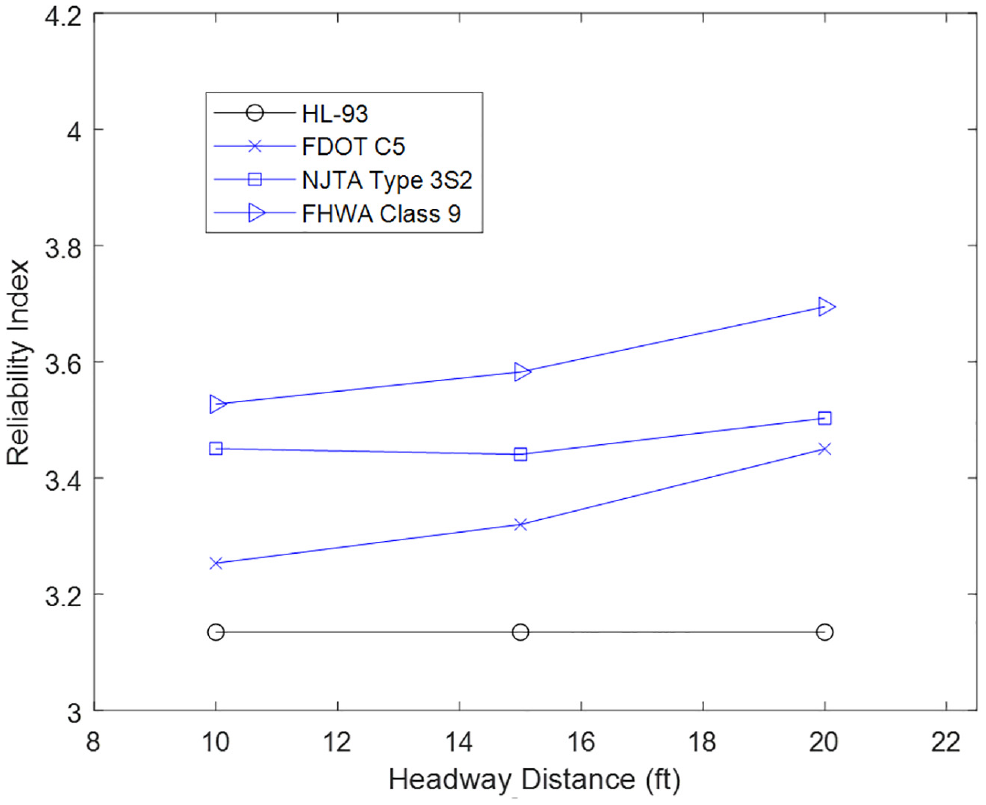
Comparison of safety indices for the bridge designed according to AASHTO LRFD bridge design specifications when subjected to platoon loadings.
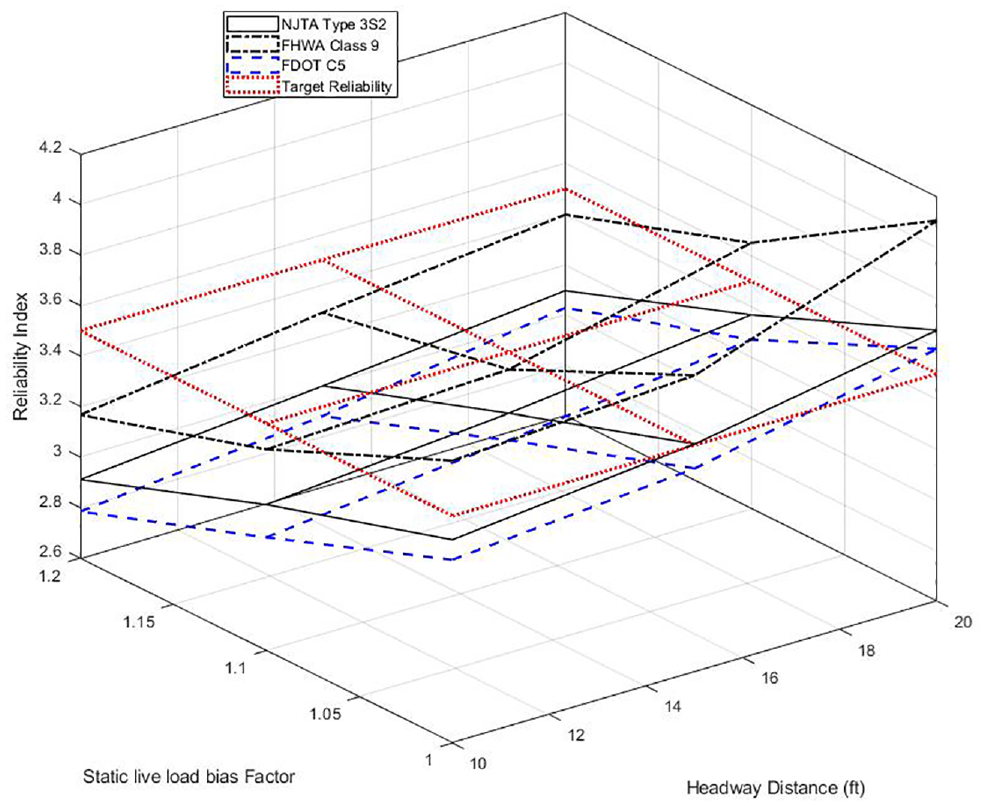
The parametric study is performed to investigate the effect of platoon characteristics and weight distribution parameters on the safety indices of the bridge. Figure 10 shows the influence of the CoVs of 0.02, 0.09, and 0.18 on the reliability index for a bias factor of 1.14 and IHL93 of 33% (Table 5). In all the cases, the reliability indices are larger than the design reliability index. A similar trend is observed in the reliability indices as a function of the bias factor and headway distances for a CoV of 0.18 and
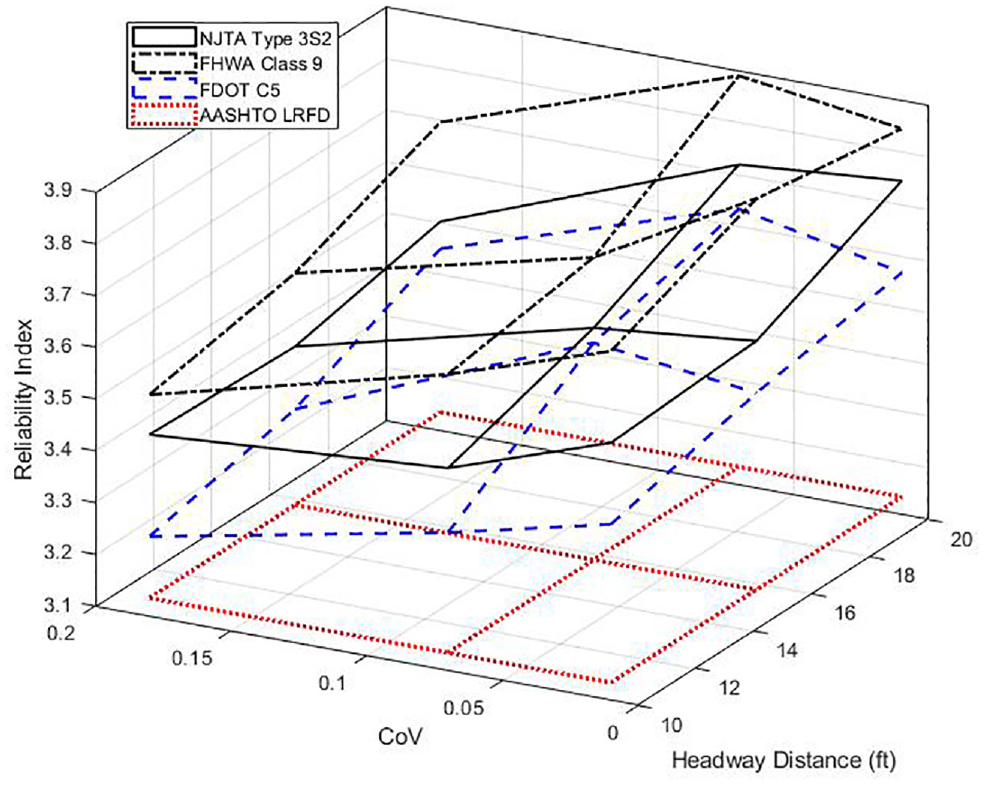
Reliability indices for various platoon loadings as a function of the coefficient of variation and headway distances.
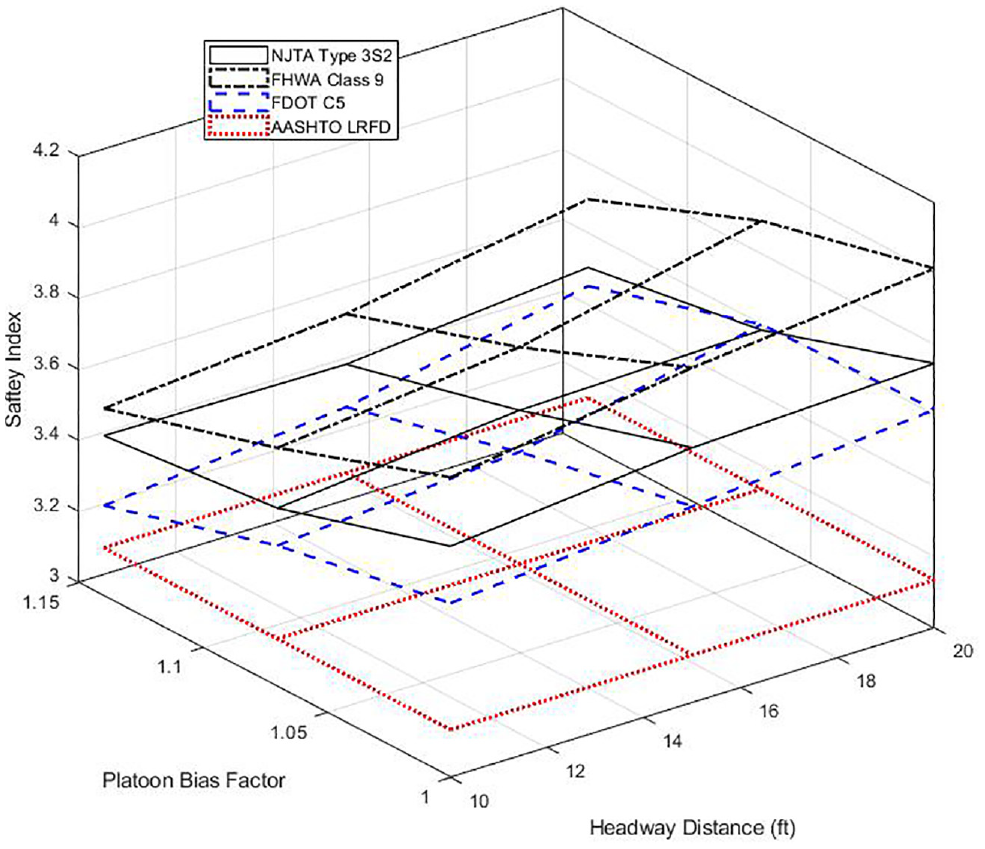
Reliability indices for platoon loadings as a function of bias factor and headway distances.
The IHL93, which is selected according to the AASHTO LRFD provisions for the analyses, has a significant influence on the reliability index (Figure 12). The value selected here and currently recommended may be conservative for platoons and should be investigated in future studies.
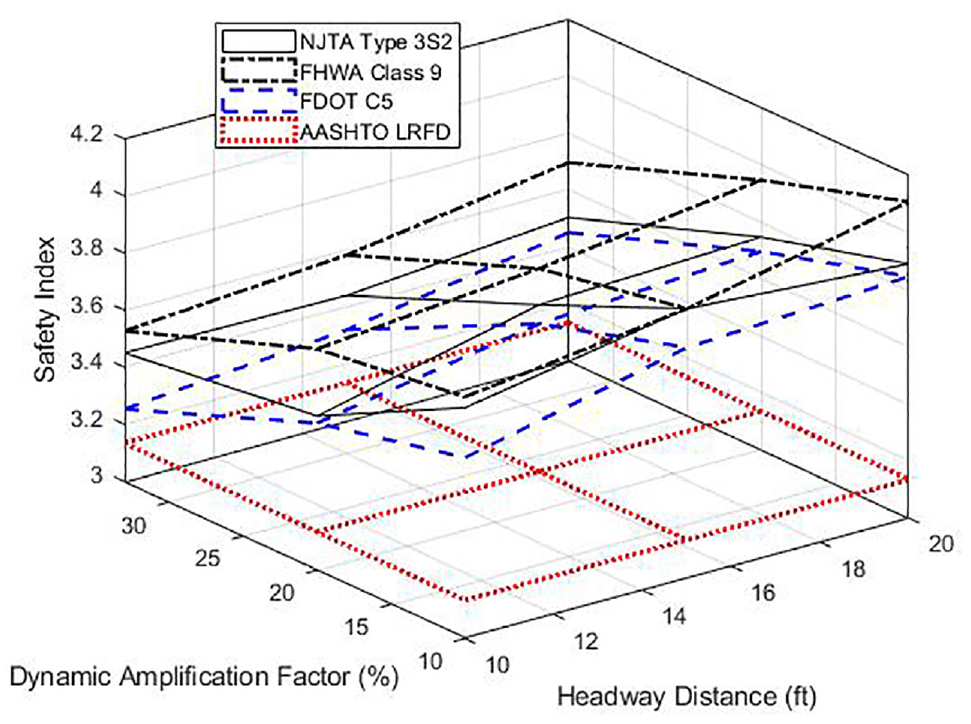
Influence of dynamic amplification (
Conclusion
A methodology is proposed to perform the reliability analysis of single span bridges subjected to two-truck ATP loads with different constituent trucks and headway spacings. Steel composite bridges designed on the basis of the minimum nominal resistance respectively using the AASHTO LFD and AASHTO LRFD provisions are used for this purpose. A live load model for ATP is investigated for a range of values for bias factors and CoV values. The safety indices obtained for the ATP constituted by different types of standard trucks are compared with the target reliabilities used for the original design of the bridges without ATP.
For the AASHTO LFD designed bridge: It is shown that for bias factor of 1.0 for platoon loads and CoV of 0.07, the FHWA class 9 platoon with two trucks achieved higher reliability indices, compared with the original design, for truck spacings of 10 to 20 ft and span lengths of 200 ft. For the NJTA Type 3S2 truck, the reliability indices are acceptable for axle spacings between adjacent trucks greater than 15. For the FDOT C5 truck, the reliability index is acceptable for truck spacings greater than 20 ft. Closer spacings would promote higher fuel consumption efficiencies and could be achieved if smaller CoVs were required for truck platoons. In the latter case, it would be desirable to recalibrate the live load factors that are specific to the distribution of ATP loads.
For the AASHTO LRFD designed bridges: It is shown that with the bias factor of 1.14, CoV of 0.18, and dynamic amplification factor of 33%, all the platoon configurations studied in this research surpassed the target reliability index for the which the bridge was initially designed.
Accurate values of bias and CoV are necessary for the quantification of the live loads of ATP. One way to obtain these values is to treat the ATP as special permit vehicles in the histogram of the WIM datasets. The statistical parameters of such heavy tailed distributions can then be obtained, which will be more representative of ATP loads in future reliability analyses. Based on the results of this study, future research is suggested to focus on: (a) safety indices for continuous spans and other bridge types, (b) the dynamic amplification factor for platoon trucks, (c) calibration of platoon live loads for various target reliabilities, and (d) the bias factor for the static live load.
Footnotes
Author Contributions
The authors confirm contribution to the paper as follows: conceptualization, software, writing manuscript, data analysis: Sikandar Sajid; conceptualization, review, project management, securing funding: Luc Chouinard; review, project administration, funding: Frederic Legeron, Todd Ude, Eddie He, Jack Ajrab.
Declaration of Conflicting Interests
The author(s) declared no potential conflicts of interest with respect to the research, authorship, and/or publication of this article.
Funding
The author(s) disclosed receipt of the following financial support for the research, authorship, and/or publication of this article: the first author was awarded the Mitacs Accelerate Fellowship to fund this research.