
Abstract
This paper discusses the importance of near-crash events and associated metadata as valuable sources for smart transit applications, such as surrogate safety measures for transit safety research. The STAR Lab at the University of Washington, sponsored by the Federal Transit Administration, has developed an edge computing system that processes onboard videos for near-crash detection. This paper builds on previous work by addressing two research questions: first, how to leverage the near-crash detection system to synthesize rich data sources on transit vehicles, and second, how to use the smart data hub to support transit operation and safety studies. The proposed procedures for event-based transit data collection, evaluation of commercial collision avoidance warning systems (CAWS) technologies, and transit safety hotspot identification are detailed. CAWS’ performance was benchmarked on four transit buses that were operated for almost a year in Pierce County, WA, U.S. Furthermore, the meta-information of near-crash events enables hotspot analysis and the identification of several exemplar clusters that can be explained by driver behavior and roadway geometries. The results of the experiments demonstrate the system’s promising performance and its applicability to addressing various transit operation questions.
Transit vehicles possess an abundance of sensors and data collection services to support transit operations and safety concerns, making them data warehouses. However, because of barriers between different data providers and limited motivation for extended application, these data need better utilization and synchronization for research purposes. The technical challenge of integrating multi-source data onboard in real-time is further exacerbated by limited computation, storage, and network capacities. Furthermore, most bus operation data is unhelpful for studying transit-related issues since the events of interest for research, such as transit-related collisions, congestion, and high passenger volume, occur infrequently. Nonetheless, the rich source of onboard data, in conjunction with existing services like internet connectivity, power supply, and sensor feed connections, positions transit vehicles as a unique platform that enables various research and onboard system development.
Near-crash data is often highly valuable in transit safety studies because they can reveal the underlying causes of incidents resulting in minimal or no losses, and they exist in significantly larger quantities than actual accidents. Collecting and analyzing these events can benefit transit operations significantly. Various sources, such as onboard surveillance cameras and telematics data, offer rich information, including GPS location, speed, heading, driver information, and bus station information, among others, at high resolution. Despite this, there remains a need for a real-time onboard system that collects transit event videos and associated event data.
This study employs cutting-edge sensing, communication, and edge computing solutions to develop a real-time onboard transit event logging system (TELS) capable of detecting transit events, such as near-crashes, and recording and sharing data in real-time when triggered, using existing onboard hardware devices. TELS can also communicate with other external systems operating on transit buses in real-time via controller area network (CAN) to log data from both TELS and the target system about the same events. These event-based data are valuable as they associate video recordings with vehicle operations and can be utilized for: 1) evaluating the effectiveness of existing commercial collision avoidance warning systems (CAWS) technology on transit buses and 2) analyzing transit bus operations and safety patterns. A previous paper from the authors designed and validated the near-crash detection algorithm on edge computing devices ( 1 ). The system and model development, training, and validation are documented in that prior paper by the authors, while this current paper primarily focuses on utilizing the developed system as a smart data hub to evaluate other transit bus event detection systems.
To summarize, our study has made several contributions.
We have designed and adopted an edge computing system to support real-time event-based transit event logging, which efficiently reduces data communication, storage, and computation loads.
We have developed a database for storing event-based multi-source transit data.
We have implemented procedures to evaluate the false-positive (FP) and false-negative (FN) rates of an external collision avoidance system for transit operations.
We have mapped and analyzed near-crash hotspots using the collected transit event data.
These contributions represent important advances in transit safety research, and we believe they will have practical implications for improving transit operations and safety.
Literature Review
Review of Traffic Anomaly and Near-Crash Detection
Two major challenges in near-crash detection are: 1) the lack of sufficient data for algorithm development and 2) the wide variety of near-crash types. Crash detection is achieved mainly by using surveillance cameras, although time series data can also be used for some relatively simple detection tasks ( 2 ). Traffic anomaly detection, for example, crash detection, can be divided into three categories: supervised learning, unsupervised learning, and semi-supervised learning.
Supervised learning methods are useful when the number of classes is clearly defined and training dataset is large enough to make the model statistically significant. Supervised learning, however, requires manual labeling and needs both data and labor, and it cannot detect unforeseen anomalies ( 3 – 5 ). Unsupervised learning has no requirement for labeling data and is more generalizable to detect unforeseen anomalies as long as sufficient normal data are available. Anomaly detection will be difficult when the nature of the input data changes over time, for example when a surveillance camera keeps changing angle and direction. ( 6 ).
Li et al. designed an unsupervised method based on multi-granularity tracking, and their method won first place in the 2020 Artificial Intelligence (AI) City Challenge. Semi-supervised learning needs only weak labels ( 7 ). Chakraborty et al. proposed a semi-supervised model for freeway traffic trajectory classification using You Only Look Once (YOLO), simple online real-time tracking (SORT), and maximum-likelihood-based contrastive pessimistic likelihood estimation ( 8 ). Their model detects anomalies based on trajectories and improved accuracy by 14% compared with state of the art. Sultani et al. modeled videos as bags and video segments as instances in multiple instance learning; their method automatically learned an anomaly ranking model with weakly labeled data ( 9 ). Traffic anomaly detection has been advancing both through design of new learning methods and design of new object tracking methods. In the 2021 AI City Challenge, all top-ranking methods made contributions to tracking methods ( 10 – 12 ).
Traffic near-crashes or traffic near-misses represent conflicts between road users that have the potential to develop into collisions. Near-crash detection using onboard sensors is the first step for multiple ITS applications. Near-crash data serves as: 1) surrogate safety data for traffic safety studies, 2) “corner case” data for autonomous vehicle testing, and 3) input to collision avoidance systems. Pioneering studies on automatic near-crash data extraction used both light detection and ranging (LiDAR) and cameras located on fixed site infrastructure ( 13 – 15 ).
In recent years, near-crash detection systems and algorithms using onboard sensors have been developing rapidly. Ke et al. and Yamamoto et al. each applied conventional machine learning models (support vector machine and random forest) in their near-crash detection frameworks using regular computers ( 16 , 17 ). The state of the art tends to use deep learning for near-crash detection. The integration of convolutional neural network, long short-term memory (LSTM) neural network, and attention mechanism was demonstrated to be superior to the state of the art in recent studies ( 17 – 19 ). Ibrahim et al. presented that a bi-directional LSTM with self-attention outperformed a single LSTM with a normal attention mechanism ( 18 ). Another feature in recent studies was the combination of onboard camera sensor input and onboard telematics input, such as vehicle speed, acceleration, and location, to improve the near-crash detection performance and/or increase the number of recorded variables in output data ( 17 , 20 ).
Review of Real-World Automated Vehicle (AV) Technology Testing
Real-world automated vehicle (AV)-related technology testing is expensive in both time and cost, but it is a must for any AV technology to be ready for production. While large-scale real-world tests are typically led by high-tech industrial companies or vehicle original equipment manufacturer, the testing can often be interrupted by budget cuts during uncertain times or pressure from the public after a fatal accident. Since L5 AVs are far from ready, many academic institutions have been actively contributing to real-world AV testing as well, especially on the topics of algorithm/system innovation, technology evaluation, field tests for traffic modeling, field data generation, and so forth ( 16 , 21 – 32 ). In the Stadtpilot project, Nothdurft et al. tested autonomous driving on Braunschweig’s inner-city ring road with a vehicle called Leonie ( 21 ). A few other projects have been conducted to test certain AV features designed by the team on open roads, such as the test of a sensor-independent fusion approach at Ulm University, the test of the BRAiVE prototype by VisLab including a trip from Italy to China, and the test in Parma urban roads and freeways ( 22 – 24 ). Though these AV tests on open roads are not intended to be a demonstration that fully autonomous driving has been realized, the experience and findings are precious and are considered as a demonstration of the possibilities of L5 AV.
By evaluating the MobilEye Shield+ system on 38 buses in Washington State, researchers found that the system had the potential to reduce transit-related collisions as well as insurance costs ( 25 ). Zhao et al. focused on the characteristics of mixed traffic and studied car-following behaviors of human-controlled vehicle (HV)-following-AV and HV-following-HV with position, velocity, and acceleration data ( 28 ). Raboy et al. documented a field experiment on lane-change maneuvers, and their proposed testing platform could also be used to model and evaluate other research subcomponents of AVs ( 29 ). Another sub-category of research focuses on generating new data for benchmarking AV-related algorithms and approaches. For example, the Karlsruhe Institute of Technology and Toyota Technological Institute Vision Benchmark Suite is a representative benchmark suite that provides a variety of sensing data for AV algorithms, such as road detection, object detection, object tracking, depth estimation, and optical flow estimation ( 30 ). Other example studies, such as vehicle-pedestrian near-miss data collection and physical-world-resilient adversarial data generation, have been conducted as well ( 16 , 31 ).
Transit Event Logging System (TELS)
Design and Algorithms
The TELS system, by Ke et al., is a multi-thread hardware and software system that receives forward-facing video camera imagery, detects potential collisions, fuses video with other data, and transmits fused event data to the cloud server ( 1 ). TELS is developed based on the edge computing platform Nvidia Jetson TX2. Its four different threads operate simultaneously (see Figure 1): 1) main thread, 2) data transmission thread, 3) video frame reading thread, and 4) CAN thread. When near-crash events are detected, a trigger will be sent to the data transmission thread, and it will record video frames from a queue (a global variable) and other data associated with the near-crash event. The third thread for video frame reading keeps the latest video frame captured from the camera in another queue and will dump previous frames when the capturing speed is faster than the main thread’s frame processing speed. The CAN thread provides additional information for each near-crash event, including ego-vehicle’s speed, throttle percent, brake application state, and acceleration/deceleration rate. Here “ego-vehicle” is defined as the vehicle that operates and collects data. According to our previous study, the near-crash detection accuracy F1-score is 0.988 with 5,000 video clips.
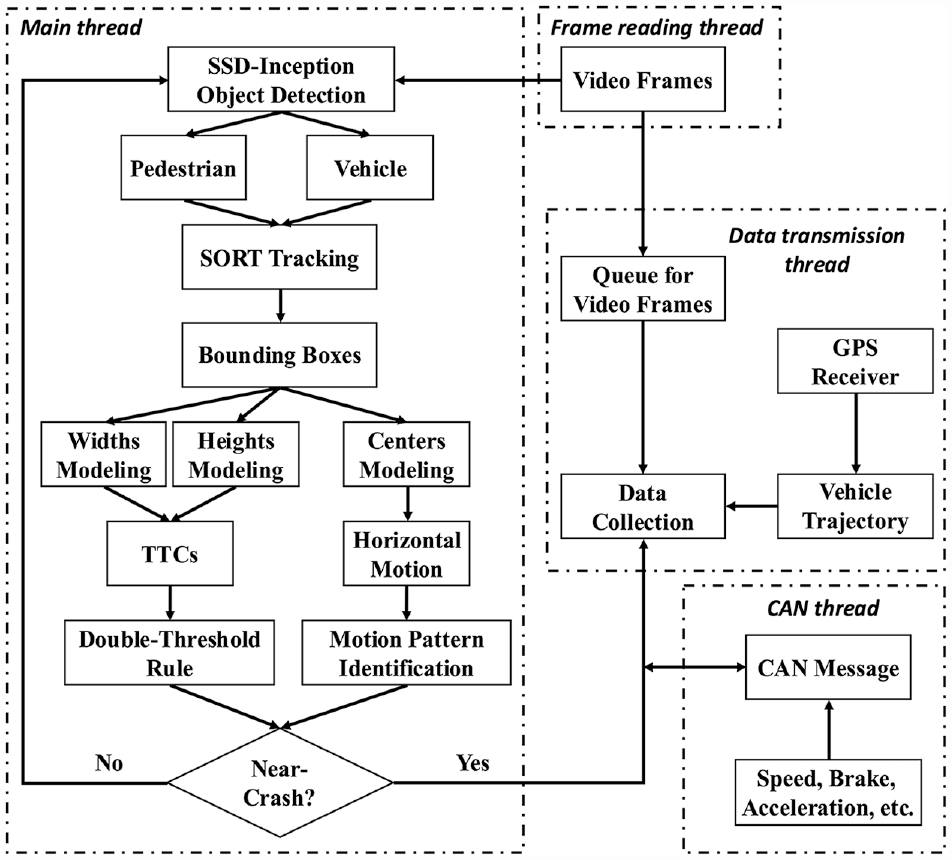
Transit event logging system architecture onboard the bus for edge processing.
The main thread starts with detecting objects in every video frame. Single shot multibox detection (SSD)-Inception, a real-time detector with nearly 30 frames-per-second speed for object detection, was chosen because of its speed and detection quality. The algorithm creates bounding boxes and identifies the types of road user in each video frame (see Figure 2).
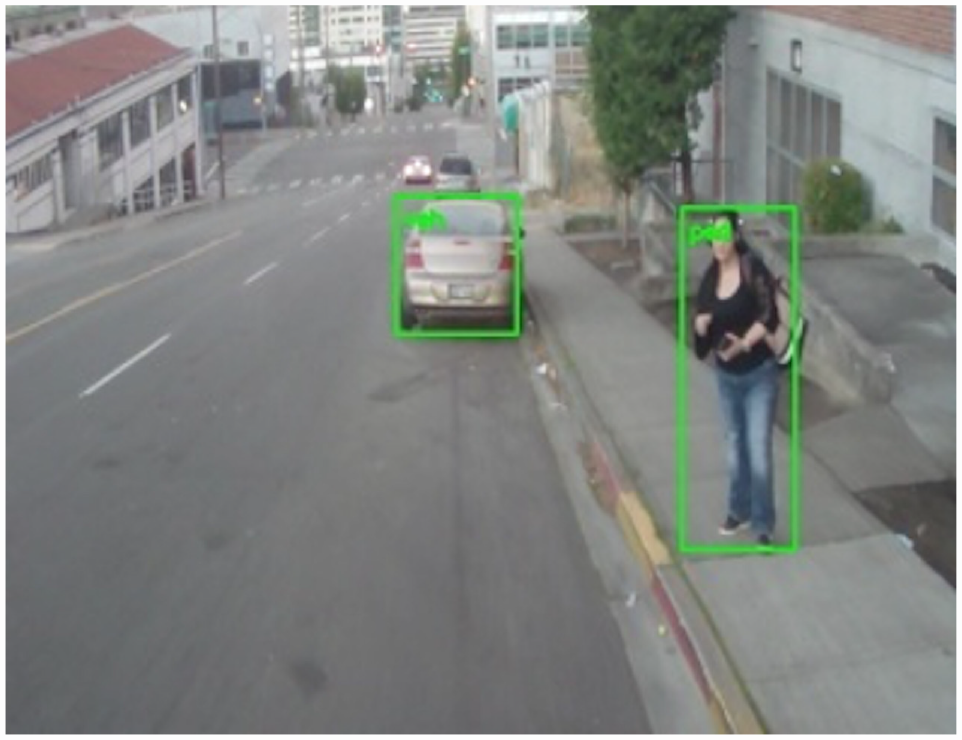
Bounding boxes around a car and a pedestrian.
Object tracking follows object detection and associates the information from each frame to determine each road user’s movement, using SORT ( 33 ). SORT is a recent benchmark and achieves good tracking accuracy without the need for complicated features, using only bounding box information. It also can eliminate some FPs and FNs generated in the detection phase. Prior studies have demonstrated SORT to be a suitable tracking method for intelligent transportation system applications ( 34 , 35 ).
The system calculates a critical metric time-to-collision (TTC) as the size of the bounding box at time

where
We further used a double-threshold rule to make sure bounding box height or width change in desired directions defined by true near-crashes: if the TTC threshold =

where
In addition, we applied another linear regression using a list of bounding box centers of the target road user. The regression result would indicate the road user movement direction in the camera view. In general, when the target location is closer to the bottom and the center line of sight, the risk of a collision is higher, so the threshold for estimating road user direction is looser. More detailed illustration can refer to our previous study of the system development ( 1 ). We used a rule to show this judgment as:

where
Since cameras have different resolutions,
Data Collection
Onboard Data Communication
TELS and the target evaluation system, that is, the pedestrian avoidance safety system (PASS), communicate onboard via CAN bus to collect event data for evaluation. When one system detects an event, it sends a pre-defined event code via CAN to trigger other systems for joint data collection. Therefore, while every single event previously could just be captured by one system, now a comprehensive dataset for the event will be recorded to enrich the event data.
The two systems synchronized the event detection status transmission rate between PASS and TELS at 10 Hz via CAN. When all sensors are inactive, PASS and TELS both transmit their status and identification codes to indicate they are awake. When a message associated with the PASS ID indicates an event, TELS data transmission thread is triggered, and data (including video clips and other data) will be collected and transmitted via the intra-bus network to the University of Washington (UW) server to record the PASS event. PASS event codes contain: warning indication, caution indication, and which sensor(s) are active for a particular event; TELS’ event codes include: caution indication, warning indication, and road user type (automobile, pedestrian, or both).
Data Reception and Processing on the Server
Three types of data are being collected:
Data and videos from TELS on four buses in real-time using the intra-bus network. TELS was connected to this network through an ethernet cable, and the network itself is a cellular network that can transmit the data wirelessly from the bus to the server. Whenever a TELS event, PASS event, or a randomly sampled event is captured, the data transmission thread is triggered and the data and video frames associated with the event will be transmitted to the project server in real time. A global queue temporarily stores the immediate past video frames in memory. When triggered, the data transmission thread calls the global queue and uploads the frames to the cloud server. This design ensures that the video transmission is in real-time but does not interrupt the main thread operation.
Bus operation data from Swiftly API. Swiftly is a platform that collects transit system data such as real-time bus locations for reporting and analysis. Swiftly data is collected every 5 s, creating 17,280 data files in JavaScript Object Notation (JSON) format every day. The JSON files are combined into one CSV file ordered by bus ID and time, both in ascending order. The primary columns include bus ID, route ID, head sign, vehicle type, direction, latitude, longitude, time, bus speed, and bus heading. In addition, two data features have been added to the file: one is the “distance” feature calculated from two consecutive GPS points, and another is the local time (PST time) converted from the Unix time.
Event data contains PASS and TELS events. The data fusion and transmission are completed on board the bus in real time. Later, the data is shared from the PASS server to the project server at UW via FTP transmission. Columns A through M in the data table are data collected through vehicle telematics and other devices (e.g., GPS). Starting from column N, those are sensors data collected by the three LiDAR sensors. TELS events are integrated with a different group of event codes in column F. The first few columns include data features such as brake switch, throttle, accelerations (in X, Y, and Z directions), gyro, and time/location. The sensor data starting from column N record objects tracked by the PASS LiDAR sensor. Sensors A, B, or C can each track up to eight different objects, and that is why there are eight different column groups for each sensor consisting of the same attributes (object distance, object speed, and time-to-collision).
All data go through a data quality control process to check completeness, consistency, orderliness, timeliness, and uniqueness. This process also includes converting Swiftly data from raw JSON format files to one aggregated comma-separated value (CSV) file per day for each bus. After the data quality control and conversion, the data is in a much more user-friendly format as well, with missing and erroneous values filtered out. A total of 17,280 data files in a day are converted to one file with organized rows and columns. With this format, it can easily be integrated into the database on the server. Database design for storing the several types of data that were collected diagram is shown in Figure 3.
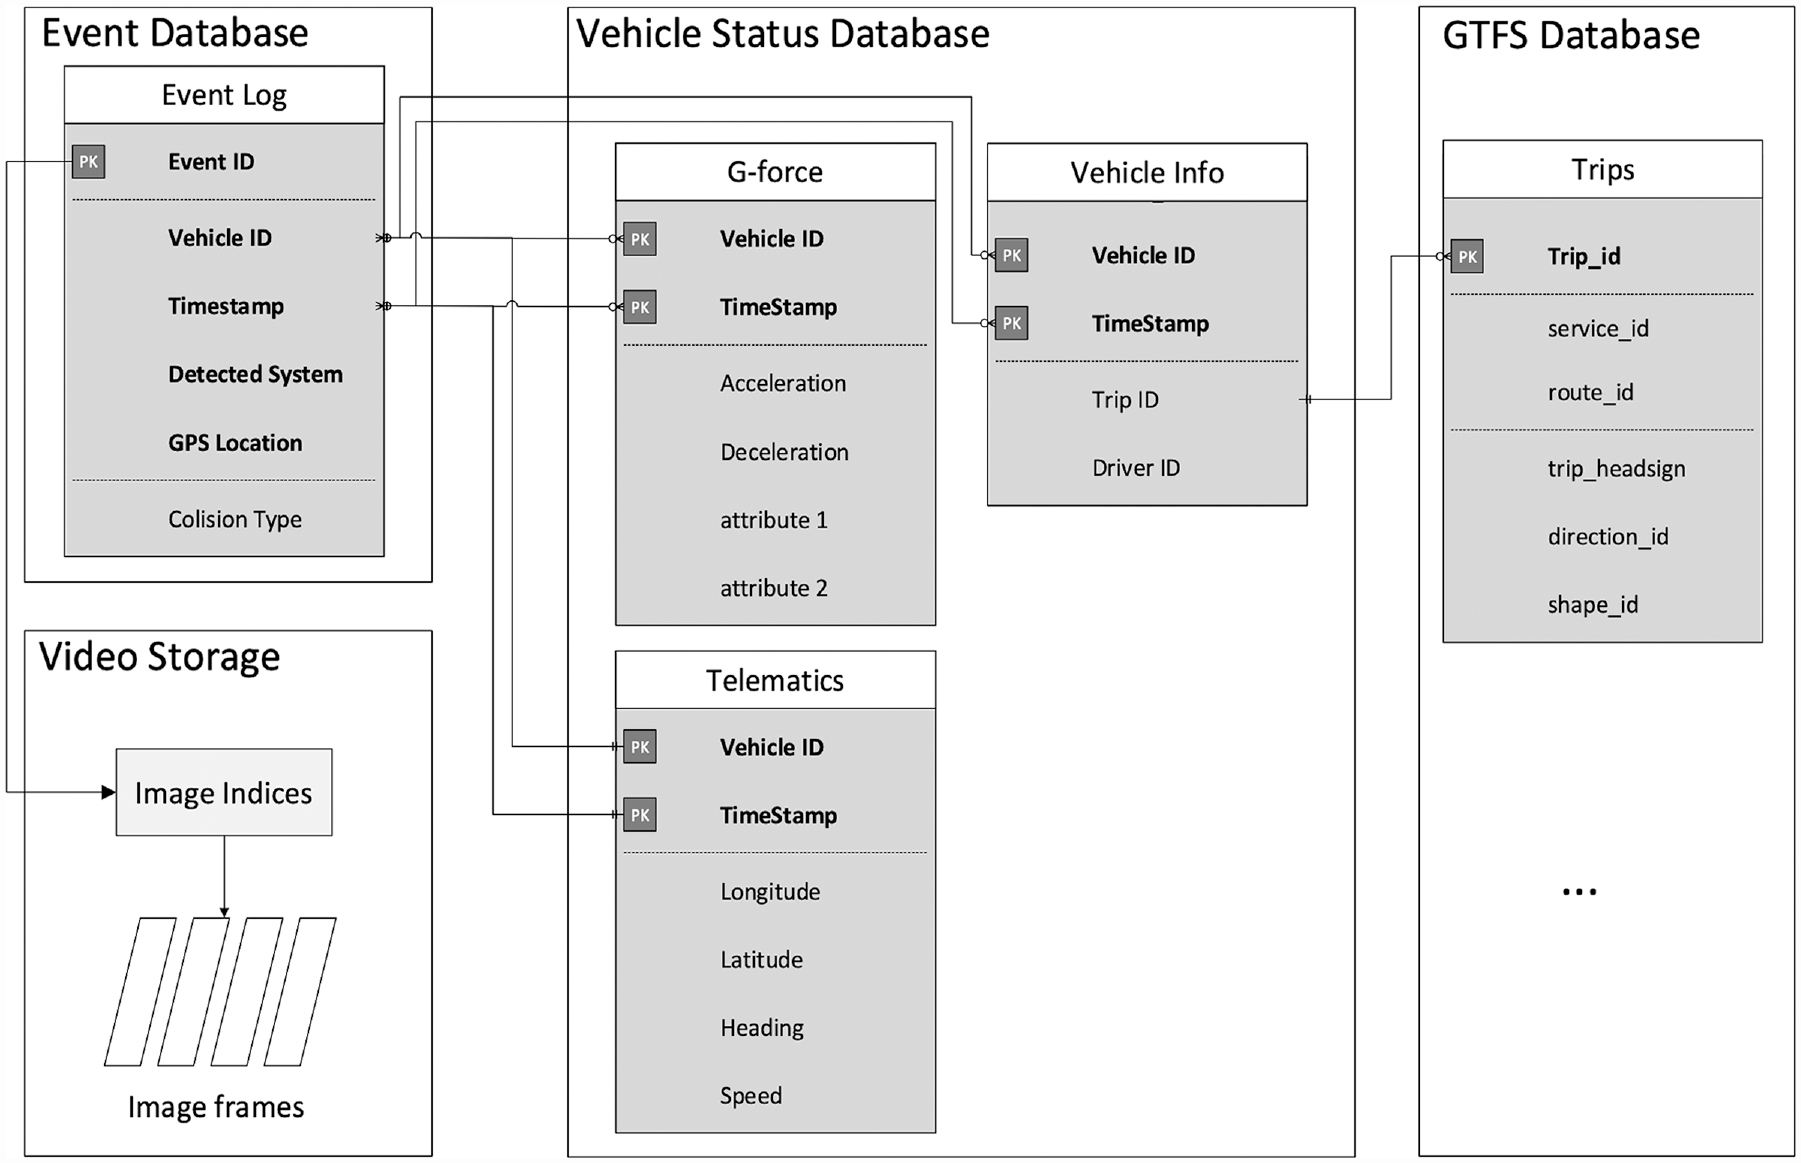
Design of databases and file systems for hosting project data.
Event Data Collection Summary
Monthly and project totals for data collected from Bus 230 are shown separately in Table 1, including pedestrian warning events, vehicle warning events, randomly sampled events, total events, and video file sizes. For the same period, the number of PASS data files collected in the UW server via FTP for the bus is shown in Table 2. PASS was installed on 30 buses, but TELS was only installed on four buses (230–233) for data collection and evaluation purposes.
Transit Event Logging System Data Collection Summary for Bus 230
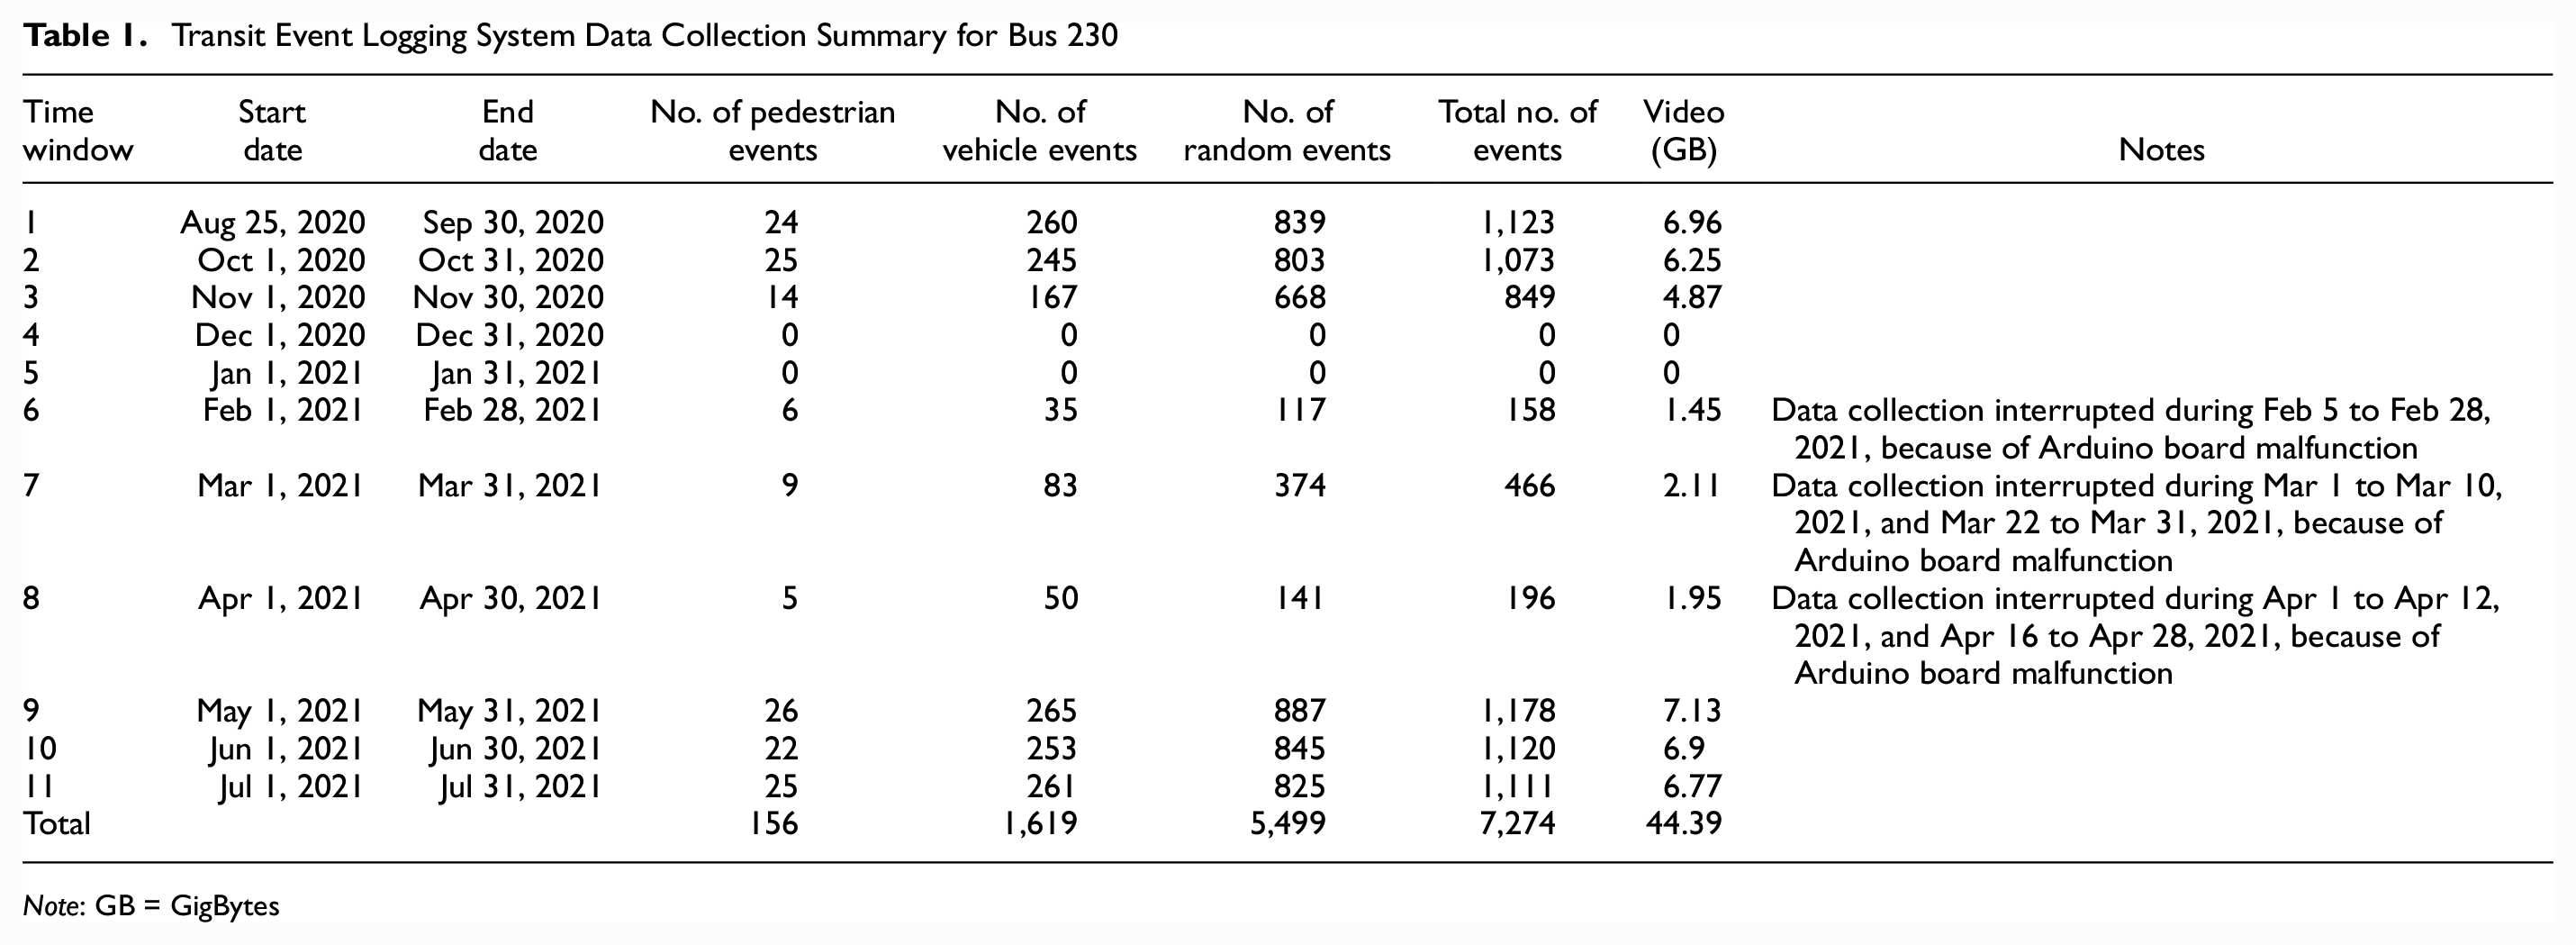
Note: GB = GigBytes
Pedestrian Avoidance Safety System Data Files Received at the University of Washington Project Server
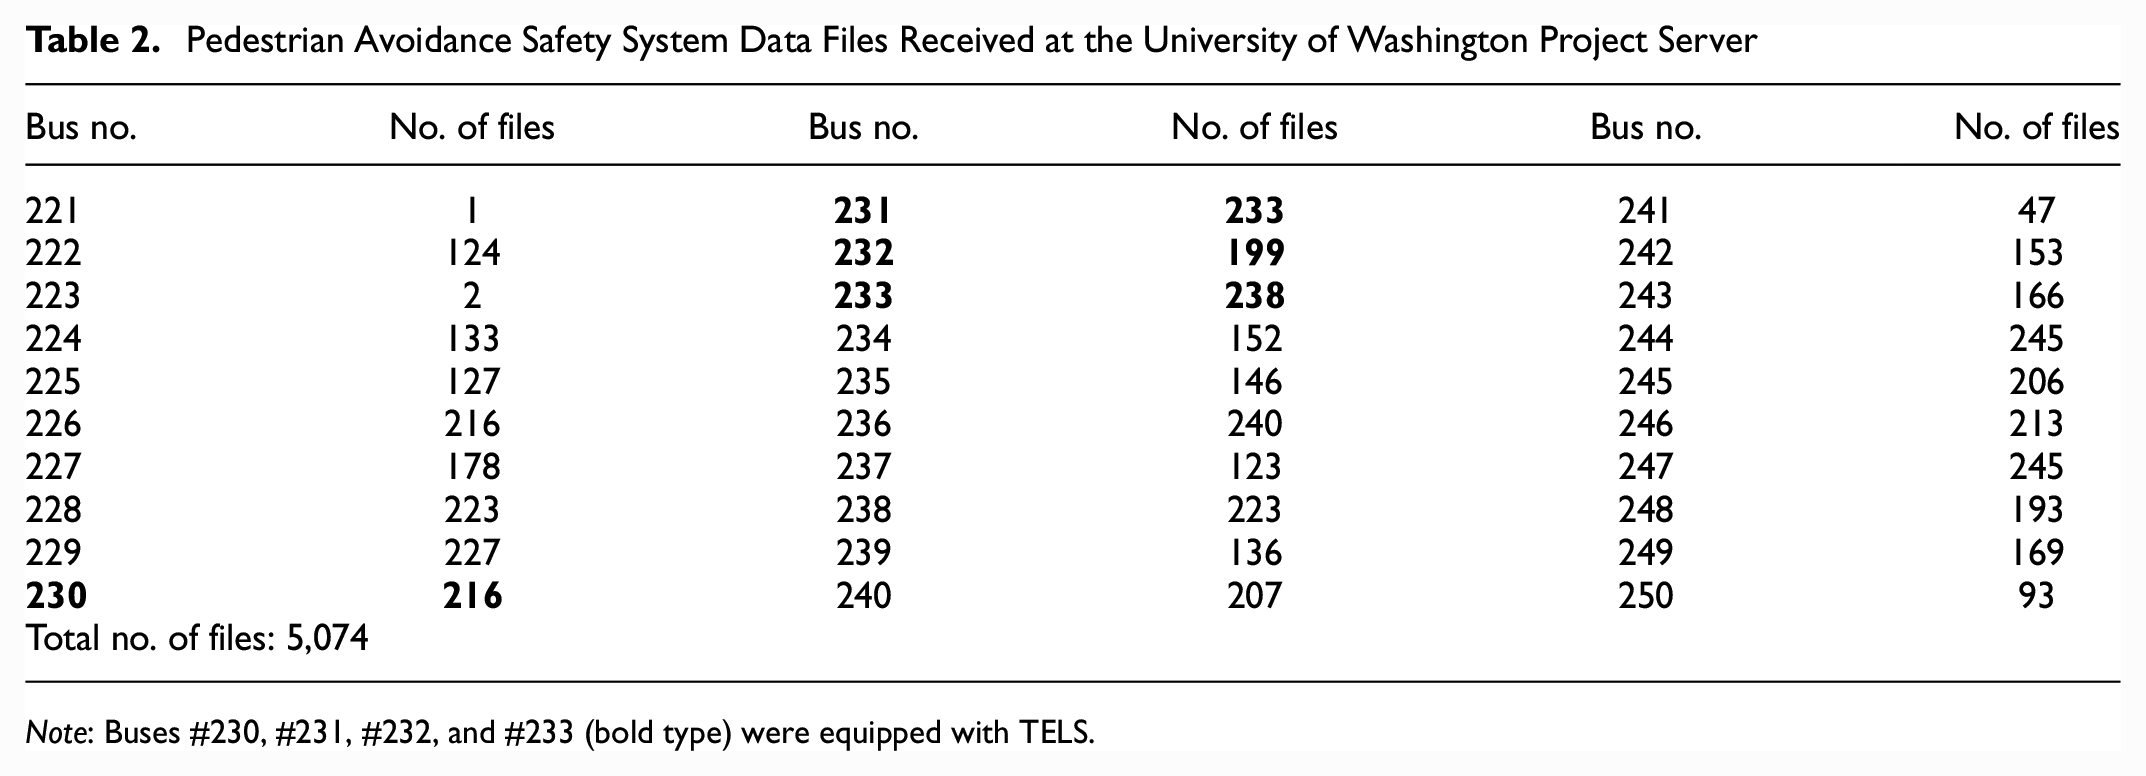
Note: Buses #230, #231, #232, and #233 (bold type) were equipped with TELS.
False Positive (FP) and False Negative (FN) Analysis
FP Identification Method and Summary Statistics
An FP was a PASS-recorded event in which a warning signal was transmitted, but, on later inspection, the associated data did not indicate the presence of a collision path trajectory between the ego vehicle and a detected object. A suspected FP would be initially extracted when a PASS event trigger (PASS message event code “16”) was received by TELS and the vehicle speed was found to be greater than zero. TELS then determined if the tracked object’s trajectory was projected to be within the ego vehicle’s path of travel at event code 16. If TELS showed the object was not within the ego vehicle’s path of travel during the recorded period, TELS would indicate that no conflict actually existed and the event was classified as an FP.
If the ego vehicle speed was greater than zero, its acceleration/deceleration was examined to determine if there were high g moments during the event. If a high g event occurred, one more step in the pipeline was to determine a theoretical deceleration value using distance to the object and relative speed. If TELS estimated that the bus could decelerate at a value below a 0.3 g threshold and still avoid the conflict, hard braking behavior would not have been necessary, and the event was considered as an FP as well. Final verification was conducted using event video clips collected by TELS. The pipeline is shown in Figure 4.
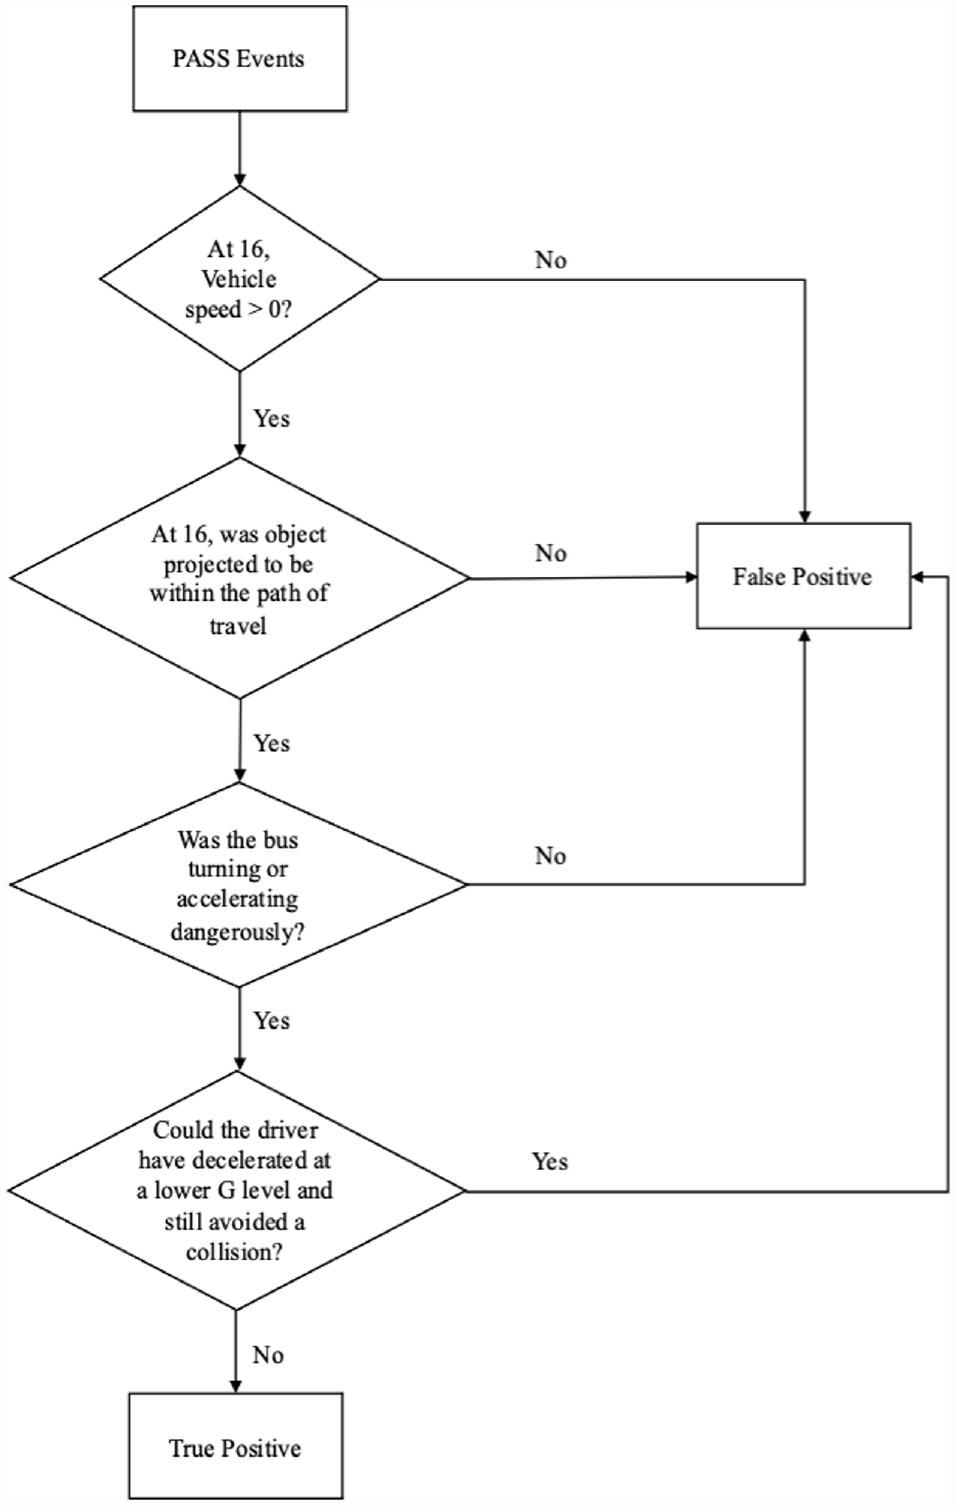
False positive identification pipeline.
Being independent of PASS’s detection logic, the initial FP identification method considered four steps during an event:
Step 1: Is there a pedestrian?
Step 2: Is the pedestrian within the path of travel?
Step 3: Is the TTC smaller than a threshold?
Step 4: Is there a high deceleration?
If yes to all four steps, the event would be validated to be a true positive event; otherwise, it would be an FP. The Step 3 question is asked because TTC is still the most widely used conflict indicator in traffic safety evaluations ( 13 , 14 , 16 , 19 , 36 – 40 ). The pipeline was later updated, as in Figure 4, considering that: 1) the system being evaluated detects general objects rather than pedestrians, 2) the system being evaluated does not use TTC in the algorithm, and 3) it has a high g prediction function.
For each of the four buses equipped with TELS, 3 months of data (May 1 to July 31, 2021) collected after the final project PASS update, was used for evaluation. Nearly 60% of the FP events were attributed to finding no actual high g event, and nearly 40% of FPs were attributed to the object not being on the path of travel of the ego vehicle. A few (less than 3%) FPs were attributed to the potential for the ego vehicle to decelerate at a rate below 0.3 g. In nearly 60% of the FP events, objects were detected as having potential conflicts with the ego vehicle, although, in some cases, the objects did not pose a risk to the bus. (e.g., snow on the bike rack). None of the PASS or TELS incidents logged was associated with an actual vehicular or pedestrian collision.
FP Examples
Several representative examples of FPs are presented, showing typical patterns of FPs.
Example 1
This event occurred at 16:39:43 on May 11, 2021, on bus 231. An object on the right of the bus triggered the PASS system but was not on the path of travel, thereby being classified as an FP, as shown in Figure 5. It was suspected that the orange sign triggered the detection. However, after review of the detailed PASS data, it was found to be some object about 30 ft beyond the sign.
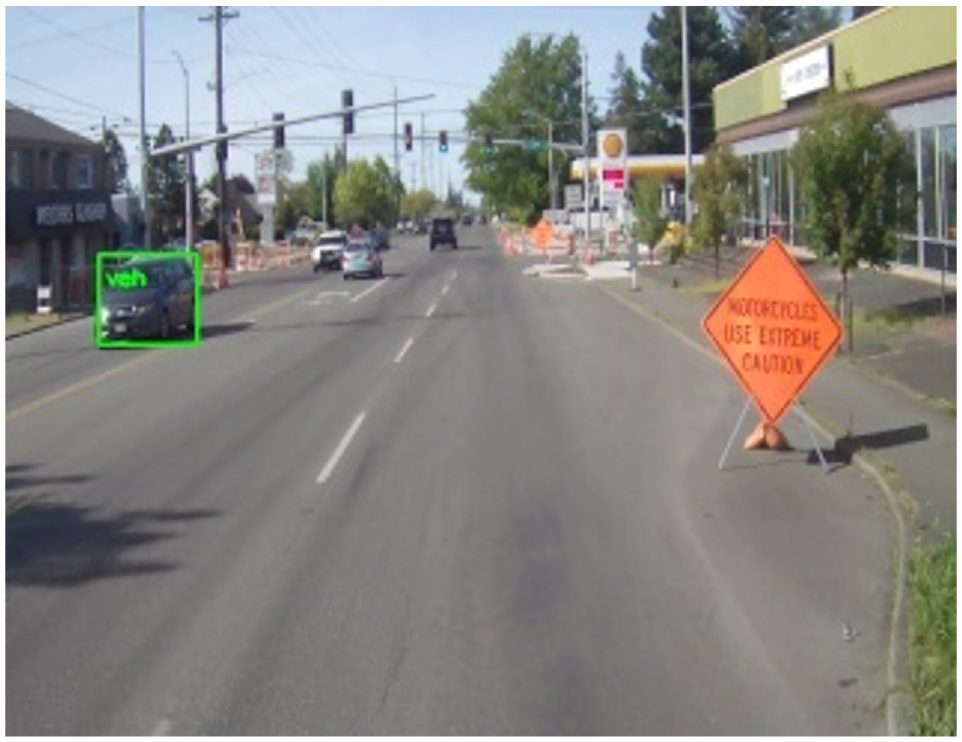
False positive example 1: not on the path of travel.
Example 2
This event occurred at 15:25:07 on May 7, 2021, on bus 230, as shown in Figure 6. PASS recognized and was triggered by the silver car in front of the bus, verified by both TELS event data and manual checking of the video. In addition, the acceleration values indicated there was a dangerous situation. During the event window, the highest deceleration value was 0.368 g. However, calculations showed that the driver could have decelerated at a g level below 0.3 g to avoid a possible collision, causing this event to be classified as an FP.
False positive example 2: driver could have decelerated at a lower g level.
Example 3
The PASS event shown in Figure 7 was a forward collision warning at 16:37:57 on May 7, 2021, on bus 230. PASS was triggered by the red pickup truck in front of the bus. Acceleration values indicated there was not a dangerous situation. The highest deceleration value was 0.185 g (below the 0.3 g threshold) during the event window so it was classified as an FP.
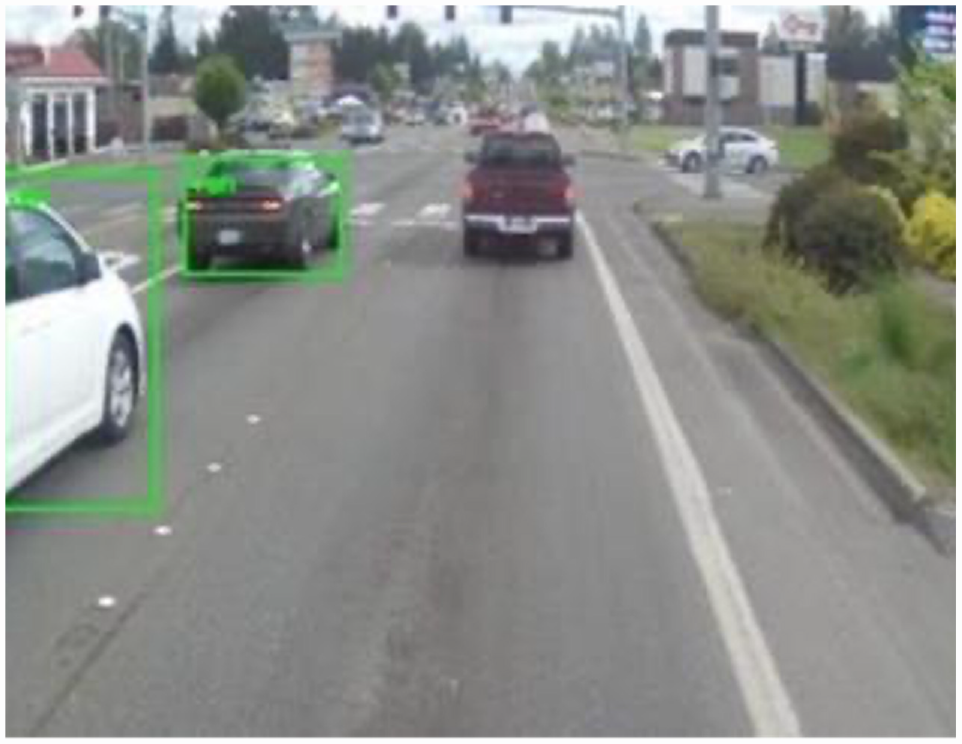
False positive example 3: deceleration rate below the threshold.
Example 4
This example occurred on a snowy day at 09:53:49 on February 13, 2021, on bus 232, as shown in Figure 8. The bus was starting off at an intersection and turning left. PASS triggered a warning, and, after verification with the video and detailed PASS data, no road users or objects were observed. The brake switch was off, and the throttle was on. Detailed data indicated that the trajectory of the tracked object was abnormal, and the “object” stayed very close to the bus (within 120 cm) during the event. No object of conflict was observed in the entire video clip. The object’s relative position to the bus was [–20 cm, 40 cm] and the time-to-collision (TTC) was less than 1 s. We did not observe this pattern of FP on non-snowy days. A possible cause of this FP was that the LiDAR was tricked by snow in front of the sensor (e.g., snow on the bike rack).
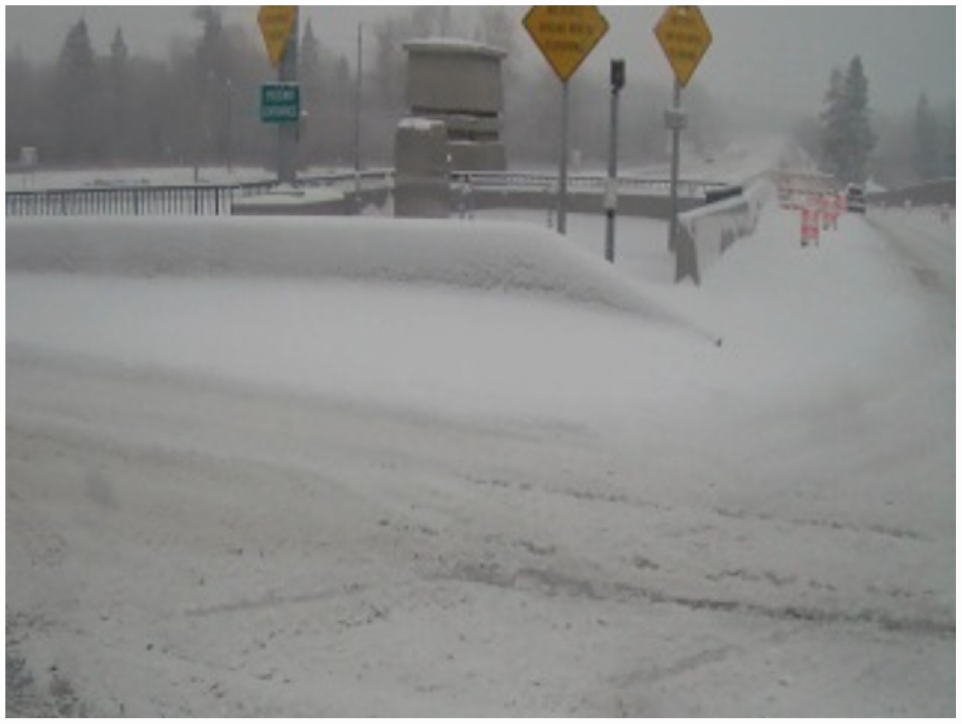
False positive (FP) example 4: a unique FP on a snowy day.
Example 5
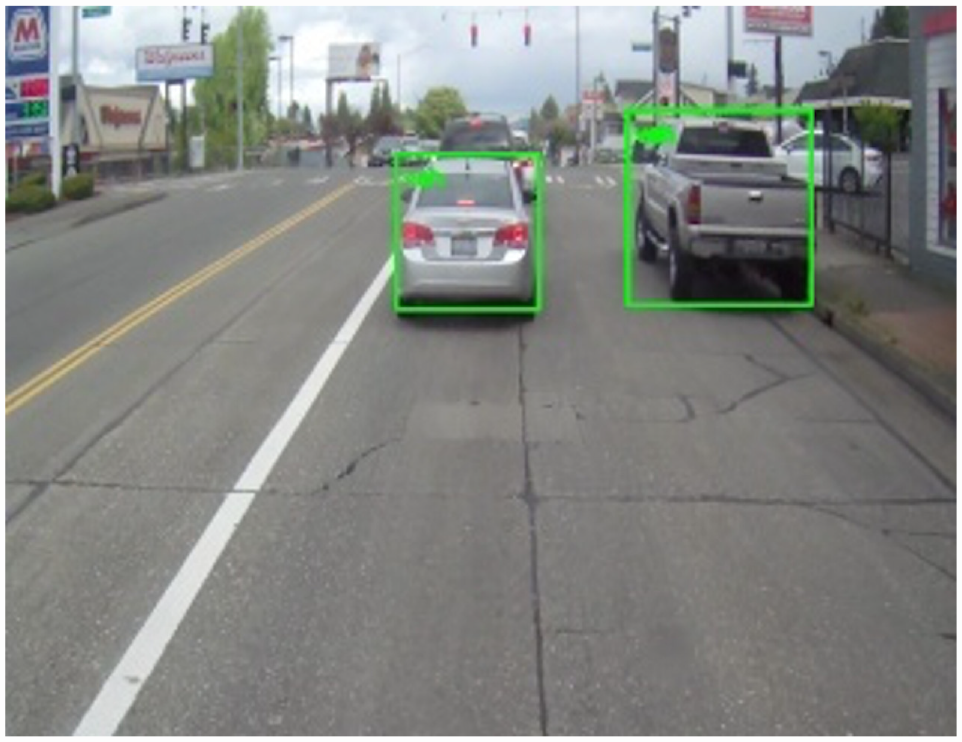
Another pattern of FPs was found in the evaluation: PASS was sensitive to traffic drums and traffic cones. Figure 9 shows two examples of this FP pattern. The cause was that traffic drums/cones had reflective surfaces, so could trick a system solely based on LiDAR.
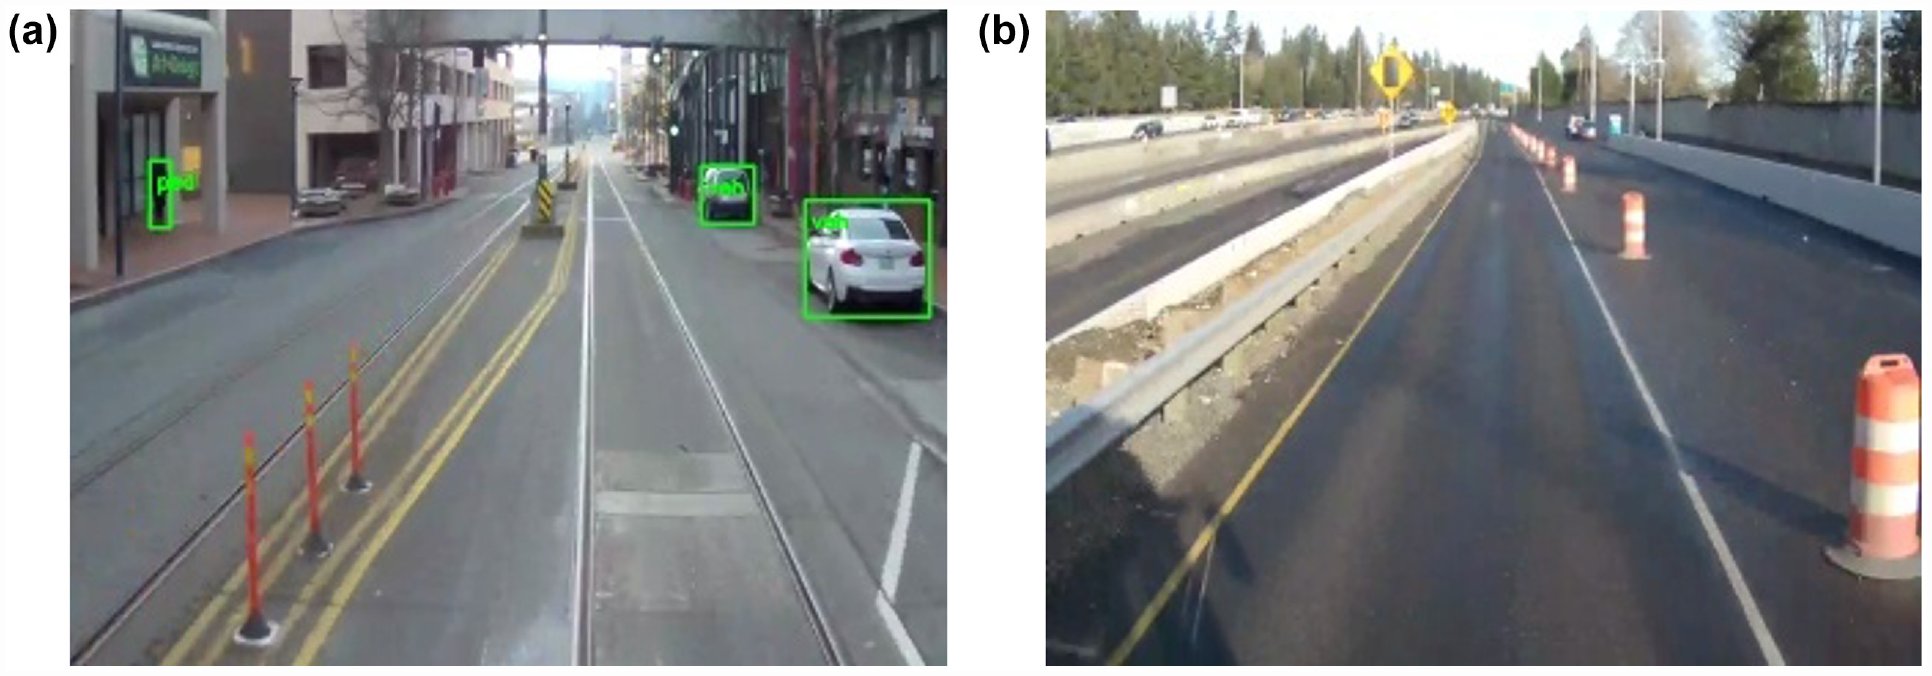
Example false positives triggered by traffic delineators (a) or drums (b).
FN Identification Method and Summary Statistics
An FN is an event that does not trigger a PASS signal when: 1) an object is within the path of travel, and a high g moment is observed, or 2) an object requires the driver to apply a dangerous deceleration.The total number of events includes PASS events, TELS events, and randomly sampled events. Note that the random events were qualitatively evaluated using the TELS videos. The FN detection pipeline is shown in Figure 10. The pipeline starts with searching for event codes (241 for pedestrian conflict and 242 for vehicle conflict), which are events generated by TELS. These events are filtered using TTC and horizontal motion as threshold criteria. Tracked trajectories of objects were then used to determine if the object was projected to be within the vehicle’s path for every data point within that event window. High g events were identified using g values in the X and Y directions. A high g event was identified when vector addition of the two g values appeared to exceed the 0.3 g threshold. Tracked trajectories of objects are then used to determine if the object is projected to be within the vehicle’s path at 85 cm for any data point within that event window (85 cm is the length of the bike rack).
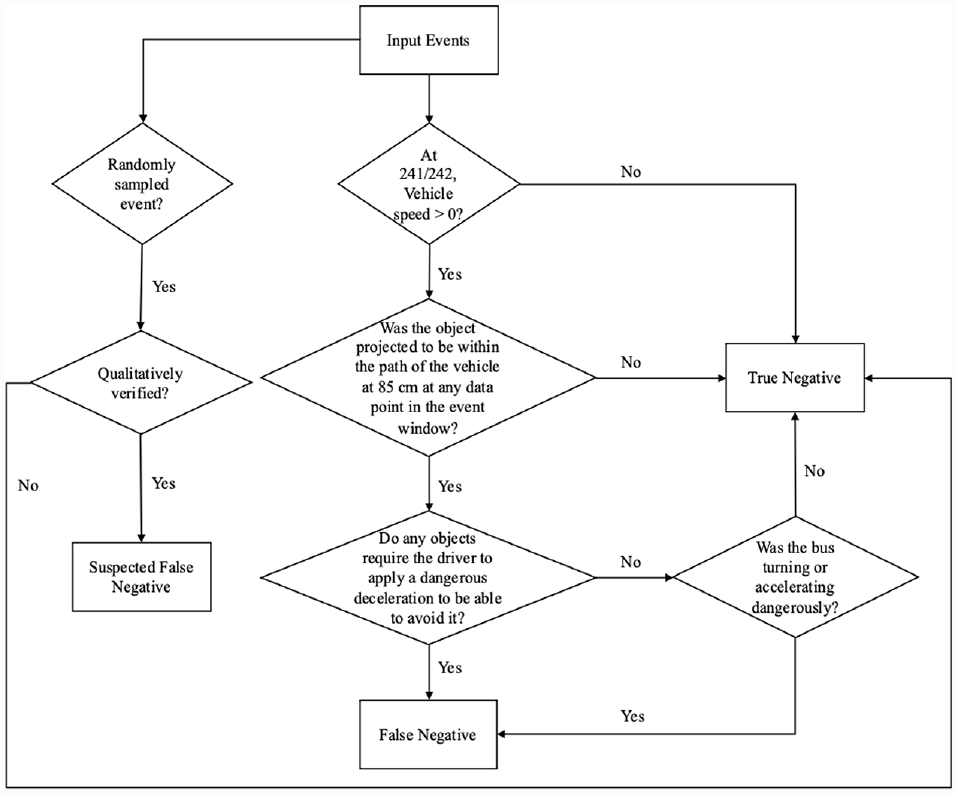
False negative identification pipeline.
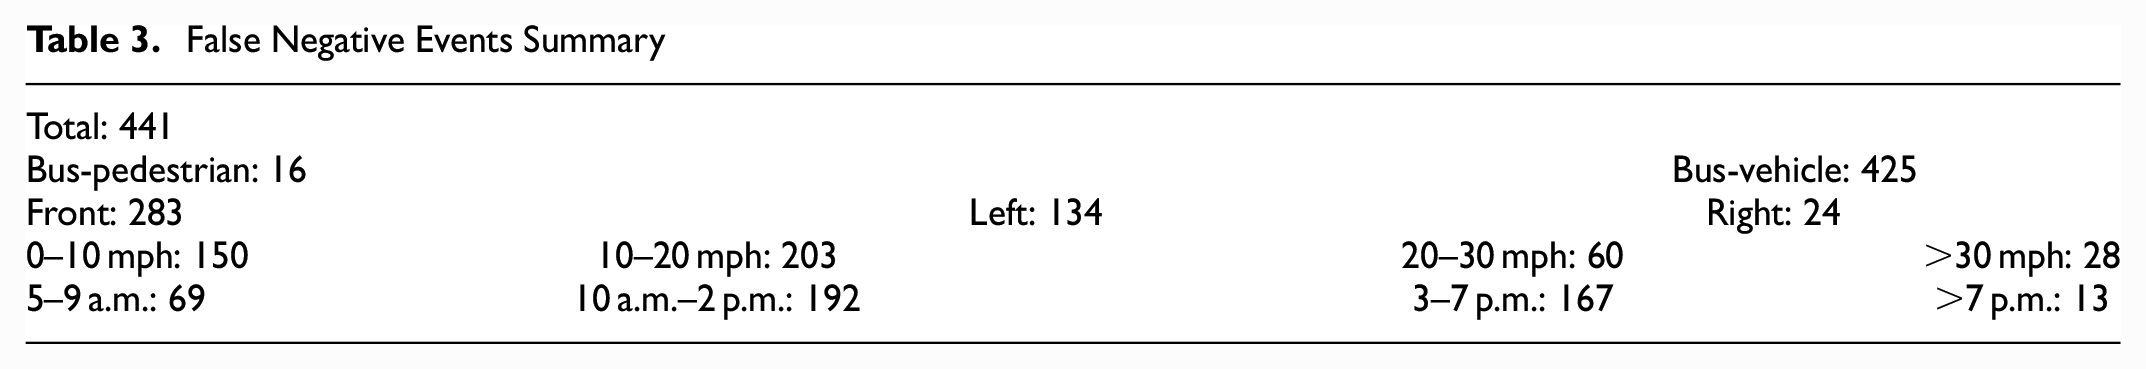
Of the 441 FNs, 16 were pedestrian-related events, and 425 were vehicle-related events. These events were classified according to which of the three PASS sensors triggered the event. The centerPASS sensor triggered 283 signals, the left sensor triggered 134, and the right sensor triggered 24 signals. A total of 150 FNs were recorded when bus speed was low (0–10 mph), nearly half of the events (203) occurred between 10 mph and 20 mph, 60 occurred between 20 and 30 mph, and 28 occurred over 30 mph. A total of 69 FN events occurred in the morning between 5 and 9 a.m., 192 were between 10 a.m. and 2 p.m., 167 were between 3 and 7 p.m., and only 13 occurred in the evening after 7 p.m. The summary is shown in Table 3.
False Negative Events Summary
FN Examples
Several representative examples of FNs are presented. Detailed parameters, such as bus speed, TTC, and deceleration are available for each event. Given the space constraint, one video frame and one type of parameter are displayed for one event.
Example 1
This event occurred on bus 233 at 10:09:04 on May 31, 2021. The bus was approaching an intersection when a pedestrian was crossing the street. The relative movement between the pedestrian and the bus posed a conflict with the path of the bus, and the maximum deceleration rate of the bus was over 0.3 g during the event window. The TTC value was about 2 s. PASS did track this pedestrian but did not issue a warning (see Figure 11).
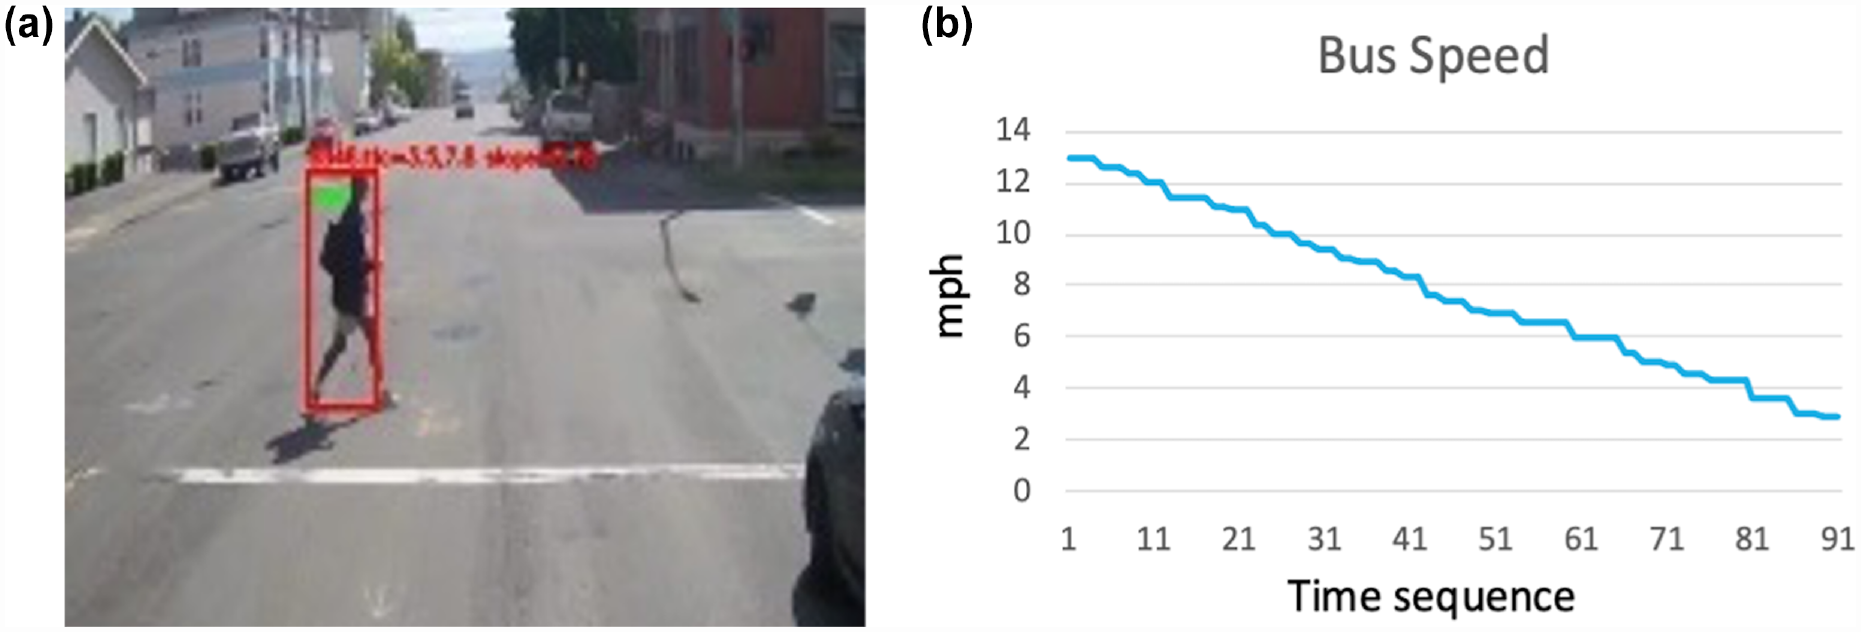
False negative example 1: missed conflict event with a pedestrian crossing the street: (a) the pedestrian missed by the PASS system and (b) the bus speed during this event.
Example 2
This event, shown in Figure 12, occurred when bus 230 was approaching a bus stop at 08:02:30 on May 1, 2021. A person was waiting at the sidewalk. PASS did not generate a warning. The trajectory showed that there was a conflict between the pedestrian and the front face of the bus. The bus was decelerating over 0.3 g within the event window and could not decelerate at a lower g to avoid collision. The TTC also kept decreasing and reached 1.4 s. At the conflict data point, the path of the bus would bring it over the curb. According to the proposed pipeline, this event was classified as an FN.
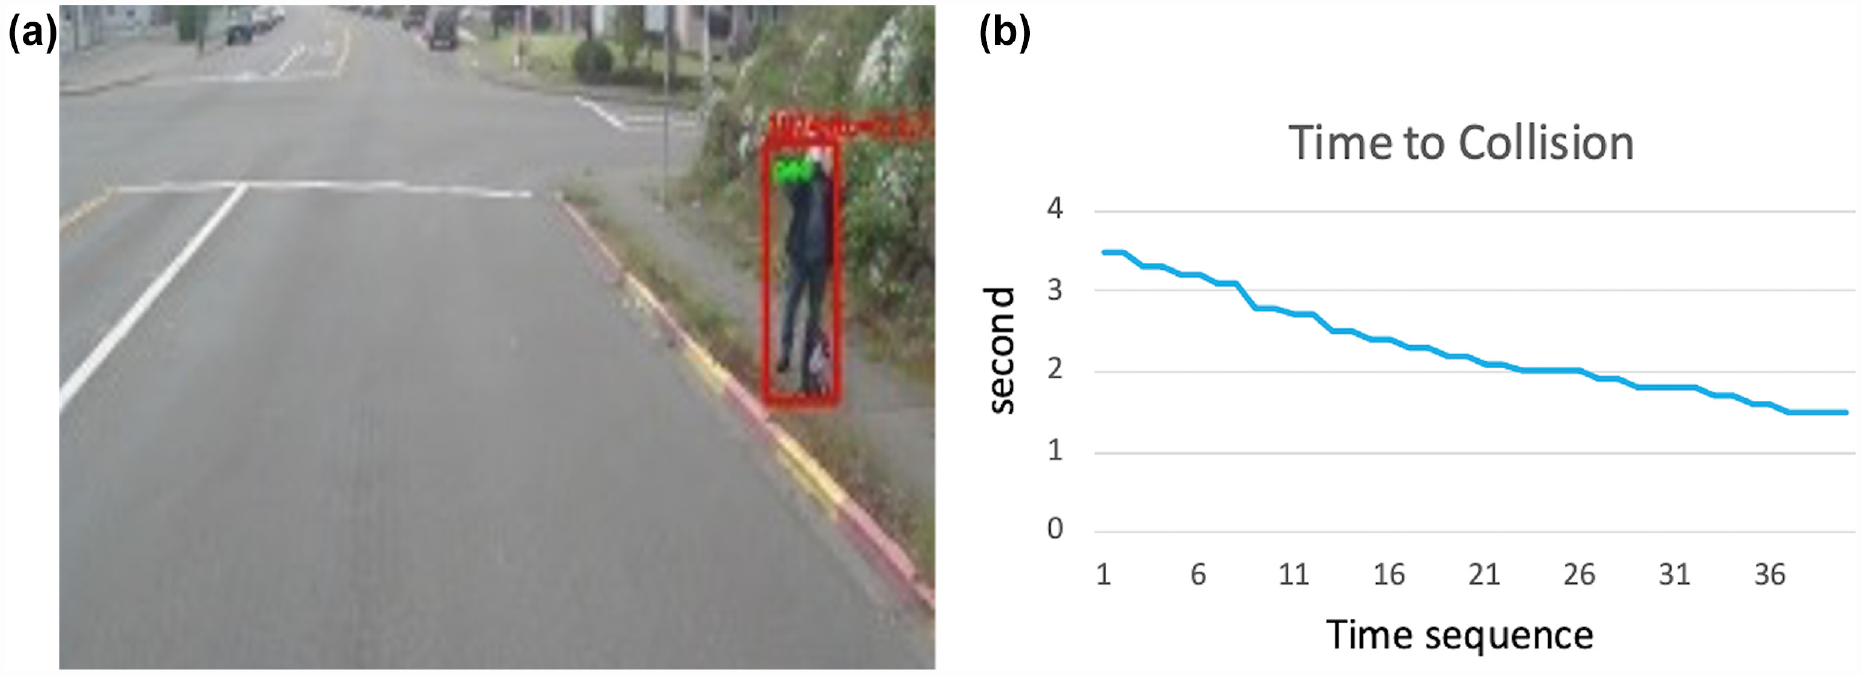
False negative example 2: missed conflict event with a pedestrian at a bus stop: (a) a video frame showing the moment of conflict and (b) the Time to Collision (TTC) data plot within the time window of this event.
Example 3
This representative FN event (see Figure 13) occurred at 06:02:31 on July 28, 2021, on bus 230. The deceleration rate in this event was constantly greater than 0.3 g the entire time, which indicated very hard braking. The TTC was 1.8 s, and the vehicle had a conflict with the path of the bus. In the detailed data file, we found only five discrete rows that corresponded to this vehicle based on the relative location. A well-tracked object would be represented by continuous rows in the data file. Since the vehicle was not well tracked, PASS failed to trigger a warning.
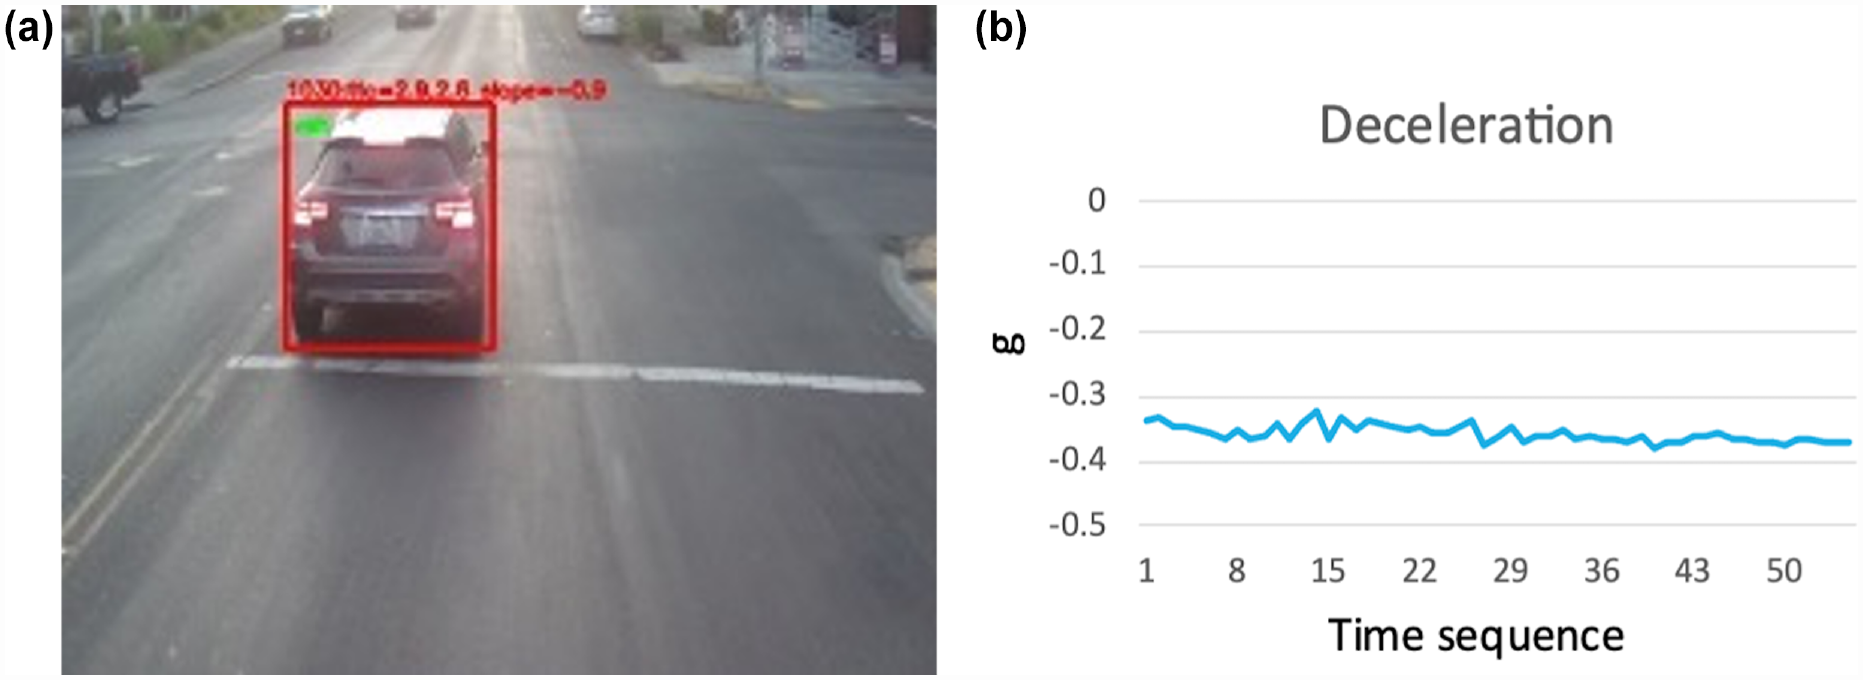
False negative example 3: missed conflict event with a vehicle at an intersection (a) and the vehicle's deceleration during this event (b).
Hotspot Analysis
Hotspot identification and analysis are facilitated by TELS through the collection of near-crash data. This paper presents some preliminary findings from the data to demonstrate their potential value for various aspects of transit safety and operations. Figure 14 displays the overall distributions of the near-crash data, categorized into bus-pedestrian events and bus-vehicle events, on test buses 230–233 in Pierce County, WA, along their respective operation routes.
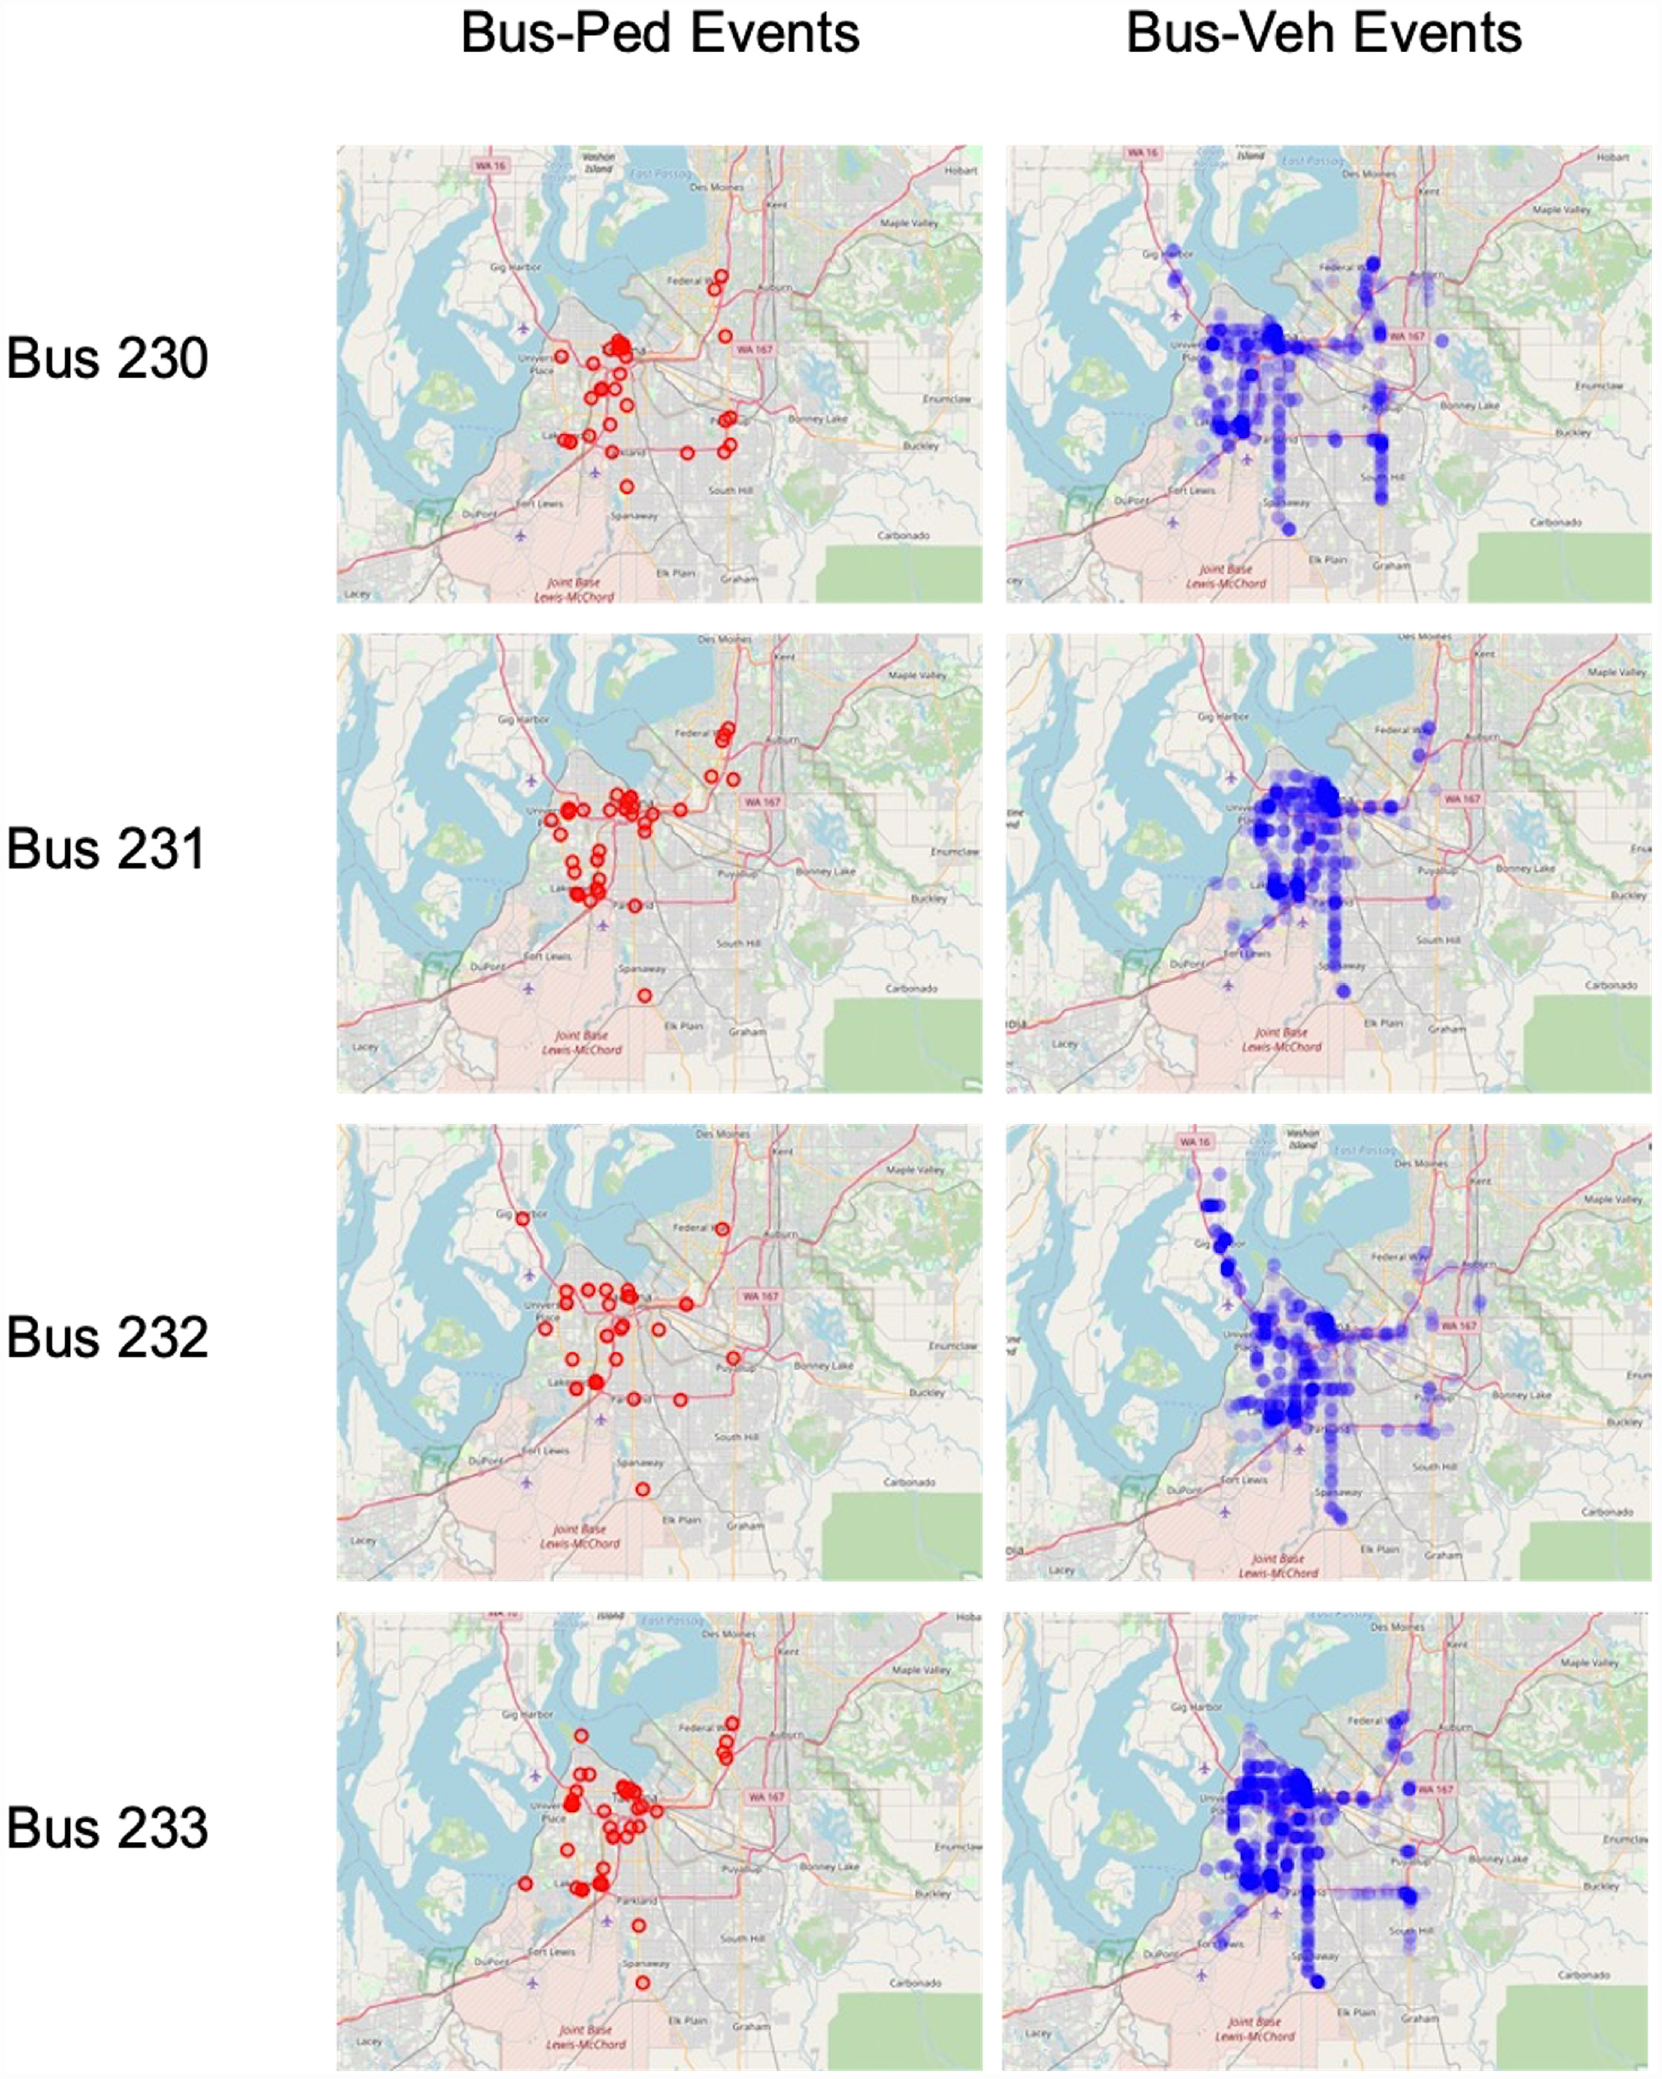
Transit event logging system hotspots in May 2021.
Closer examination of the hotspots reveals that they are clustered around points of interest in the region. Here, we present three typical hotspot cases, which can be used by transit supervisors and safety personnel to identify risky locations and ask relevant questions. It is recommended to validate these hotspots by asking drivers about their experience in those locations and perhaps collecting more data through observation or video collection on the ground. The three cases are depicted in Figures 15 to 17.
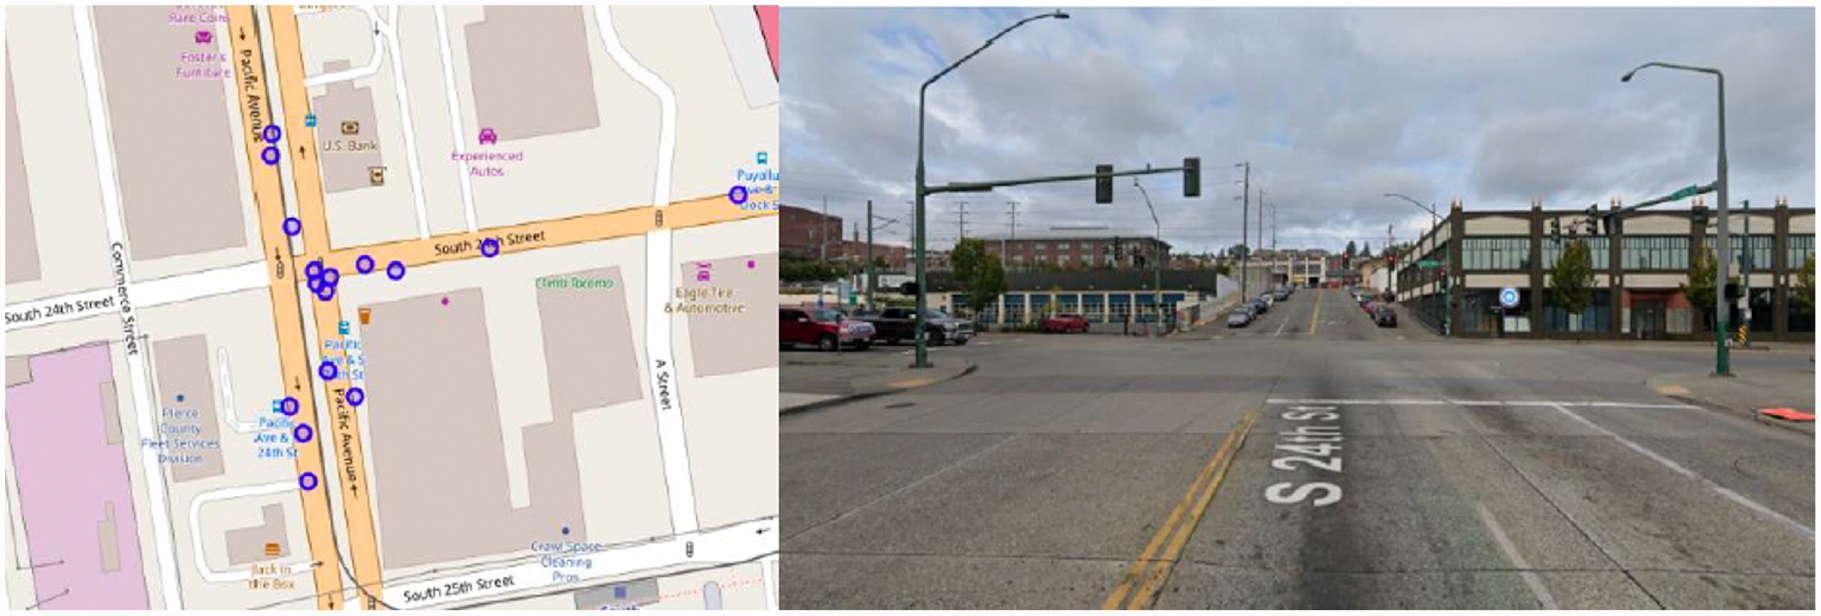
Case 1: Bus-vehicle events, near Pacific Ave and South 24th St, including both enlarged view and Google Street View. (South 24th St, westbound).
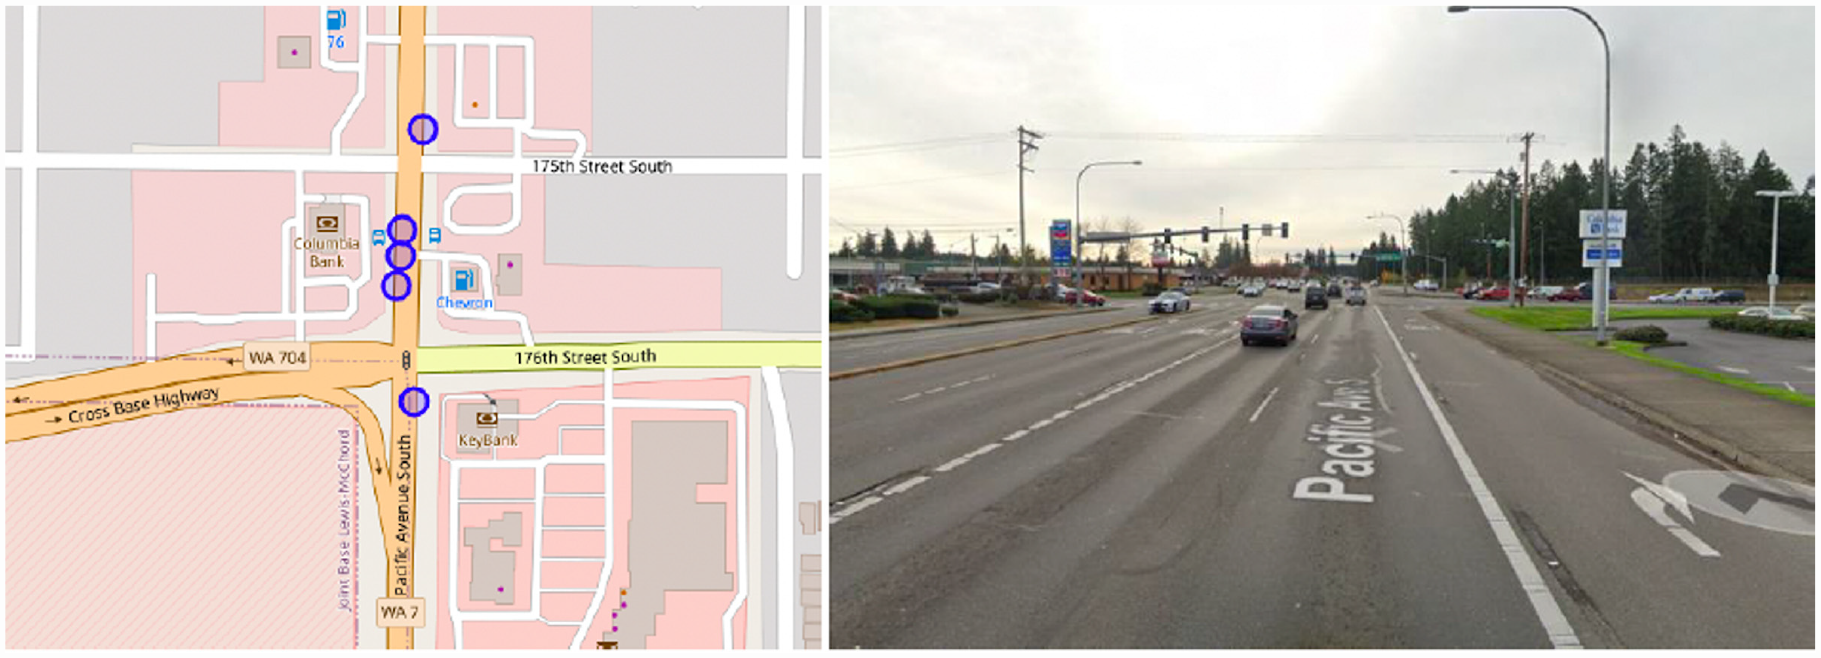
Case 2: Bus-vehicle events, near Pacific Ave S and 176th St S, including both enlarged view and Google Street View. (Pacific Ave South, southbound).
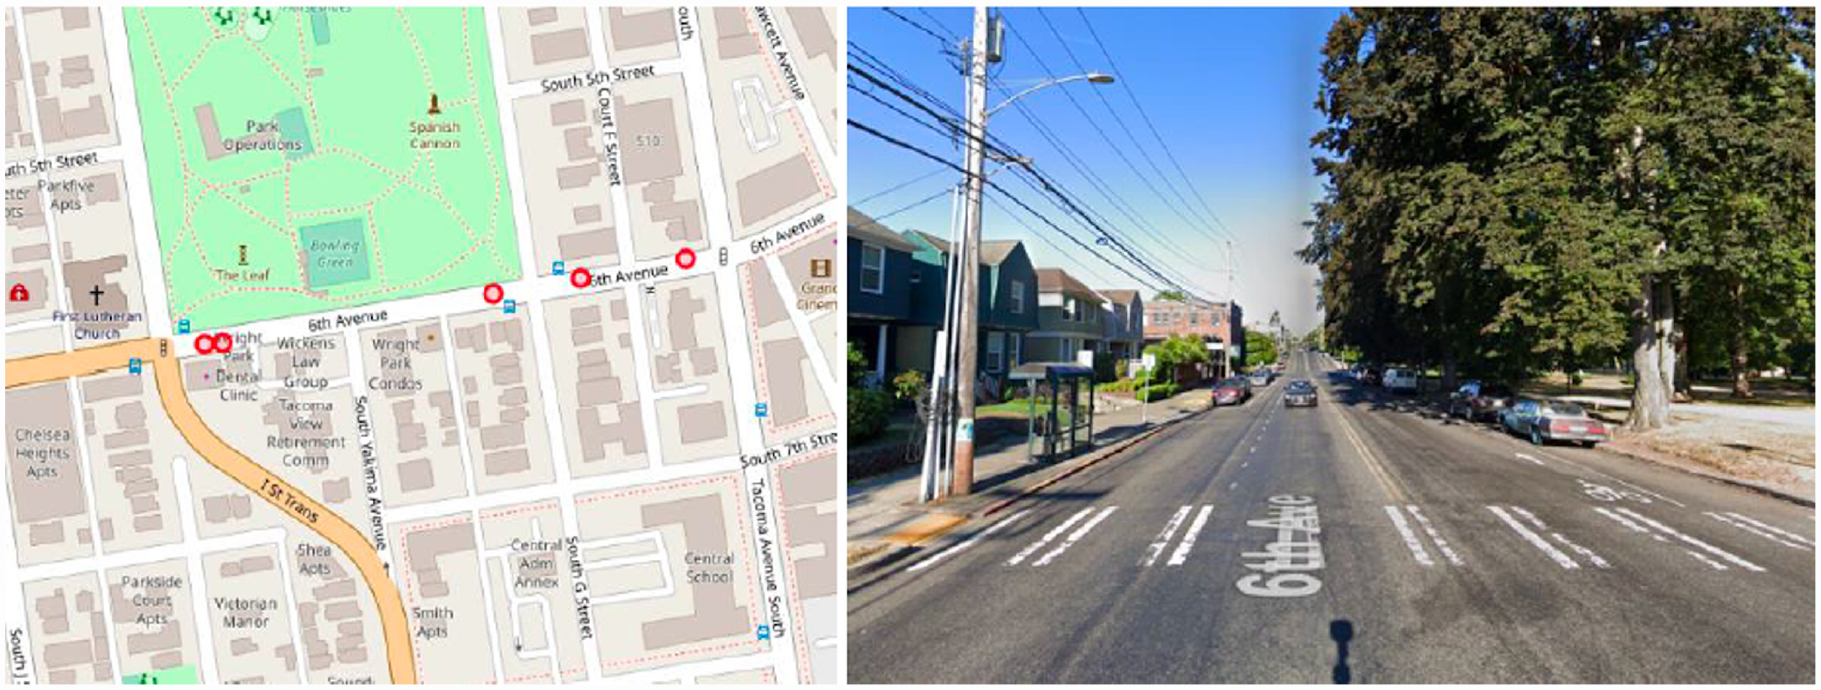
Case 3: Bus-pedestrian events, along 6th Ave, near Wright Park—there are relatively more frequent pedestrian warnings. (6th Ave, westbound).
In Case 1 (Figure 15), the cluster of events is likely because of conflicts between left-turning buses and other vehicles at the intersection. Each four-leg intersection has 32 conflict points, and these events could belong to one or more of them. If any events do not belong to any conflict points, it would be worth investigating the underlying causes.
In Case 2 (Figure 16), it appears that the three-cluster events are located next to a bus stop on the right-turn lane. The conflicts could arise from buses and right-turn vehicles sharing the same lane. As this is near an intersection, it is expected that right-turn vehicles decelerate or make a lane change, while the bus slows down to stop at the bus stop. These behaviors and the shared lane could lead to conflicts—awareness of this could help improve future roadway or bus stop design.
In Case 3 (Figure 17), we can that there are dense trees as well as a line of parked cars along this street. The trees and street parking could obstruct the drivers’ view, and given that this street (6th Ave) is adjacent to a park (Wright Park), there is likely to be a relatively high volume of pedestrians. The combination of dense obstructions (trees/street parking) and a high volume of pedestrians could make this one of the locations with the highest number of bus-pedestrian events.
Conclusion
This study has made significant contributions to transit safety and operations through the adoption of an edge computing system that performs event-based data logging for transit vehicles. This system addresses a major gap in current practice by balancing data communication, storage, and computation resources efficiently. To support this system, a dedicated database was developed to store event meta-information, including forward-facing video clips, vehicle telematics status, and operational general transit feed specification (GTFS) data in an efficient manner. Through the prototype installed on four buses in Pierce County, WA, this study collected near-crash events for 11 months and evaluated the FP and FN results of a commercial collision avoidance system for transit operations. Detailed analyses of the failure cases reveal typical and edge conditions where the commercial system tends to fail. The value of this data was demonstrated in identifying high-risk regions of transit operation, such as an intersection, a roadway with a bus stop, and a street next to a park. The evaluation processes and methods enabled by the edge data logging platform can be important materials for transit agencies and operators to iterate and improve services. These experiments demonstrate the promising performance of the system’s efficiency, reliability, and transferability, as well as its applicability to addressing various transit operational questions.
Footnotes
Acknowledgements
The authors would like to thank the Federal Transit Administration (FTA) and the Pacific Northwest Transportation Consortium (PacTrans) for funding this research. They express gratitude to their research partners (Pierce Transit, WSTIP, DCS Technology Inc., VTTI, Volpe Lab, CUTR, Veritas) in the FTA project team for their invaluable contributions.
Author Contributions
The authors confirm contribution to the paper as follows: study conception and design: Y. Wang, J. Lutin, R. Ke; data collection: R. Ke, Z. Cui, S. Yin, Y. Zhuang; analysis and interpretation of results: J. Lutin, R. Ke, S. Yin; draft manuscript preparation: Y. Wang, J. Lutin, R. Ke, S. Yin. All authors reviewed the results and approved the final version of the manuscript.
Declaration of Conflicting Interests
The author(s) declared no potential conflicts of interest with respect to the research, authorship, and/or publication of this article.
Funding
The author(s) disclosed receipt of the following financial support for the research, authorship, and/or publication of this article: Federal Transit Administration (FTA) Safety Research and Demonstration Program. Pacific Northwest Transportation Consortium (PacTrans), USDOT Region 10 University Transportation Center.
Data Accessibility Statement
Data is available on request