
Abstract
Volunteer driver programs (VDPs) utilize the service of volunteers to replicate car-based, demand-responsive, door-to-door services in rural areas, but little is understood about how external factors (e.g., changes in service area) affect VDP sustainability. Agent-based modelling (ABM) simulates the operational behavior of individual agents (e.g., drivers, users) to evaluate their interaction under specified scenarios, and although it has been used in transportation research, it has never been applied to VDP analysis. Netlogo was used to develop a simplified VDP ABM, calibrated and validated with 1 year of program data from the New Brunswick Volunteer Driving Database. Three model scenarios were tested: increased health trip distance, increased service area, and increasing the number of drivers to meet initial distance targets. The ABM demonstrated intuitive results and established connections among changing operational scenarios, though additional research is needed for multipurpose trips and user/driver/dispatcher interactions.
This research explored the use of an agent-based modelling (ABM) technique to quantify and forecast the use of rural car-based volunteer driver programs (VDPs) by nondrivers, primarily older adults (aged 65 years and older) based on data from VDPs in New Brunswick, a province of approximately 780,000 people (10.6 persons/km2) on the east coast of Canada ( 1 ). ABM is a technique that utilizes software programming to create a simplified purposeful representation of a real-world system. It has previously been used in transportation engineering for modelling pedestrian movements and for freight and logistics operations.
The transportation challenges faced by rural communities are a factor of both their location and their demographics. Rural communities are located farther away from essential services and places of commerce, have a lower population density than urban areas ( 2 ), and a high degree of automobile dependence. In Canada, census data have shown that the populations of rural communities are “aging” faster than that of their urban counterparts ( 3 ), which is often a function of youth outmigration. This has implications for the remaining automobile-dependent older population if experiencing the health effects of aging that make driving difficult or impossible over time, as there may be fewer people to assist nondrivers. VDPs have the potential to be a systematic solution to complement other rural transportation offerings, but it is unclear what the operational limits of the programs are. It is possible that over time, the service demands placed on VDPs (whether driver time commitments, increases in travel distance, or service area) may go beyond what the VDP model can provide with volunteers. ABM offers the potential to explore these operational limits and has not been applied to VDP before.
Background
A 2018 report by the National Aging and Disability Transportation Center indicates that 8% of older adults and 27% of persons with disabilities reported using a VDP. However, only 43% and 44% of the same demographics (respectively) would utilize the service if it were available in their communities ( 4 ). The growth in community-led mobility programs to address underserved populations is contributing to reducing the gap between supply and demand for volunteer transportation, but VDPs are not yet ubiquitous, nor has it been proven that they are sustainable solutions for all rural transportation issues. Research into this concept is not new; Smith, for example, presented operational service measures for two VDPs in a comparative analysis in 1979 and made recommendations for use cases, such as medical trips (which can often form the bulk of trip types for a VDP) ( 5 ). Smith also argued that “Volunteer driver systems should not be expected to provide for all of the public transportation needs in rural areas.” The challenge is that, even after 42 years, there has been little advancement in relation to planning and forecasting for VDP use and it therefore remains a research need of TRB’s Accessible Transportation and Mobility Committee (AME50) ( 6 ).
Often, new VDPs use a case-study or best practice approach in their initial development, but this cannot be done without understanding the external factors (if any) that contribute to that success in a particular location ( 7 ). Although adopting best practices can be effective, factors such as demographics, the supply of volunteers, demand for services, and the potential for success are unique to a location and may be the defining variable between success and failure. Recent research efforts in this area have focused on operational metrics ( 7 ), organizational success factors ( 7 ), and the role of the driver beyond the driving task ( 8 , 9 ) to get a better understanding of the underpinnings of operation to facilitate more widespread adoption of the model. Sherman explored a scoring system approach to compare demographic metrics associated with VDP use and delivery with census attributes to determine the capacity and need of communities for VDPs in Georgia ( 10 ). In the absence of transportation planning data on stated and revealed preferences for how users incorporate VDP operations into their daily travel, this type of approach (using census attributes as a proxy) is useful to determine the conditions for which VDPs may be successful on a transportation sketch planning basis. The limitation of this approach for operational planning is that there is no connection between demographic, geographic, and VDP operational attributes that would permit a detailed estimation of the user need and volunteer supply in light of serving differing trip type needs over geographic areas of varying sizes. It would be possible to use three or four-step travel demand modelling to estimate travel demand based on per person trip estimates, but this would not permit an understanding of the capacity of a program to meet these demands in practice.
The Potential of Agent-Based Modelling for Modelling VDP Operations
Agent-based models (ABMs) describe agents as unique and autonomous entities that usually interact with each other and their environment locally. Agents may be organisms, persons, businesses, institutions, or any other entity that pursues a certain goal ( 11 ). The uniqueness of agents speaks to their differing size, location, and resources, and their autonomous nature means they work to achieve their own personal goals or objectives. This occurs in a geographically framed space or network, with the presence of other agents or neighbors. Agents in a model adapt their behavior to current states of being, other agents, and to the environment. Techniques such as ABM deal with an important characteristic of system dynamics: emergence. Emergence concerns the behaviors that arise as system components or agents interact, contributing to a better understanding of how the individual members of a system who interact may affect a common goal of a group or organization ( 11 ).
ABMs are still relatively novel. They have not garnered widespread adoption compared with traditional demand estimation techniques, owing to their complex intricate programming needs. However, a few researchers have utilized them to study transportation problems in the realms of cycling, pedestrian movement, freight, urban demand models, introduction of innovative mobility options and business models, and decision support tools for demand-based transportation ( 12 – 18 ). There have been rural applications of ABM as well, including investigating how rural merchants select delivery options based on price, delivery time, and their trust of the driver ( 19 ); and investigating the operative parallels between demand-responsive transportation and conventional public transit ( 20 ). The connection between an operating environment, rules for that operating environment and the interaction of agents in that environment suggested that ABM could be a useful way to analyze VDP operations and help explore such concepts as the connection between service area, volunteer supply and user demand and impact on operations.
Research Goal and Objectives
The goal of this research was to explore the potential of ABM for car-based volunteer transportation program planning. The objectives were to:
Identify suitable behavioral models or data inputs necessary to characterize the interaction of agents (such as drivers, service users, and dispatchers) expected from a car-based, centrally dispatched, rural VDP;
Create a rules-based system developed from behavioral models and VDP operational descriptions to describe the use and operation of a VDP in relation to an ABM framework;
Develop, apply, and validate an ABM of a VDP in New Brunswick;
Apply population growth and dispatch scenarios with the ABM to evaluate the operational limits of the rural VDP model; and
Assess the potential of the ABM approach for rural transportation planning.
Methods
This research was carried out using secondary data from the New Brunswick Volunteer Driving Database based on service operation between the period February 1, 2017 to January 31, 2018, and are the same data profiled in Hanson and Goudreau ( 7 ). Because of the COVID-19 pandemic it was not possible to collect primary data from VDP operators. The ABM was developed within the constraints of the free open-source Netlogo software package and was created based on the operations of combined small and medium VDPs (fewer than 100 riders, n = 4) from the database, which were summarized in Hanson and Goudreau ( 7 ). The developed ABM would be done within the context of a nongeographically synchronized environment, that is, no geographic information system data were used in this implementation. The applications and insights gained from the model were limited to what was observed as a direct outcome of changing model variables. All recommendations for the potential of the ABM approach were made within the context of what would be possible within the Netlogo environment and would ignore implementations using other software packages.
Guiding Protocols for Developing the ABM
Creating an ABM (or model in general) requires following a framework or protocol. Railsback and Grimm outline a six-step cycle in the development of models that are considered iterative, which may see a developer going back and forth in small loops ( 11 ). The steps are as follows:
Formulating the question;
Assembling hypotheses for essential processes and structures;
Choosing scales, entities, state variables, processes and parameters;
Implementing the model;
Analyzing, testing, and revising the model; and
Communicating the model.
The overview, design and detail (ODD) protocol was used to develop an ABM for exploring rural VDP demand. This procedure standardizes the ABM process and allows for the creation of factual model descriptions that are complete, quick, and easy to grasp. This protocol has been used in over 1,500 published model descriptions ( 11 ). The ODD protocol has seven steps:
Purpose and patterns;
Entities, state variables, and scales;
Process overview and scheduling;
Design concepts;
Initialization;
Input data; and
Submodels.
The modelling cycle was used to organize the approach to modelling development, whereas the ODD protocol was used to organize the VDP-specific attributes. The model is described here in relation to the step ODD protocol ( 11 ), whereas the modelling cycle was followed through the development process and is presented at the end of this section.
Purpose and Patterns, Entities, State Variables, and Scales
Entities is a collective term given to the elements represented in the model and the variables and attributes used to describe them. An entity can be a turtle, patch, or just the global environment. These entities are then characterized by assigned state variables that dictate properties such as their shape, color, or behavioral attributes such as their searching behavior. State variables can remain constant throughout a simulation or be changed by a process and updated. Lastly a model’s temporal and spatial scales refer to how time and geographic space is represented. Temporal scales relate to how long a simulation runs and the time steps within which it advances. A model could illustrate a month of driving activity and advance in time steps of 1 h, 1 day or 1 week if need be. However, it is not limited to this and can represent virtually any time frame for which it is programmed. Spatially, the extent of a model refers to the geographic size that is being described. This is represented by the grid cells or patches in the Netlogo integrated development environment (IDE). The spatial resolution or the size that each grid cell represents can be set at the beginning of a model when the space to be represented is determined.
The purpose of this ABM was to replicate the functional aspects of a rural New Brunswick VDP. There were three possible “agents”: the program users, the drivers, and the dispatcher. The simplest approach in this case was to represent the VDP with drivers as agents as they had a set budget of hours, distances driven, and could be assigned trip purposes.
Netlogo was chosen as the software given that it is an open-source IDE that can be used to simulate real scenarios using a graphical interface. It specializes specifically in allowing a user to develop ABMs. The program typically sees four types of agents: mobile agents, patches, links, and the observer. Mobile agents, arbitrarily called turtles, are the agents that move around in the world, whose image or shape is customizable. Patches represent the two-dimensional square space within which the turtles move. Links connect two turtles and provide a way to represent relationships among them such as through a network. The observer represents the overall controller of the model with all the displays and toggles and is often thought of as the person operating and initializing the model. Netlogo has built in its own programming language and set of commands known as “primitives,” which must be learned and adhered to, to successfully design the intended models.
Process Overview and Scheduling
The process flow was defined to replicate the operations of a VDP:
1. Service user (rider) phones dispatch to book a ride (2 days in advance);
2. Dispatch books volunteer driver:
a. dispatch may assign an additional rider to the driver if times and locations align;
3. Volunteer driver accepts the drive and is no longer free to accept other riders;
4. Volunteer driver travels to pick up the rider(s) within the geographic area;
5. Volunteer driver transports the rider(s) to their destination(s):
a. Rider(s) may demand several “stops” to fulfill their travel needs;
6. Volunteer driver is free to pick up other riders once commitment to current rider(s) ends;
7. Commitment ends by returning the rider(s) home or by taking them to a destination where the rider(s) has secured transportation to complete the rest of their journey;
8. Volunteer driver is no longer free to be booked once its supply of “hours” is exceeded.
The model was simplified to focus on the service provided by the driver; it was hypothesized that this would be the most useful approach given the critical role the driver plays. The role of the dispatcher and the behavior of the user was neglected. Although users in practice could have multiple stops and drivers could transport multiple passengers, this was simplified to one person per drive and one purpose per drive. This was considered realistic as 75.6% of all trips in the small and medium (i.e., fewer than 100 riders) groups were single-purpose trips and single occupants or just one rider accounted for 84.6% of the single-purpose drives. It was decided to develop the model based on the attributes of the small and medium groups, and to scale up to large groups (i.e., 100 to 301 riders) in future research efforts.
Design Concepts
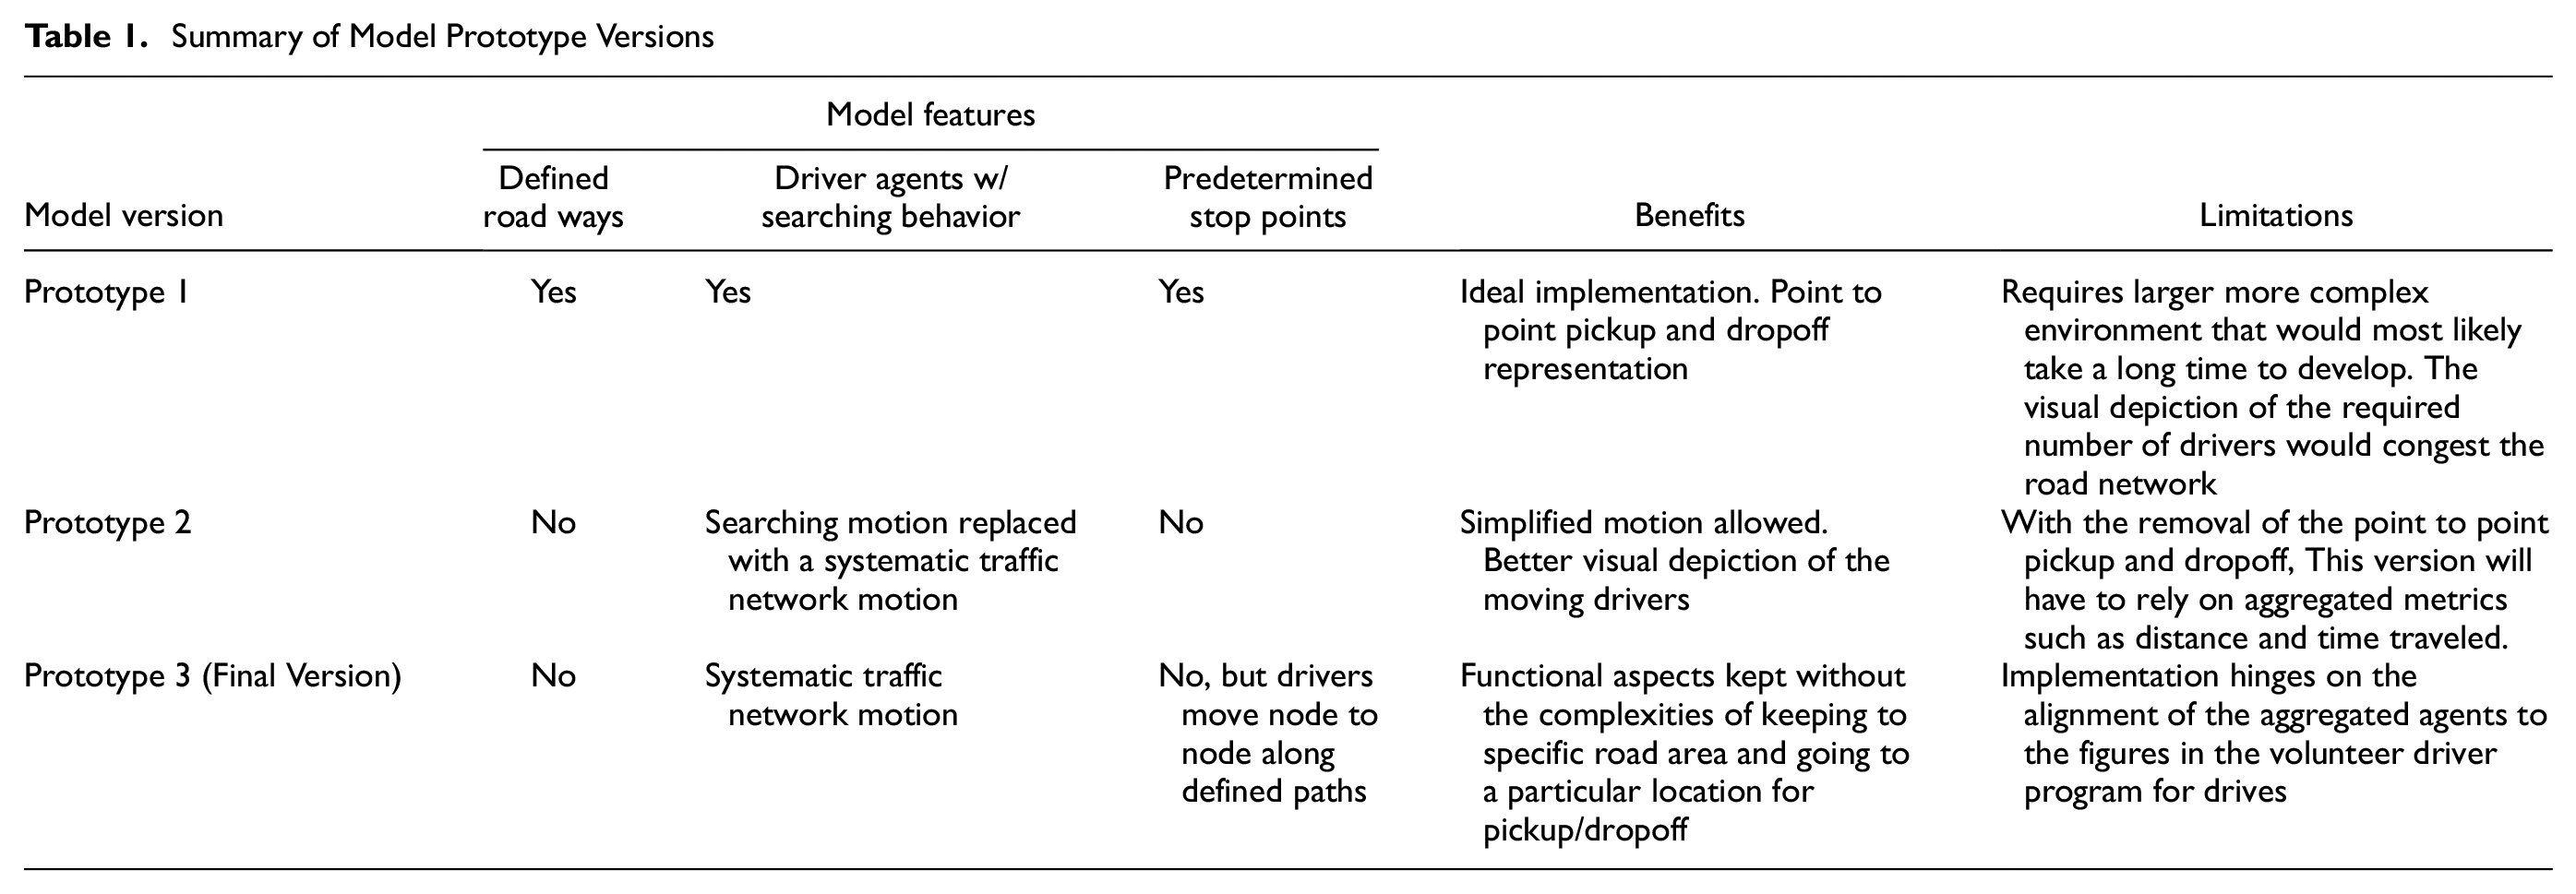
In this model the agents were represented by car icons that were moved around a road network or area after being assigned a trip of respective purpose. The trip purpose was represented by the color of the car’s icon. The car continued to move around in a systematic manner until the distance for the trip was achieved. When a driver had completed the trip, the car disappeared. The average time for the trip purpose as well as its distance were subtracted from a cumulative total. Three ABM prototypes were developed. The development summary is presented in Table 1.
Summary of Model Prototype Versions
Initialization and Input Data
The model was developed with several initial parameters based on Hanson and Goudreau ( 7 ):
Size of the ABM universe: 900 km2 to correspond with the approximate service area of the small and medium VDPs;
Average population of the service area: 11,460 individuals;
VDP driver population: 44;
Number of volunteer hours (annual hours per volunteer [26] multiplied by number of drivers [44] = 1,144 h);
The total number of drives (403 in 1 year);
The trip purpose: four main trip purposes of health, quality of life, education, and life maintenance; and
The distances covered per drive. This is a function of the total distance and the total number of drives.
In setting the timing of the model it is important to ensure the rate at which the ticks occur, the duration of the processes, and the results to be obtained align or are set to a scale. In determining the scale that would be developed for this ABM, it was important to look at the time span within which the data were collected.
The available VDP spanned the period February 2017 to January 2018 or 12 months. This 1 year or 365 days of travel data were further broken down to include the days in which the small and medium VDPs operated (Monday to Friday). This reduced the count to 261 days. The 261 days were then reduced to their operational hours (the VDPs operate approximately 10 h a day or 7 a.m. to 5 p.m.). Note: fluctuations in demand during a day were left out of this version of the model. The 261 days of operating for 10 h yielded a total of 2,610 operational hours. Over the course of these 2,610 operational hours, 1,582 driver hours were recorded in the database.
The 2,610 h were then converted to 9,396,000 s. Since the model requires that the drivers move across patches that each represent 1 km2, the time taken to cover a patch at an average speed of 60 km/h was approximately 60 s. Each tick was made to represent 60 s of operation and the model temporal extent was capped at 156,600 ticks.
The assignment component of the model sought to simulate the process by which a VDP is booked by a rider for a trip. These trip destinations were classified by their purpose in four main categories: health, work/education, life maintenance, and quality of life. The relative percentage breakdown of these trips from the database were then used in the model to probabilistically inform the code that was written to assign trips to the different driver agents. As the model assigned a trip purpose to each driver or car agent, they changed color to indicate which trip purpose they had been assigned.
An important element of the ABM is the recording of the distance covered by each driver in kilometres. The environment was scaled to allow for an easy way to track this. Each patch represents 1 km2. As a driver agent moves in whichever direction, their distance counter, named “drivedist,” increases by the corresponding number of patches that they cover.
VDPs employ terminology to describe the operational metrics in relation to “drives” and “stops,” which are analogous to the transportation planning terms of trip chains and trips. A drive is a trip chain or all the one-way stops (trips) to a destination and it ends when the obligation to the client does ( 7 ). Drives do not have to end when a client returns home, just when they do not need the service anymore. The drive counter in the ABM was built on these definitions. Its implementation was simplified in the model since the trips on which the model was built were all single-purpose trips with one stop only.
The drive counter increments (or increases ) when the distance of the trip they are on reaches the limit of a trip it has picked from the source data, that is, DriveCount : DriveCount + 1 when DriveDistance > DriveLimit. The process up to this point can be visualized in the following flowchart (Figure 1).
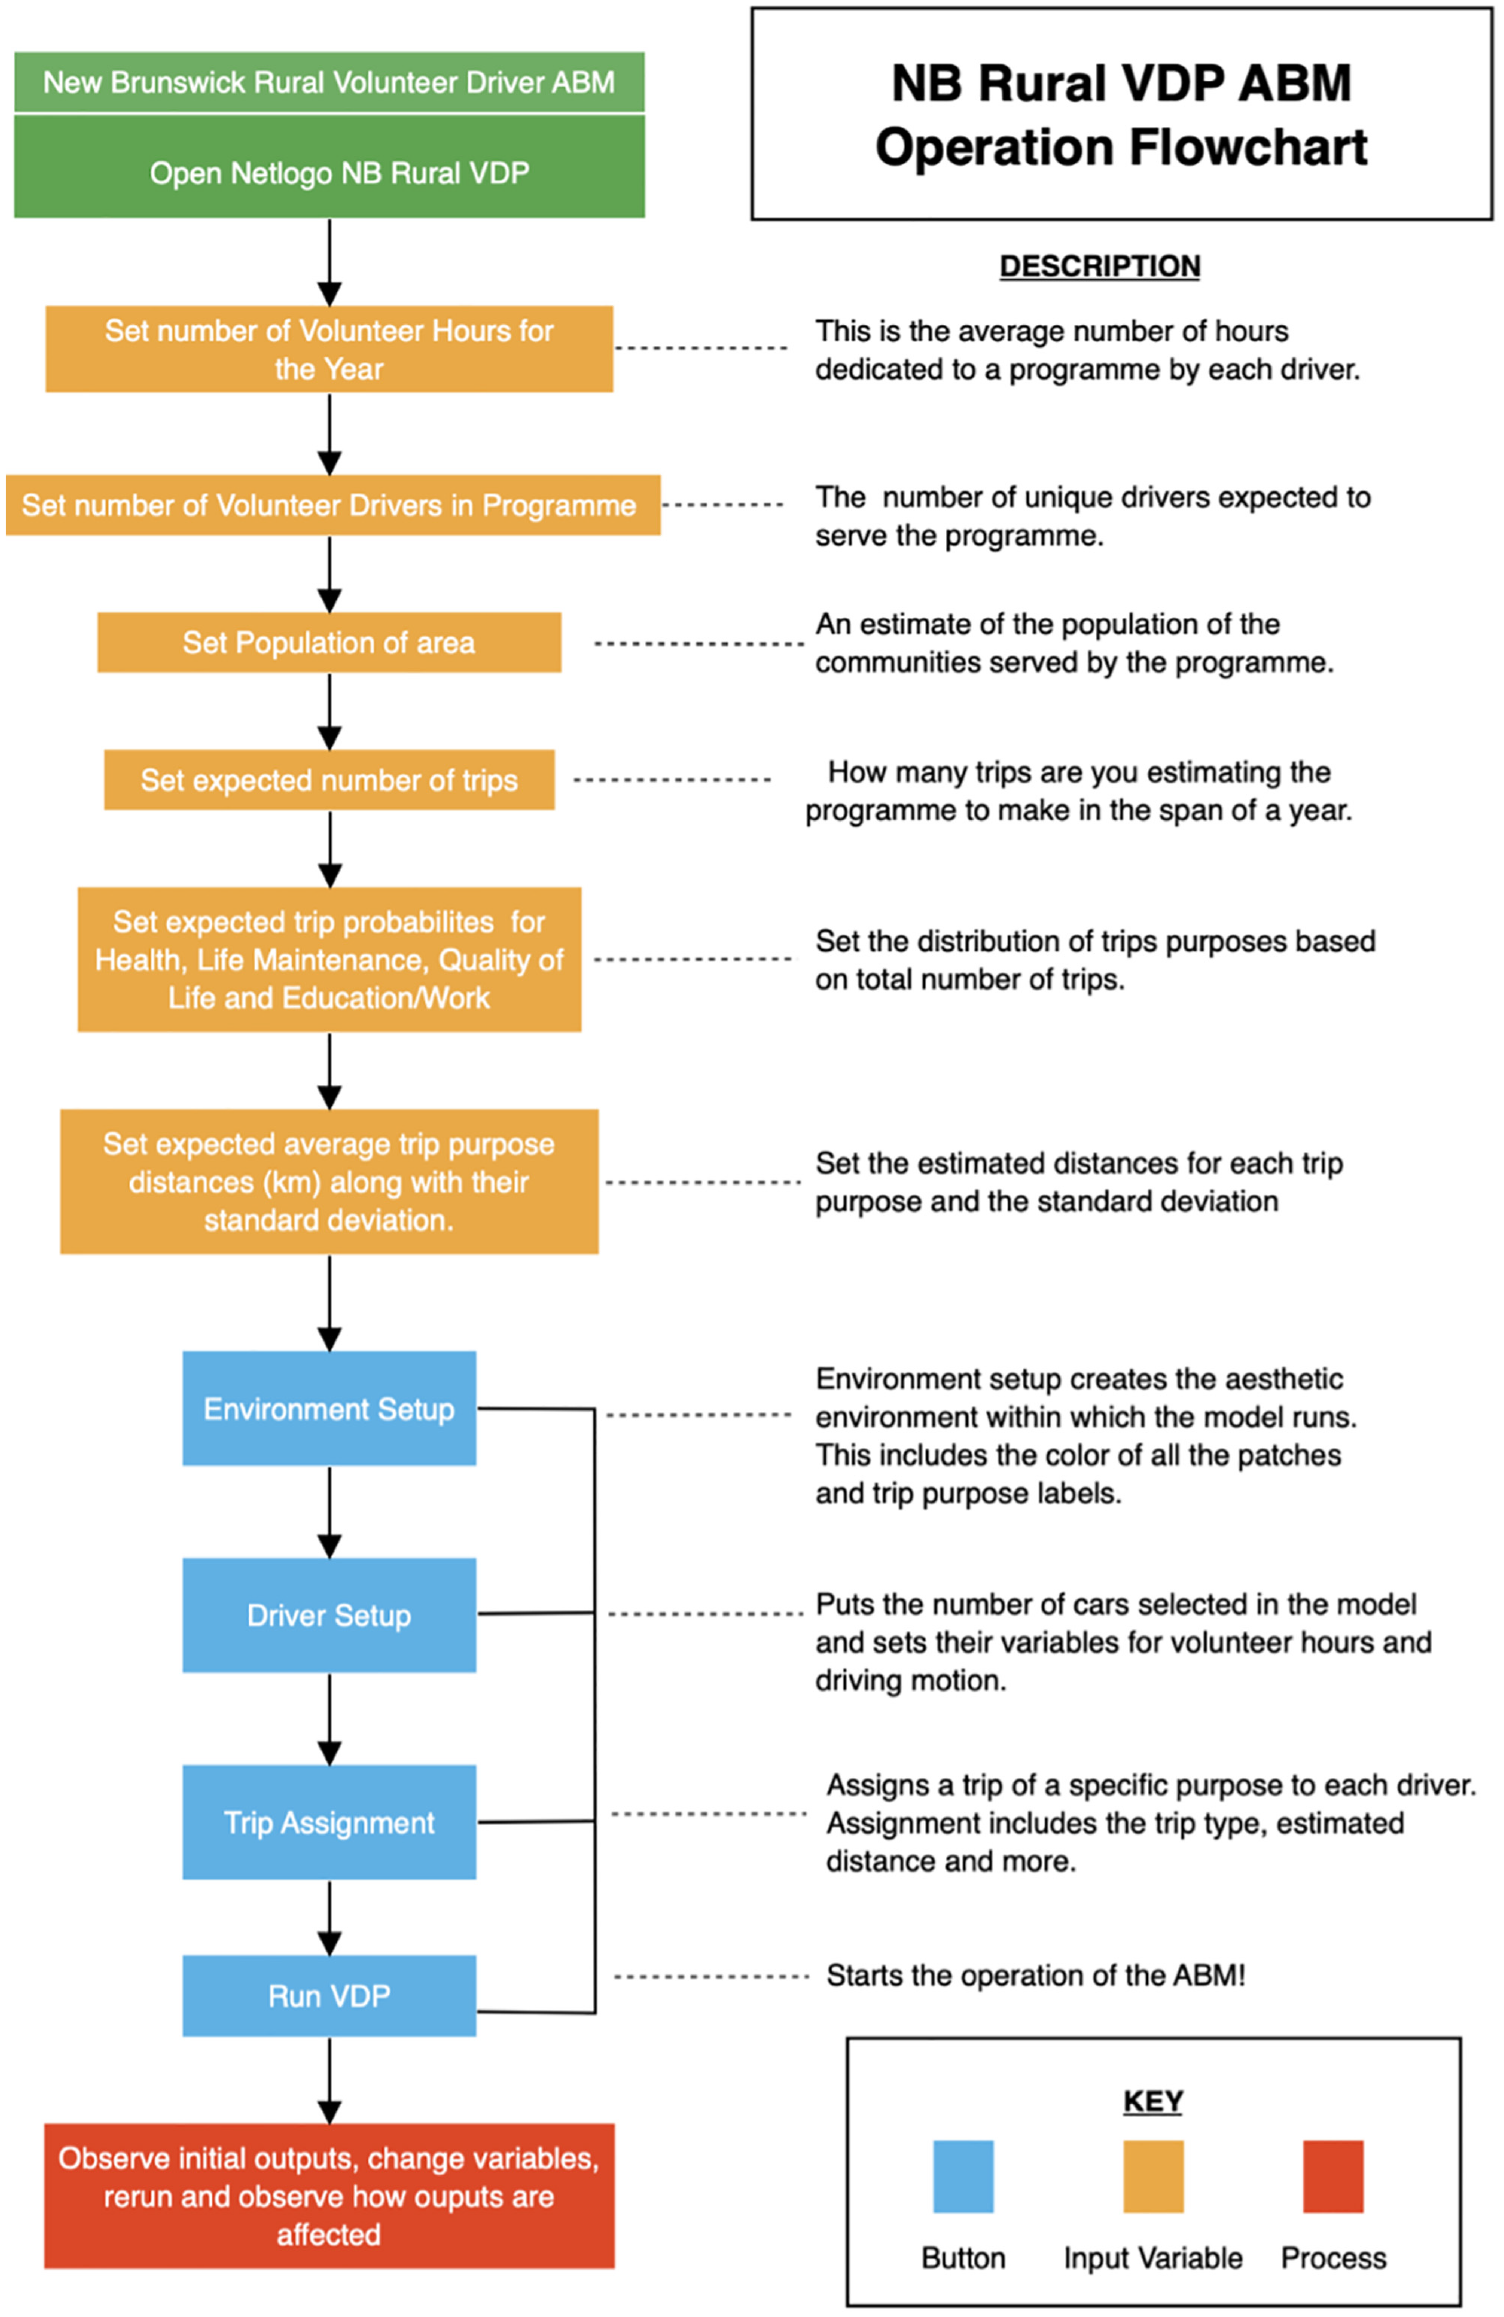
New Brunswick rural agent-based modelling (ABM) flowchart.
Submodels
The VDP model is made up of four constituent submodels: Setup-Environment, Setup-Drivers, Trip-Assign, and Move-Drivers. Each is responsible for different aspects of the greater system and has unique variables and processes. There are also five different types of variables within the system: input variables (set before the model runs); calculated variables (determined from input variables and mathematical processes while the model runs); conditional variables (Boolean, i.e., can be true/false based on a condition and their value in relation to that condition); randomly generated values (created once the model starts, varying on different runs); and constrained variables, which are randomly generated but distributed within a predetermined range. The following describes the submodels, their variables, and how they all interact to create one system.
Setup-environment, the first submodel, is linked to the patch agents in the model. Each patch agent has input variables “Pxcor,”“Pycor,” and “Pcolor”. The first two correspond to their location (i.e., x and y coordinates) and the final, their color. The color of patch agents will control the visual background within which the other processes operate. Setup-drivers, the second submodel, is the initialization step for the VDP driver agents. This is connected to variables that characterize the VDP driver agents such as the number of volunteer drivers in the model, “Target,”“Keepdriving?,”“Xcor” and “Ycor,”“Drivedist,”“DriveCount,”“DriveLim,” and “TripTime.” The number of volunteer agents in the model can be set by an input slider within the Netlogo interface. “Target” controls the direction of motion of the drivers. “Keepdriving?” is a conditional variable that assesses the ability of the driver agent to continue with their movement. “Xcor” and “Ycor” are location variables for the driver agents and correspond to their x- and y-coordinates. The “DriveDistance” and “DriveCount” are calculated variables that are updated based on the motion activity of the driver agent. “Drivelim” is a constrained variable that is assigned based on a normal random distribution with an input standard deviation. Finally “TripTime” is an input variable.
After the environment and drivers are set up, “Trip-Assign” contains the procedure that allows the assignment and tracking of trip purposes as the drivers move around. This is connected to input variable “NumberofVDrivers” and connects to input variables “HProb,”“LMProb,”“QLProb,” and “EduWProb.” These variables are responsible for the probability of the trips assigned for each of the four trip purposes (i.e., health, life maintenance, quality of life, and education). These then feed into the number of drivers for each purpose. Their color variable is changed to represent that, and a drive limit and trip time variable within the range for each purpose are assigned to the drivers.
Finally, the “Move-Drivers” submodel carried out a conditional assessment of each driver agent in the model. These drivers head toward their input target location and log their drive distance while doing so. If their “DriveDist” variable is equal to their “DriveLim” then they log their trip as a drive, the “DriveCount” variable is increased, and they disappear from the environment and are later reassigned—that is, the submodel loops back to Setup-Drivers, Trip-Assign, and Move-Drivers. When all the operations have been completed within the time confines of the ABM, significant metrics such Total Distance Covered, Current (C) Volunteer Hours Utilized, Number of Drives, and Trip Purpose Counters are stored in a spreadsheet for analysis. The finalized system architecture of the VDP ABM (and submodels) is displayed in Figures 2 and 3.
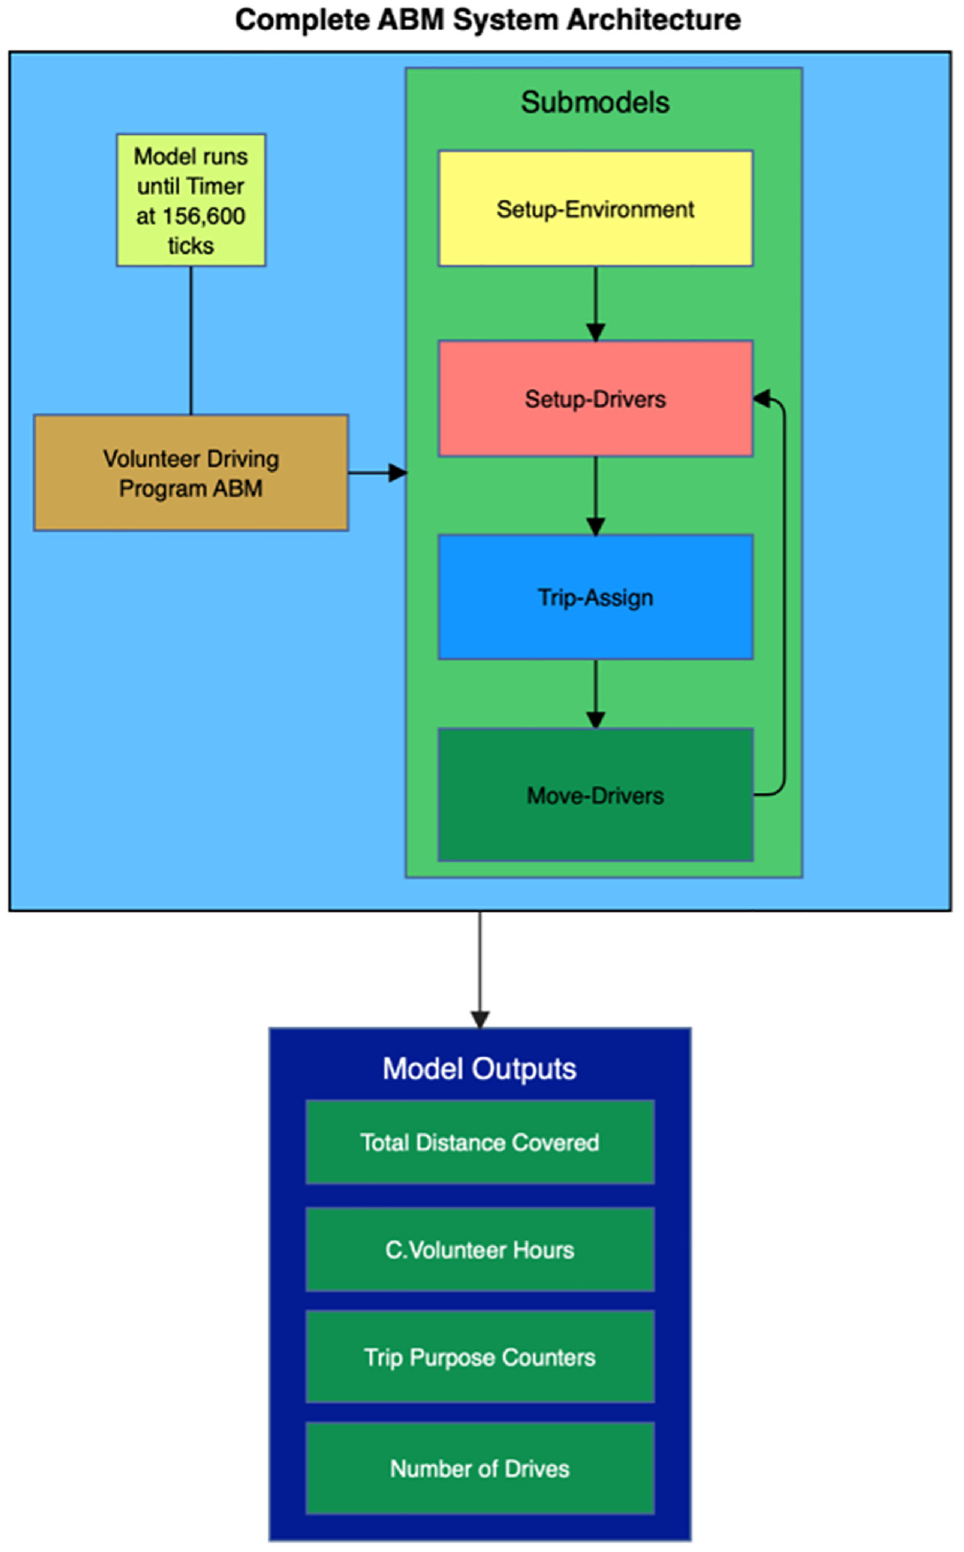
Volunteer driver program (VDP) agent-based modelling (ABM) system architecture overview.
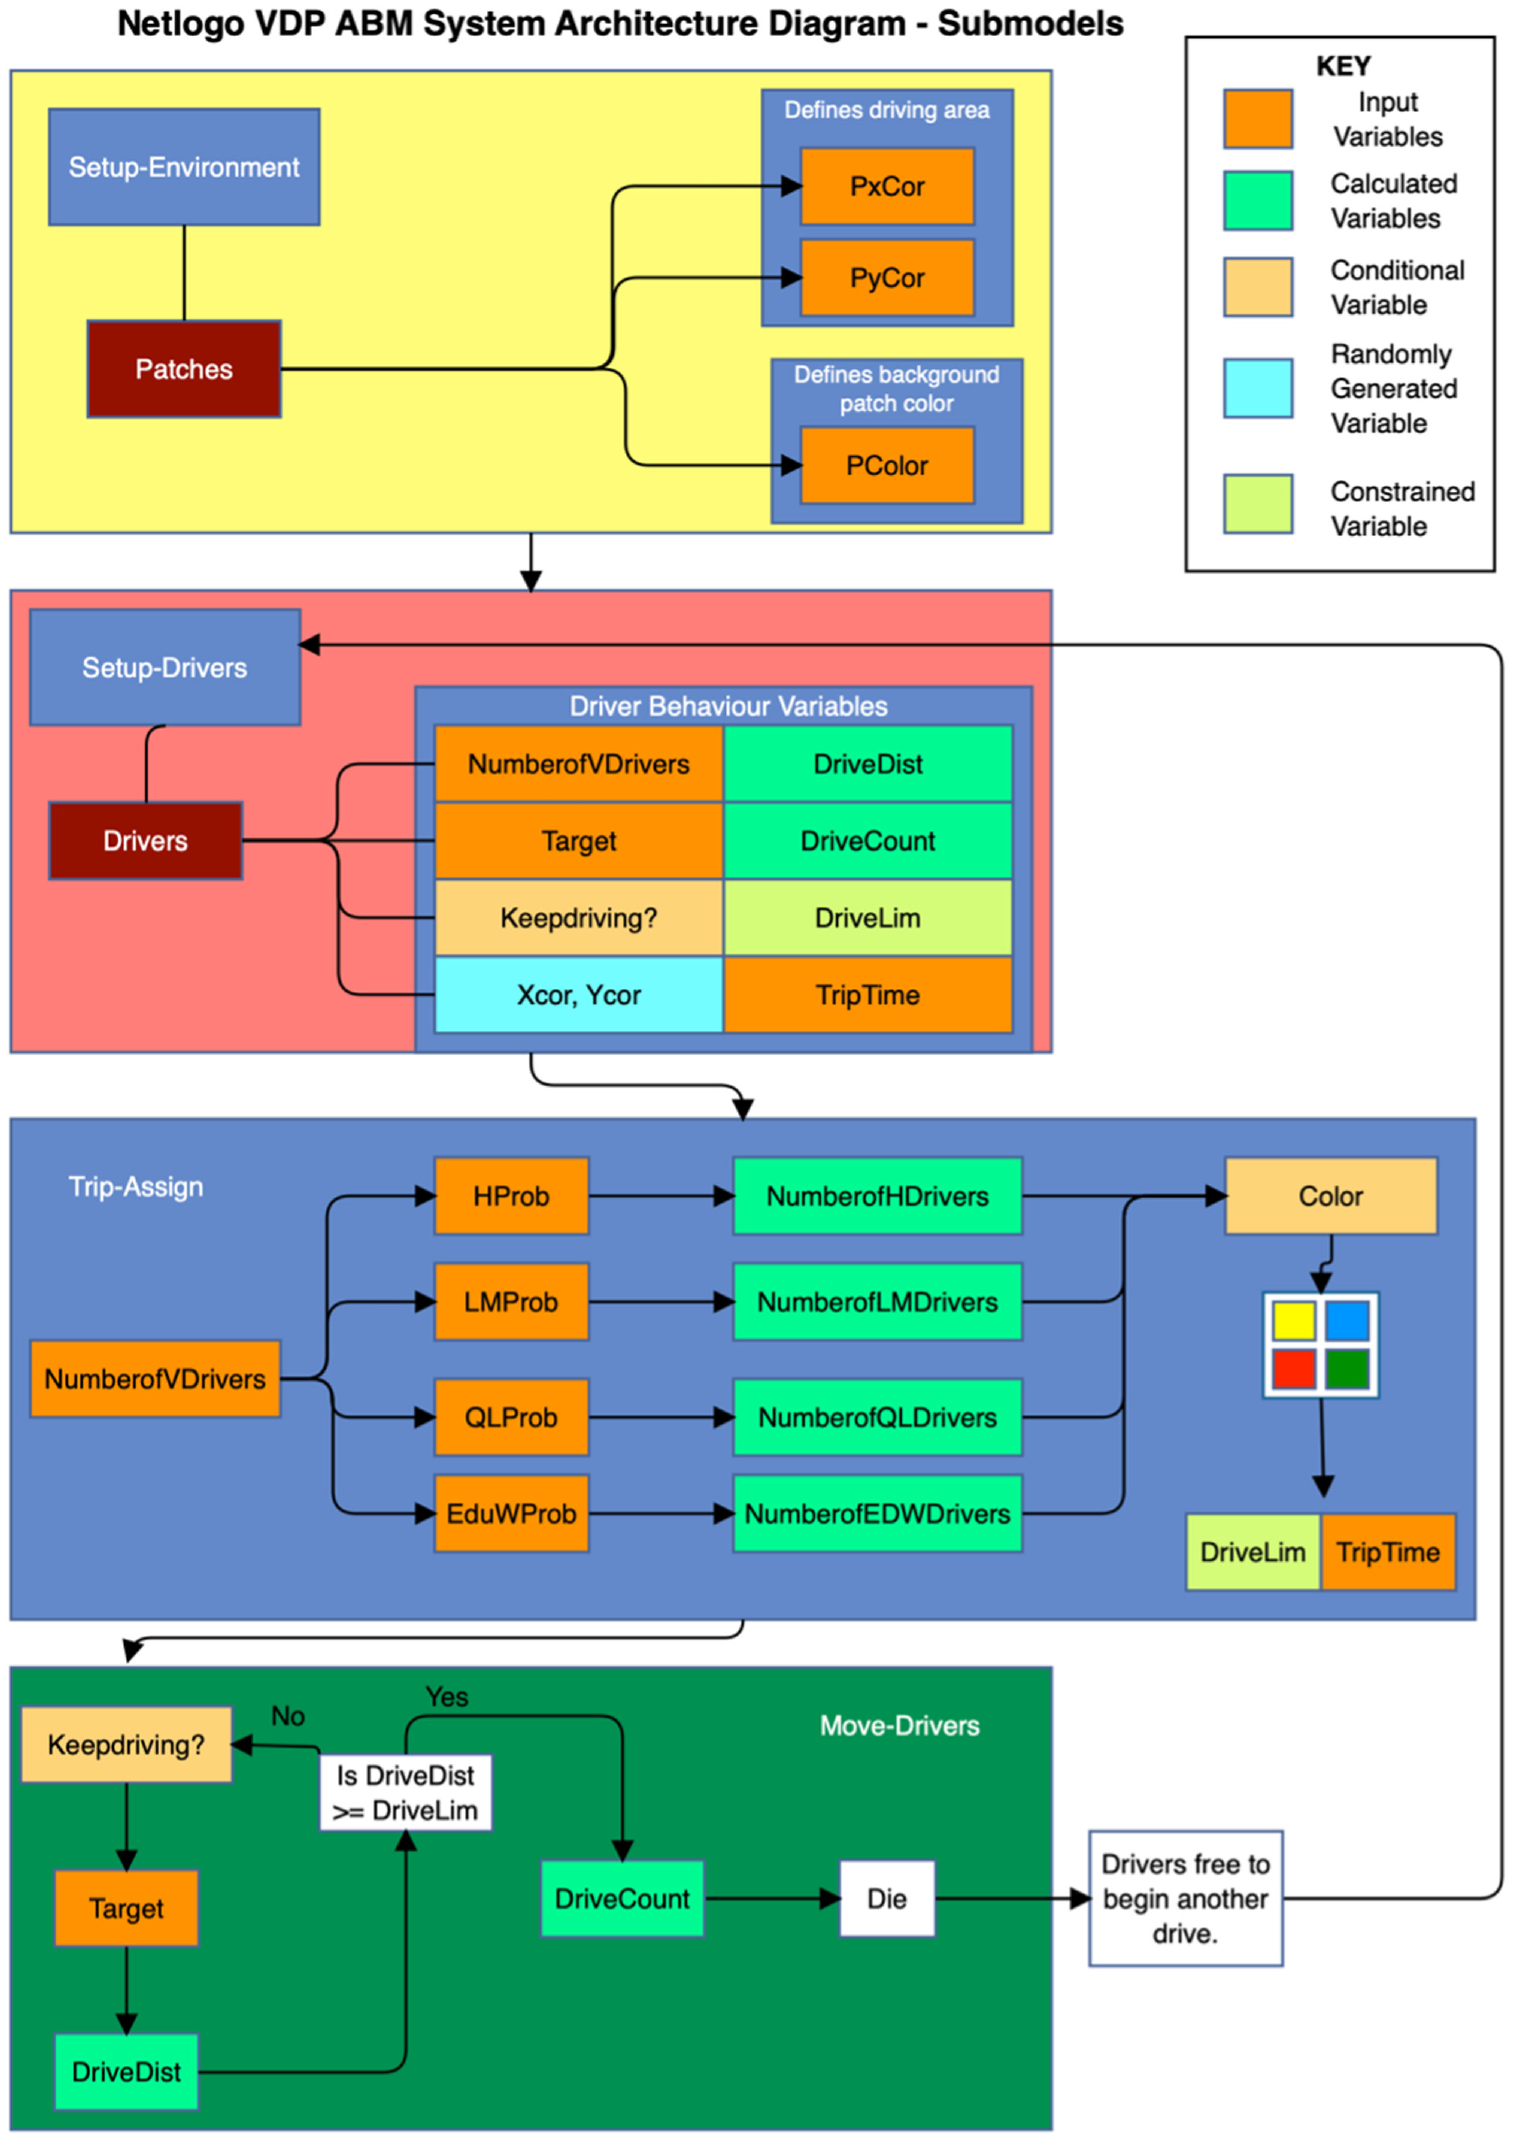
Volunteer driver program (VDP) agent-based modelling (ABM) system architecture—submodels.
Implementing the Model, Analyzing, Testing, and Revising the Model
The model is visualized in Netlogo and its constituent elements are shown in Figure 4. This includes model input sliders, data entry points, and model initialization (setup parameters), a visualization of driver agents (before trip purpose assignment), and counters and output.
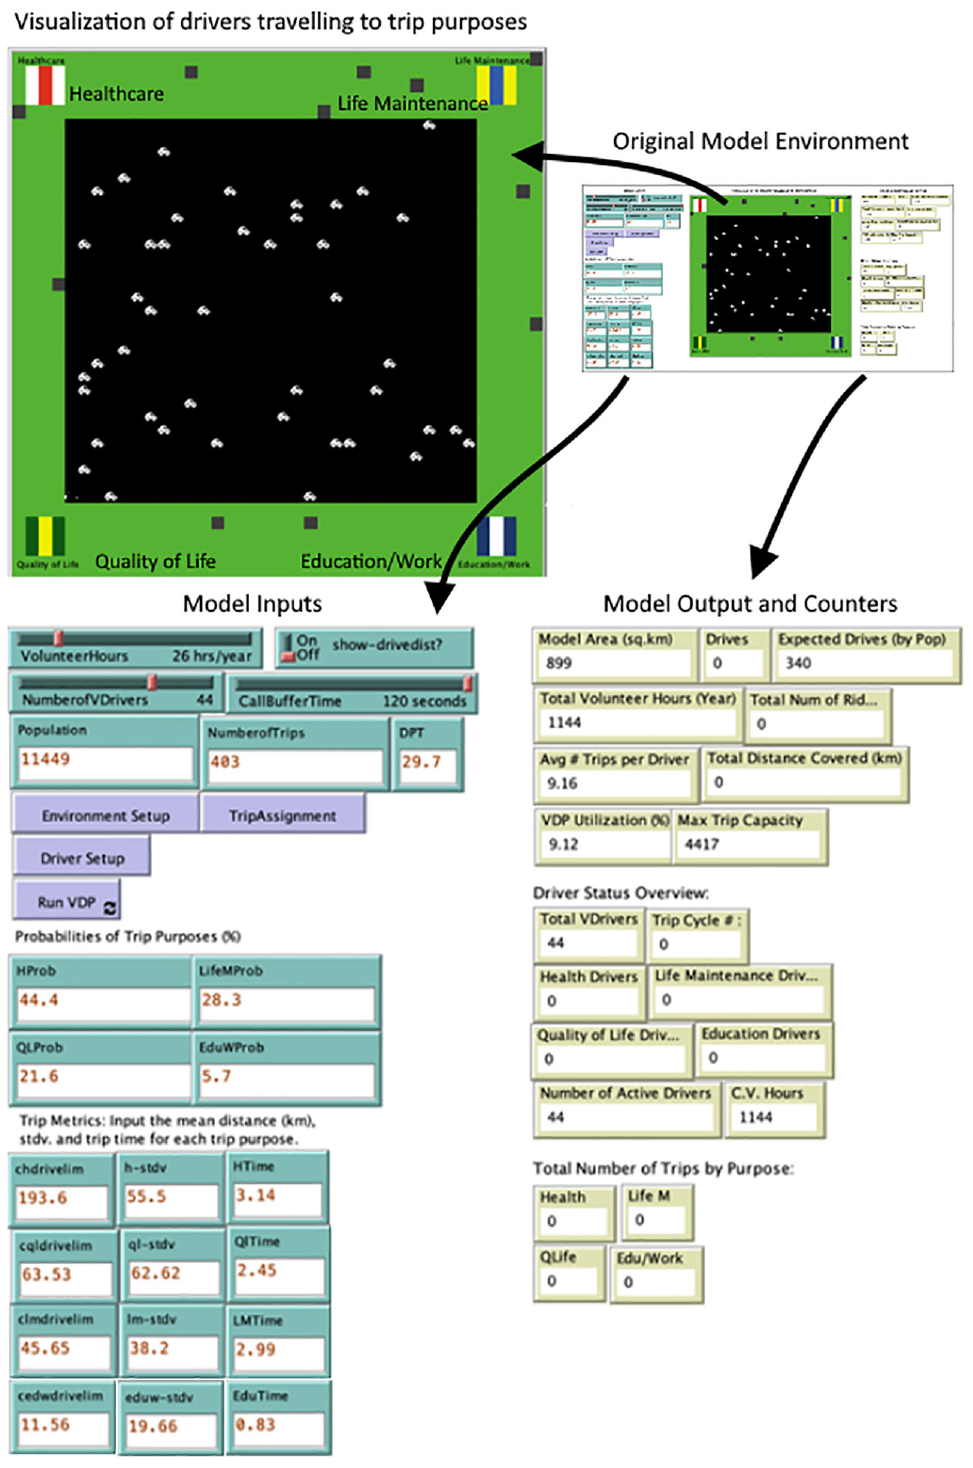
New Brunswick rural volunteer driver program (VDP) agent-based modelling (ABM) in Netlogo.
The driver operations loop and the drivers are set up and more trips assigned until the model time expires or is stopped by the user.
Results
The results were obtained through Netlogo’s integrated experiment tool BehaviorSpace. BehaviorSpace allows for the setting of initial model variables and how they vary across different runs; outputs are recorded and exported into a spreadsheet for analysis.
Model Initial Conditions
The initial model conditions were set based on the values and variables for single-purpose trips from the New Brunswick Volunteer Driving Database. The data were specifically used from the small and medium VDPs. Below (Table 2) is a summary of the initial conditions and variables set. This scenario was created to establish validity of the model results and to form the basis of comparison for the other two scenarios. The model represents the VDP as it is currently or without any changes to the attributes of the system.
Summary of Initial Variables
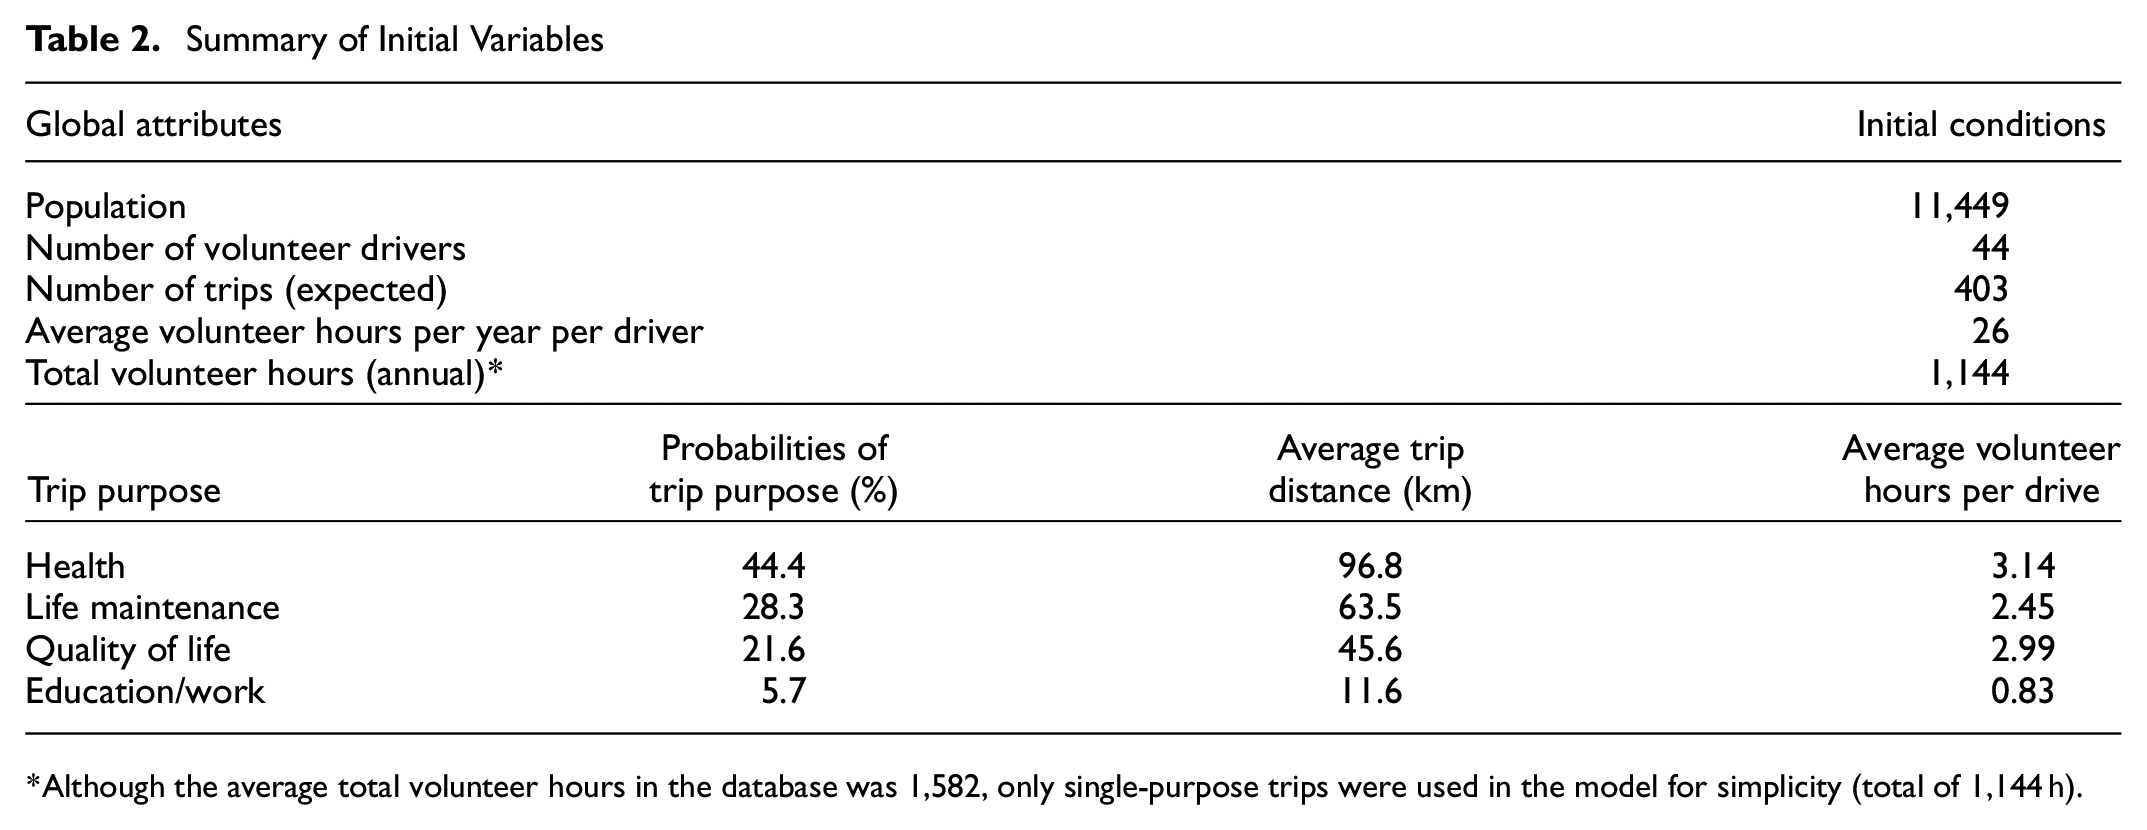
Although the average total volunteer hours in the database was 1,582, only single-purpose trips were used in the model for simplicity (total of 1,144 h).
Validating Model Output
Using the above variables, the ABM was run 25 times and a summary of the results obtained for total distance, total drives, volunteer hours per run, as well as trip purpose distribution. The validation procedure was undertaken by comparing the output- to input metrics at a logical time step in the model where total kilometres driven in the model was equivalent to the average annual kilometer driven per group (Table 3).
Summary of Volunteer Driver Program (VDP) Metrics From 25 Model Runs
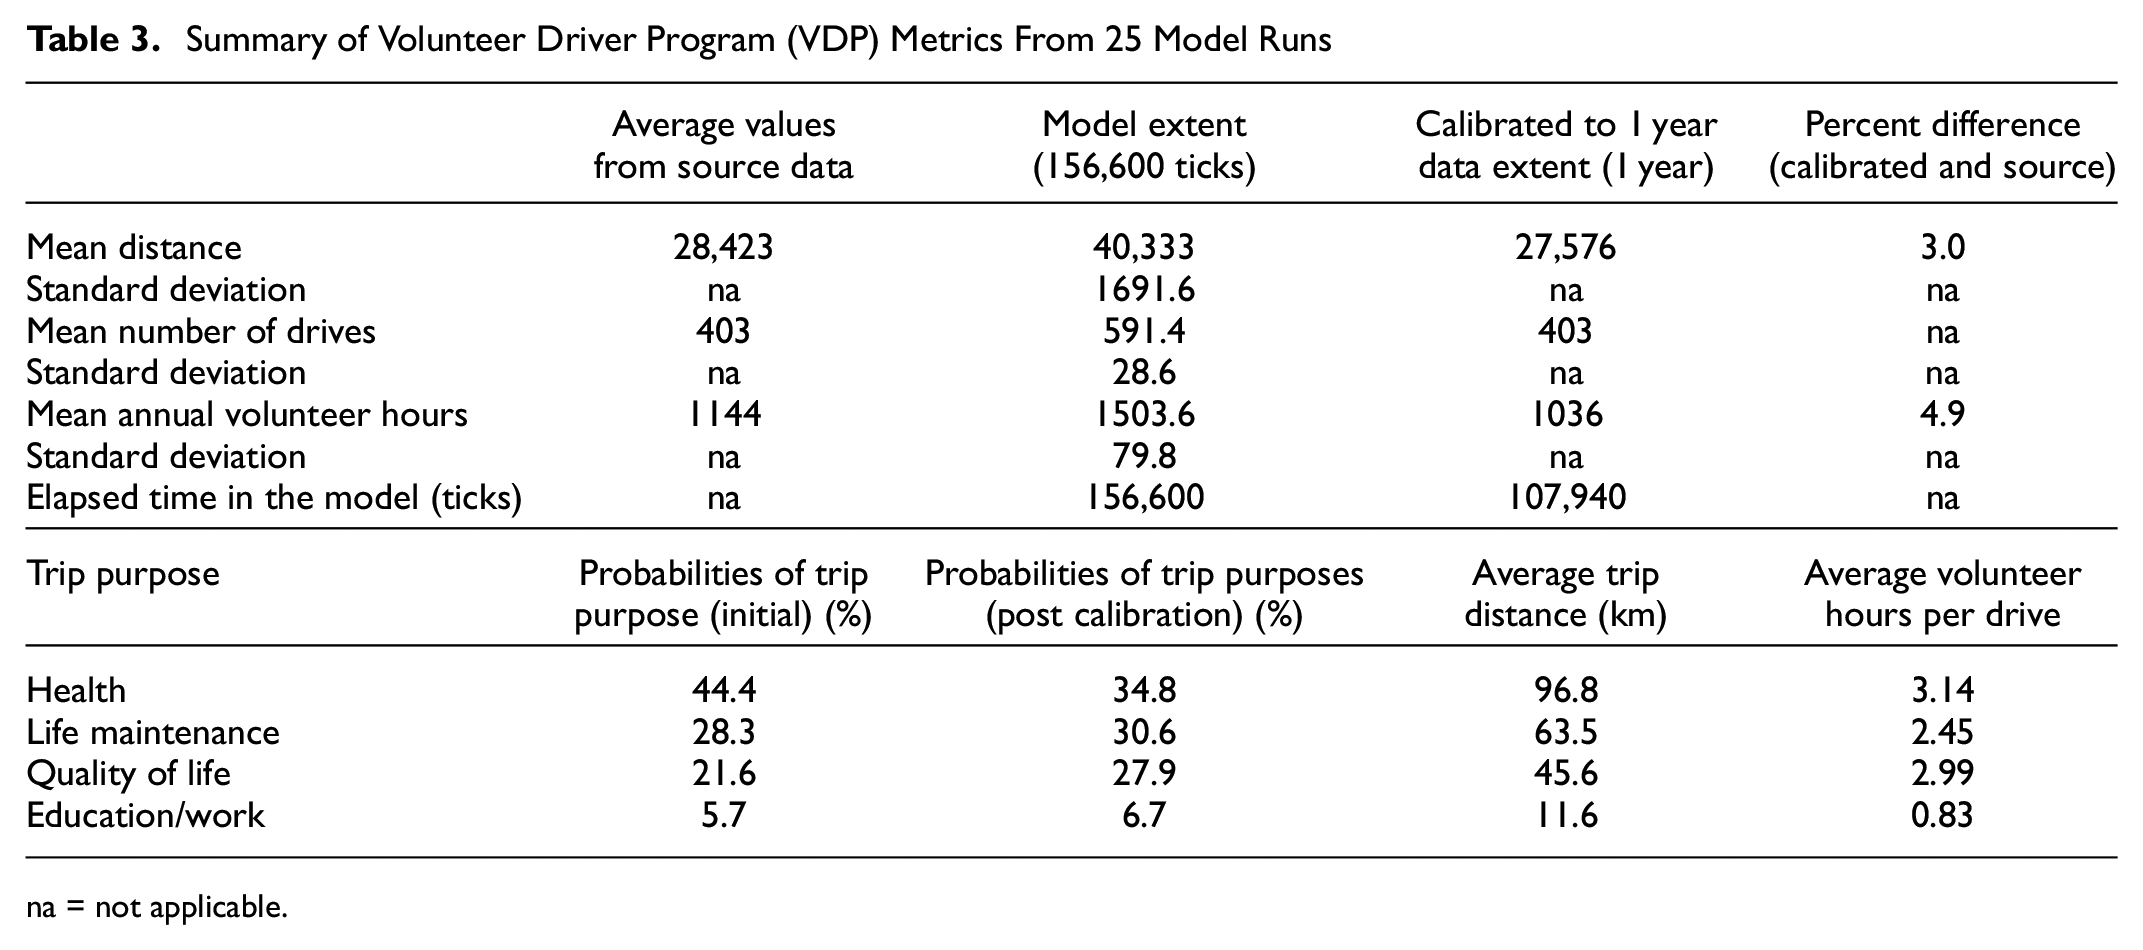
na = not applicable.
The model reached the average yearly metrics for the small and medium VDPs by an average of 107,940 ticks, or 8 months into the year-long ABM. The calibration process involved letting the Netlogo model run to its full extent (156,600 ticks), then applying a ratio of ticks for a year’s worth of VDP data to the ticks for the full extent. The ratio applied (0.689) corresponded with the percentage of time in which the model reached the average yearly ticks. This approach is better because it allows for users to keep both perspectives of the model in relation to its original theoretical outputs as well as the calibrated relatable operational VDP data. It should be noted that these values are associated with the end of time steps (i.e., ticks), which is why they do not correspond exactly to the database values.
Application of the Model to Operational Scenarios
Three VDP operational scenarios were explored with the model. Scenario 1 explored the change in the model’s outputs for total trip distance, number of drives, and volunteer hours to a 100% increase in the average trip distance for the health purpose (193.6 km distance, 6.28 h per drive). This is intended to simulate what would occur if a hospital or major medical center were to be relocated: increasing average user travel distance. Scenario 2 modeled a service provider expanding their offering into larger territories by doubling their service area. Scenario 3 responded to the operational changes observed in Scenario 1 and determined the impact of increasing the number of drivers on meeting the gap in operations. Table 4 shows the summary results.
Summary of Three Model Scenarios (Average of 25 Runs)
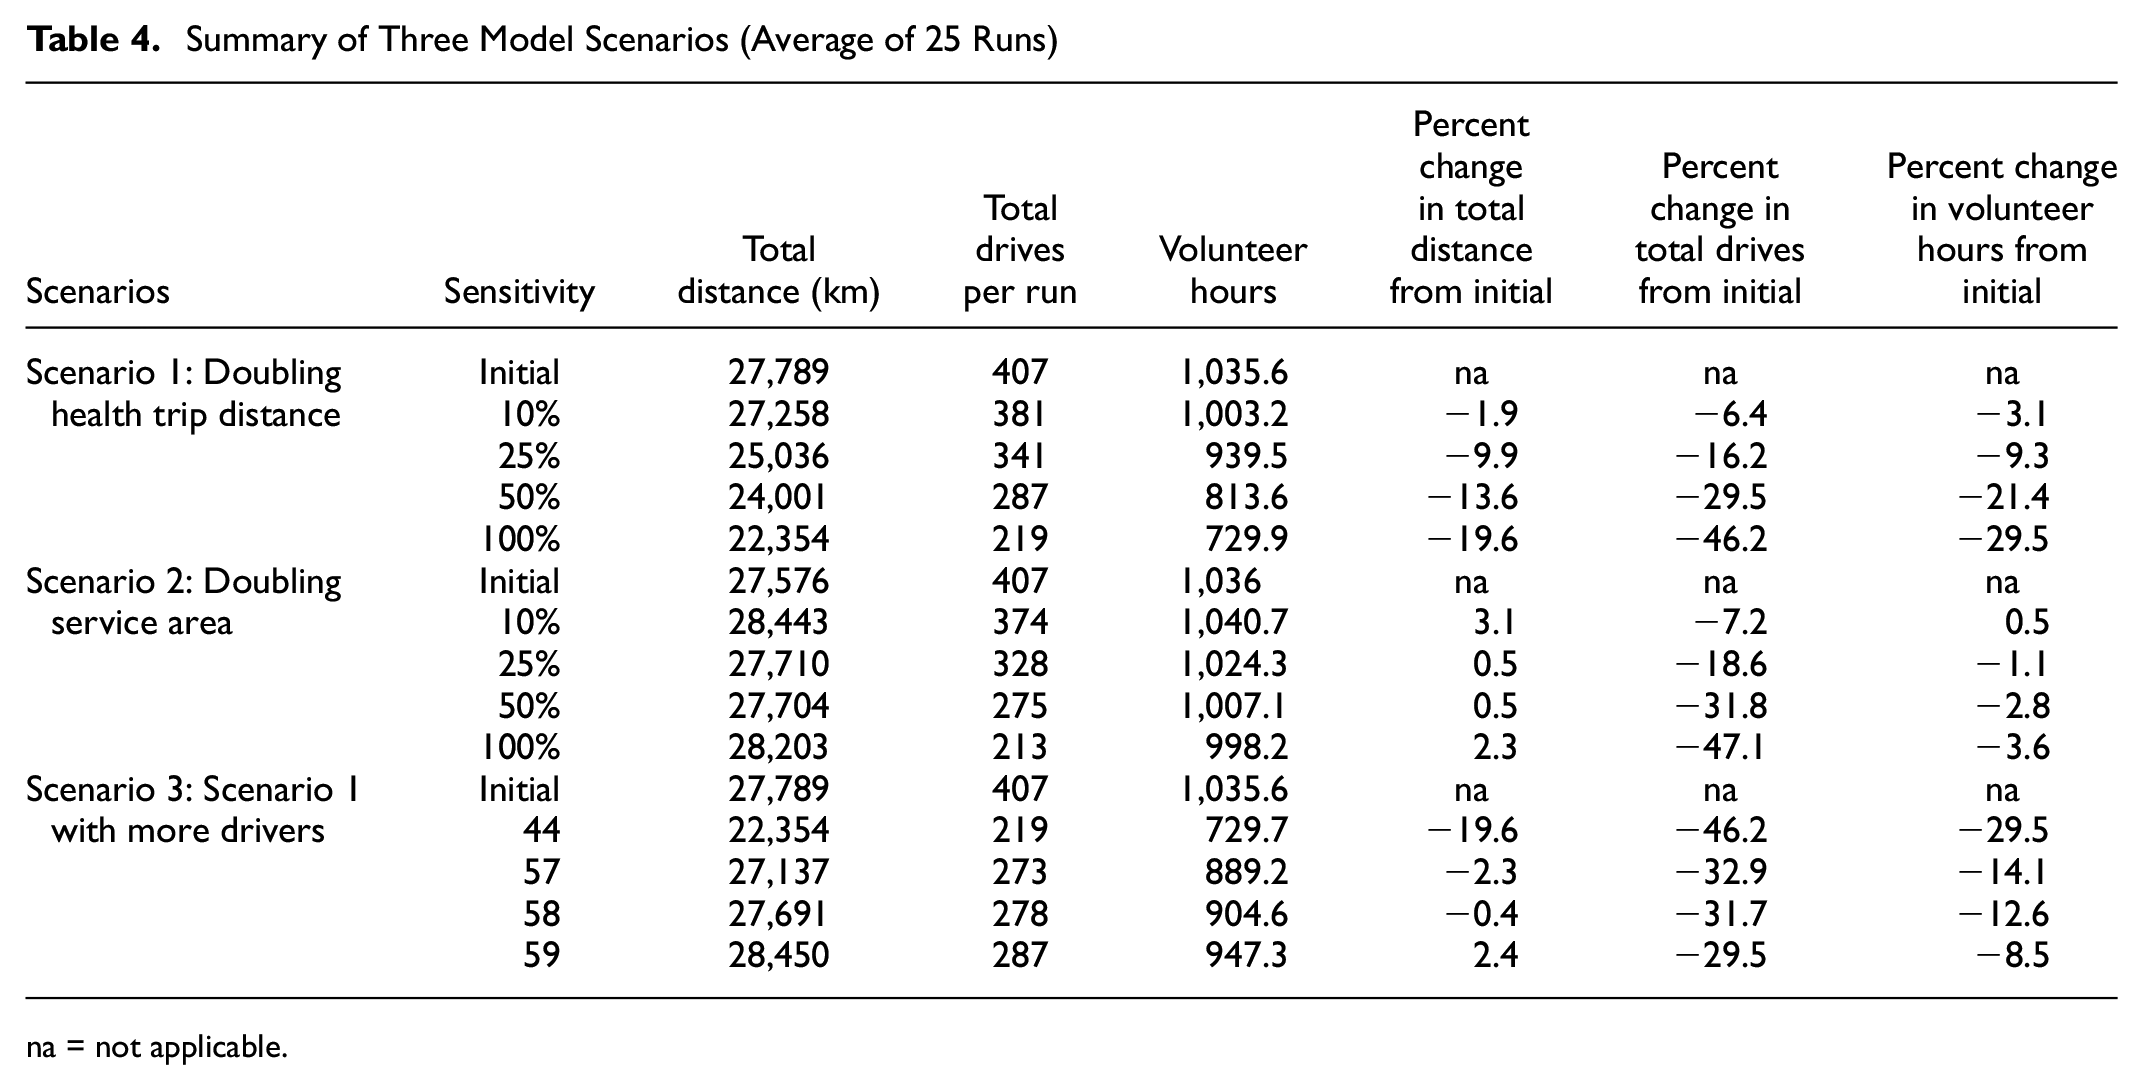
na = not applicable.
In Scenario 1, all three observed metrics seemed to show a consistent linearlike trend of decrease as the average trip distance for health was increased. A total of 188 fewer drives were provided, which corresponded to a reduction of 46%. The most likely explanation for these observations is that, given that health trips were already consuming the most resources, a doubling of the travel distance for health meant that drivers were unable to meet their obligations for the other trip types when they came up, given their own hourly constraints.
In Scenario 2, the 44 drivers were still driving approximately the same number of kilometres and had similar time constraints, but the model showed they were unable to complete as many drives as for the initial conditions. A total of 194 fewer drives were provided, that is, a reduction of 47% was recorded. The number of drivers per run decreased at a rate that was approximately inversely proportional to the increase in service area, that is, a doubling in service area saw total drives reduced by half, which was a logical result.
In Scenario 3, the reduction in kilometers from Scenario 1 was offset by increasing the number of drivers to 58. Total drives still experienced a net reduction of 120 or 29.4%. This means that meeting the need for trips resulting from the doubling in health distance would be a function of increasing the number of drivers and hours per driver. It would have been useful to also explore the impact on the 44 drivers in relation to their time- and travel commitments in meeting the increase in health distance; this was not undertaken owing to time constraints.
Discussion
The development of this ABM had several limitations:
The aggregate nature of ABM removes specific details and thus the results are not expected to be predictable and readily reproducible. Instead, values are within a certain range and their validity is assessed based on an average over many runs.
The model was developed based on single-purpose trips within this data period for small and medium VDPs, though large VDPs make up the majority of drives and total kilometres driven.
Calibration is not achieved by getting the expected metrics in the simulated time of the model but getting the expected metrics at the point in which they should correspond with each other, in real time. Model time may not account for wait time, traffic stops, or any other unquantifiable temporal events.
Increasing service area may not mean the average distance of trip purposes will increase in practice. A larger service area could mean that there are many more options for health centers, grocery stores, schools, and places of employment even in a rural landscape. More research is needed to quantify this effect.
This model did not account for the interaction between users, the dispatcher, and the drivers. This interaction would be an important aspect to model to help determine the operational limits of this service model.
Although this model is limited, the scenarios demonstrate how the approach could be used in rural VDP transportation planning. The scenarios examined the impact of varying trip distances and average trip purpose time, including driver number and time constraints. The volunteer drivers are the key enablers of these systems, and any analysis that can be done that helps determine the impacts that dispatching decisions or changes in demand can have on drivers can help the organization better manage these impacts. The result of having the model predict that an increase in the health trip distance (a likely scenario facing rural areas when health services are centralized) results in drivers being less available for other trips is an intuitive but important outcome of this type of approach. Knowing that it may require an additional 15 drivers to achieve the same number of driving kilometres if health distances are doubled is the kind of information that can help inform service- and health policy development. It could help the VDP assess the feasibility of attracting that number of drivers, for example.
Although the model developed did not include any metrics that specifically measured impacts on a dispatcher, such as a call time or trip assignment time resulting from operational changes, this could be possible in the future; this would help assess the feasibility of a dispatch-based model and to establish the upper bounds of the conditions a dispatcher could manage. There may be a set of operational conditions for which this type of model would no longer be feasible for meeting user demands; an ABM could help establish these upper bounds. Additional research could result in this being a practical tool for VDP self-assessment.
Conclusions
This research explored the potential of ABM for use in car-based volunteer transportation program planning through five major objectives. Firstly, it identified whether any suitable behavioral models or databases were available that could characterize the interaction of agents expected from a car-based centrally dispatched VDP. No suitable behavioral models were identified that represented the operational structure and processes of a car-based VDP; however, useful data inputs were gathered from the New Brunswick Volunteer Driving Database. Secondly, it presented a rules-based system developed from the findings of those data inputs that could be used to describe the operation of the VDP. Thirdly, from the rules-based system, an ABM was developed, applied, and validated based on a simplification of a rural VDP. The initial run or base conditions of the model produced results that were consistent with the actual operation of the VDP. The fourth objective tested the model with a few scenarios that alterated parameters such as travel distance, which would enable an evaluation of operational effectiveness. One scenario explored the event of a hospital or major healthcare provider moving away to twice their original distance, meaning that user travel distances were doubled. This was interpreted to mean that longer, more frequent trips would take away from the total number of drives of the overall system as, theoretically, drivers would be occupied for longer and thus deployed less frequently. Finally, the fifth objective assessed the potential of the ABM approach for rural transportation planning. The VDP ABM has several limitations, primarily in relation to the simplification of the VDP delivery of service, but represents a unique contribution that will form the basis for further research in this area, which will include multipurpose stops and driver/user/dispatcher interactions.
Footnotes
Author Contributions
The authors confirm contribution to the paper as follows: study conception and design: R. Morrison, T. Hanson; data collection: T. Hanson; analysis and interpretation of results: R. Morrison, T. Hanson; draft manuscript preparation: R. Morrison, T. Hanson. All authors reviewed the results and approved the final version of the manuscript.
Declaration of Conflicting Interests
The authors declared no potential conflicts of interest with respect to the research, authorship, and/or publication of this article.
Funding
The authors disclosed receipt of the following financial support for the research, authorship, and/or publication of this article: The authors acknowledge funding from the Natural Sciences and Engineering Research Council of Canada (Discovery Grant).