
Abstract
This paper analyzes the impact of the COVID-19 pandemic on activity time use and timing behavior in Switzerland. The evaluation is based on mobility tracking data collected in Switzerland during the COVID-19 pandemic. The pandemic has affected how people spend their time and schedule their activities throughout the day, subsequently creating new activity patterns. Because of the rare occurrences of pandemics in the recent past, little is known about their implications on the behavioral choices of affected people. This paper analyzes these implications by applying a multiple discrete-continuous choice model on mobility tracking data from Switzerland. The applied model is consistent with the results of the descriptive analysis and shows that the different stages of the pandemic drove changes in the activity patterns. During the lockdown, an increase in home activities comes along with decreases in the other activity types. With progressive relaxation of the measures in the following phases, the trends slowly return to the initial state before the pandemic. In addition, it can be seen that the impact of main drivers such as age, gender, household size, income and weather on time use and activity scheduling varies between phases, activity types, and time of day.
Keywords
Behavioral choice models have been increasingly applied in recent years, mainly because of the increasing computing power available and the ability to estimate new and more accurate choice models. Increasingly, the field has also moved from the sole use of single discrete choice models to employing multiple discrete choice models with a continuous component. In this vein, the current paper uses the multiple discrete-continuous extreme value (MDCEV) model with tracking data from the Mobility Behaviour in Switzerland (MOBIS):COVID-19 study in Switzerland to gain insights into the impact of the COVID-19 pandemic on the time use and timing behavior of employed people on weekdays ( 1 ).
The COVID-19 pandemic is without precedent in the last century. Aside from war (which is a very different phenomenon), there is nothing comparable since the 1918–1919 flu pandemic. In March 2020, the Swiss government declared the state of an extraordinary situation and imposed a lockdown ( 2 ). All shops and restaurants, as well as entertainment and leisure facilities, were closed (with the exception of system-relevant industries such as, for example, food stores and healthcare institutions) and restrictions on border crossings were introduced. Work from home was recommended; businesses in which the required social distance could not be maintained had to close, and social gatherings in public spaces were limited to a maximum of five people, resulting in the reduction of social and professional interactions to a minimum. In addition, school closures were put into force and non-urgent medical procedures had to be postponed ( 2 ). This phase was then followed by periods with varying degrees of relaxation of the containment measures, starting with the opening of smaller businesses and self-service facilities in late April ( 3 ). In May, classroom teaching was resumed, restaurants were able to re-open with certain qualifications, and leisure facilities were accessible again, even though under heavily restricted conditions. In June, numerous other restrictions were eased in expectation of the summer holidays before the measures had to be tightened again in July, including a mask obligation on public transport and quarantine for travelers from high-risk countries ( 3 ). There were never measures targeted at specific socio-demographic groups (e.g., vulnerable elderly), and the economic and social impacts of the imposed measures were noticeable for the entire population at all times during the pandemic.
The collection of tracking data started in September, 2019, before the outbreak of the COVID-19 pandemic, and continued throughout the first wave. This continuous tracking makes it possible to identify differences in behavioral patterns of a Swiss population sample not only compared with the individual phases of the pandemic, but also the pre-pandemic period.
This paper contributes to research by analyzing how people react in a crisis situation caused by external influences by adapting their behavior. The main objective is to identify varying behavioral patterns across the different phases of the pandemic and the drivers behind these changes. These insights support improved decision-making in future crisis situations to shape the required interventions in such a way that they have the least possible negative consequences for society and the economy.
The next section continues with the introduction and related work, followed by a presentation of the applied methodology and the data. The paper closes with the results section and concluding remarks.
Related Work
Formulations of Behavioral Choice Models
Considerable progress has been made in recent years with new choice models to predict behavioral choices in complex situations. Recent extensions include MDCEV models and latent as well as hybrid choice models (4–9). For most of these models, the classical estimation method is maximum likelihood (ML) inference. However, the increasing complexity of the choice situations, and subsequently the model specifications, has led to the application of alternative estimation techniques such as Bayesian estimation, quasi-random maximization, and the expectation-maximization (EM) algorithm (10–12).
With regard to modeling the timing and duration of activities, a variety of methods have been tested ( 13 ). In a first group of models, timing of activities was simplified as a choice between a finite number of discrete time periods (14, 15). In a next step, Ettema et al., Bhat, and other authors developed hazard-based duration models (16, 17). These frameworks include duration as a continuous variable and therefore allow for variations in the duration of activities, but are not based on a behavioral theory. As a result, multiple authors have proposed utility-based frameworks which are based on the assumption that there is a marginal utility for each time of the day (18, 19). Further developments of these model formulations accounted for satiation effects and scheduling constraints for the timing of activities (20, 21). One common approach for the latter is the schedule delay approach which was first proposed by Small ( 22 ). However, as stated by Ettema et al., there are only few studies which combine two or more of these aspects, with notable exceptions being the studies of Ettema et al., and Vovsha and Bradley (13, 23, 24). Then, Ettema et al. were among the first to develop a model which combined all three relevant elements for activity and trip scheduling (time-of-day preference, satiation effects, and schedule constraints), proposing a flexible error component discrete choice model ( 13 ). Around the same time, Munizaga et al. developed a discrete-continuous model with general error structure to value time ( 25 ). More recently, Golshani et al. combined two of the approaches and proposed a discrete-continuous model with a hybrid utility-regret model as discrete and a hazard duration model as continuous component ( 26 ).
In the recent past, the MDCEV model developed by Bhat has been predominantly used for modeling activity time use and timing behavior ( 4 ). This model has been extended in many ways to account for the unique characteristics of specific empirical contexts. Bhat addressed multiple issues of the initial model formulation and introduced new utility functions to facilitate the clearer interpretation of model parameters and enable higher degrees of flexibility (27, 28). Pinjari and Bhat developed a nested MDCEV model that relaxes the error terms assumption of the classical model and captures inter-alternative correlations among the alternatives in so-called nests ( 29 ). Bhat et al. formulated a closed-form MDCEV model to account for grouped observations on the consumption of goods rather than continuous consumptions of goods ( 30 ). The same paper and a subsequent paper both proposed a model formulation that does not require the specification of a budget and accounts for complementarity and substitution effects (30, 31). Other developments include the incorporation of generalized extreme value (GEV) error structures, multiple constraints, latent segmentation, and forecasting procedures (32–38).
Case Studies and Drivers behind Activity Time Use and Timing Behavior
Because of the rare occurrence of pandemics, there are few case studies about pandemic-related activity time use and timing behavior. However, several case studies have analyzed time use patterns during normal times. Castro et al. showed that the place of residence influences time use ( 33 ). In addition, they were able to demonstrate that people with lower workload tend to shop more often, and that men are more likely to participate in leisure activities, confirming results from prior research (39, 40). Palma et al. found that men are also more likely to go shopping, but less likely to work ( 40 ). In a different study, Palma and Hess observed that women tend to perform more out-of-home activities than men as well as a “significant complementarity between shopping and leisure activities” ( 31 ). Bhat, and Pinjari and Bhat found that bicycle owners are more likely to participate in leisure activities and that households with higher income tend to carry out leisure activities more often out-of-home (4, 29). Bhat states that households with children are significantly less likely to spend time in out-of-home activities (apart from work) ( 28 ).
Only a few studies specifically target timing behavior. Anggraini et al. found that the most influential variable in their model was the “available time for a non-work activity during the morning off-peak period” ( 41 ). The same authors showed that start-time decisions are strongly influenced by decisions on activity duration as well as age, gender, income, household size, children, and car ownership. The possession of multiple cars increases the participation rate in out-of-home activities, and the duration of leisure activities which are on weekdays usually moved toward the end of the day ( 29 ). This coincides with findings of Pinjari and Bhat, and Shabanpour et al., who stated that non-workers as well as workers tend to schedule non-mandatory activities at later times during the day, even though it may be for different reasons (29, 42). In general, flexible activities are shifted to off-peak hours—this is valid for telecommuters as well as other workers ( 42 ). The extensive study of Pinjari and Bhat additionally indicates that single people are more likely to participate in out-of-home activities during evening and night hours ( 29 ).
Methods and Materials
Panel Mixed Multiple Discrete-Continuous Extreme Value (MMDCEV) Model
In this paper, a panel version of the “mixed MDCEV” (MMDCEV) model is formulated to analyze time investment of employed people on weekdays among 15 alternatives. These alternatives consist of five activity purposes (home, work, shopping, leisure, and travel) across three time periods (peak hours, off-peak hours, and night hours).
The model formulation accommodates heterogeneity (i.e., differences in behavior) across individuals because of both observed and unobserved individual attributes. In addition, the model formulation also considers individual-specific unobserved attributes that may make an individual more (or less) predisposed toward specific groups of activity types. Econometrically speaking, there may be common unobserved factors that affect the utility of groups of activity types to generate correlations across the random utility terms (or error terms) of the alternatives in those groups. It is important to note that the inter-alternative error term correlation structure operates at the individual level, and contributes to individual-level unobserved heterogeneity. This error correlation does not operate at the choice occasion level. This warrants the use of a “panel” MMDCEV model. In the following presentation, the index
Consider the following additive utility functional form:
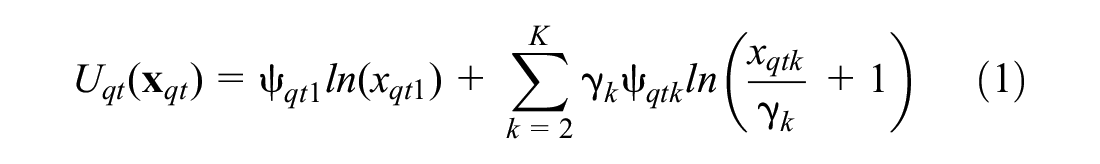
In the above utility function,

and that for other alternatives (

In the baseline parameter expression for alternative 1 in Equation 2 (i.e., outside alternative), the term
The
where
Model Estimation
The parameters to be estimated in the MMDCEV model include the
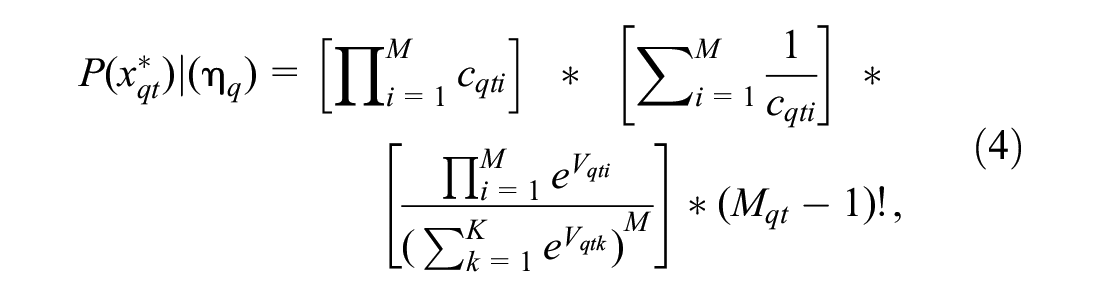
The ML inference approach is used to estimate the parameters of the MMDCEV model. To develop the likelihood function for parameter estimation, the probability of each sample individual’s set of observed time investments is needed. Conditional on
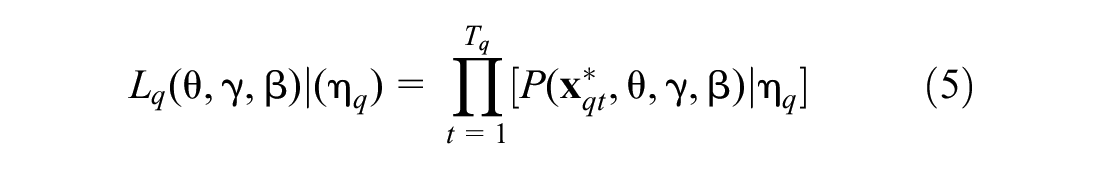
The unconditional likelihood function for individual
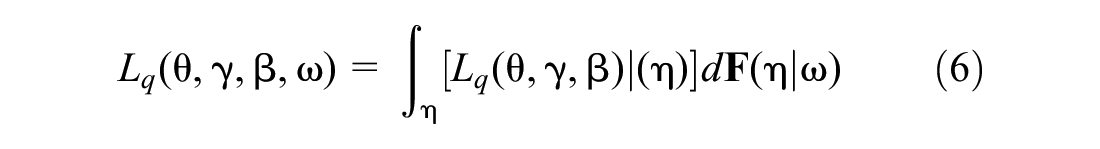
The log-likelihood function is:

where
The dimensionality of the integration in the above expression depends on the number of elements in
Data
MOBIS:COVID-19 is an extension of the MOBIS study, a large-scale mobility pricing field experiment that was carried out from September, 2019, until mid-January, 2020, in the German- and French-speaking parts of Switzerland, using a GPS tracking app to record the travel activity of participants ( 1 ).
A total of 3,690 persons completed the tracking period of 8 weeks. Of those, 3,530 completed the final MOBIS survey, complementing the tracking data with socioeconomic variables. Despite the study ending, some participants continued using the tracking app, with roughly 400 participants still using it by mid-March, 2020, and providing direct insight into the behavioral changes induced by the pandemic.
After the outbreak of COVID-19 in Switzerland, all the participants that completed the study were re-invited to reactivate the tracking app. A total of 1,600 participants re-installed the app and most of them resumed tracking. These participants make up the MOBIS:COVID-19 panel and were invited to an online survey to understand how their everyday life has changed as a result of the pandemic and how they generally assess the risk of infection.
For the model, only a subset of the entire data was used, namely employed people who have completed the final MOBIS survey and frequently tracked before and during the COVID-19 pandemic. Furthermore, only working days (Monday–Friday) were considered. This resulted in a sample of 151 individuals and 8,871 tracked days. Concerning the timing, the day was split into three time periods: peak hours (6–9 a.m. and 3–6 p.m.), off-peak hours (9 a.m.–3 p.m.) and evening/morning hours (6 p.m.–6 a.m.).
Table 1 contains, for each of four pandemic segments (as defined in Table 1), the statistics of the tracking data used. Because of the shorter time periods, there are less observations in the middle segments 2 and 3 (corresponding to the pandemic outbreak / lockdown and the post-lockdown periods; see top panel of Table 1).
Descriptive Analysis of Pandemic Segments and Activities per Time Period Within Each Segment (in Average Hours per Day)
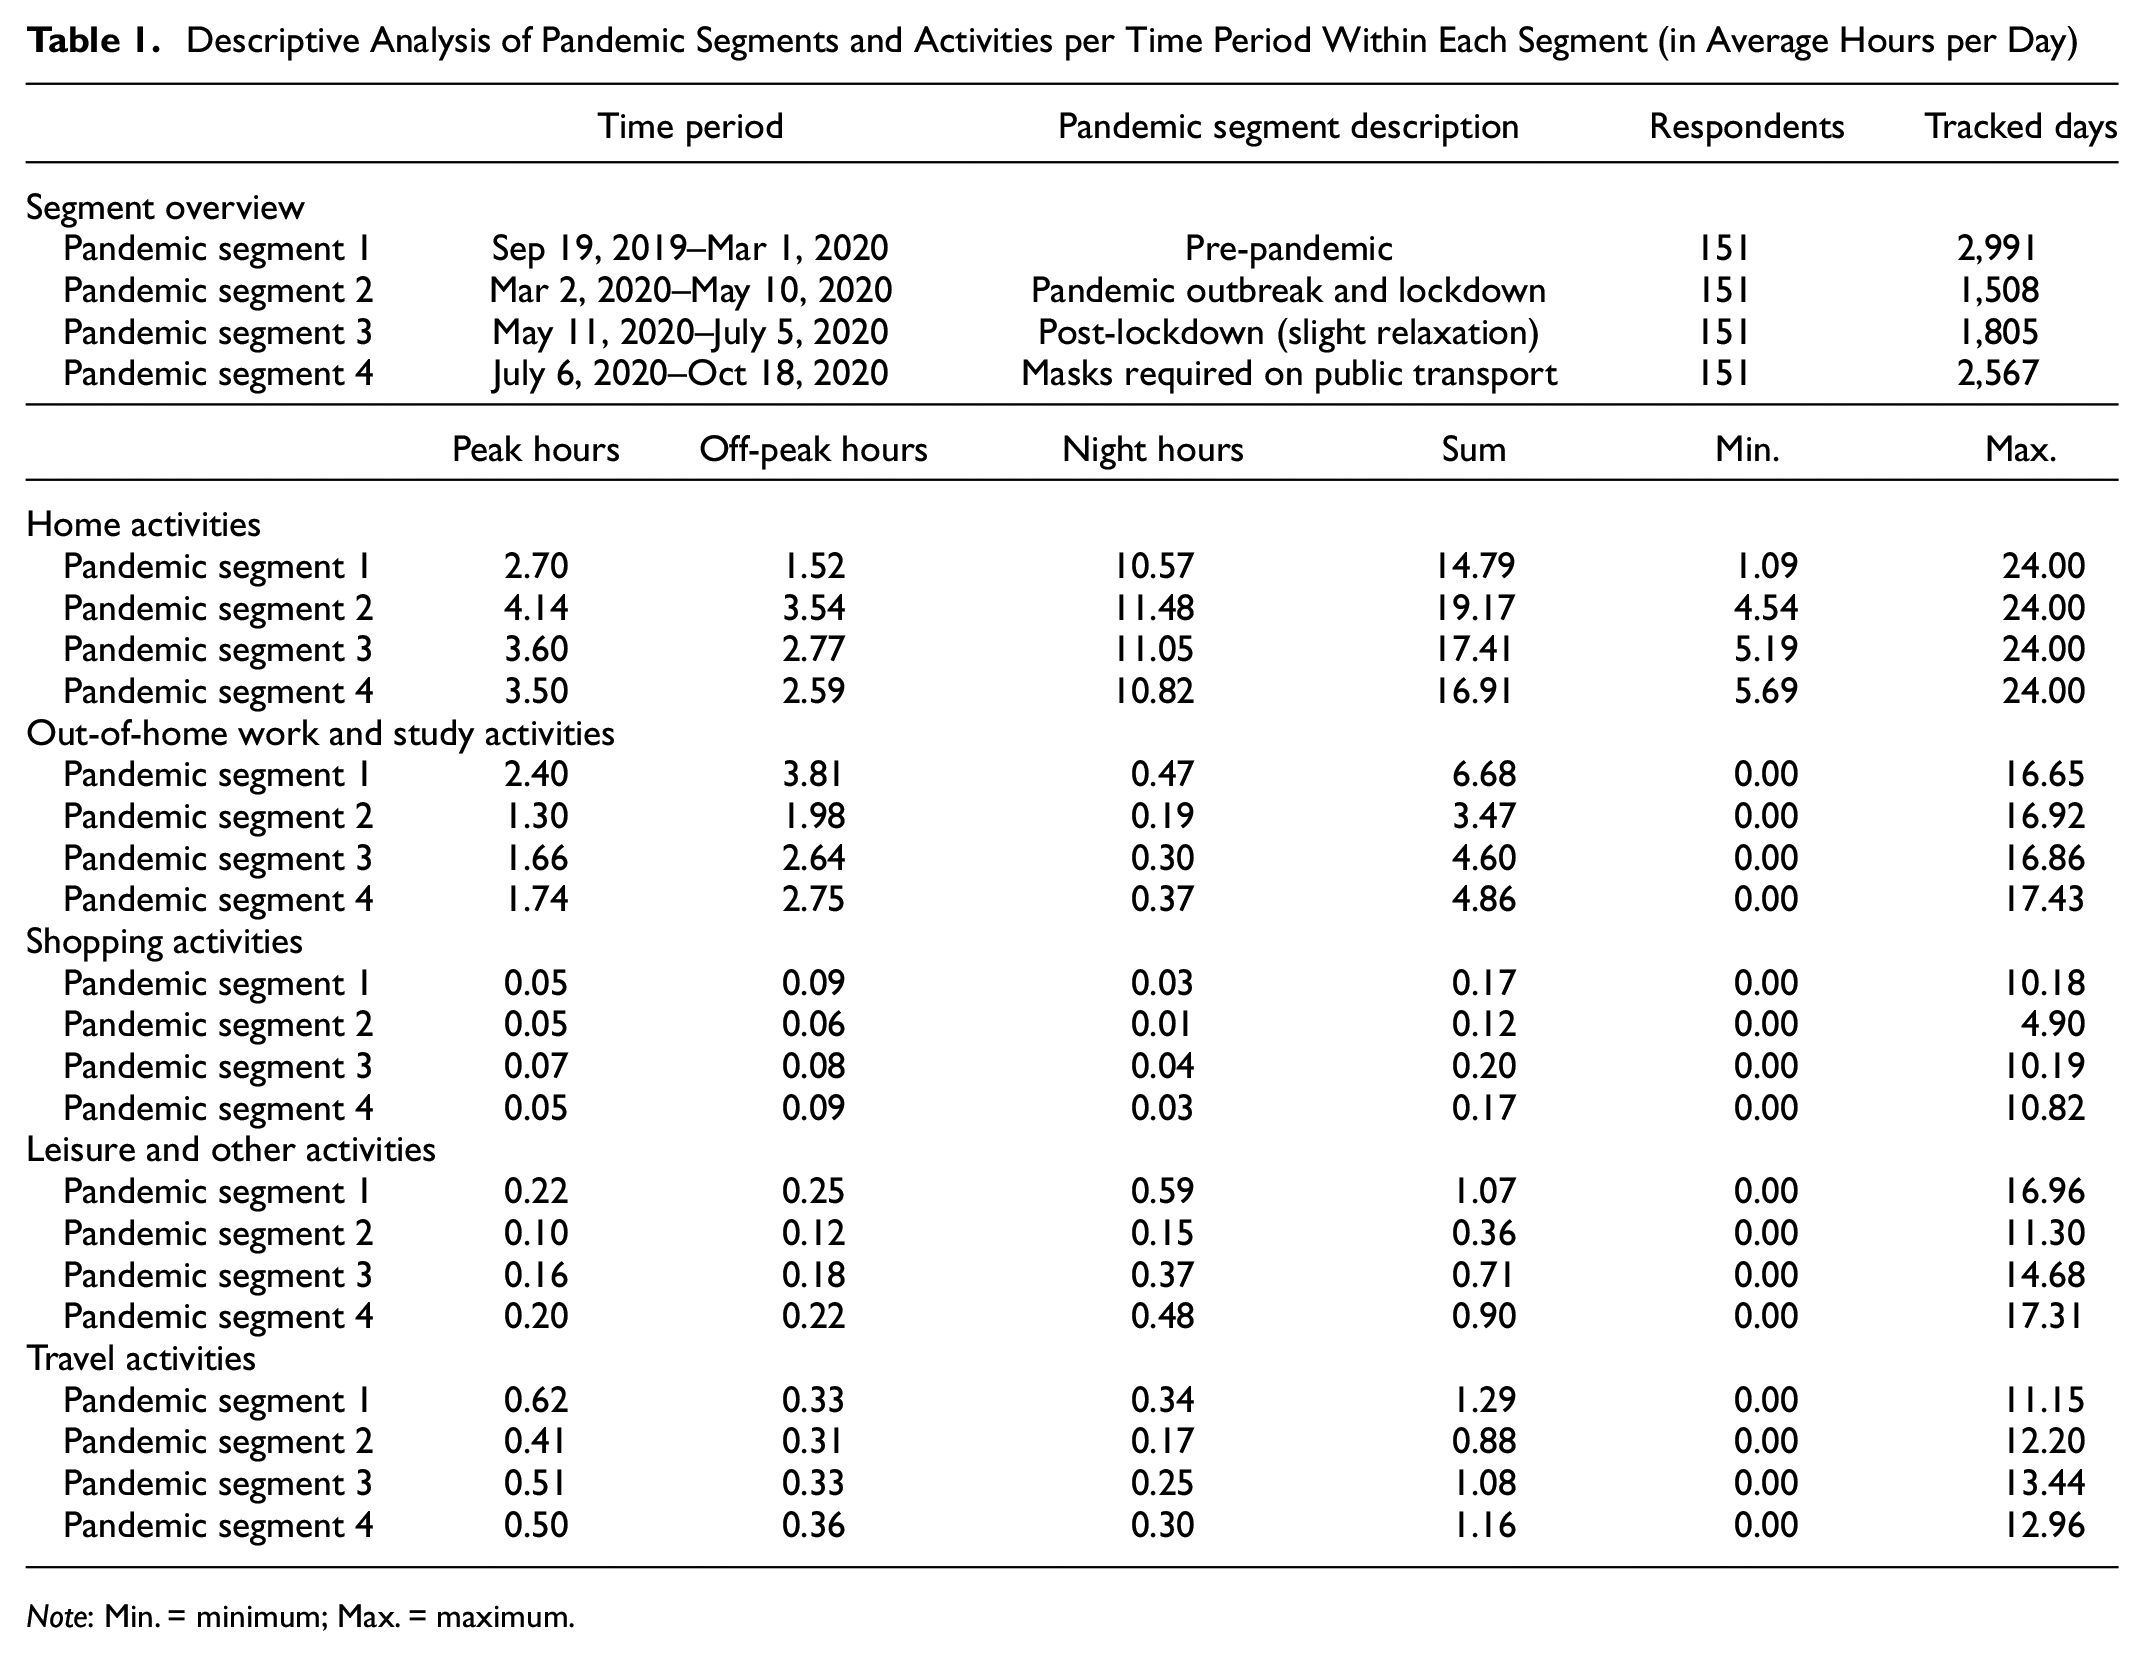
Note: Min. = minimum; Max. = maximum.
The differentiation between segments 3 and 4 (the start of segment 4 coincided with the mandate to wear masks on public transport) was made because public transport plays a large role in the Swiss transport system, especially for commuting. It is expected that there are differences in activity time use and timing behavior of the population before and after the obligation to wear a mask. In addition, the bottom panel of Table 1 presents the time use statistics in each of five different activity purposes by segment. During the lockdown (segment 2), the time spent in in-home activities increases significantly relative to the pre-pandemic period (segment 1), while the time use for all other activities decreases. With the progressive relaxation of the containment measures, this trend is reversed, and, in segment 4, approaches the initial state again. The time spent for shopping activities remains the most stable throughout the pandemic.
Table 2 shows that, while the share of men and women in the model sample is quite balanced, the vast majority of the participants is older than 40 years and has at least a secondary education. More than 50% of the people have completed higher education and a workload of 80%–100% (secondary education in Switzerland corresponds to high school, higher education to a university degree; workload refers to the percentage of work hours relative to a full-time job). The higher education levels and workload percentages are also reflected in the income distribution, where the lowest income category is strongly underrepresented. Around half of the participants live in a household of three or more people, while only 11% live alone. The sample is car- as well as public transport-affine, with more than 90% of respondents owning a car, but also 60% traveling with a half-fare discount travelcard. To put these numbers in the national context, Table 2 additionally lists the corresponding values for the Swiss subpopulation aged 18 or over according to the Mobility and Transport Microcensus (MTMC) 2015 ( 44 ).
Descriptive Analysis of Categorical Variables
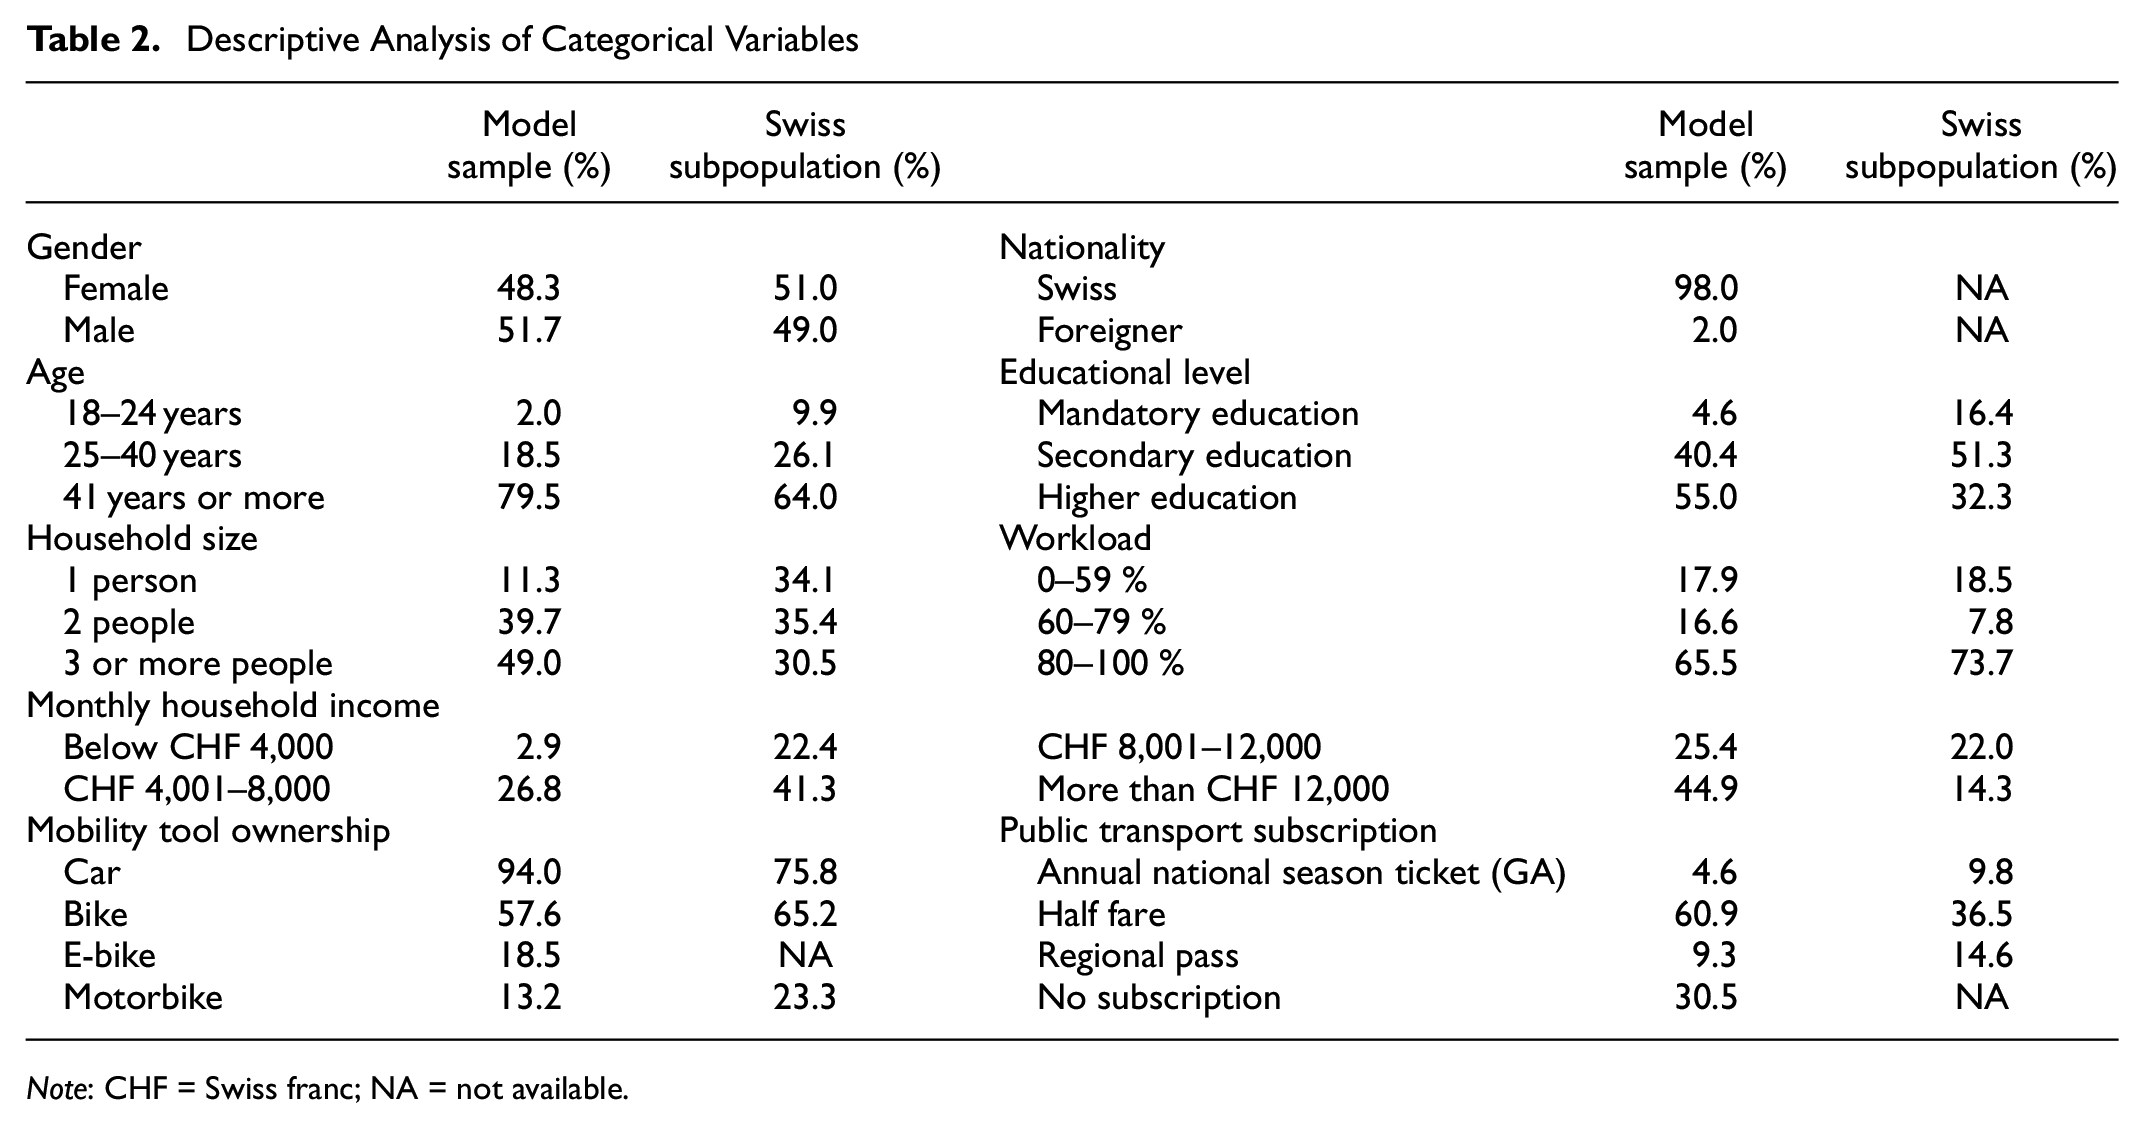
Note: CHF = Swiss franc; NA = not available.
Results
The MDCEV model estimates the parameters for each of the four pandemic segments 1 to 4 separately by using interaction terms. The estimates help to understand the impacts of different socio-demographic characteristics, household demographics, and weather elements on daily time-based activity participation and indicate the presence of any significant differential effect of these variables based on the pandemic-related segments. The error-components-based model structure of Equation 3 nests the three time periods (peak hours, off-peak hours, and night hours) for each activity purpose, but unlike nesting in a single choice model, the nesting in the multiple discrete choice model implies that unobserved factors that increase time investment during a certain time period for a given activity purpose also increase time investment during other time periods for that activity purpose. The higher the standard deviation of the error component for a given activity purpose, the higher the level of complementarity in time investment for that activity purpose.
The final log-likelihood of the model improved by roughly 2.5% compared with the initial log-likelihood of the model with alternative specific as well as segment constants (about 8,921 points). The standard deviations of the error components in the baseline preferences show that all values are statistically significant, with the exception of the estimate for the travel nest. The work nest has the highest error standard deviation value with 1.6, while the other estimates range between 0.2 and 0.7. That is, individuals who have a high intrinsic baseline inclination to work do so at all times of the day. However, travel is typically more concentrated at specific times of the day, and certainly is not much pursued during the night times. Similarly, those who have a high intrinsic preference for leisure do not necessarily partake in leisure relatively uniformly across all times of the day; rather, such leisure activities will be more focused in the off-peak hours.
The full results correspond to all the time periods in a day. However, to keep the presentation of the results tractable and to avoid clutter, the following discussion is focused on the off-peak hours, with the insights for the other time periods being briefly mentioned. The full results for the off-peak hours are presented in Table 3, while the results for the peak hours and the night hours can be found in the Supplemental Appendix in Tables A1 and A2, respectively. There are no estimates for the outside good (home activities at night) as this alternative is always consumed. The parameters for segments 2 to 4 are differential values with respect to the pre-pandemic baseline, segment 1. A negative (positive) value in the more recent segments does not necessarily imply a negative (positive) overall value. To assess this sign, the segment values have to be added to the baseline value in segment 1 first (not done in Table 3 and Supplemental Appendix Tables A1 and A2). Otherwise, only a relative evaluation compared with the baseline can be conducted, which is done in the following.
Multiple Discrete-Continuous Extreme Value (MDCEV) Estimation Results for Activities in Off-Peak Hours
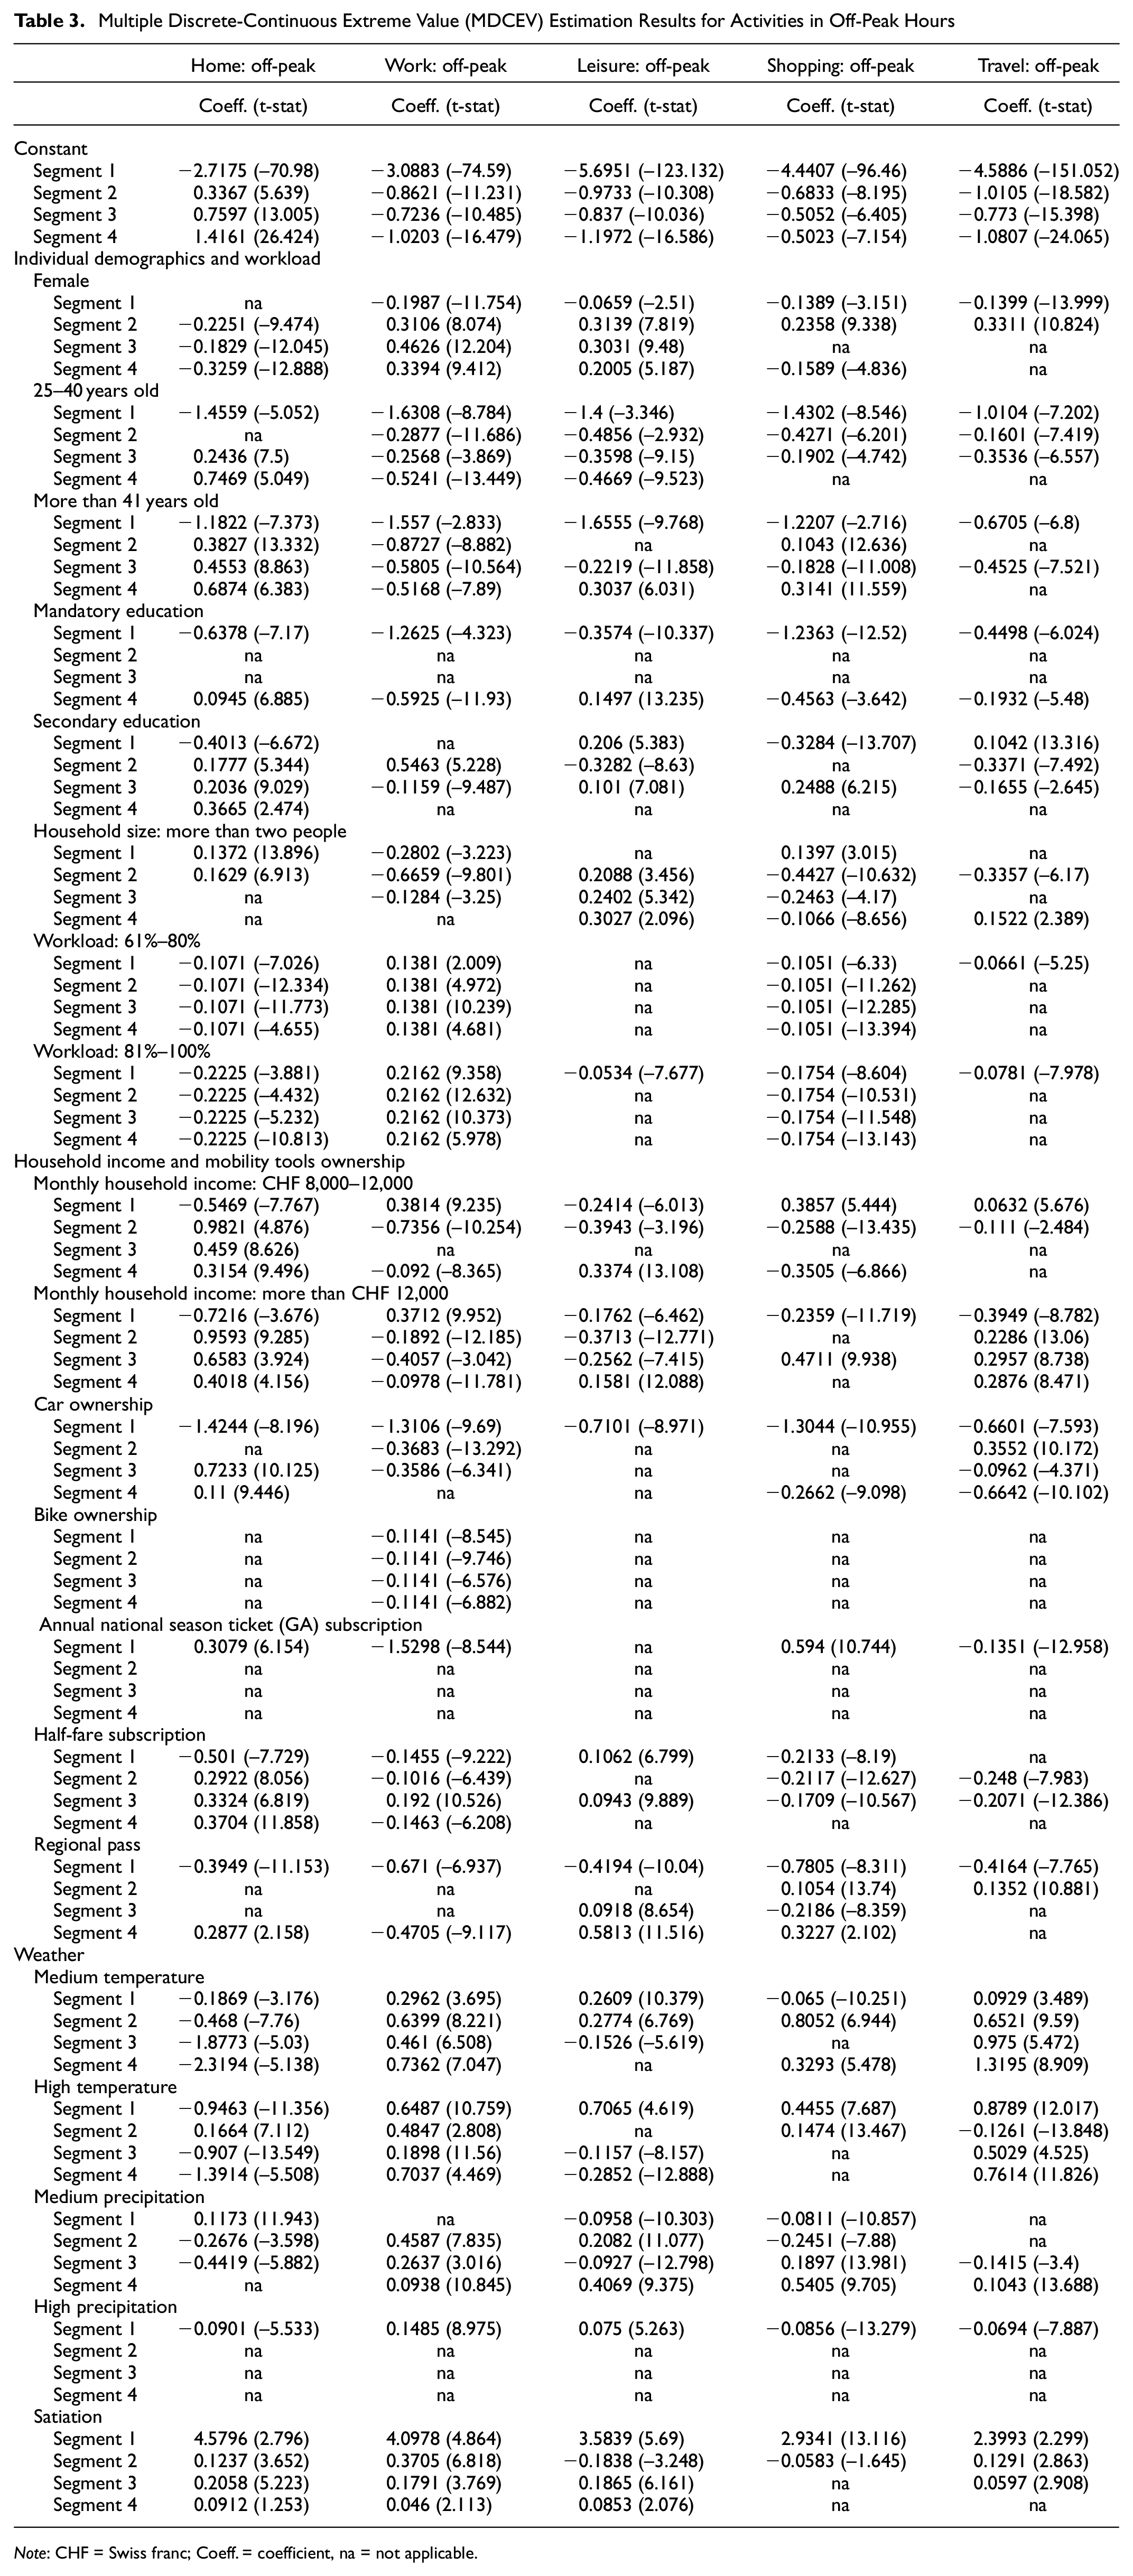
Note: CHF = Swiss franc; Coeff. = coefficient, na = not applicable.
Behavioral Patterns Before the Covid-19 Pandemic (Segment 1)
The pre-pandemic baseline illustrates that women and older people have a lower propensity to choose activities throughout the day. While for women this difference is rather uniform across activities, it is less pronounced for older individuals traveling. The signs for leisure and shopping coincide with findings of previous studies, while the results for work are contrary to these findings where men tend to work less (33, 39, 40 ). However, as a lower propensity to choose an activity does not imply anything about the duration, it might be that women pick fewer activities, but the overall activity durations are much longer. Education level has varying effects on activity participation by purpose. While people with secondary education show a higher propensity of performing leisure and travel activities, a higher education implies more time spent at home, working, and shopping. Larger households appear to spend more time at home and shopping during off-peak hours, consistent with results from previous studies (28, 29). As expected, employees with higher workloads spend more time at work (and consequently also commute at night and during peak hours) and less time at home or shopping. This is in line with findings from Castro et al. ( 33 ).
People with higher income do also work more, but—as opposed to people with higher workloads—do not appear to garner as much utility from leisure activities. Especially the medium income group consistently prefers shopping. However, there is no overall trend to more out-of-home activities for high-income people, as observed in Bhat ( 4 ). Bike ownership has a minimal (negative) impact on work activities. Car owners, on the other hand, uniformly participate in fewer activities. This latter result is in contrast with findings of Pinjari and Bhat, but their analysis has been undertaken in San Francisco, an area with a very different urban setting than the one present in Switzerland ( 29 ). A similar pattern as for cars is noticeable for owners of public transport subscriptions. However, owners of an annual national season ticket (GA) have a higher propensity to shop and be at home during off-peak hours, while travelers with a half-fare subscription are more likely to participate in leisure activities.
The signs for the temperature variables match intuitive expectations. Higher temperatures facilitate participation in out-of-home activities (excluding shopping). Precipitation levels, however, only have a small impact. The satiation estimates indicate that the longest activity durations occur in home and work activities during off-peak hours and leisure at night, while shopping and traveling consistently have the lowest values. Overall, these results are in line with findings of Anggraini et al., who stated that various sociodemographic variables influence decisions on time use and timing behavior ( 41 ). This is reflected here, as different variables affect the individual activity purposes differently.
Behavioral Patterns During the COVID-19 Pandemic (Segments 2–4)
The estimation results for pandemic segments 2 to 4 show that women not only spend more time working and subsequently traveling (throughout all time periods), but also participate in more leisure activities in peak and off-peak hours than during the baseline period. Older people tend to spend more time at home, which generally leads to a decrease in the participation rates for other activities. People older than 41 years perform more shopping activities in segments 2 and 4 as well as more leisure activities in segment 4. Lower education levels have ambiguous impacts across the pandemic segments. Overall, it appears that a secondary education boosted activity participation during the pandemic, mainly for work and shopping. It can also be seen that people with higher workloads worked more during the pandemic than before while participating in fewer home and shopping activities. The workload variables show no difference between segments 2 to 4.
During the pandemic, higher income households showed a lower propensity to work during off-peak hours. In segment 4, however, they were more likely to participate in leisure activities. The richest group was also shopping more often in segment 3 and traveled significantly more throughout the pandemic. Car ownership led to more home and less work activities, while owning a bike further reduced the likelihood of working. In pandemic segment 3, a public transport subscription increased the likelihood of participating in work and leisure activities. While this changed in segment 4 for work activities, the estimates for the regional pass indicate that the mask obligation did not negatively affect the propensity to participate in leisure and shopping activities.
The sign of the temperature variables generally remains the same. However, the containment measures in place during the pandemic further amplify some of the impacts on time use, while they attenuate others (e.g., very high temperatures led to fewer leisure activities). While it is not surprising that the satiation parameters for leisure and shopping decrease in segment 2 before recovering again, it is interesting that the satiation for the travel activities is higher during the pandemic. This indicates that the average travel time is longer than in the pre-pandemic period.
Conclusion
Many studies have investigated how people divide their time across activities throughout the day. However, little is known about the timing behavior, that is, when exactly these activities are scheduled, and the impact of external factors such as a pandemic on these behavioral patterns. Based on tracking data from Switzerland, this paper provides insights on the drivers of activity scheduling for employed people and the consequences of a pandemic on these schedules.
The results of the MDCEV model reveal that the phases of the pandemic are reflected by the activity patterns. In addition, it can be seen that the main influences vary across pandemic phases, activity purposes, and time of day.
Compared with their activity participation rates before the pandemic, women performed more activities during the pandemic, while higher income individuals spent more time at home, and older individuals showed a higher propensity to shop during peak hours. Education level also has a distinct impact on activity participation and time use. Further, the results show the effect of the mask obligation on public transport in pandemic segment 4 and the relevance of the temperature on activity choice. Overall, the total number of trips decreased during the pandemic, but the duration of these trips tended to increase. Surprisingly, the likelihood of participating in travel activities did not uniformly decrease during the pandemic. Especially people with higher workloads showed a higher propensity to travel.
These results provide first insights into the drivers for activity scheduling for employed people. The apparent impact of the different phases of the pandemic on the behavioral patterns underlines the relevance of the analysis. The heterogeneity in influential socioeconomic variables also reflects the inequality among the population (in relation to the activity-travel repercussions of the policy measures) based on profession as well as risk of infection because of the pre-existing health status. In that respect, the findings can be used to improve policies related to both time use (e.g., to manage a crisis or find the best way out of it) as well as transport planning. At the same time, the identified trends provide a first indication of what the “new normal” may look like and what the field of transportation has to prepare for to stay up to date with the continual changes in society. In a further step, it is possible to use the collected data to refine the model, expand it to unemployed people, and apply the model results to forecast procedures to predict behavioral changes based on external factors and therefore analyze the reaction of the population to various policy measures.
Supplemental Material
sj-pdf-1-trr-10.1177_03611981221087233 – Supplemental material for Impact of the COVID-19 Pandemic on Activity Time Use and Timing Behavior in Switzerland
Supplemental material, sj-pdf-1-trr-10.1177_03611981221087233 for Impact of the COVID-19 Pandemic on Activity Time Use and Timing Behavior in Switzerland by Raphael Mesaric, Aupal Mondal, Katie Asmussen, Joseph Molloy, Chandra R. Bhat and Kay W. Axhausen in Transportation Research Record
Footnotes
Acknowledgements
The authors would like to thank the three anonymous reviewers that took their time to give quality feedback.
Author Contributions
The authors confirm contribution to the paper as follows: study conception and design: R. Mesaric, A. Mondal, K. Asmussen, J. Molloy, C. Bhat, K. Axhausen; data collection: R. Mesaric, J. Molloy; analysis and interpretation of results: R. Mesaric, A. Mondal, K. Asmussen, J. Molloy, C. Bhat, K. Axhausen; draft manuscript preparation: R. Mesaric, A. Mondal. All authors reviewed the results and approved the final version of the manuscript.
Declaration of Conflicting Interests
The author(s) declared no potential conflicts of interest with respect to the research, authorship, and/or publication of this article.
Funding
The author(s) disclosed receipt of the following financial support for the research, authorship, and/or publication of this article: Funding for this work was provided by the Swiss National Science Foundation NRP 78 Covid-19 2020 (4078P0_198428 / 1).
Supplemental Material
Supplemental material for this article is available online.
References
Supplementary Material
Please find the following supplemental material available below.
For Open Access articles published under a Creative Commons License, all supplemental material carries the same license as the article it is associated with.
For non-Open Access articles published, all supplemental material carries a non-exclusive license, and permission requests for re-use of supplemental material or any part of supplemental material shall be sent directly to the copyright owner as specified in the copyright notice associated with the article.